Brazilian Reference Percentiles for Bioimpedance Phase Angle of Healthy Individuals
 Rita Mattiello
 Eduardo Mundstock
 Patrícia Klarmann Ziegelmann1
- 1Programa de Pós-graduação em Epidemiologia, Universidade Federal do Rio Grande do Sul, UFRGS, Porto Alegre, Brazil
- 2Pontifícia Universidade Católica do Rio Grande do Sul, PUCRS, Porto Alegre, Brazil
- 3Secretaria da Educação, Esporte e Lazer de Canela, Canela, Brazil
Objectives: The present study was designed to estimate phase angle percentile curves for a broad age range of healthy individuals.
Methods: This is a cross-sectional study of healthy Brazilian individuals aged five to 80. InBodyS10 was used to assess phase angle. Reference curves were stratified by sex and estimated using Generalized additive models for location, scale, and shape as a continuous function of age. The phase angle determinants analyzed were physical activity, age, BMI, and SES variables.
Results: Data were analyzed from 2,146 individuals, 1,189 (55.2%) of whom were female. In both sexes, the phase angles showed a similar pattern (an increasing trend from childhood to the teenage phase, followed by stabilization during adult ages and a decrease in old adults). In female, the relationship between phase angle and age were associated with BMI and family income. In the male, the relationship between phase angle and age were associated with skin color and family income.
Conclusions: To the best of our knowledge, it is the first attempt to apply the GAMLSS technique to estimate phase angle percentiles in a healthy population covering most of the life cycle. We also showed that there are different phase angle determinants according to sex.
Introduction
Phase angle (PA) from bioimpedance is measured by the potential difference of a low voltage alternating electric current introduced into the body. It is dependent on the resistive behavior and the capacitive effect on the cell membrane and other interfaces (1). PA has been proposed to indicate cellular health, where higher values reflect higher cellularity, cell membrane integrity, and better cell function (1). For this reason, it has been used as a health status tool and an important predictor of disease severity and survival in different medical conditions (2–6). However, the cut-offs used in the literature are not necessarily transferable to other populations and might thus not be applicable in the general clinical setting. This is because the cut-offs are generated primarily using the median or lowest quantile from a specific population without considering the determinants of phase angle. Phase angle reference values are still scarce, especially PA percentile curves (2).
According to one recent meta-analysis involving more than 250,000 healthy subjects, age, sex, and BMI seem to be main independent determinants of phase angle (7). Another meta-analysis showed that physical activity also influences PA values, especially in individuals with chronic diseases, indicating that it should be considered as an associated variable (8).
Therefore, the present study was designed to estimate phase angle percentile curves for a broad age range of healthy individuals stratified by sex and understand the relationship between phase angle and physical activity, age, BMI, skin color, and family income.
Materials and Methods
Study Design
This was a cross-sectional study that followed the STROBE statement guidelines for reporting observational studies (9).
Setting and Participants
Healthy community-dwelling individuals aged five to 80 years old, of both sexes, were invited to participate in the study. The exclusion criteria were contraindications against bioimpedance measurements, such as diseases affecting the skin’s electrical resistance, pregnancy, persons with an implanted pacemaker or cardioverter-defibrillator, and amputated persons using a prosthesis/orthosis. Participants were considered healthy if they had not been diagnosed with any chronic disease or were not on continuous medication. Data were collected from December 2015 to April 2019 in public and private schools, companies, and at events in cities in southern Brazil. Recruitment occurred through word of mouth.
Data Measurements
Sociodemographic variables were obtained through structured interviews. These included age (years), sex (male or female), self-reported skin color (categorized into white, black, or others—brown, Asian, and indigenous were grouped together to homogenize the size of the categories), and location of residence (rural or urban), defined according to the IBGE Brazilian demographic census (10). Income was categorized into low and high (according to whether the families earned more or less than the median income, calculated separately for the samples of men and women).
To assess the level of physical activity, the participants answered different validated questionnaires, according to their age. The children up to 10 years of age answered the Physical Activity Checklist (11), and participants over 10 years of age answered the short version of the International Questionnaire on Physical Activity (IPAQ) (12, 13). After that, the participants were classified as active or inactive according to their physical activity level. The cut-off points to be considered active was 300 min of moderate to vigorous physical activity (MVPA) per week for children and adolescents. For the adults (18 years and older), it was 150 min of MVPA, or 75 min of vigorous physical activity (VPA) per week. These cut-off points are the same ones suggested by the World Health Organization (14).
Body mass was measured with the participants in a standing position, wearing the least possible amount of clothing and no shoes, using a calibrated digital scale (Charder MS6121). Height was measured with the participants standing barefoot with their feet parallel and heels together, arms along their body, and head in the Frankfurt plane, using a Sanny compact stadiometer and a tape measure to the nearest 0.1 cm (American Medical do Brazil Ltda, São Bernardo do Campo, Brazil). Body mass index was classified as underweight, normal weight, pre-obesity, and obesity according to the WHO BMI classification for children, adults, and the elderly (15).
Bioimpedance Multi-frequency InBodyS10 (Ottoboni, Rio de Janeiro, RJ, Brazil) was used to assess phase angle. The InBodyS10 showed excellent agreements with DEXA regarding to whole body lean mass, fat mass and percentage body fat (16). The applied current was 100 μA (1 kHz) and 500 μA and frequency was 50 kHz. The hand electrodes were attached to each thumb and middle finger, while the foot electrodes were positioned between the ankle bone and the heel, covering as much area as possible. The BIA was performed with the participants on a non-conductive surface in the standing position, with their legs apart and arms held away from their body and wearing the least amount of clothing possible and no metal jewelry. The standard guidelines were followed to instruct regarding fasting state of the subjects before the BIA (17). All measurements were performed by one of the four experienced researchers according to the manufacturer’s instructions using a standardized technique. All the participants completed three evaluations, and the average of the three values was considered as their result.
Statistical Analysis
The data were expressed as mean (SD) or median and interquartile range (IQR, 25th–75th percentiles) for the continuous variables and absolute and relative frequencies for the categorical variables.
Generalized additive models for location, scale, and shape (GAMLSS) were used to estimate age-related phase angles and determine phase angle predictors. These models are more flexible than linear or generalized linear models. They let the data determine the relationship between the predictor and the covariables rather than enforcing a linear (or polynomial) relationship. It is also possible to use smoothing techniques and allow the covariables to model variability and shape besides the median values (18, 19).
First, the LMS R function was used to estimate the power value, possible transformation of age and select the distribution family (among BCCGo, BCPEo, and BCT families). To identify the models’ optimum number of effective degrees of freedom (edf), the automated “pb” function was implemented. Models were also tested with and without age transformation, different degrees of freedom, and cubic smoothing. The models were compared using GAIC (generalized Akaike information criterion) (19, 20).
GAMLSS models were also used to explore phase angle determinants. Physical activity, BMI, skin color, and family income were analyzed one by one in a bivariable model with age to test any possible interaction between age and the covariables. The covariables and interactions, significant at 5%, were maintained in the multivariable model.
All analyses were performed using the R software, version 3.2.3, with the “gamlss” package, version 5.1-5 (21).
The present study was part of an umbrella project and was conducted according to the Declaration of Helsinki (22). This project received the approval of the Research Ethics Committee of the Pontifical Catholic University of Rio Grande do Sul (permission 2.187.802). For adult participants, the Informed Consent Term (ICT) was signed. In the case of underage participants, the consent term was obtained, and ICT signature was acquired from their parents or guardians.
Results
A total of 2,122 participants aged five up to 80 years old were evaluated. The majority were females (n = 1,171, 55.2%); were aged between five and 12 years (n = 901, 42.4%); were underweight/normal weight (n = 979, 46.1%); self-declared their skin color as white (n = 724, 44.9%); were living in an urban area (n = 1,304, 61.5%); were inactive according to their physical activity level (n = 1,078, 67.4%); and were classified as low income (n = 846, 53.2%) (Table 1).
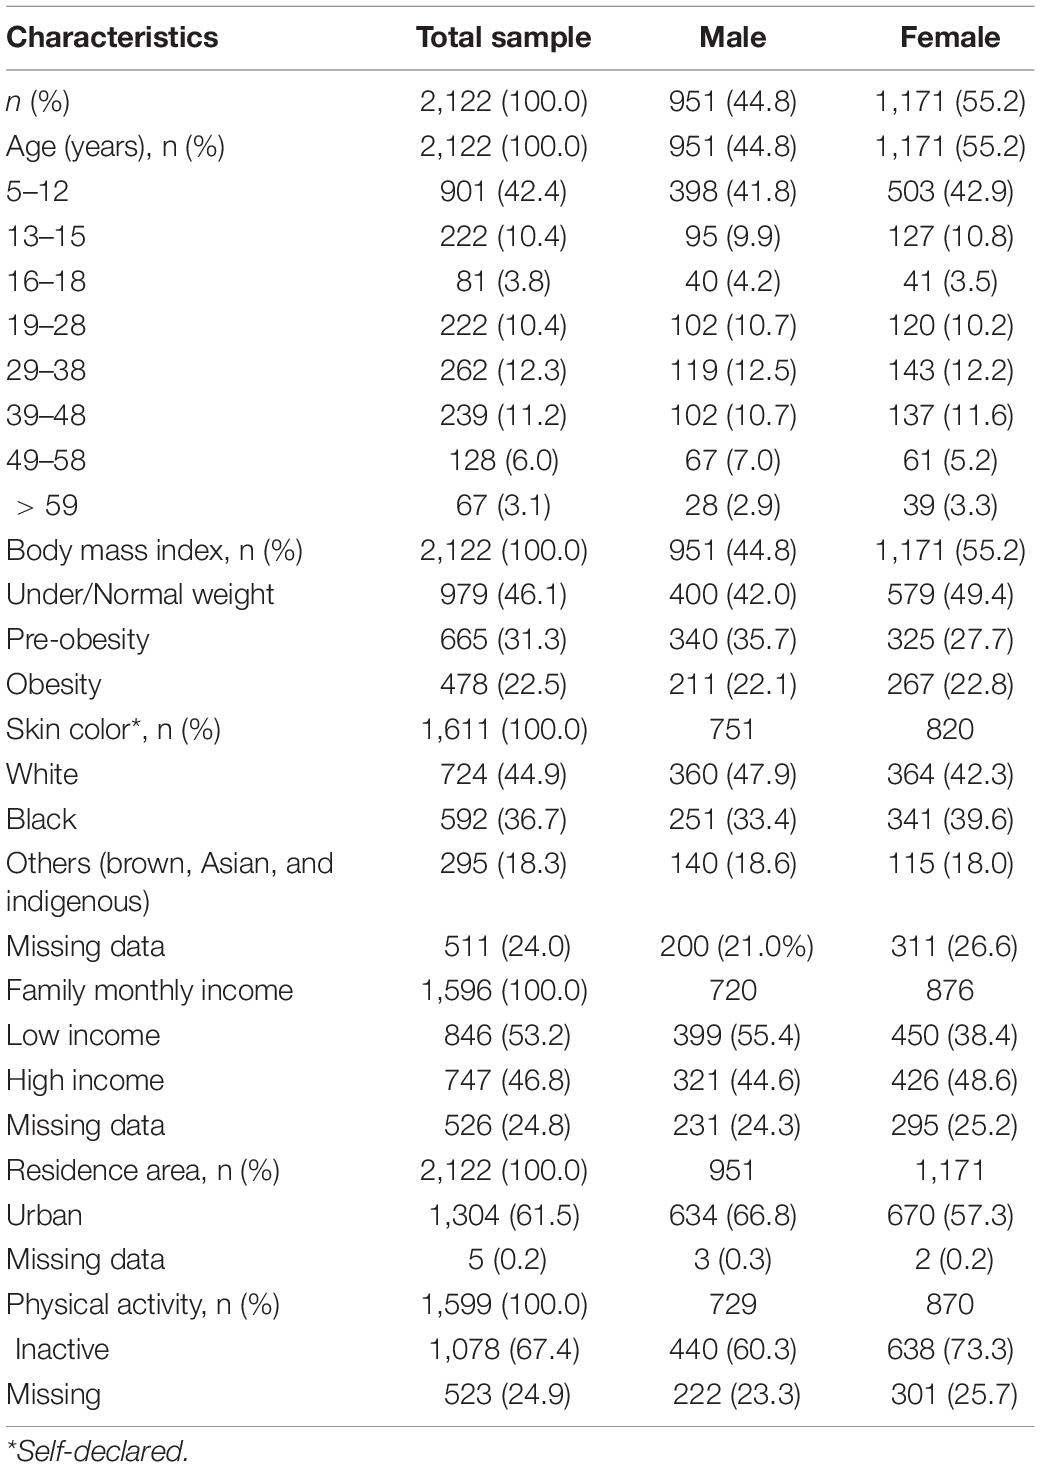
Table 1. Characteristics of participants.
Phase Angle Centile Estimation
Women: The final age-related model for centile estimation was adjusted using the Box-Cox Cole and Green orig family distribution (BCCGo); there was no age transformation; mu = 10, sigma = 4, and nu = 4, and these were all associated with age.
Men: The final age-related model for centile estimation was adjusted using the Box-Cox Power Exponential orig family distribution (BCPE); there was no age transformation; mu = 13, sigma = 4, nu = 4, tau = 2, and these were all associated with age.
The estimated phase angle percentiles showed for both sexes that the values increase through childhood, stabilize during most of adulthood, and decrease through late adulthood (Figure 1). The estimated percentiles and z-scores are shown in Table 2 for men and in Table 3 for women.
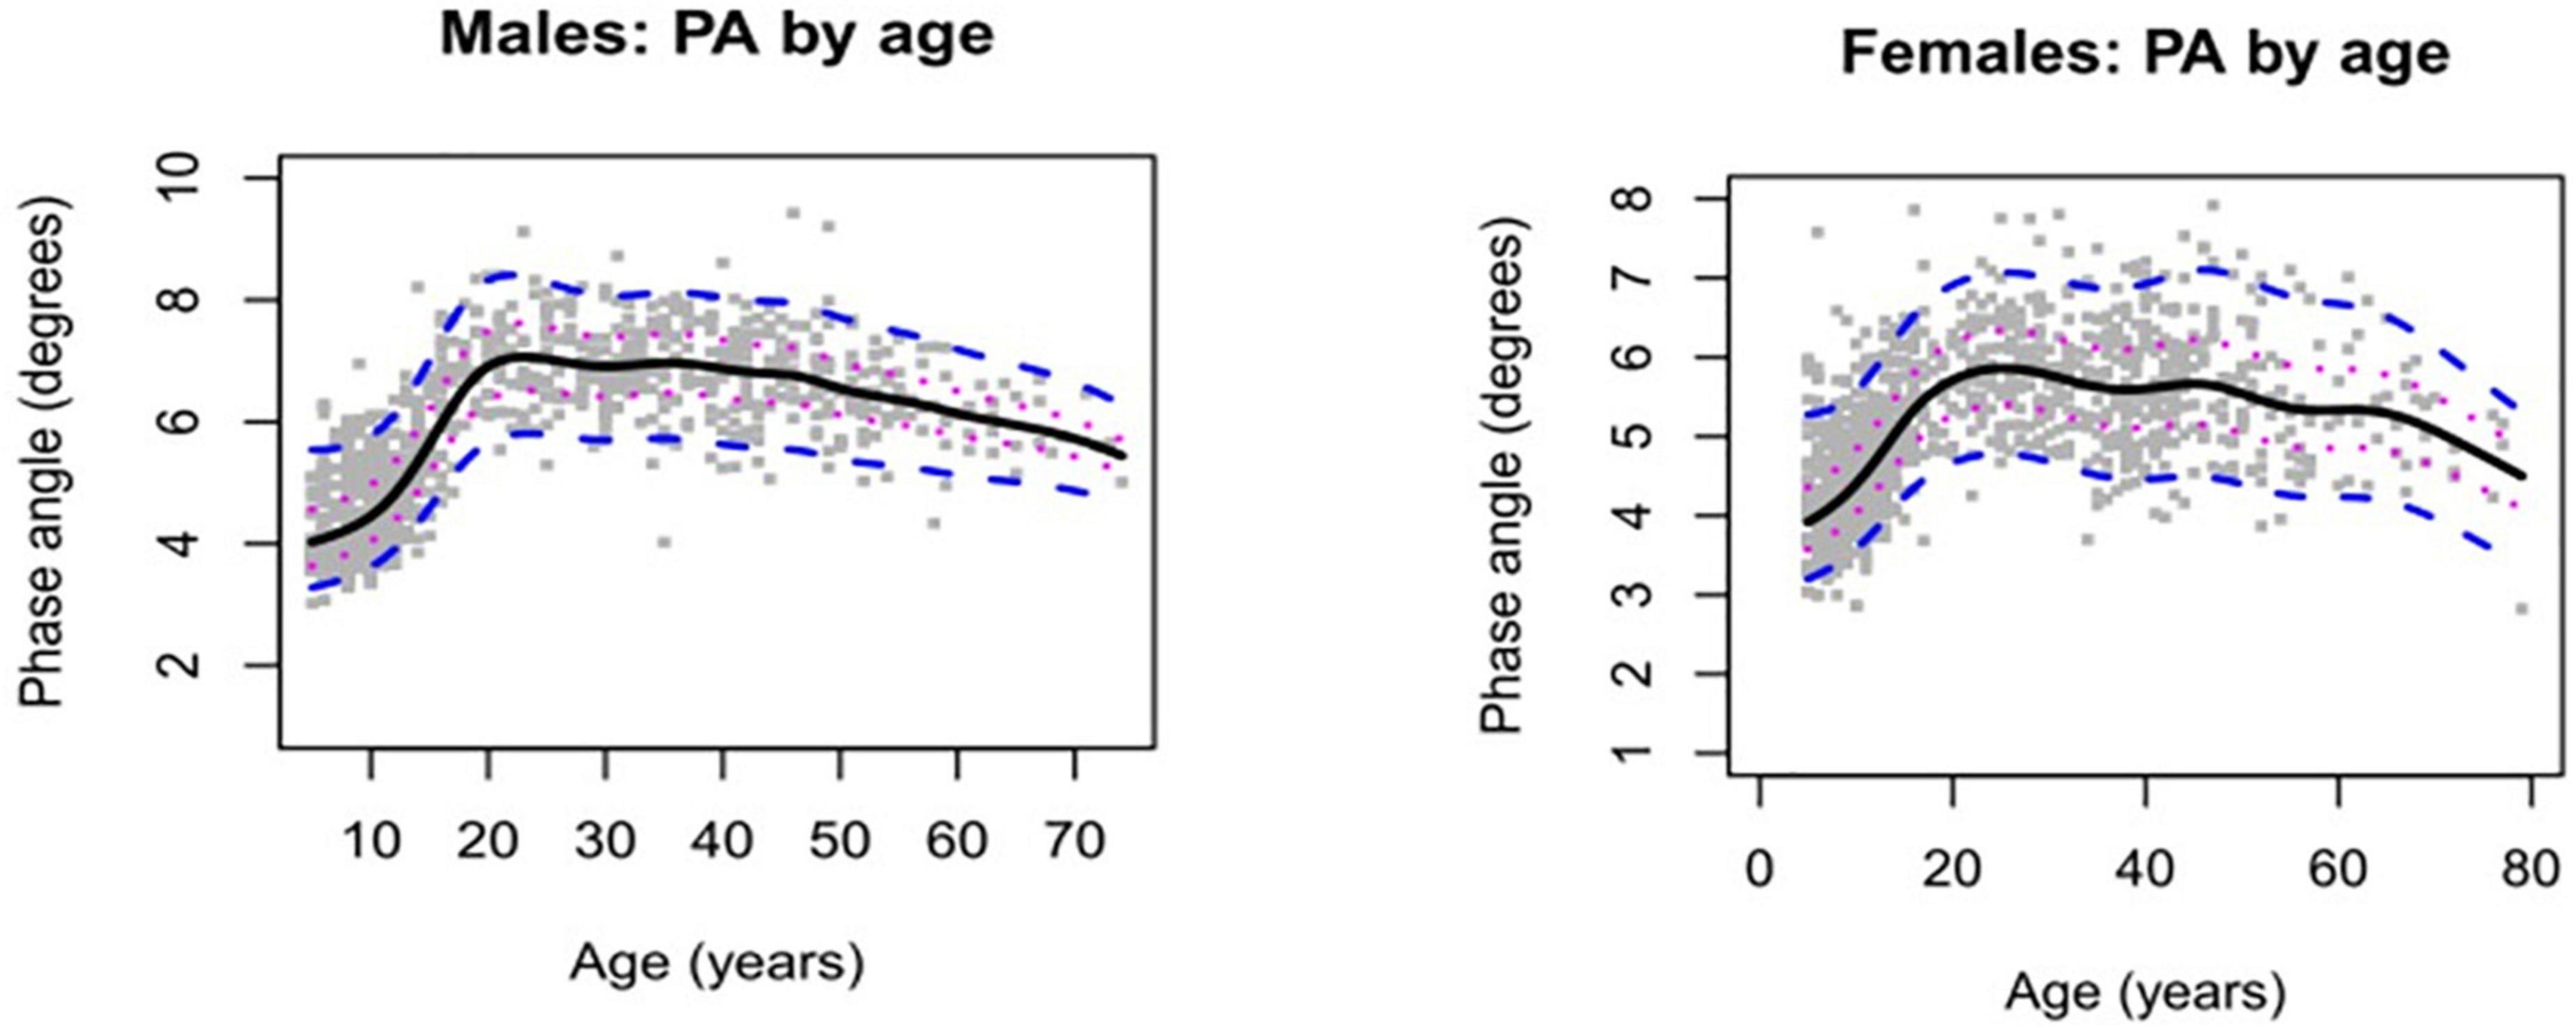
Figure 1. Phase angle by age in healthy males’ and female’s individuals. Solid lines represent median estimates together with 25th and 75th centiles (dotted lines) and 5th and 95th centiles (dashed lines).
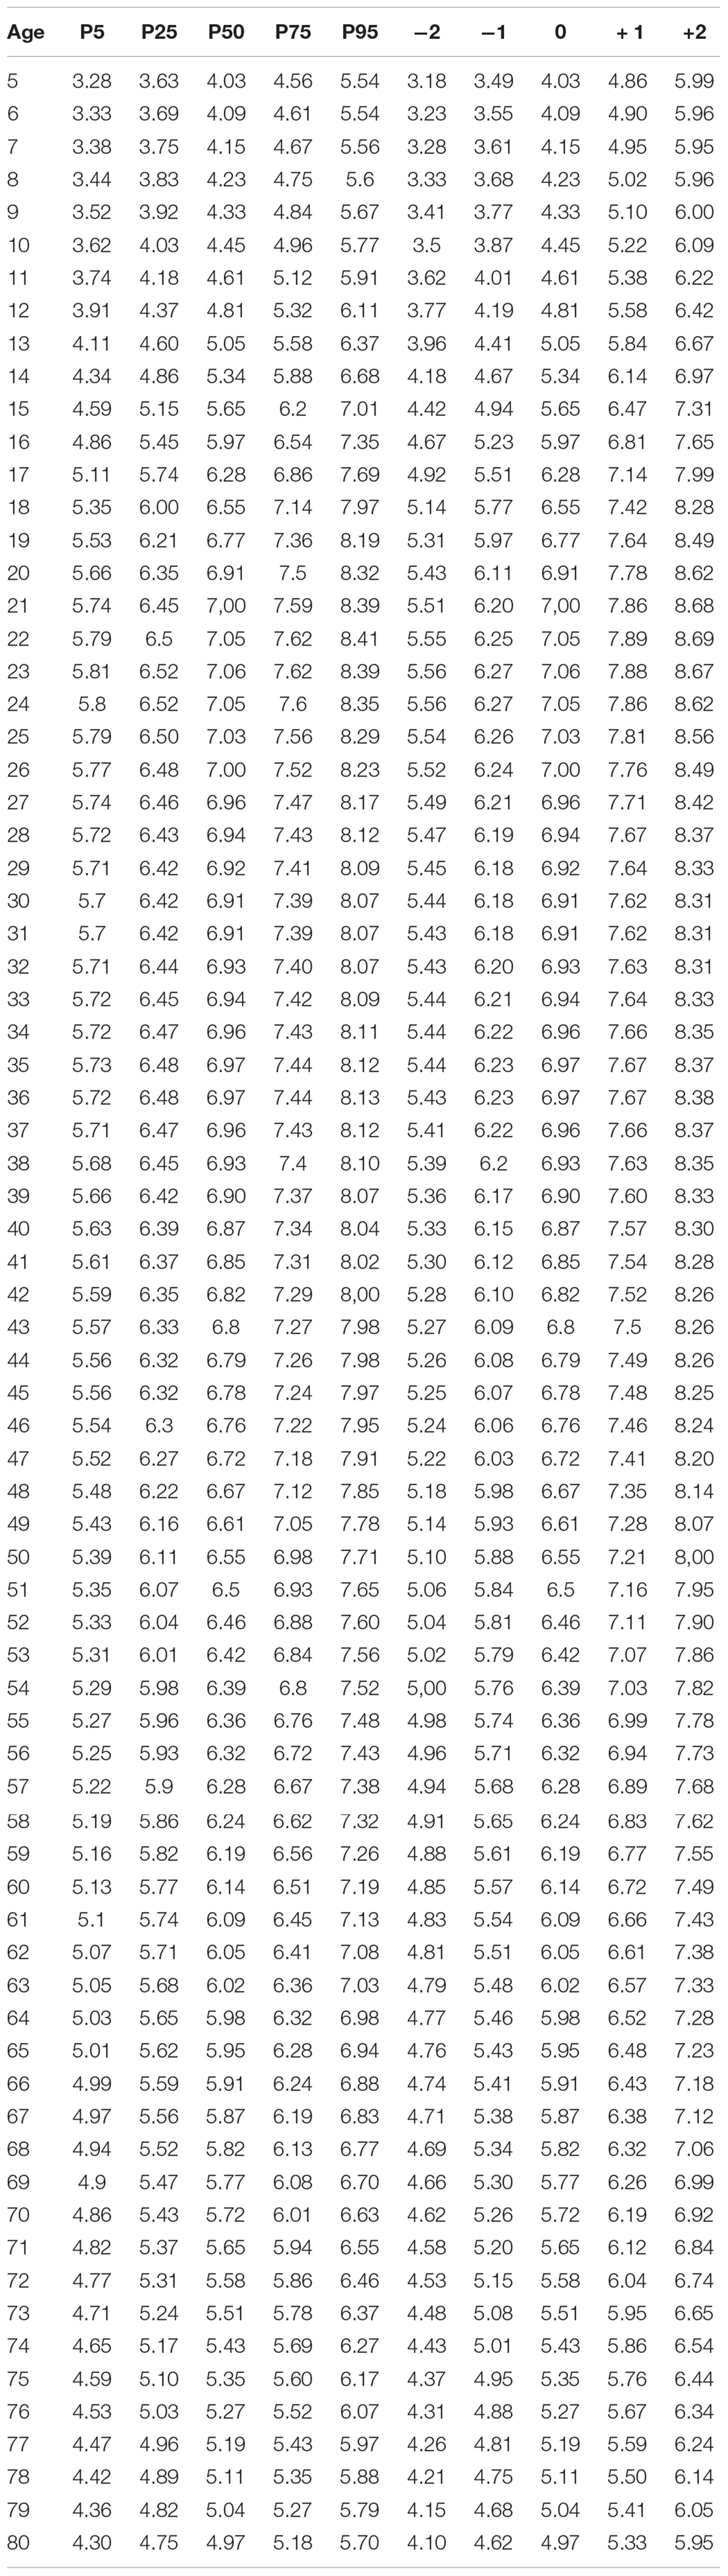
Table 2. Men’s phase angle percentiles and z-score.
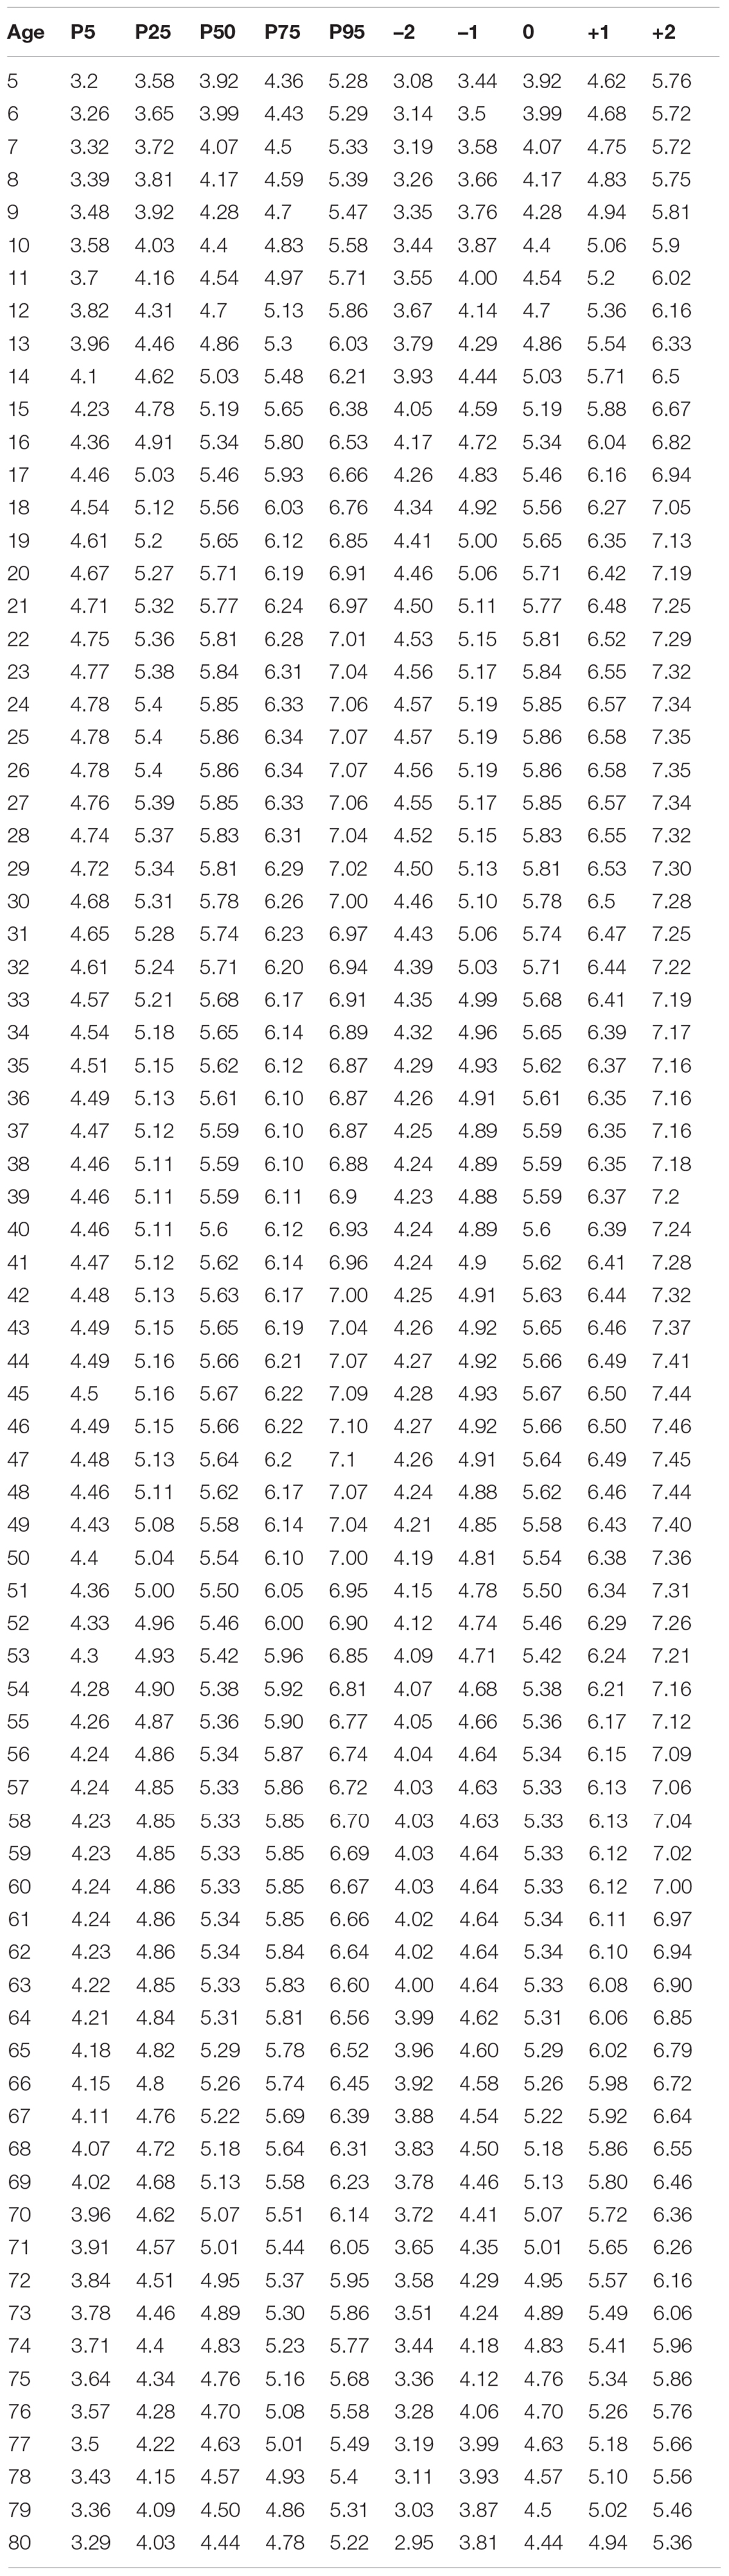
Table 3. Women’s phase angle means estimates and z-score.
Phase Angle Determinants
Female: In the final multivariable model, the relationship between phase angle and age was associated with BMI and family income (with a significant interaction) (Supplementary Table 1).
Male: In the final multivariable model, the relationship between phase angle and age was associated with BMI and skin color (with a significant interaction) (Supplementary Table 1).
Discussion
This study used a large sample of healthy Brazilian individuals aged five to 80 years old to estimate phase angle, as measured by BIA. The models used allowed us to estimate smooth percentile curves as well as z-scores stratified by age and sex.
The estimated phase angle percentiles showed that the values increase through childhood, stabilize during most of adulthood, and decrease through late adulthood, which is consistent with the previously published meta-analysis (7). These findings reflect the physiological changes that occur throughout life. Considering that phase angle is an indicator of cell function and health, these findings reflect the different intracellular and functionality mechanisms involved in the cell membrane, which improve up to adult age but deteriorate during the late stages of life (7, 23).
We also found different phase angle determinants depending on sex. In both sexes, phase angle is associated with age and BMI. Previously study also showed that phase angle changes with sex and age and is associated with BMI (24). Its dependence on body composition is complex, being determined by BMI, %FM, and their interaction. However, in women there is an additional association with family income, with an age interaction; while in men there is an additional association with skin color, also with an age interaction. The comparison with the reference values already available was limited, since the statistical models, age groups and determinants were not differentiated between the studies (7, 24).
The causes of the differences observed between the sexes may include health status, cultural patterns, and biological and hormonal differences between men and women. As national economies progress, individuals with increased socioeconomic status may start taking a greater interest in their health, whereas people with a lower socioeconomic status may continue to struggle for calories. In this sense, the differences found between the determinants of phase angle in the different sexes may reflect the health inequalities still found between sexes and races (25–27).
Previous studies have shown an association between the level of physical activity and phase angle; however, we did not find this association (8). One possible explanation for our different results could be that most studies have included individuals diagnosed with a disease and they have not presented phase angle percentiles adjusted for sex and age.
This study is not free of limitations. A temporal relationship could not be defined due to the study’s cross-sectional design. This article included a convenience sample of participants from only one (South) of the five regions of Brazil. However, when the study data are compared with the latest national health surveys (28, 29), we observe that these are similar in the distribution of sex, skin color, BMI, and level of physical activity. Our study included a greater number of younger and fewer elderly individuals than the percentages in these age groups of the Brazilian population. The primary justification for including more young participants is that the data presented in this paper are part of an umbrella project with other objectives. There is a scarcity of studies that present phase angle values that include the elderly. One of the main limitations of including participants in this age group is that most have a chronic disease diagnosis. Despite the differences in the distribution of age groups, the uncertainties related to these data were expressed in confidence intervals.
To the best of our knowledge, it is the first attempt to apply the GAMLSS technique to predict future PA distributions using a healthy population and to cover most of the life cycle. In general, GAMLSS offers a flexible approach due to a large number of implemented distribution families. With GAMLSS, it is possible to assess the effect of specific parameters on the outcome variable distribution. The WHO has adopted the GAMLSS methodology for creating reference growth curves (30). The reference values in this study can be used more comprehensively in clinical practice for populations with mixed SES.
This study estimated a useful table of phase angle percentiles stratified by sex and age. To the best of our knowledge, it is the first attempt to apply the GAMLSS technique to estimate phase angle percentiles in a healthy population, covering most of the life cycle. We also showed that there are different phase angle determinants according to sex.
Data Availability Statement
The raw data supporting the conclusions of this article will be made available by the authors, without undue reservation.
Ethics Statement
The studies involving human participants were reviewed and approved by Comitê de Ética em Pesquisas da PUCRS. Written informed consent to participate in this study was provided by the participants’ legal guardian/next of kin.
Author Contributions
RM: conception and design of the work, data collection, data analysis, interpretation, drafting the article, critical revision of the article, and final approval of the version to be published. PZ: conception and design of the work, data analysis, and interpretation, drafting the article, critical revision of the article, and final approval of the version to be published. EM: data collection, critical revision of the article, and final approval of the version to be published. All authors contributed to the article and approved the submitted version.
Funding
This work was supported by the Research Support Foundation of Rio Grande do Sul (FAPERGS) and CAPES. RM is a recipient of the Brazilian National Council of Scientific and Technological Development (CNPq).
Conflict of Interest
The authors declare that the research was conducted in the absence of any commercial or financial relationships that could be construed as a potential conflict of interest.
Publisher’s Note
All claims expressed in this article are solely those of the authors and do not necessarily represent those of their affiliated organizations, or those of the publisher, the editors and the reviewers. Any product that may be evaluated in this article, or claim that may be made by its manufacturer, is not guaranteed or endorsed by the publisher.
Supplementary Material
The Supplementary Material for this article can be found online at: https://www.frontiersin.org/articles/10.3389/fnut.2022.912840/full#supplementary-material
References
1. de Borba EL, Ceolin J, Ziegelmann PK, Bodanese LC, Gonçalves MR, Cañon-Montañez W, et al. Phase angle of bioimpedance at 50 kHz is associated with cardiovascular diseases: systematic review and meta-analysis. Eur J Clin Nutr. (2022). doi: 10.1038/s41430-022-01131-4
2. Norman K, Stobaus N, Pirlich M, Bosy-Westphal A. Bioelectrical phase angle and impedance vector analysis–clinical relevance and applicability of impedance parameters. Clin Nutr. (2012) 31:854–61. doi: 10.1016/j.clnu.2012.05.008
3. de Azevedo ZMA, Santos Junior BD, Ramos EG, Salú MDS, Mancino da Luz Caixeta D, Lima-Setta F, et al. The importance of bioelectrical impedance in the critical pediatric patient. Clin Nutr. (2020) 39:1188–94. doi: 10.1016/j.clnu.2019.05.005
4. de Blasio F, Scalfi L, Di Gregorio A, Alicante P, Bianco A, Tantucci C, et al. Raw bioelectrical impedance analysis variables are independent predictors of early all-cause mortality in patients with COPD. Chest. (2019) 155:1148–57. doi: 10.1016/j.chest.2019.01.001
5. Marino LV, Meyer R, Johnson M, Newell C, Johnstone C, Magee A, et al. Bioimpedance spectroscopy measurements of phase angle and height for age are predictive of outcome in children following surgery for congenital heart disease. Clin Nutr. (2017) 17:S0261–5614. doi: 10.1016/j.clnu.2017.06.020
6. Pereira MME, Queiroz MDSC, de Albuquerque NMC, Rodrigues J, Wiegert EVM, Calixto-Lima L, et al. The prognostic role of phase angle in advanced cancer patients: a systematic review. Nutr Clin Pract. (2018) 33:813–24. doi: 10.1002/ncp.10100
7. Mattiello R, Amaral MA, Mundstock E, Ziegelmann PK. Reference values for the phase angle of the electrical bioimpedance: systematic review and meta-analysis involving more than 250,000 subjects. Clin Nutr. (2020) 39:1411–7. doi: 10.1016/j.clnu.2019.07.004
8. Mundstock E, Amaral MA, Baptista RR, Sarria EE, dos Santos RRG, Filho AD, et al. Association between phase angle from bioelectrical impedance analysis and level of physical activity: systematic review and meta-analysis. Clin Nutr. (2019) 38:1504–10. doi: 10.1016/j.clnu.2018.08.031
9. von Elm E, Altman DG, Egger M, Pocock SJ, Gøtzsche PC, Vandenbroucke JP. The strengthening the reporting of observational studies in epidemiology (STROBE) statement: guidelines for reporting observational studies. J Clin Epidemiol. (2008) 61:344–9. doi: 10.1016/j.jclinepi.2007.11.008
10. IBGE. Classificação e Caracterização dos Espaços Rurais e Urbanos do Brasil: Uma Primeira Aproximação. Rio de Janeiro: IBGE (2017). p. 84.
11. Adami F, Bergamaschi D, Hinnig P, Oliveira N. Validity study of the “ physical activity checklist ” in children. Rev Saúde Pública. (2013) 47:1–9. doi: 10.1590/S0034-8910.2013047004018
12. Guedes DP, Lopes CC, Guedes JERP. Reprodutibilidade e validade do questionário internacional de atividade física em adolescentes. Rev Bras Med do Esporte. (2005) 11:151–8. doi: 10.1590/S1517-86922005000200011
13. Matsudo S, Araújo T, Matsudo V, Andrade D, Andrade E, Oliveira LCC, et al. Questionário internacional de atividade física (Ipaq): estupo de validade e reprodutibilidade no Brasil. Rev Bras Atividade Física Saúde. (2012) 6:5–18. doi: 10.12820/rbafs.v.6n2p5-18
14. Bull FCC, Al-Ansari SSS, Biddle S, Borodulin K, Buman MPP, Cardon G, et al. World health organization 2020 guidelines on physical activity and sedentary behaviour. Br J Sports Med. (2020) 54:1451–62. doi: 10.1136/bjsports-2020-102955
15. Word Health Organization. Obesity and Overweight. (2021). Available online at: https://www.who.int/news-room/fact-sheets/detail/obesity-and-overweight (accessed April 26, 2022).
16. Ling CHY, de Craen AJM, Slagboom PE, Gunn DA, Stokkel MPM, Westendorp RGJ, et al. Accuracy of direct segmental multi-frequency bioimpedance analysis in the assessment of total body and segmental body composition in middle-aged adult population. Clin Nutr. (2011) 30:610–5. doi: 10.1016/j.clnu.2011.04.001
17. Kyle UG, Bosaeus I, De Lorenzo AD, Deurenberg P, Elia M, Manuel Gómez J, et al. Bioeletrical impedance analysis – partII: utilization in clinical practice. Clin Nutr. (2004) 23:1430–53. doi: 10.1016/j.clnu.2004.09.012
18. Faul F, Erdfelder E, Lang A-G, Buchner A. G*Power 3: a flexible statistical power analysis program for the social, behavioral, and biomedical sciences. Behav Res Methods. (2007) 39:175–91. doi: 10.3758/bf03193146
19. Stasinopoulos M, Rigby B, Voudouris V, Akantziliotou C, Enea M, Kiose D Package ‘gamlss’. (2020). Available online at: https://cran.r-project.org/web/packages/gamlss/index.html (accessed July 15, 2021).
20. Stasinopoulos MD, Rigby RA, Heller GZ, Voudouris V, De Bastiani F. Flexible Regression and Smoothing: Using GAMLSS in R. 1st ed. London: Chapman and Hall/CRC (2020). p. 571.
21. Rigby RA, Stasinopoulos DM Generalized additive models for location, scale and shape (with discussion). J R Stat Soc Ser C Appl Stat. (2005) 54:507–54. doi: 10.1111/j.1467-9876.2005.00510.x
22. World Medical Association. Declaration of Helsinki, Ethical Principles for Scientific Requirements and Research Protocols. Ferney-Voltaire: World Medical Association (2013).
23. Schmidt SC, Bosy-Westphal A, Niessner C, Woll A. Representative body composition percentiles from bioelectrical impedance analyses among children and adolescents. The MoMo study. Clin Nutr. (2019) 38:2712–20. doi: 10.1016/j.clnu.2018.11.026
24. Barbosa-Silva MC, Barros AJ. Bioelectrical impedance analysis in clinical practice: a new perspective on its use beyond body composition equations. Curr Opin Clin Nutr Metab Care. (2005) 8:311–7. doi: 10.1097/01.mco.0000165011.69943.39
25. Goryakin Y, Suhrcke M. Economic development, urbanization, technological change and overweight: what do we learn from 244 demographic and health surveys? Econ Hum Biol. (2014) 14:109–27. doi: 10.1016/j.ehb.2013.11.003
26. Basto-Abreu A, Barrientos-Gutiérrez T, Zepeda-Tello R, Camacho V, Gimeno Ruiz de Porras D, Hernández-Ávila M. The relationship of socioeconomic status with body mass index depends on the socioeconomic measure used. Obesity. (2018) 26:176–84. doi: 10.1002/oby.22042
27. Yamada G, Jones-Smith JC, Castillo-Salgado C, Moulton LH. Differences in magnitude and rates of change in BMI distributions by socioeconomic and geographic factors in Mexico, Colombia, and Peru, 2005-2010. Eur J Clin Nutr. (2020) 74:472–80. doi: 10.1038/s41430-019-0479-9
28. Instituto Brasileiro de Geografia e Estatística. Projeções da População. Portal IBGE. (2018). Available online at: https://www.ibge.gov.br/estatisticas/sociais/populacao/9109-projecao-da-populacao.html?=&t=resultados (accessed April 26, 2022).
Keywords: bioimpedance (BIA), phase angle (PA), reference values, percentiles, determinants
Citation: Mattiello R, Mundstock E and Ziegelmann PK (2022) Brazilian Reference Percentiles for Bioimpedance Phase Angle of Healthy Individuals. Front. Nutr. 9:912840. doi: 10.3389/fnut.2022.912840
Received: 04 April 2022; Accepted: 19 May 2022;
Published: 06 July 2022.
Edited by:
Roberto Fernandes Da Costa, Federal University of Rio Grande do Norte, BrazilReviewed by:
Franco Simini, Universidad de la República, UruguayCasper Albers, University of Groningen, Netherlands
Copyright © 2022 Mattiello, Mundstock and Ziegelmann. This is an open-access article distributed under the terms of the Creative Commons Attribution License (CC BY). The use, distribution or reproduction in other forums is permitted, provided the original author(s) and the copyright owner(s) are credited and that the original publication in this journal is cited, in accordance with accepted academic practice. No use, distribution or reproduction is permitted which does not comply with these terms.
*Correspondence: Rita Mattiello, rita.mattiello@pucrs.br