The Association Between Dietary Diversity Score and Odds of Diabetic Nephropathy: A Case-Control Study
 Mahsa Rezazadegan1
  Fatemeh Mirjalili1 Yahya Jalilpiran2,3 Monireh Aziz4
  Ahmad Jayedi5 Leila Setayesh6 Mir Saeed Yekaninejad7 Krista Casazza8 Khadijeh Mirzaei6*
- 1Department of Clinical Nutrition, School of Nutrition and Food Science, Food Security Research Center, Isfahan University of Medical Sciences, Isfahan, Iran
- 2Department of Clinical Nutrition, School of Nutritional Science and Dietetics, Tehran University of Medical Sciences, Tehran, Iran
- 3Students' Scientific Research Center, Tehran University of Medical Sciences, Tehran, Iran
- 4Department of Clinical Nutrition, School of Nutrition and Food Sciences, Shiraz University of Medical Sciences, Shiraz, Iran
- 5Social Determinants of Health Research Center, Semnan University of Medical Sciences, Semnan, Iran
- 6Department of Community Nutrition, School of Nutritional Science and Dietetics, Tehran University of Medical Sciences, Tehran, Iran
- 7Department of Epidemiology and Biostatistics, School of Public Health, Tehran University of Medical Sciences, Tehran, Iran
- 8Marieb College of Health and Human Services, Florida Gulf Coast University, Florida, FL, United States
A dietary diversity score (DDS) may be a useful strategy for monitoring risks associated with chronic diseases. Few studies have investigated the relationship between DDS and the progression to chronic kidney disease (CKD). A better understanding of the relationship between DDS and diabetic nephropathy (DN) may provide insight for monitoring the overall diet and clinical outcomes. This case-control study included 105 women with DN and 105 controls with age and diabetes duration-matched to evaluate the extent to which DDS is associated with DN. Dietary intake was assessed using the food frequency questionnaire (FFQ). DDS was calculated based on the method using five food groups: bread/grains, vegetables, fruits, meats, and dairies. Conditional logistic regression was performed to examine the association between DDS and odds of DN. Anthropometric measures and physical activity levels were evaluated using standard protocols. In a fully adjusted model [controlled for age, body mass index (BMI), energy intake, physical activity, diabetes duration, cardiovascular disease history, and drug usage], greater adherence (the third vs. the first tertile) to DDS [odds ratio (OR) = 0.13; 95% CI (0.05–0.35)], vegetables group [OR = 0.09; 95% CI (0.02–0.36)], and fruits group [OR = 0.05; 95% CI (0.01–0.20)] were significantly associated with lower odds of DN. However, we did not observe any significant relationship between other DDS components and the odds of DN. Our findings showed that higher DDS might be associated with reduced odds of DN. However, more prospective studies are warranted to confirm these findings.
Introduction
The increasing burden of type 2 diabetes (T2D) is a concern in the healthcare system worldwide (1). The diabetes prevalence is estimated to rise from 9.3 to 10.9% between 2019 and 2045 globally (2). The significant mortality rate observed in T2D is profoundly increased by the co-occurrence of diabetic nephropathy (DN) affecting ~40% of patients with T2D (3). The most common indicator for the diagnosis of DN is albuminuria (urinary albumin to creatinine ratio ≥ 30 mg/g) and also a reduction in the estimated glomerular filtration rate (eGFR) (<60 ml/min/1.73 m2) (4). Previous studies reported that DN occurs about 10–20 years after the onset of T2D (5). Some of the major risk factors for DN, such as ethnicity and family history, are non-modifiable. However, hypertension, gestational diabetes, insulin resistance, obesity, hyperlipidemia, and increased glycosylated hemoglobin levels can each be mitigated by dietary modification (6). Consideration of nutritional approaches in addition to pharmacological therapy is an important strategy to prevent the onset and progression of DN (7). The diet of patients with chronic kidney disease (CKD) needs to provide healthy food options to enhance their diet quality (8). Accordingly, previous studies showed that restriction of protein, phosphorus, and sodium intake can improve renal function in patients with DN (9).
A recent observational study suggested that adherence to the Dietary Approaches to Stop Hypertension (DASH) diet was inversely associated with a risk of end-stage renal disease (ESRD) in adults with CKD, particularly, in diabetic persons (10). Dietary diversity score (DDS) is an indicator for assessing the diet quality and nutrient adequacy ratio (11, 12). Previous studies have identified a relationship between DDS and some risk factors for diabetes and metabolic syndrome, including, hyperglycemia, adverse lipid profiles, and low serum adiponectin level (13–15). A recent cross-sectional study in Bangladesh demonstrated that the serum creatinine level of newly diagnosed T2D was negatively correlated with the DDS (16). Furthermore, renal transplant patients with higher dietary diversity had a lower prevalence of obesity (17). The present case-control study is aimed to examine the association between DDS and the odds of DN among women with T2D in Semnan, Iran.
Materials and Methods
Participants
This case-control study was conducted in the Kowsar Diabetes Clinic, Semnan, Iran, from July to December 2016. A total of 210 women (105 cases and 105 controls) participated in this study. Inclusion criteria were women with prevalent T2D, aged between 30 and 65 years, and with a T2D diagnosis of 3–10 years. The American Diabetes Association's most recent diagnostic criteria (18) were used to define diabetes in this study. Established cut-points were fasting blood glucose (FBG) ≥ 126 mg/dl, 2-h post-load blood glucose (2hrBG) ≥ 200 mg/dl, and hemoglobin A1c (HbA1c) ≥ 6.5%. Participants with autoimmune disorders, history of cancer, coronary angiography, hepatic disease, myocardial infarction, and stroke were excluded. Urinary albumin-to-creatinine ratio (ACR) ≥ 30 mg/g in a random spot urine sample was considered as DN (19). From chart review, 120 patients with DN were identified. However, only 105 patients consented to participate. In total, 105 diabetic women without DN from the same center as the control group were matched for age and the duration of diabetes with the case group. Incomplete data in the food frequency questionnaire (FFQ), implausible responses, and total energy intake of <500 or >3,500 kcal/day were considered as exclusion criteria (20). All participants provided informed consent. This research was approved by the Ethics Committee of Tehran University of Medical Sciences (Ethics number: IR.TUMS.REC.1395.2644) and the Ethics Committee of Semnan University of Medical Sciences (Ethics number: IR. SEMUMS. REC.1395.66).
Demographic, Anthropometric, and Blood Biomarkers Assessment
Demographic data, including age, diabetes duration, physical activity, history of cardiovascular disease, and current drug usage, were collected by trained interviewers. Bodyweight (kg) was measured while subjects wore light clothing and no shoes. Height was measured at 0.1 cm precision by a non-stretchable tape in a standing position without shoes. Body mass index (BMI) was calculated as weight in kilograms divided by the square of height in meters. Systolic blood pressure (SBP) and diastolic blood pressure (DBP) were measured once on the left arm while sitting after a resting period of ≥5 min using a manual sphygmomanometer.
To assess subjects' physical activity, we used a standard physical activity questionnaire (IPAQ) (21). Scoring criteria based on this questionnaire indicated “low physical activity” (score <600 Metabolic Equivalents/Week), “moderate physical activity” (score between 600 and 3,000 MET/h/Week), and “high physical activity” (score > 3,000 MET/h/Week). Biochemical indexes, including fasting blood sugar (FBS), 2hrBG, HbA1c, total cholesterol (TC), triglycerides (TG), low-density lipoprotein (LDL), high-density lipoprotein (HDL), total serum creatinine (Cr), and blood urea nitrogen (BUN), were obtained from participant's medical records during the past 3 months.
Dietary Intake Assessment and DDS Calculation
A food-frequency questionnaire found to be valid and reliable in this population was used to assess dietary intake (22). This FFQ consisted of a list of 147 food items with standard serving sizes commonly used by Iranians. Participants reported the frequency of consumption of a given food item during the previous year. Participants reported their intake of food or food items daily, weekly, monthly, or yearly. Final portion sizes were changed into g/day using household measures. Then, these amounts were adjusted for energy intake using the residual method (23). Dietary intakes were analyzed using Nutritionist IV (First Data Bank, San Bruno, CA, USA) software to estimate energy and nutrient intakes.
For scoring dietary diversity, we used a method described by Kant et al. (24, 25). This method was based on five groups, including grains, vegetables, fruits, meats, and dairy products, according to the United States Department of Agriculture (USDA) food guide pyramid. Before computing the DDS, we adjusted all food groups for energy intake. Although the Kant method includes seven subgroups for grains, the method employed in this study used five subgroups, refined bread, macaroni, corn flakes, rice, and biscuits. Other subgroups were aligned with the Kant method, such that the vegetable group was divided into mixed vegetables, potato, tomato, other starchy vegetables, legumes, yellow vegetables, and green vegetables. The fruits group was composed of fruit and fruit juice, berries, and citrus fruits. The group of meat included four subgroups, such as red meat, poultry, fish, and eggs. Eventually, the group of dairy products was defined as milk, yogurt, and cheese. A maximum score of 2 was considered for each food group. Therefore, the total DDS was in the range of 0–10.
Subjects were considered as a “consumer” who score 1 for any component of food groups if they had intaken higher than median amounts; otherwise, they were allocated a score of 0. Afterward, the sum of components' scores in each food group was computed to have a total score of the related food group. The total scores in each group were divided into the number of components in that group. Then, the aforesaid value was multiplied by 2. The total DDS for each subject was estimated by summing up the figures for food groups. For instance, if a subject had dietary intakes of whole-grain bread, rice, and macaroni higher than the median amounts, his or her score was calculated as (3/6) × 2 = 1.0. After computing the DDS for the other four groups, total DDS was determined. Hence, the total score of dietary diversity for each participant was between 0 (minimum) and 10 (maximum) points.
Statistical Analysis
The normality of quantitative variables was assessed using the Kolmogorov-Smirnov test. General characteristics among cases and controls were compared using paired sample t-test and chi-square or Fischer's exact tests. We used one-way ANOVA and chi-square tests to compare quantitative variables across the tertiles of DDS and to determine the distribution of the qualitative variables across the tertiles of DDS, respectively. Energy-adjusted dietary macro- and micronutrient intakes were also compared across the tertiles of DDS using the analysis of covariance (ANCOVA) test. Conditional logistic regression was performed to estimate the associations between the DDS and the odds of DN. In adjusted models, age, BMI, energy intake, physical activity, diabetes duration, cardiovascular disease history, and pharmacotherapy [angiotensin receptor blockers (ARBs); angiotensin-converting enzyme inhibitors (ACIE), beta-blockers, metformin, sulphonylurea, and insulin] were controlled. SPSS software (version 25, SPSS Inc., Chicago, IL, USA) was used for data analysis, with p < 0.05 was considered statistically significant.
Results
Sociodemographic characteristics and anthropometric measures of study participants are displayed in Table 1. Groups were similar except for using ACIE drugs, which were more prevalent in cases than controls (p = 0.001).
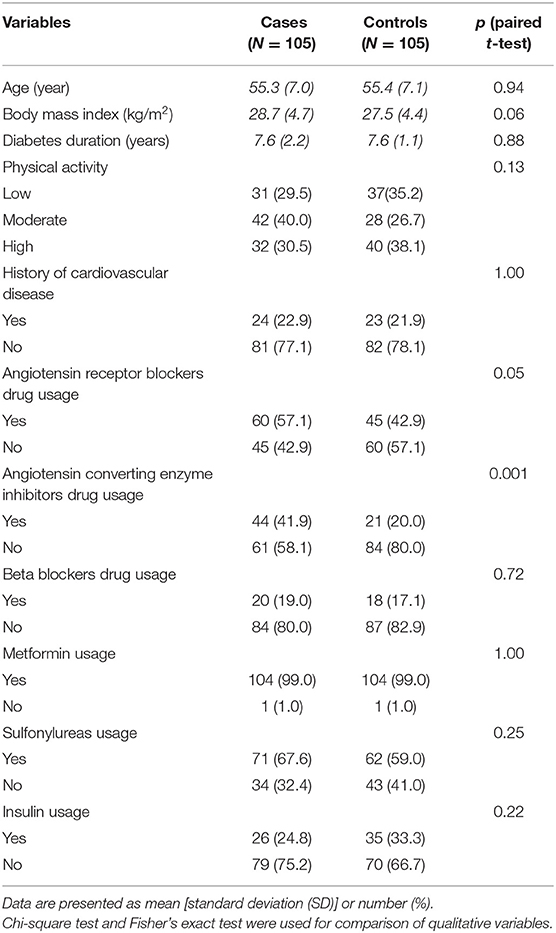
Table 1. Sociodemographic characteristics and anthropometric measures of study participants.
Table 2 shows the participant's general characteristics and biochemical markers across the tertiles of DDS. ACR (p < 0.001), serum albumin (p = 0.01), and serum LDL cholesterol (p = 0.04) showed a downward trend across the tertiles of DDS.

Table 2. General characteristics and biochemical markers of participants across tertiles of dietary diversity scorea.
Dietary intakes of participants across tertiles of DDS are presented in Table 3. It was observed that increased DDS was significantly associated with decreased intake of carbohydrate (p = 0.04), vitamin E (p = 0.02), vitamin C (p = 0.01), vitamin B1 (p = 0.003), vitamin B2 (p ≤ 0.001), vitamin B3 (p = 0.001), vitamin B5 (p = 0.02), vitamin B9 (p ≤ 0.001), sodium (p ≤ 0.001), and iron (p = 0.009). Moreover, increased DDS was significantly related to increased intake of cholesterol (p = 0.001), vitamin B12 (p = 0.01), calcium (p = 0.004), magnesium (p = 0.03), and zinc (p = 0.04).

Table 3. Dietary intakes of participants across tertiles of dietary diversity scorea.
Table 4 describes multivariable conditional logistic regression models for the odds of DN according to the total DDS and variety within the food groups. In the crude model, higher adherence (third vs. the first tertile) to the DDS [odds ratio (OR) = 0.24; 95% CI (0.11–0.49)], fruits [OR = 0.13; 95% CI (0.05–0.31)], and vegetables intake [OR = 0.13; 95% CI (0.05–0.37)] was significantly associated with decreased odds of DN. Protein [OR = 0.76; 95% CI (0.38–1.53)], grain [OR = 2.03; 95% CI (0.80–5.13)], and dairy [OR = 1.15; 95% CI (0.57–2.34)] intakes were not associated with odds of DN. After adjusting for potential confounders, an inverse relationship between the odds of DN and total DDS [OR = 0.13; 95% CI (0.05–0.35)], fruits group [OR = 0.05; 95% CI (0.01–0.20)], and vegetables group [OR = 0.09; 95% CI (0.02–0.36)] was observed and the lack of association with protein, grain, and dairy remained.
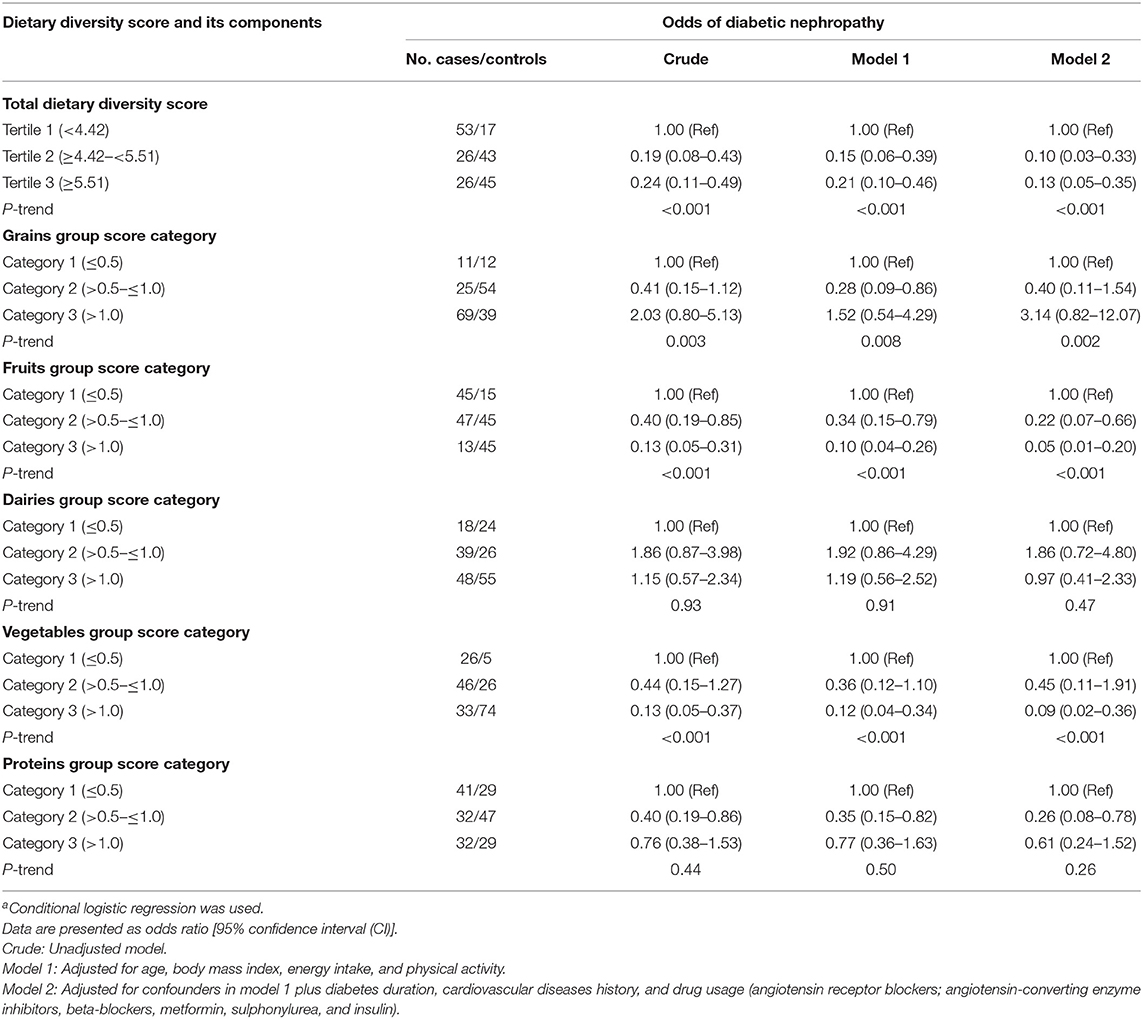
Table 4. Conditional logistic regression models for odds of diabetic nephropathy according to total dietary diversity score and variety within the food groupsa.
Discussion
The present case-control study conducted on Iranian women with T2D displayed evidence of a significant inverse association between higher DDS, consumption of fruits and vegetables with the odds of DN. These findings are not unexpected; since a higher fruit and vegetable intake is linked to a more varied diet. Since DDS reflects a comprehensive view of the individual diet, it is a useful indicator for recognizing the association between diet and risk of chronic diseases (26).
Our study illustrated the possible beneficial effects of dietary diversity on renal function and DN. Moreover, this study demonstrated that the consumption of fruits and vegetables may reduce the odds of DN. A cross-sectional study on 110 newly diagnosed T2DM revealed that serum creatinine levels of patients were negatively associated with DDS (16). In a previous population-based cohort study, greater total diet diversity was associated with a 30% lower risk of progression T2D. In addition, in this study, greater diversity in dairy products, fruits, and vegetables was related to the lower incidence of diabetes (13). In another study, Tiew et al. reported that working diabetic patients have a less diversified diet (26). Moreover, Du et al. in a prospective study on Chinese adults suggested that higher fresh fruit consumption was related to the lower risk of diabetes, death, and major vascular complications among diabetic patients (27). Another study proposed that fruits and vegetables appear to be efficient in renal protection in hypertensive and possibly other nephropathies (28). In addition, a meta-analysis of cohort studies concluded that although there was not a significant association between total fruit and vegetable consumption and T2D risk, 2–3 and 2 servings/day of vegetable and fruit, respectively, should be recommended for the prevention of T2D (29).
Despite the recommendation for decreased protein intake in patients with DN, we did not observe a relationship between meat and dairies. In a cross-sectional study on 420 long-standing T2DM, higher intake of vegetable protein was associated with a less prevalence of renal impairments, and theoretical substitution of animal protein with vegetable protein was inversely associated with renal dysfunction among patients with T2DM (30). Moreover, Malhotra et al. reported that diabetic people had higher protein intakes than those without diabetes, and it was associated with an increased risk of ESRD in blacks, not white diabetics. However, whether protein intake raises the risk of ESRD is uncertain (31).
We found a negative association between DDS and serum LDL cholesterol levels but not with other cardiovascular risk factors. A recent study revealed that higher dietary diversity was associated with lower abnormalities of TG and HDL levels (32). Another study by Azadbakht et al. reported that the probability of hypertension, hypercholesterolemia, and high LDL was decreased in the higher quartile of the DDS (33). Furthermore, a cross-sectional study among subjects with metabolic syndrome observed lower serum TG and SBP with greater DDS (15). In contrast, a case-control study in Iran showed a significant positive association between DDS and obesity (34).
Differences in the dietary assessment tools, numbers of food groups, scoring of dietary diversity methods, sample size, and type of study design might cause inconsistent results among some studies. To our knowledge, previous studies were cross-sectional, but this is the first case-control study that investigates the association between DDS and DN.
Several mechanisms might be responsible for the association between DDS and its components with DN odds. The lack of diversity in diet can lead to a loss of variety in intestinal microbiota and lower health outcomes (35). Consumption of diverse foods, especially vegetables and fruits, is optimal for achieving nutrient intakes to promote health (36). Vegetables and fruits are rich sources of vitamin C, carotenoids, potassium, and dietary fiber (37). Their fiber content may exert a favorable effect on renal through bodyweight control, short-chain fatty acid production, reduction of uremic toxins, inflammation, and glycemic control (38). Based on existing evidence, good glycemic control reduces albuminuria and serum creatinine levels (39). Since diabetes has high oxidative potential, the antioxidant content of vegetables and fruits could be useful for reducing vascular complications among these patients (40).
The present study has multiple strengths. First, the cases and controls were selected during the same period from the same place. Second, it was the first study that assessed the association of DDS with DN odds directly. Third, the assessment of dietary intakes was using a validated and reliable FFQ. Nevertheless, we acknowledge some limitations. First, due to the nature of the case-control studies, the recall and selection biases in these studies are not unavoidable. Second, although, we individually matched cases and controls for age and diabetes duration, however, other confounders, such as BMI, were not considered. Third, this study had a relatively low sample size.
Conclusion
The findings of the present case-control study indicate that higher DDS in individual diets diminished the odds of DN. This association might be due to the two components of DDS, namely, fruits and vegetables. Because of the existing limitations, we suggest further well-controlled prospective studies with larger sample sizes are needed to confirm these findings.
Data Availability Statement
The raw data supporting the conclusions of this article will be made available by the corresponding author with rational reasons.
Ethics Statement
The studies involving human participants were reviewed and approved by Ethics Committee of Tehran University of Medical Sciences (Ethic Number: IR.TUMS.REC.1395.2644) and Ethics Committee of Semnan University of Medical Sciences (Ethic Number: IR.SEMUMS. REC.1395.66). The patients/participants provided their written informed consent to participate in this study.
Author Contributions
MR: manuscript writing. FM, YJ, and MA: study designing and interpretation of analyzed outputs. AJ: data collection. MSY: data analysis. KM: study management and supervision of the final manuscript. KC and LS: critically read and edited the manuscript. All authors contributed to the article and approved the submitted version.
Funding
This work was supported by the Tehran University of Medical Sciences (Grant Number: 94-04-161-31155).
Conflict of Interest
The authors declare that the research was conducted in the absence of any commercial or financial relationships that could be construed as a potential conflict of interest.
The reviewer PM declared a shared affiliation with two of the authors, MR and FM, to the handling editor at time of review.
Publisher's Note
All claims expressed in this article are solely those of the authors and do not necessarily represent those of their affiliated organizations, or those of the publisher, the editors and the reviewers. Any product that may be evaluated in this article, or claim that may be made by its manufacturer, is not guaranteed or endorsed by the publisher.
Acknowledgments
The authors would like to thank the participants for their kind cooperation.
Abbreviations
ACR, albumin-to-creatinine ratio; BMI, body mass index; BUN, blood urea nitrogen; CKD, chronic kidney disease; Cr, creatinine; DASH, Dietary Approaches to Stop Hypertension; DDS, dietary diversity score; DN, diabetic nephropathy; eGFR, estimated glomerular filtration rate; ESRD, end-stage renal disease; FBG, fasting blood glucose; FFQ, food frequency questionnaire; HbA1c, glycosylated hemoglobin; HDL, high-density lipoprotein; IPAC, physical activity questionnaire; LDL, low-density lipoprotein; TC, total cholesterol; TG, triglycerides; T2D, type 2 diabetes; 2hrBG, 2-h post-load blood glucose.
References
1. Khan MAB, Hashim MJ, King JK, Govender RD, Mustafa H, Al Kaabi J, et al. Epidemiology of type 2 diabetes–global burden of disease and forecasted trends. J Epidemiol Glob Health. (2020) 10:107. doi: 10.2991/jegh.k.191028.001
2. Saeedi P, Petersohn I, Salpea P, Malanda B, Karuranga S, Unwin N, et al. Global and regional diabetes prevalence estimates for 2019 and projections for 2030 and 2045: results from the International Diabetes Federation Diabetes Atlas. Diabetes Res Clin Pract. (2019) 157:107843. doi: 10.1016/j.diabres.2019.107843
3. Pugliese G, Penno G, Natali A, Barutta F, Di Paolo S, Reboldi G, et al. Diabetic kidney disease: new clinical and therapeutic issues. Joint position statement of the Italian Diabetes Society and the Italian Society of Nephrology on “The natural history of diabetic kidney disease and treatment of hyperglycemia in patients with type 2 diabetes and impaired renal function”. Nutr Metab Cardiovasc Dis. (2019) 29:1127–50. doi: 10.1016/j.numecd.2019.07.017
4. Toth-Manikowski S, Atta MG. Diabetic kidney disease: pathophysiology and therapeutic targets. J Diabetes Res. (2015) 2015:697010. doi: 10.1155/2015/697010
5. Magee C, Grieve DJ, Watson CJ, Brazil DP. Diabetic nephropathy: a tangled web to unweave. Cardiovasc Drugs Ther. (2017) 31:579–92. doi: 10.1007/s10557-017-6755-9
6. Sulaiman MK. Diabetic nephropathy: recent advances in pathophysiology and challenges in dietary management. Diabetol Metab Syndr. (2019) 11:7. doi: 10.1186/s13098-019-0403-4
7. Goldstein-Fuchs J, Kalantar-Zadeh K. Nutrition intervention for advanced stages of diabetic kidney disease. Diabetes Spectrum. (2015) 28:181–6. doi: 10.2337/diaspect.28.3.181
8. Fernandes AS, Ramos CI, Nerbass FB, Cuppari L. Diet quality of chronic kidney disease patients and the impact of nutritional counseling. J Renal Nutr. (2018) 28:403–10. doi: 10.1053/j.jrn.2017.10.005
9. Satirapoj B, Adler SG. Comprehensive approach to diabetic nephropathy. Kidney Res Clin Pract. (2014) 33:121–31. doi: 10.1016/j.krcp.2014.08.001
10. Banerjee T, Crews DC, Tuot DS, Pavkov ME, Burrows NR, Stack AG, et al. Poor accordance to a DASH dietary pattern is associated with higher risk of ESRD among adults with moderate chronic kidney disease and hypertension. Kidney Int. (2019) 95:1433–42. doi: 10.1016/j.kint.2018.12.027
11. Mirmiran P, Azadbakht L, Azizi F. Dietary diversity within food groups: an indicator of specific nutrient adequacy in Tehranian women. J Am Coll Nutr. (2006) 25:354–61. doi: 10.1080/07315724.2006.10719546
12. Drewnowski A, Renderson SA, Driscoll A, Rolls BJ. The dietary variety score: assessing diet quality in healthy young and older adults. J Am Diet Assoc. (1997) 97:266–71. doi: 10.1016/S0002-8223(97)00070-9
13. Conklin AI, Monsivais P, Khaw K-T, Wareham NJ, Forouhi NG. Dietary diversity, diet cost, and incidence of type 2 diabetes in the United Kingdom: a prospective cohort study. PLoS Med. (2016) 13:e1002085. doi: 10.1371/journal.pmed.1002085
14. Azadbakht L, Mirmiran P, Azizi F. Dietary diversity score is favorably associated with the metabolic syndrome in Tehranian adults. Int J Obes. (2005) 29:1361–7. doi: 10.1038/sj.ijo.0803029
15. Farhangi MA, Jahangiry L. Dietary diversity score is associated with cardiovascular risk factors and serum adiponectin concentrations in patients with metabolic syndrome. BMC Cardiovasc Disord. (2018) 18:68. doi: 10.1186/s12872-018-0807-3
16. Sultana S, Lina NN, Hasan MT, Ferdaus MJ, Dash BK, Ahmad T. Dietary diversity and associated health status of newly diagnosed type 2 diabetic patients in Jashore region of Bangladesh. Curr Res Nutr Food Sci J. (2020) 8:2020. doi: 10.12944/CRNFSJ.8.2.09
17. Lin I, Duong TV, Nien S-W, Tseng I, Wang H-H, Chiang Y-J, et al. Dietary diversity score: Implications for obesity prevention and nutrient adequacy in renal transplant recipients. Int J Environ Res Public Health. (2020) 17:5083. doi: 10.3390/ijerph17145083
18. American Diabetes Association. 6. Glycemic targets: standards of medical care in diabetes-−2019. Diabetes Care. (2019) 42 (Suppl. 1):S61–70. doi: 10.2337/dc19-S006
19. Molitch ME, DeFronzo RA, Franz MJ, Keane WFJDc. Nephropathy in diabetes. Diabetes Care. (2004) 27:S79. doi: 10.2337/diacare.27.2007.S79
20. Willett W. Nutritional Epidemiology. Chapter 13. Issues in Analysis and Presentation of Dietary Data. (2013). p. 306.
21. pdf IRCJhwikss. Guidelines for Data Processing and Analysis of the International Physical Activity Questionnaire (IPAQ)-Short and Long Forms (2005).
22. Esfahani FH, Asghari G, Mirmiran P, Azizi F. Reproducibility and relative validity of food group intake in a food frequency questionnaire developed for the Tehran Lipid and Glucose Study. J Epidemiol. (2010) 20:150–8. doi: 10.2188/jea.JE20090083
23. Willett WC, Howe GR, Kushi LH. Adjustment for total energy intake in epidemiologic studies. The American journal of clinical nutrition. Am J Clin Nutr. (1997) 65 (4 Suppl.):1220S–8S. doi: 10.1093/ajcn/65.4.1220S
24. Kant AK, Block G, Schatzkin A, Ziegler RG, Nestle M. Dietary diversity in the US population, NHANES II, 1976-1980. J Am Diet Assoc. (1991) 91:1526–31. doi: 10.1016/S0002-8223(21)01428-0
25. Kant AK, Schatzkin A, Ziegler RG. Dietary diversity and subsequent cause-specific mortality in the NHANES I epidemiologic follow-up study. J Am Coll Nutr. (1995) 14:233–8. doi: 10.1080/07315724.1995.10718501
26. Tiew KF, Chan YM, Lye MS, Loke SC. Factors associated with dietary diversity score among individuals with type 2 diabetes mellitus. J Health Popul Nutr. (2014) 32:665.
27. Du H, Li L, Bennett D, Guo Y, Turnbull I, Yang L, et al. Fresh fruit consumption in relation to incident diabetes and diabetic vascular complications: a 7-y prospective study of 0.5 million Chinese adults. PLoS Med. (2017) 14:e1002279. doi: 10.1371/journal.pmed.1002279
28. Goraya N, Simoni J, Jo C, Wesson DE. Dietary acid reduction with fruits and vegetables or bicarbonate attenuates kidney injury in patients with a moderately reduced glomerular filtration rate due to hypertensive nephropathy. Kidney Int. (2012) 81:86–93. doi: 10.1038/ki.2011.313
29. Wu Y, Zhang D, Jiang X, Jiang W. Fruit and vegetable consumption and risk of type 2 diabetes mellitus: a dose-response meta-analysis of prospective cohort studies. Nutr Metab Cardiovasc Dis. (2015) 25:140–7. doi: 10.1016/j.numecd.2014.10.004
30. Oosterwijk MM, Soedamah-Muthu SS, Geleijnse JM, Bakker SJ, Navis G, Binnenmars SH, et al. High dietary intake of vegetable protein is associated with lower prevalence of renal function impairment: results of the Dutch DIALECT-1 cohort. Kidney Int Rep. (2019) 4:710–9. doi: 10.1016/j.ekir.2019.02.009
31. Malhotra R, Cavanaugh K, Blot W, Ikizler T, Lipworth L, Kabagambe EK. Higher protein intake is associated with increased risk for incident end-stage renal disease among blacks with diabetes in the Southern Community Cohort Study. Nutr Metab Cardiovasc Dis. (2016) 26:1079–87. doi: 10.1016/j.numecd.2016.07.009
32. Guo Q, Ma Z, Zhu C, Zeng Q. Dietary diversity and physical activity associations with lipid indices among Beijingese: a cross-sectional study. Asia Pac J Clin Nutr. (2020) 29:628–37. doi: 10.6133/apjcn.202009_29(3).0023
33. Azadbakht L, Mirmiran P, Esmaillzadeh A, Azizi F. Dietary diversity score and cardiovascular risk factors in Tehranian adults. Public Health Nutr. (2006) 9:728–36. doi: 10.1079/PHN2005887
34. Karimbeiki R, Pourmasoumi M, Feizi A, Abbasi B, Hadi A, Rafie N, et al. Higher dietary diversity score is associated with obesity: a case–control study. Public Health. (2018) 157:127–34. doi: 10.1016/j.puhe.2018.01.028
35. Claesson MJ, Jeffery IB, Conde S, Power SE, O'connor EM, Cusack S, et al. Gut microbiota composition correlates with diet and health in the elderly. Nature. (2012) 488:178–84. doi: 10.1038/nature11319
36. Slavin J, Lloyd B. Health benefits of fruits and vegetables. Adv Nutr. (2012) 3:506–16. doi: 10.3945/an.112.002154
37. Wallace TC, Bailey RL, Blumberg JB, Burton-Freeman B, Chen CO, Crowe-White KM, et al. Fruits, vegetables, and health: a comprehensive narrative, umbrella review of the science and recommendations for enhanced public policy to improve intake. Crit Rev Food Sci Nutr. (2020) 60:2174–211. doi: 10.1080/10408398.2019.1632258
38. Camerotto C, Cupisti A, D'Alessandro C, Muzio F, Gallieni M. Dietary fiber and gut microbiota in renal diets. Nutrients. (2019) 11:2149. doi: 10.3390/nu11092149
39. Mesquita de Carvalho C, Azevedo Gross L, Jobim de Azevedo M, Verçoza Viana L. Dietary fiber intake (supplemental or dietary pattern rich in fiber) and diabetic kidney disease: a systematic review of clinical trials. Nutrients. (2019) 11:347. doi: 10.3390/nu11020347
Keywords: diet variety, diabetic nephropathy, case-control, Iran, dietary diversity score
Citation: Rezazadegan M, Mirjalili F, Jalilpiran Y, Aziz M, Jayedi A, Setayesh L, Yekaninejad MS, Casazza K and Mirzaei K (2022) The Association Between Dietary Diversity Score and Odds of Diabetic Nephropathy: A Case-Control Study. Front. Nutr. 9:767415. doi: 10.3389/fnut.2022.767415
Received: 30 August 2021; Accepted: 01 March 2022;
Published: 01 April 2022.
Edited by:
Cain Craig Truman Clark, Coventry University, United KingdomReviewed by:
Palash Mandal, Charotar University of Science and Technology, IndiaJane Muchiri, University of Pretoria, South Africa
Copyright © 2022 Rezazadegan, Mirjalili, Jalilpiran, Aziz, Jayedi, Setayesh, Yekaninejad, Casazza and Mirzaei. This is an open-access article distributed under the terms of the Creative Commons Attribution License (CC BY). The use, distribution or reproduction in other forums is permitted, provided the original author(s) and the copyright owner(s) are credited and that the original publication in this journal is cited, in accordance with accepted academic practice. No use, distribution or reproduction is permitted which does not comply with these terms.
*Correspondence: Khadijeh Mirzaei, mirzaei_kh@tums.ac.ir