Optimization of ultrasound-assisted extraction of phenolics from Asparagopsis taxiformis with deep eutectic solvent and their characterization by ultra-high-performance liquid chromatography-mass spectrometry
 Heqi Gao
 Yuxi Wang
 Zhiqiang Guo
 Yuxin Liu
 Qian Wu
 Juan Xiao
- 1State Key Laboratory of Marine Resource Utilization in South China Sea, Engineering Research Center of Utilization of Tropical Polysaccharide Resources, Ministry of Education/Key Laboratory of Food Nutrition and Functional Food of Hainan Province, School of Food Science and Engineering, Hainan University, Haikou, China
- 2Key Laboratory of Fermentation Engineering, Ministry of Education, Hubei Key Laboratory of Industrial Microbiology, National “111” Center for Cellular Regulation and Molecular Pharmaceutics, Hubei Research Center of Food Fermentation Engineering and Technology, Hubei University of Technology, Wuhan, China
Asparagopsis taxiformis is a significant source of phenolics. Owing to the incessant demand of green extraction procedures for phenolics from A. taxiformis, ultrasound-assisted extraction (UAE) using deep eutectic solvents (DESs) was optimized. Among the tested DESs, betaine-levulinic acid afforded the highest total phenolic content (TPC). Moreover, the optimal extraction conditions elucidated from single-factor and response surface methodologies comprised a 52.41°C ultrasonic temperature, 46.48% water content of DES, and 26.99 ml/g liquid-to-solid ratio. The corresponding TPC (56.27 mg GAE/100 g DW) and antioxidant ability fitted the predicted values. UAE afforded superior TPC and antioxidant abilities with DESs than with traditional solvents. Using UHPLC-MS, seven phenolic acids, 18 flavonoids, and two bromophenols were identified and quantified. DES-UAE afforded the highest phenolic compound number (26) and sum of contents. These results disclose the high extraction efficiency of DES-UAE for A. taxiformis phenolics and provide a basis for the higher-value application of this species.

Graphical Abstract
Introduction
Asparagopsis taxiformis, a red alga belonging to the Bonnemaisoniaceae family, has been utilized in local food and traditional Chinese medicine for many centuries (1). Recent studies have revealed that A. taxiformis contains substantial quantities of protein, fat, fiber, and phytochemicals including polysaccharides, halogenated compounds, and phenolics (2, 3). Accumulating studies have focused on the antimethanogenic, antibacterial, and antifungal activities of halogenated compounds from A. taxiformis (3, 4). However, A. taxiformis is also rich in phenolics and other phytochemicals, which have not been well studied to date (2, 5). Owing to the health-promoting effect of phenolics extracted from terrestrial plants, there has been a growing interest in phenolics from A. taxiformis. In particular, a few studies have recently attributed the antimicrobial and antifungal activities of A. taxiformis extracts to the phenolics present in this species (2, 5). However, to the best of our knowledge, phenolic profiles of A. taxiformis have not been reported.
Marine algae are distinguished by particular phenolic classes that are not identified in terrestrial plants. In particular, bromophenols, which contain different numbers of benzene ring, hydroxyl, bromine, and other groups in their structure. They have shown beneficial biological activities including antidiabetic and anti-obesity activities and thus gained significant attention in the fields of pharmaceutical and food agents (6, 7). Bromophenols were first isolated from red seaweeds and subsequently found in green and brown seaweeds too (7). Notably, phenolics common to terrestrial plants, including flavonoids and phenolic acids, have also been found in numerous seaweeds (6).
Owing to their diversity, the high-efficiency extraction of phenolics from seaweeds is highly challenging. One major issue encountered in this process is the choice of a suitable extraction solvent. Organic solvents, particularly methanol, acetone, ethanol, and their aqueous mixtures, have been commonly utilized for the extraction of phenolic compounds from seaweeds (5, 8). However, no unanimous consensus on the best solvent for the extraction of phenolics from A. taxiformis has been reached. Mellouk et al. (5) reported that the highest TPC was obtained from methanolic and aqueous extracts of A. taxiformis, followed by those attained using ethanolic, hydroethanolic, and hydromethanolic extracts. On the other hand, Nunes et al. (2) showed that the highest TPC, antioxidant ability, and antiproliferative activity were obtained from methanolic extracts of A. taxiformis, followed by those from the chloroform, petroleum ether, and ethyl acetate extracts. Additionally, the safety of organic solvents has posed a challenge to the widespread use of organic solvents for extracting phytochemicals. Thus, extraction methods using green solvents are gaining significant attention.
Deep eutectic solvents (DESs), which constituted by hydrogen-bond acceptors and donors, are showing great potential as new green solvents for extracting phytochemicals (9, 10). In contrast with organic solvents, DESs are not only eco-friendly but also have the benefits of easy synthesis, high stability, low volatility, and wide polarity (10). Various studies have reported that compared with conventional solvents, DESs show superior extraction capacities for phenolics from terrestrial plants including Corylus avellana, Morinda citrifolia, and Zingiber officinale (10, 11). UAE has been demonstrated to enhance the extraction efficiency of phenolics, utilizing acoustic cavitation to destruct the cell-wall structure (12). Moreover, the use of DESs instead of traditional organic solvents in this process was reported to further increase the extraction efficiency of phenolics from Moringa oleifera and Paederia scandens (11, 13). However, research focusing on phenolic extraction from A. taxiformis using DES-UAE remains scarce.
With these facts in mind, in this study we first elucidated the most suitable DES for extracting phenolics from A. taxiformis. We then proceeded to optimize the DES-UAE process through single-factor experiment and subsequent response surface methodology, using the elucidated optimal DES as the solvent to maximize the TPC and antioxidant ability of A. taxiformis. Finally, we evaluated the differences in the TPC, phenolic profiles (qualitative and quantitative analysis; UHPLC-MS), and antioxidant abilities of the extracts gained from A. taxiformis by UAE using the optimal DES and traditional solvents.
Materials and methods
Materials and reagents
Asparagopsis taxiformis was collected from Wuzhizhou island, Sanya, Hainan Province, China (109°45.494′E, 18°18.555′N), in May 2020, and characterized by Prof. Xiubao Li from Hainan University. The seaweed was rinsed in water to eliminate any visible surface contaminants, freeze-dried, and subsequently crushed through a 60-mesh sieve using a food grinder (Tianjin Taist Instrument Co., Ltd., Tianjin, China). It was then stored at −18°C until further use.
For the UHPLC-MS analysis, 4-bromophenol and 2,4-dibromophenol were purchased from Tanmo Quality Inspection Technology Co., Ltd. (Beijing, China). Quercitrin, apigenin, hesperidin, diosmetin, and acacetin were acquired from Qiyun Biotechnology (Guangzhou, China), leucocyanidin from Shanghai Pureone Biotechnology Co., Ltd. (Shanghai, China), aromadendrin from Shanghai Tauto Biotech Co., Ltd. (Shanghai, China), and all other phenolic standards from Sigma were acquired. The DES-related reagents and total antioxidant capacity assay kits were, respectively acquired from Aladdin Biochemical Technology Co., Ltd. (Shanghai, China) and Nanjing Jiancheng Bioengineering Institute (Nanjing, China).
Preparation and physicochemical properties of the DESs
Sixteen DESs comprising choline chloride, L-proline, betaine, and citric acid as hydrogen-bond acceptors and different hydrogen-bond donors (polyalcohols and organic acids) were prepared according to previously reported methods (9). Briefly, the hydrogen-bond acceptors and donors (Table 1) were mixed at a specific molar ratio, as shown in Table 1. After a certain ratio of water (w/w) was added, the mixture was continuously stirred on a magnetic stirring apparatus (Eyelan-1100, Tokyo Physicochemical Instrument Co., Ltd., Tokyo, Japan), at 80°C, to form the transparent and homogeneous DESs. Subsequently, the density, polarity and viscosity of DESs were determined according to previously reported methods (14, 15). The density was determined by weighting 1 cm3 of DES at analytical balances at room temperature (14). The polarity was measured with Nile red as an indicator by scanning at the spectral range of 400–800 nm in a UV-Vis spectrometer and presented using the molar transition energy (ENR), calculated using the formula: ENR (kcal/mol) = 28,591/λmax (14). The viscosity was measured using TA Instruments Discovery HR-2 rheometer with the shear rate of 0.1/s at atmospheric pressure (15).
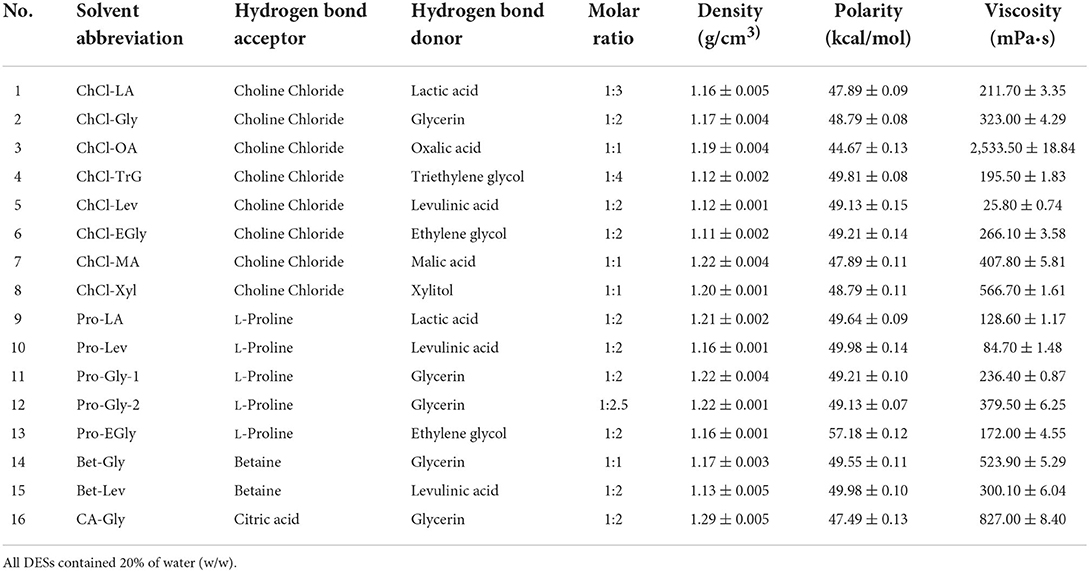
Table 1. DESs and their physicochemical properties.
Extraction of phenolics
Screening of DESs
Asparagopsis taxiformis powder (1 g) was placed in glass tubes and blended with 10 ml DES containing 20% water (w/w) in triplicate. Subsequently, extraction was performed using an SB25-12DTD ultrasonic machine (40 kHz, Ningbo Scientz Biotechnology Co., Ltd., Ningbo, China) at 320 W, for 10 min, at 30°C. The mixtures were centrifugated (10,000 rpm) for 15 min and then TPC of the supernatants was measured to evaluate the extraction efficiency.
Single-factor experiment
The single-factor experiment aimed to assess the effects of five factors—water content of DES (10 20, 30, 40, and 50%); liquid-to-solid ratio (10, 20, 30, and 40 ml/g); ultrasonic temperature (30, 40, 50, and 60°C); ultrasonic time (0, 5, 10, 20, 30, and 40 min); and ultrasonic power (240, 280, 320, 360, 400, 440, and 480 W)—on the TPC of the A. taxiformis extracts. The other parameters were kept constant: water content of DES (20%), ultrasonic temperature (30°C), liquid-to-solid ratio (20 ml/g), ultrasonic time (10 min) or ultrasonic power (320 W).
Response surface methodology
According to the single-factor experiment, the major influential variables—water content of DES (A, 30, 40, and 50%); liquid-to-solid ratio (B, 10, 20, and 30 ml/g); and ultrasonic temperature (C, 40, 50, and 60°C)—were applied to a Box-Behnken design using Design-Expert v. 8.0.5 to assess their influence on TPC, ABTS value, and FRAP value at a constant ultrasonic time (10 min) and ultrasonic power (360 W).
Verification and comparison experiments
Asparagopsis taxiformis powder (1 g) was mixed with 27.0 ml Bet-Lev (46.5% water; DES-UAE), water (Water-UAE), 70% methanol (MeOH-UAE), 70% ethanol (EtOH-UAE), or 70% acetone (Acetone-UAE). After ultrasound extraction (360 W) at 52.0°C for 10 min, the mixtures were centrifugated (10,000 rpm) for 15 min to acquire the supernatants.
Measurement of the TPC
After determination using the Folin-Ciocalteu colorimetric method (8), TPC was quantified using the standard curve of gallic acid (mg GAE/100 g DW).
Phenolic characterization and quantification using UHPLC-MS
The phenolic compounds were monitored using UHPLC-MS (Xevo TQ-S Micro, Waters, Milford, USA) according to our previously reported method with slight modifications (13). The Acquity UHPLC BEH-C18 column was eluted by water with 0.25% formic acid (A) and methanol with 0.25% formic acid (B) at a gradient elution program (0–1 min, 95% A; 8 min, 75% A; 11 min, 40% A; 13–16 min, 0% A; and 16.2–18 min, 95% A). The basic compound structures were then tentatively deduced according to the characteristic ions characterized using multiple reaction monitoring as well as the published mass spectral data (7, 16–27). Subsequently, the retention times and mass spectral data of the phenolic standards were compared to those of the aforementioned tentative basic structures to finally assign the phenolics. The contents were calculated using the standard curve of each standard and expressed in μg/g DW. The mass spectra were recorded using the following parameters: mass spectral range of 50–1,000 m/z, cone voltage of 30 V, capillary voltage of 2.0 kV, drying gas flow of 1,000 L/h, and drying gas (N2) temperature of 500°C.
Antioxidant activity
To determine the antioxidant activity, ABTS and FRAP assay kits were employed following the manufacturer's protocols, using Trolox and FeSO4 as the standards, respectively (13). Their calibration curves were then utilized to calculate the ABTS and FRAP values, which were respectively expressed in mM TE/g DW and mM Fe(II)E/g DW.
Statistical analyses
All data are shown as the mean values ± standard deviation (n = 3). Statistical analyses were conducted through one-way ANOVA and subsequent Duncan's post hoc test at p < 0.05 level using SPSS 16.0 software.
Results and discussion
Effects of the DESs on the TPC
The extraction effectiveness is attributed to the interaction between the solubilization ability of the solvent and relative solubility of the phenolic in the solvent, which resolves the distribution coefficient and extractability (28). DESs have shown excellent extractability for phytochemicals, including phenolic compounds, in terrestrial plants (9, 10). This extractability is mainly associated with the polarity and viscosity of the DES, which in turn depend on its constituents and their molar ratios (9). Alcohols, amines, organic acids, and amino acids have been commonly used to prepare DESs (10). In particular, DESs comprising choline chloride, L-proline, betaine, and citric acid as hydrogen-bond acceptors and polyalcohols and organic acids as hydrogen-bond donors show high extractability for phenolics (9, 11). Importantly, water is usually added to the DES to increase its polarity and reduce its viscosity (11, 13). In this study, marked differences were found among the TPC of A. taxiformis extracts obtained by UAE with various DESs (p < 0.05, Figure 1). Specifically, Bet-Lev afforded the highest TPC (18.67 ± 0.29 mg GAE/100 g DW), followed by Pro-Lev and ChCl-Lev, which afforded values that were 60.07 and 60.36% that of the TPC extracted by Bet-Lev (p < 0.05). ChCl-Xyl and ChCl-OA afforded the lowest TPC, which were 3.51 and 4.42% that of the TPC extracted by Bet-Lev (p < 0.05). Many studies have reported that different DESs show remarkably distinct extractabilities for phenolics (11, 13). Indeed, Bet-Lev (1:2) was more efficient than ChCl-Lev, Pro-Lev, ChCl-Xyl, and ChCl-OA in extracting phenolics from M. oleifera but far less efficient than Pro-Gly-2 (1:2.5) (11). Moreover, Bet-Lev (1:2) presented higher extraction yields for phenolics from strawberry and raspberry waste than those afforded by ChCl-Gly (1:2) and another four DESs (29). Liu et al. (13) showed that Bet-Lev (1:2) was less efficient than ChCl-TrG (1:4). However, it displayed a similar efficiency to that of ChCl-Xyl in the extraction of phenolics from P. scandens (13). In addition, when different DESs were used, significantly distinct phenolic profiles were obtained from strawberry and raspberry waste (29). The similarity in the polarity of the DES and phenolic compounds is a key factor of the extraction efficiency (9, 13). Moreover, a low DES viscosity results in high mass transfer and compound diffusion (10). Thus, in this study we supposed that the highest TPC was obtained with Bet-Lev because of the adequate viscosity of this DES together with its highly similar polarity to that of the phenolics in A. taxiformis. Therefore, we selected Bet-Lev as the DES for the subsequent experiments.
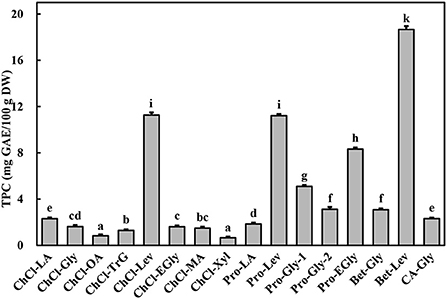
Figure 1. Total phenolic content (TPC) of Asparagopsis taxiformis extracts gained by UAE with different DESs. Different letters indicate significant differences (p < 0.05).
Single-factor experiment of DES-UAE
The properties of a phytochemical extraction method, including the extraction solvent, parameters, and type of assisted technology, all contribute to the extraction efficiency (28, 30). In addition, the water content significantly affects the DES polarity and viscosity, which in turn significantly affect the extraction efficiency (10). Moreover, both the ultrasonic conditions (power, time, and temperature) and liquid-to-solid ratio were reported to greatly affect the extraction efficiency (11, 13).
As expected (10, 13), there were marked differences in the TPC of the extracts obtained using Bet-Lev with different water contents (10, 20, 30, 40, and 50%) under identical UAE parameters (p < 0.05, Figure 2). With the growing water content of DES, TPC first raised markedly and subsequently more slowly until it reached the highest value at 50% water content of DES. Specifically, compared with the TPC extracted by Bet-Lev with 10% water content, the TPC extracted by Bet-Lev with 20, 30, 40, and 50% water contents increased 1.55-, 1.82-, 2.02-, and 2.10-fold, respectively (p < 0.05). Insignificant difference was found between the TPC extracted by Bet-Lev with 40 and 50% water contents (p > 0.05). Compared to that at the 10 ml/g liquid-to-solid ratio, the TPC increased by a significant 100.82% at 20 ml/g (p < 0.05). Conversely, there was no marked difference in the TPC extracted by Bet-Lev at 20, 30, and 40 ml/g liquid-to-solid ratios (p > 0.05). The increasing ultrasonic temperature also led to a significant increase in the TPC (p < 0.05), which reached a maximum at an ultrasonic temperature of 60°C. Notably, the TPC obtained at 60°C was 1.87-fold higher than that obtained at 30°C (p < 0.05).
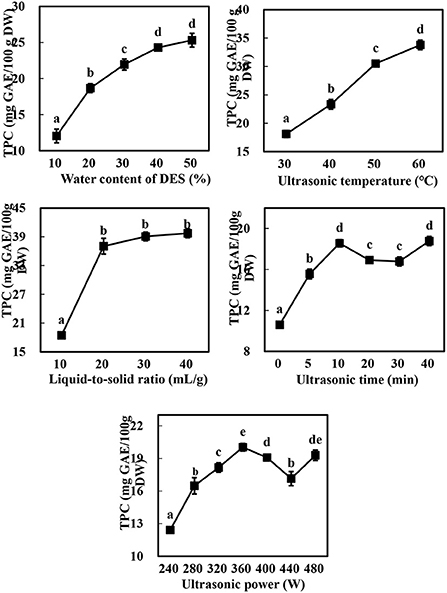
Figure 2. The effect of water content of DES, liquid-to-solid ratio, ultrasonic temperature, ultrasonic time and ultrasonic power on the TPC of Asparagopsis taxiformis extracts. Different letters indicate significant differences (p < 0.05).
The TPC increased from 10.06 ± 0.29 to 18.56 ± 0.36 mg GAE/100 g DW as the ultrasonic time was increased from 0 to 10 min, significantly decreased as the ultrasonic time was further increased to 20 and 30 min, and subsequently increased markedly to the level observed at 10 min (p < 0.05). Similarly, the TPC raised when the ultrasonic power was grew from 240 to 360 W, followed by a decrease as ultrasonic power further grew to 440 W and then an increase again as ultrasonic power finally grew to 480 W. These results were linked to acoustic implosion cavitation, which disrupts the structure of the plant cell wall, thereby promoting the dissolution of the phytochemicals present in the vacuoles and releasing the phytochemicals bound to the cell wall components (12, 31). Indeed, the increase in ultrasonic time and power has been widely reported to increase the extraction yield of phenolics (13, 28); however, the phenolics may be degraded if the ultrasonic power is too high or the ultrasonic time too low (12). The increase in the TPC at 40 min or < 480 W may be therefore attributed to the release of the bound phenolics from the cell wall components and their subsequent distribution in the solvent (31). Thus, water contents of DES (A) of 30, 40, and 50%; liquid-to-solid ratios (B) of 10, 20, and 30%; and ultrasonic temperatures (C) of 40, 50, and 60 °C were selected for the subsequent experiments at a constant ultrasonic time (10 min) and ultrasonic power (360 W).
Modeling and optimization of DES-UAE
Model fitting
The TPC, FRAP, and ABTS values varied within the ranges of 24.26–57.82 mg GAE/100 g DW, 1.30–4.60 mM Fe(II)/g DW, and 1.67–4.78 mM TE/g DW, respectively (Table 2). Moreover, a highly significant model (p < 0.001, Table 3) and insignificant loss of fit (p = 0.0995, 0.8433, and 0.6377 for TPC, ABTS and FRAP, respectively) were observed. Good model accuracy as well as a high correlation was also observed, as indicated by the high R2 (0.9915, 0.9668, and 0.9676 for TPC, ABTS, and FRAP, respectively) and adjusted R2 values (0.9763, 0.9070, and 0.9091 for TPC, ABTS, and FRAP, respectively) and verified by the low coefficient of variation.
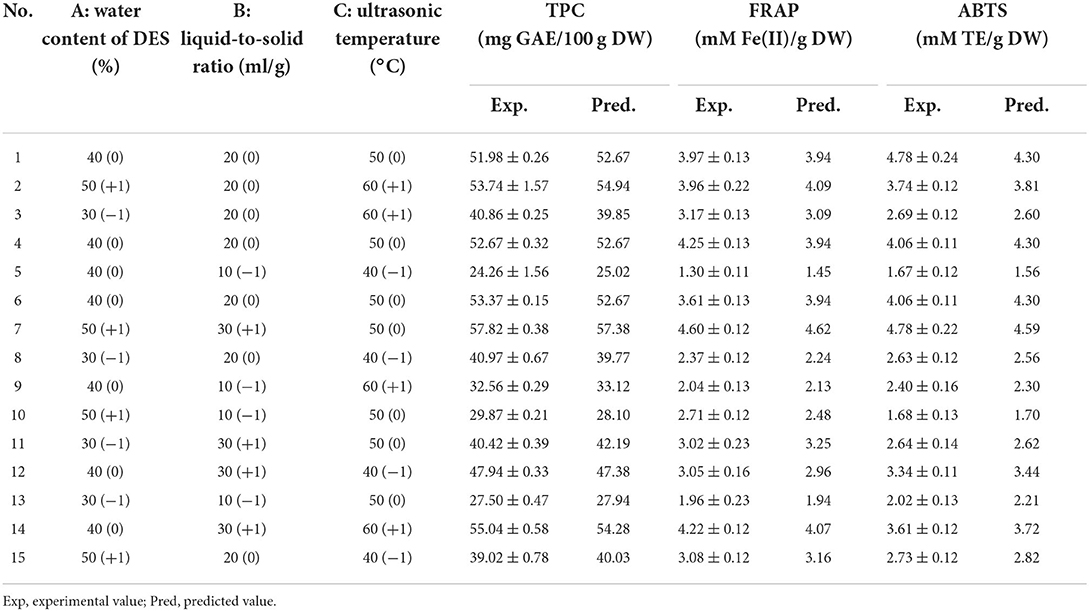
Table 2. Box-Behnken design and experimental responses.
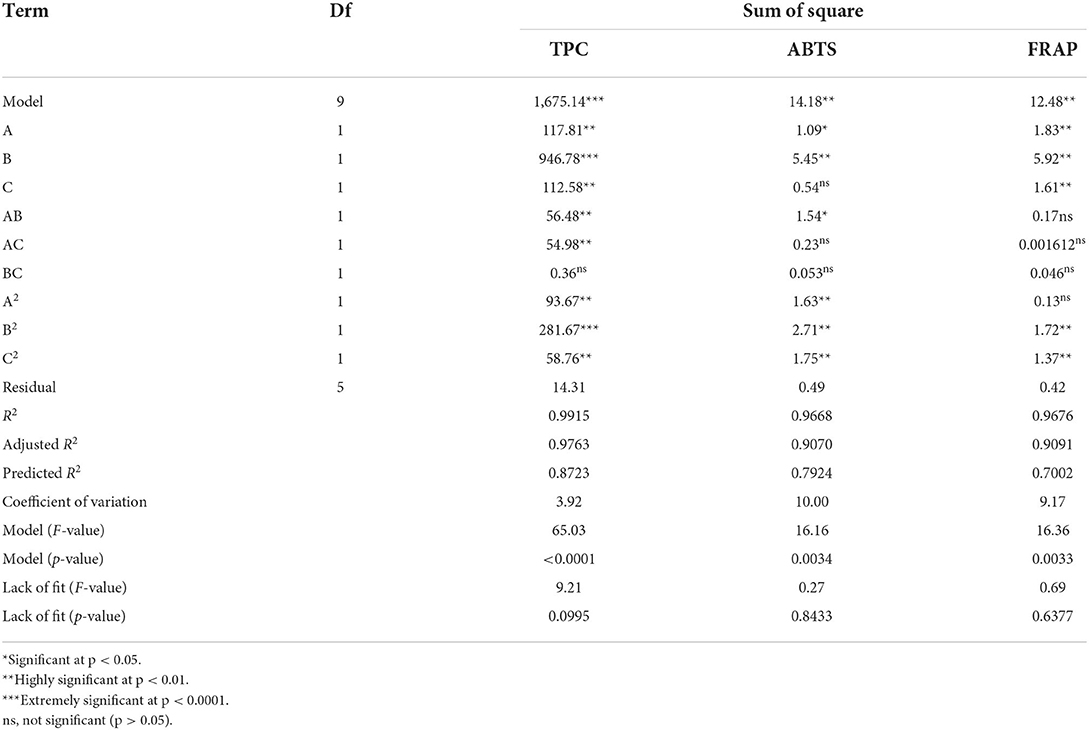
Table 3. ANOVA for response surface quadratic model.
Effects of the variables on the TPC
Apart from the linear terms (A, B, C), TPC was also remarkably influenced by the secondary (A2, B2, C2) and interactive (AB, AC) terms (Table 3). Among them, the liquid-to-solid ratio (B) and B2 exhibited a highly significant effect on the TPC (p < 0.0001). Numerous studies have reported that the liquid-to-solid ratio is one of the main factors that affects the extraction yield of phytochemicals including phenolics (9, 13). An increase in the liquid-to-solid ratio led to more than a twofold increase in the extraction yield (9). Equation 1 shows the relationship between the TPC and experimental variables:
The three-dimensional response surfaces plots (Figures 3A–C) show the interactive effect of the experimental variables on the TPC. Figure 3A illustrates the marked interactive effect of water content of DES (A) and liquid-to-solid ratio (B) on the TPC. Specifically, the TPC increased sharply with the growth of these variables and reached the highest value at ~46% (A) and 27 ml/g (B), after which it decreased slightly. It was recognized that a high liquid-to-solid ratio facilitates compound diffusion (11). The increasing water content of DES leads to an increase in the DES polarity, resulting in its high extractability for phenolics with relatively high polarity over those with weak polarity (9, 10). An increased water content of DES also contributes to a reduction in the DES viscosity, resulting in an increase in mass transfer and compound diffusion (10). The slight decrease observed may therefore be due to the strong influence of water content of DES on the TPC. The significant interactive effect of water content of DES (A) and ultrasonic temperature (C) on the TPC is illustrated in Figure 3B. The TPC gradually increases with the increase of these two variables, with the highest TPC value observed at ~27 ml/g and 52°C.
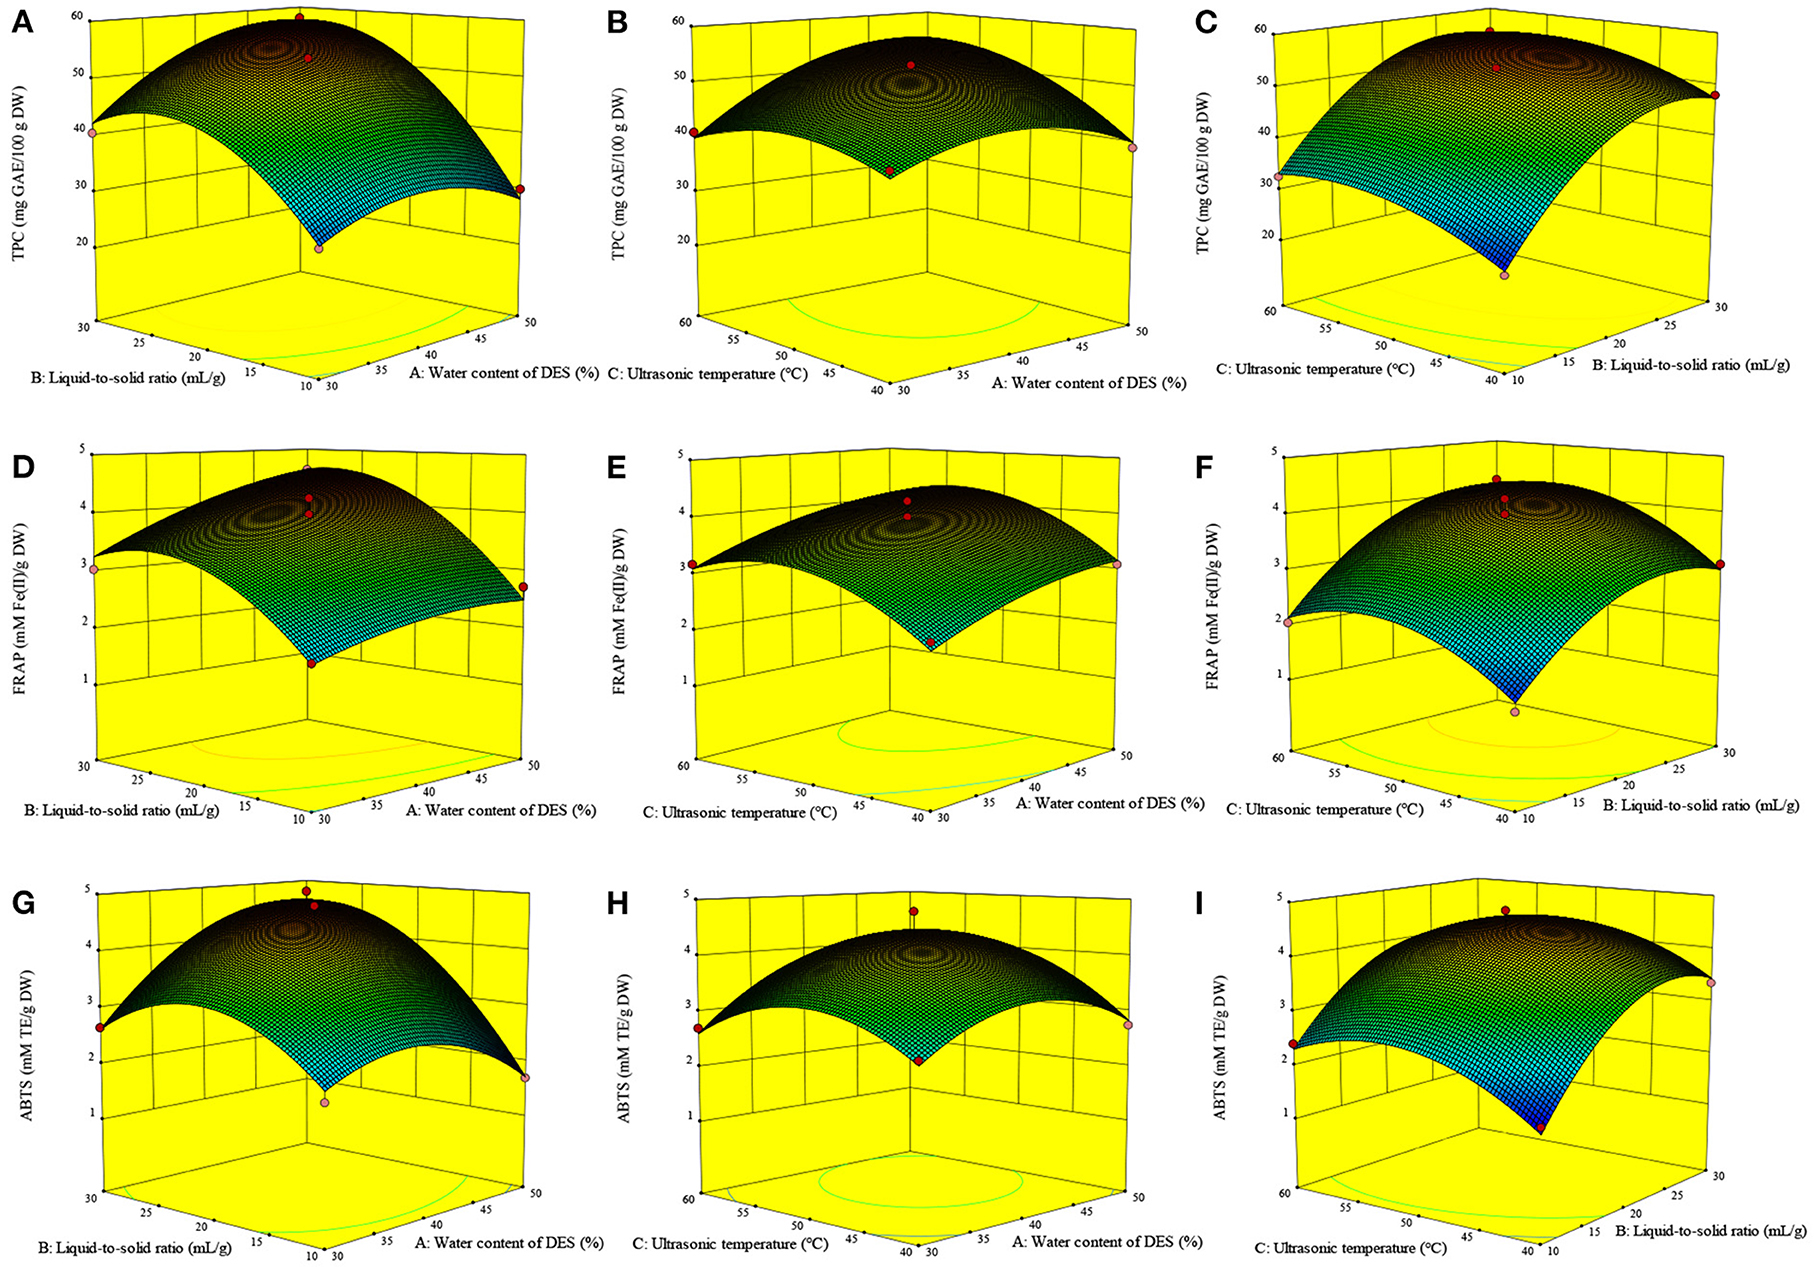
Figure 3. Interactive effects of the variables on the TPC (A–C), FRAP (D–F) and ABTS (G–I) of Asparagopsis taxiformis extracts. Interactive effects of water content of DES and liquid-to-solid ratio on TPC (A); Interactive effects of water content of DES and ultrasonic temperature on TPC (B); Interactive effects of liquid-to-solid ratio and ultrasonic temperature on TPC (C); Interactive effects of water content of DES and liquid-to-solid ratio on FRAP (D); Interactive effects of water content of DES and ultrasonic temperature on FRAP (E); Interactive effects of liquid-to-solid ratio and ultrasonic temperature on FRAP (F); Interactive effects of water content of DES and liquid-to-solid ratio on ABTS (G); Interactive effects of water content of DES and ultrasonic temperature on ABTS (H); Interactive effects of liquid-to-solid ratio and ultrasonic temperature on ABTS (I).
Effects of the variables on the antioxidant ability
The FRAP value was markedly influenced by A, B, C, B2, and C2 (p < 0.01, Table 3). Meanwhile, the ABTS value was markedly influenced by B, A2, B2, and C2 (p < 0.01) and, to a lesser extent, AB and A (p < 0.05). Figure 3G shows the significant interactive effect between water content of DES (A) and liquid-to-solid ratio (B) on the ABTS value, which first sharply increased with the increase in these variables and then declined. Equations 2, 3 show the relationship between the antioxidant ability (FRAP and ABTS, respectively) and variables. Three-dimensional surface plots for FRAP (Figures 3D–F) and ABTS (Figures 3G–I) were constructed on the basis of these equations.
Verification experiment based on the optimal extraction parameters
Based on the regression analysis achieved from the Box-Behnken design, we determined that the optimal conditions for extracting phenolics from A. taxiformis are water content of DES of 46.48%, ultrasonic temperature of 52.41°C, and liquid-to-solid ratio of 26.99 ml/g. To investigate the rationality of the Box-Behnken design, the verification experiment was conducted under water content of DES of 46.50%, ultrasonic temperature of 52.00°C, and liquid-to-solid ratio of 27.00 ml/g. As shown in Figure 4, the experimental values for TPC, FRAP, and ABTS (56.27 ± 1.08 mg GAE/100 g DW, 5.06 ± 0.33 mM Fe(II)/g DW, and 4.73 ± 0.32 mM TE/g DW, respectively) approached the predicted values, revealing the rationality of the Box-Behnken design.
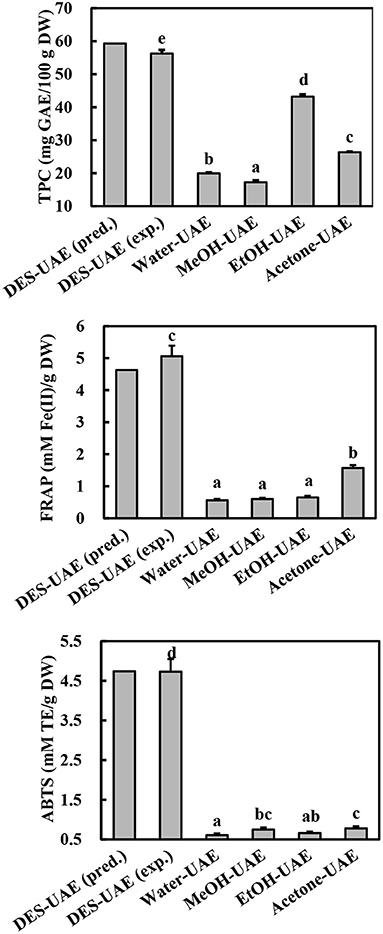
Figure 4. TPC and antioxidant ability of Asparagopsis taxiformis extracts gained by DES-UAE and UAE with traditional solvents. Different letters indicated significant differences (p < 0.05). DES-UAE, Water-UAE, MeOH-UAE, EtOH-UAE, Acetone-UAE: ultrasound-assisted extraction with deep eutectic solvent (Bet-Lev), water, 70% methanol, 70% ethanol and 70% acetone, respectively. exp.: experimental value; pred.: predicted value.
Comparison of DES and traditional solvent extractants in UAE
TPC and antioxidant ability
UAE methods using traditional solvents (organic aqueous mixtures and water) have been commonly applied to extract phenolics from marine algae (30). To confirm the high efficiency of optimized DES-UAE process, traditional solvents (water, 70% methanol, 70% ethanol, and 70% acetone) were also utilized in the UAE to extract phenolics from A. taxiformis. From the comparative study, DES-UAE presented the highest TPC, FRAP, and ABTS values (Figure 4, p < 0.05), which were respectively 1.30–3.27-, 3.22–9.03-, and 6.03–7.79-fold greater than those extracted using the other listed methods. These results indicate the high efficiency of the DES-UAE process for extracting phenolics from A. taxiformis. This well agrees with the literature, which reports that DES-UAE is a highly efficient method to extract phenolics (10, 11, 13). For example, for extracting phenolics from M. oleifera, DES-UAE afforded remarkably higher total flavonoid content and antioxidant abilities than UAE using traditional solvents (11). Similar trends were also observed in the extraction of phenolics from Curcuma longa and P. scandens (9, 13).
Characterization of phenolics using UHPLC-MS
As shown in Table 4, seven phenolic acids (peaks 1–7), 18 flavonoids (peaks 8–25), and two bromophenols (peaks 26–27) were identified from A. taxiformis by UHPLC-MS, along with many unknown compounds. The precursor ion (m/z 152.99) of peak 1 generated fragment ions at m/z 138.0 [M + H–CH3]+, 125.0 [M + H–CO]+, and 93.0 [M + H–CO–CH3-OH]+, and thus, peak 1 was assigned as vanillin (16). Ethyl vanillin (peak 2), with its parent ion at m/z 164.95, was identified through the product ions at m/z 136.2 [vanillin–H–CH3]− and 92.05 [vanillin–H–CH3-CO2]− (17). Peaks 3–5, with precursor ions at m/z 137.0, 163.1, and 193.0, were identified as 2-hydroxybenzoic, p-coumaric, and ferulic acids through the loss of CO2, CH3, or/and C2H4 group/s, respectively (18, 19). Rosmarinic acid (m/z 358.96) generated fragment ions at m/z 196.96 and 161.0, which were assigned as the dihydroxyphenyl-lactic acid moiety and caffeic acid with a loss of one molecule of water, respectively (20). Trans-cinnamic acid (m/z 146.95) generated a fragment ion at m/z 118.94 through CO loss (18). With the same parent ions, catechin (peak 8) and epicatechin (peak 9) presented identical product ions [M–H−44]− (CO2 loss) and [M–H−152]− (RDA fragmentation), respectively, but with distinct retention times (18, 21). Peaks 10–12 were assigned as epigallocatechin, gallocatechin, and epigallocatechin gallate according to their parent ions at m/z 304.98, 304.98, and 456.9, respectively, and as products ions based on C6H6O3 loss or RDA fragmentation ([M–H−152]−) together with their retention times (21). Peak 13 was identified as quercetin based on its parent ion (m/z 301.0) and representative fragment ions derived from RDA fragmentation (m/z 179.0 and 151.0) (18–20). Peaks 14–18 were identified as myricitrin, quercitrin, quercetin-3-O-α-L-arabinoside, kaempferol-3-O-rutinoside, and hesperidin, respectively, through cleavage of the rhamnoside, arabinoside, or rutinoside group (11, 19, 22). Peaks 19 (acacetin) and 22 (diosmetin) displayed parent ions at m/z 301.0 and 285.0, respectively, with an identical fragment ion (m/z 153.0) resulting from RDA fragmentation (23, 24). With identical parent ions (m/z 271.0), peaks 20 and 21 were, respectively authenticated as baicalein and apigenin from their fragment ions, which corresponded to those previously reported in the literature (18, 22). Peak 23 (m/z 286.8) was assigned as aromadendrin through a fragment ion (m/z 258.97) resulting from CO loss, which was previously reported by Venditti et al. (25). Peak 24 (m/z 306.92) and peak 25 (m/z 286.91) produced fragments ions at m/z 155.1 [M–H−152]− and 126.99 [M–H−152–CO]− for leucocyanidin and 137.0 [M–H−150]− and 109.1 [M–H−150–CO]− for cyanidin (26, 27). Compounds 4-bromophenol (m/z 172.1) and 2,4-dibromophenol (m/z 250.7), respectively generated fragment ions at m/z 80.9 (peak 26) and m/z 81.4 and 78.5 (peak 27), which were consistent with previously reported mass spectral data (6, 7).
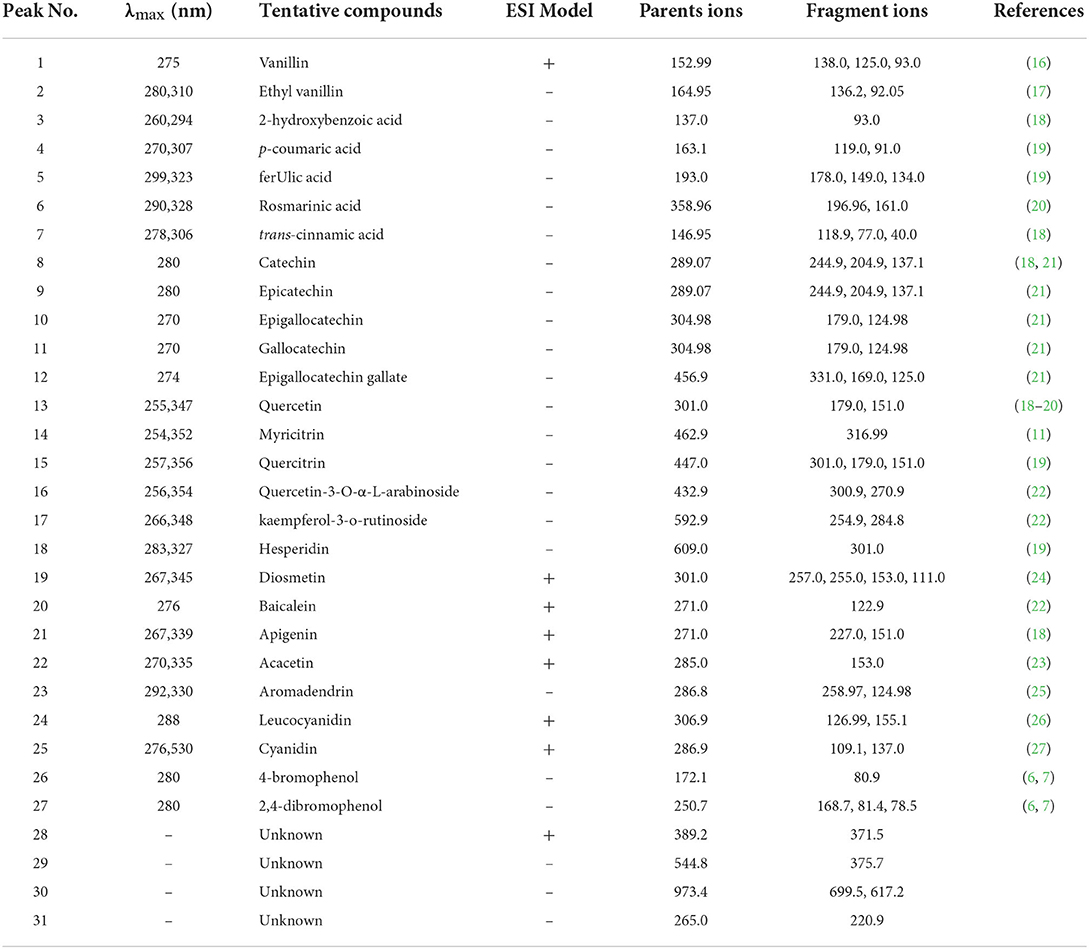
Table 4. Characterization of phenolic compounds from Asparagopsis taxiformis by UHPLC-MS.
Although several studies have revealed the high TPC and total flavonoid content of A. taxiformis extract and the close relationship between them and the bioactivity (antioxidant, anti-inflammatory, and antiproliferative activities) (2, 5), the phenolic profile of A. taxiformis remains unknown. Asparagopsis armata, the sister species of A. taxiformis, has also shown strong antioxidant and antimicrobial activities together with high TPC and total flavonoid content (32, 33); however, studies focusing on its phenolic profile remain scarce. Notably, phenolic compounds have been reported in red, brown, and green algae (6, 30). Indeed, phenolic acids including ferulic, hydroxybenzoic, vanillic, salicylic, benzoic, gentisic, syringic, chlorogenic, caffeic, and protocatechuic acids were detected in red seaweeds including Acanthophora specifera and Jania rubens (34–36). Moreover, six flavonoids, including luteolin-5,7,3′,4′-tetramethyl ether, apigenin-7-O-glucoside, kaempferol-3-O-arabinoside, quercetin-3,7-dimethylether-4′-sulfate, catechin derivative, and dihydroxytrimethoxy flavone, were identified in the red seaweed Alsidium corallinum using LC-MS (37) Quercetin, vitexin-rhamnose, catechol, rutin, hesperidin, myricetin, and morin were detected in several red seaweeds, including A. specifera, using HPLC (35). Importantly, in brown algae, quercetin-O-hexoside, quercetin-O-glucoside, kaempferol-O-rutinoside, myricetin-O-rhamnoside, apigenin, baicalein, acacetin, diosmetin, and rosmarinic acid were identified by LC-MS (6, 8, 20, 22); notably, the first four compounds may be quercetin-3-O-α-L-arabinoside, quercitrin, kaempferol-3-O-rutinoside, and myricitrin, respectively, or their isomers. Flavan-3-ols, containing epigallocatechin, epicatechin, catechin, gallocatechin, epigallocatechin gallate, and catechin gallate, are abundant in brown seaweeds such as Sargassum polycystum, Saccharina japonica, Sargassum fusiforme, and Eisenia bicyclis (8, 38). Cyanidin, cinnamic acid, vanillin, p-coumaric acid, and other flavonoids (quercetin, apigenin, malvidin, kaempferol, lutein and myricetin) were detected in green seaweeds using LC-MS (39, 40). Furthermore, although the presence of leucocyanidin and aromadendrin (namely dihydrokaempferol) in seaweed has been scarcely reported, aglycone and glycoside forms of kaempferol and cyanidin were identified in both brown and green seaweeds (22, 39). Additionally, simple-structured bromophenols (e.g., 4-bromophenol and 2,4-dibromophenol) and relatively complex-structured bromophenols (e.g., nitrogen- and sulfur-containing bromophenols) were isolated and identified from diverse species of red seaweeds, such as Rhodomela confervoides, Symphyocladia latiuscula, and Polyopes lancifolia (6, 7).
Quantification of phenolics by UHPLC-MS
Following characterization, the phenolics were quantified using UHPLC-MS. Different extraction methods led to significant differences in the number and content of the individual phenolic compounds (Table 5). The numbers of individual phenolic compounds detected by the different UAE methods ranged from 11 to 26. DES-UAE detected 26 individual phenolic compounds, whereas only 11 phenolics were detected using Water-UAE. DES-UAE also gave the highest sum of the individual phenolic acid, flavonoid, and phenolic contents, which were respectively 6.74–153.11-, 1.17–4.62-, and 1.46–5.53-fold higher than the values attained with the other extraction methods (p < 0.05). DES-UAE and EtOH-UAE gave the highest sum of the individual bromophenol contents (p < 0.05). With respect to the ratio of the sum of individual flavonoid content to that of the individual phenolic content, Water-UAE and Acetone-UAE achieved values of 99.64 and 91.34%, respectively, whereas MeOH-UAE, EtOH-UAE, and DES-UAE achieved ratios of 81.82, 82.01, and 67.37%, respectively. These results revealed that flavonoids are the main components of A. taxiformis. This agrees with the results of Yoshie-Stark et al. (35), who reported that flavonoids are dominant in the phenolic profiles of several red seaweeds followed by phenolic acids.
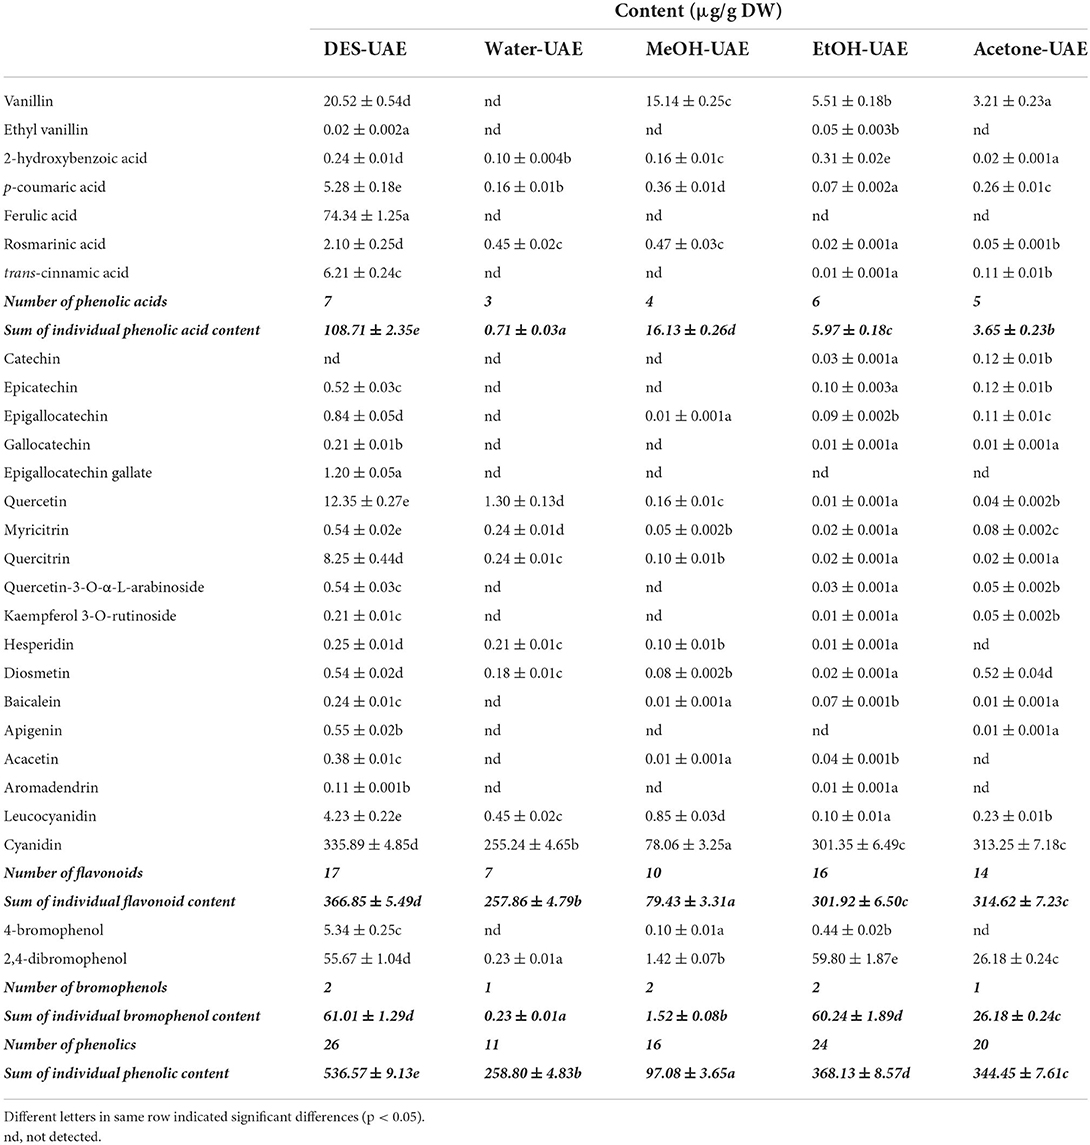
Table 5. Quantification of individual phenolic compounds from Asparagopsis taxiformis by UHPLC-MS.
Among the individual phenolic compounds extracted by DES-UAE, cyanidin, ferulic acid, 2,4-dibromophenol, vanillin, quercetin, quercitrin, trans-cinnamic acid, 4-bromophenol, p-coumaric acid, and leucocyanidin accounted for 62.60, 13.85, 10.38, 3.82, 2.30, 1.54, 1.16, 1.00, 0.98, and 0.79% of the sum of the individual phenolic content, respectively. Cyanidin was the main phenolic component in the extracts obtained by Water-UAE, and accounted for 98.62% of the sum of the individual phenolic content. However, the main phenolic components of the extracts acquired by MeOH-UAE were cyanidin, vanillin, 2,4-dibromophenol, and leucocyanidin, which accounted for 80.41, 15.60, 1.46, and 0.88% of the sum of the individual phenolic content, respectively. Similarly, the main phenolic components acquired by EtOH-UAE and Acetone-UAE were cyanidin, 2,4-dibromophenol, and vanillin, which accounted for 81.86, 16.24, and 1.50% (EtOH-UAE) and 90.94, 7.60, and 0.93% (Acetone-UAE) of the sum of the individual phenolic content, respectively. The cyanidin content (78.06–335.89 μg/g DW) was the highest among all the individual phenolic compounds, with DES-UAE affording the highest cyanidin content (p < 0.05). Meanwhile, the 2,4-dibromophenol content varied within the range of 0.23–59.80 μg/g DW. EtOH-UAE afforded the highest content, which was 1.07-fold of that acquired by DES-UAE (p < 0.05). In addition, among all the tested extraction methods, DES-UAE afforded the highest contents of the other main phenolic components, including ferulic acid, vanillin, quercetin, quercitrin, trans-cinnamic acid, 4-bromophenol, p-coumaric acid, and leucocyanidin. These results confirm the high extraction efficiency of DES-UAE for extracting phenolics from A. taxiformis. They also show the significant differences in the phenolic profiles of the extracts obtained by the different extraction methods, which are in accordance with previously reported data (11, 13).
It is generally accepted that extraction methods contribute to the phenolic profiles and extraction yield (28, 30). Indeed, there are significant differences in the TPC, phenolic profiles, and antioxidant ability of S. polycystum extracts acquired by various solvents (11). Similarly, the phenolic profiles of P. scandens and C. longa are greatly affected by the extraction solvents 9, 13). In this study, we observed that the different extraction solvents (Bet-Lev, water, 70% ethanol, 70% methanol and 70% acetone), under the same UAE and extraction parameters, contributed to the variations in TPC, phenolic profiles, and antioxidant activities of A. taxiformis. These results imply that the extraction solvent has a significant effect on the phenolic extraction efficiency that is primarily derived from the difference in the solvent polarity (28, 30). Among the extraction solvents used in this study, Bet-Lev may have the most similar polarity to those of the phenolic compounds in A. taxiformis. This DES also has the advantage of strong hydrogen-bond basicity, which improves the intermolecularly interactive effects between the cellulose strands and Bet-Lev (10). Finally, the assisted extraction technology employed also contributed to the phenolic extraction efficiency. As a commonly used assisted extraction technology, UAE has been widely reported to enhance the extraction efficiency of phytochemicals, utilizing acoustic cavitation to interrupt the cell-wall structure (9, 12). Thus, we concluded that UAE using Bet-Lev as the extracting DES solvent is efficient in phenolic extraction from A. taxiformis.
Conclusions
This study showed that UAE processes using different DESs afforded significantly different TPC, wherein UAE using Bet-Lev (1:2) as the extraction solvent afforded the highest TPC. The optimal extraction conditions obtained from the single-factor experiment and subsequent response surface methodology were as follows: water content of DES of 46.48%, ultrasonic temperature of 52.41°C, and liquid-to-solid ratio of 26.99 ml/g. Compared to the traditional solvent-based UAE, DES-UAE afforded the highest TPC and antioxidant ability and detected the most number of individual phenolic compounds and the highest sum of their contents. DES-UAE for phenolics from A. taxiformis is an efficient and environment-friendly method for the preparation of extracts rich in natural antioxidants, which may replace the synthetic antioxdants and widely be used in the fields of food processing, animal husbandry, and aquaculture.
Data availability statement
The original contributions presented in the study are included in the article/supplementary material, further inquiries can be directed to the corresponding author.
Author contributions
HG: methodology, project administration, and writing—original draft. YW: resources, investigation, and project administration. ZG: validation and writing—review and editing. YL: data curation and software. QW: formal analysis and funding acquisition. JX: conceptualization, funding acquisition, supervision, and writing—review and editing. All authors contributed to the article and approved the submitted version.
Funding
This study was supported by the National Natural Science Foundation of China (31960483), the Natural Science Foundation of Hainan Province of China (320RC510), the Key Research & Development project of Hainan Province of China (ZDYF2021XDNY197), and the State Key Laboratory of Marine Resource Utilization in South China Sea (Hainan University) (No. MRUKF2021002).
Conflict of interest
The authors declare that the research was conducted in the absence of any commercial or financial relationships that could be construed as a potential conflict of interest.
Publisher's note
All claims expressed in this article are solely those of the authors and do not necessarily represent those of their affiliated organizations, or those of the publisher, the editors and the reviewers. Any product that may be evaluated in this article, or claim that may be made by its manufacturer, is not guaranteed or endorsed by the publisher.
Abbreviations
A. taxiformis, Asparagopsis taxiformis; UAE, ultrasound-assisted extraction; DES, deep eutectic solvent; Bet-lev, DES synthesized with betaine and levulinic acid; TPC, total phenolic content; GAE, gallic acid equivalent; DES-UAE, ultrasound-assisted extraction with deep eutectic solvents; DW, dry weight; UHPLC-MS, ultra-high-performance liquid chromatography-mass spectrometry; Water-UAE, ultrasound-assisted extraction with water; MeOH-UAE, ultrasound-assisted extraction with 70% methanol; EtOH-UAE, ultrasound-assisted extraction with 70% ethanol; Acetone-UAE, ultrasound-assisted extraction with 70% acetone; FRAP, ferric-reducing antioxidant power; ABTS, 2, 2′-azino-bis(3-ethylbenzthiazoline)-6-sulfonic acid; Fe(II)E, FeSO4 equivalent; TE, Trolox equivalent.
References
1. Laboratory of Marine Biology of Institute of South China Sea Oceanography of Chinese Academy of Sciences. Marine Medicinal Organisms in the South China Sea. Beijjing: Science Press (1978).
2. Nunes N, Ferraz S, Valente S, Barreto MC, Carvalho MAAP. Biochemical composition, nutritional value, and antioxidant properties of seven seaweed species from the Madeira Archipelago. J Appl Phycol. (2017) 29:2427–37. doi: 10.1007/s10811-017-1074-x
3. Machado L, Magnusson M, Paul NA, Kinley R. de-Nys R, Tomkins N. Identification of bioactives from the red seaweed Asparagopsis taxiformis that promote antimethanogenic activity in vitro. J Appl Phycol. (2016) 28:3117–26. doi: 10.1007/s10811-016-0830-7
4. Greff S, Zubia M, Genta-Jouve G, Massi L, Perez T, Thomas OP. Mahorones, highly brominated cyclopentenones from the red alga Asparagopsis taxiformis. J Nat Prod. (2014) 77:1150–5. doi: 10.1021/np401094h
5. Mellouk Z, Benammar I, Krouf D, Goudjil M, Okbi M, Malaisse W. Antioxidant properties of the red alga Asparagopsis taxiformis collected on the North West Algerian coast. Exp Ther Med. (2017) 13:3281–90. doi: 10.3892/etm.2017.4413
6. Cotas J, Leandro A, Monteiro P, Pacheco D, Figueirinha A, Goncalves AMM, et al. Seaweed phenolics: from extraction to applications. Mar Drugs. (2020) 18:384. doi: 10.3390/md18080384
7. Dong H, Dong S, Erik HP, Stagos D, Lin X, Liu M. Progress of bromophenols in marine algae from 2011 to 2020: structure, bioactivities, and applications. Mar Drugs. (2020) 18:411. doi: 10.3390/md18080411
8. Wu Y, Gao H, Wang Y, Peng Z, Guo Z, Ma Y, et al. Effects of different extraction methods on contents, profiles, and antioxidant abilities of free and bound phenolics of Sargassum polycystum from the South China Sea. J Food Sci. (2022) 87:968–81. doi: 10.1111/1750-3841.16051
9. Patil SS, Pathak A, Rathod VK. Optimization and kinetic study of ultrasound assisted deep eutectic solvent based extraction: a greener route for extraction of curcuminoids from Curcuma longa. Ultrason Sonochem. (2020) 70:105267. doi: 10.1016/j.ultsonch.2020.105267
10. Redha AA. Review on extraction of phenolic compounds from natural sources using green deep eutectic solvents. J Agric Food Chem. (2021) 69:878–912. doi: 10.1021/acs.jafc.0c06641
11. Wu L, Li L, Chen S, Wang L, Lin X. Deep eutectic solvent-based ultrasonic-assisted extraction of phenolic compounds from Moringa oleifera L. leaves: optimization, comparison and antioxidant activity. Sep Purif Technol. (2020) 247:117014. doi: 10.1016/j.seppur.2020.117014
12. Bhargava N, Mor RS, Kumar K, Sharanagat VS. Advances in application of ultrasound in food processing: a review. Ultrason Sonochem. (2020) 70:105293. doi: 10.1016/j.ultsonch.2020.105293
13. Liu Y, Zhe W, Zhang R, Peng Z, Wang Y, Gao H, et al. Ultrasonic-assisted extraction of polyphenolic compounds from Paederia scandens (Lour) Merr using deep eutectic solvent: optimization, identification, and comparison with traditional methods. Ultrason Sonochem. (2022) 86:106005. doi: 10.1016/j.ultsonch.2022.106005
14. Juric T, Uka D, Holló B, Jovic B, Kordic B, Popovic BM. Comprehensive physicochemical evaluation of choline chloride-based natural deep eutectic solvents. J Mol Liq. (2021) 343:116968. doi: 10.1016/j.molliq.2021.116968
15. Hoppe J, Byzia E, Szymańska M, Drozd R, Smiglak M. Acceleration of lactose hydrolysis using beta-galactosidase and deep eutectic solvents. Food Chem. (2022) 384:132498. doi: 10.1016/j.foodchem.2022.132498
16. Flamini R, Vedova AD, Cancian D, Panighel A, De-Rosso M. GC/MS-positive ion chemical ionization and MS/MS study of volatile benzene compounds in five different woods used in barrel making. J Mass Spectrom. (2013) 42:641–6. doi: 10.1002/jms.1193
17. Jager LS, Perfetti GA, Diachenko GW. Arivalagan termination of coumarin, vanillin, and ethyl vanillin in vanilla extract products: liquid chromatography mass spectrometry method development and validation studies. J Chromatogr A. (2007) 1145:83–8. doi: 10.1016/j.chroma.2007.01.039
18. Arivalagan M, Roy TK, Yasmeen AM, Pavithra KC, Jwala PN, Shivasankara KS, et al. Extraction of phenolic compounds with antioxidant potential from coconut (Cocos nucifera L) test and identification of phenolic acids and flavonoids using UPLC coupled with TQD-MS/MS. LWT – Food Sci. (2018) 92:116–26. doi: 10.1016/j.lwt.2018.02.024
19. Mattonai M, Parri E, Querci D, Degano I, Ribechini E. Development and validation of an HPLC-DAD and HPLC/ESI-MS2 method for the determination of polyphenols in monofloral honeys from Tuscany (Italy). Microchem J. (2016) 126:220–9. doi: 10.1016/j.microc.2015.12.013
20. Naveen J, Baskaran R, Baskaran V. Profiling of bioactives and in vitro evaluation of antioxidant and antidiabetic property of polyphenols of marine algae Padina tetrastromatica. Algal Res. (2021) 55:102250. doi: 10.1016/j.algal.2021.102250
21. Akhtar N, Thadhani VM, Haq FU, Khan MN, Musharraf SG. Rapid identification and quantification of bioactive metabolites in processed Camellia sinensis samples by uhplc-esi-ms/ms and evaluation of their antioxidant activity. J Ind Eng Chem. (2020) 90:419–26. doi: 10.1016/j.jiec.2020.07.047
22. Olate-Gallegos C, Barriga A, Vergara C, Fredes C, García P, Giménez B. Identifification of polyphenols from Chilean brown seaweeds extracts by LC-DAD-ESI-MS/MS. J Aqua Food Prod T. (2019) 28:375–91. doi: 10.1080/10498850.2019.1594483
23. Chen X, Xu L, Guo S, Wang Z, Jiang L, Wang F, et al. Profiling and comparison of the metabolites of diosmetin and diosmin in rat urine, plasma and feces using UHPLC-LTQ-Orbitrap MS(n). J Chromatogr B Analyt Technol Biomed Life Sci. (2019) 1124:58–71. doi: 10.1016/j.jchromb.2019.05.030
24. Kim SB, Lee T, Lee HS, Song CK, Cho HJ, Kim DD, et al. Development and validation of a highly sensitive LC-MS/MS method for the determination of acacetin in human plasma and its application to a protein binding study. Arch Pharm Res. (2016) 39:213–20. doi: 10.1007/s12272-015-0697-1
25. Venditti A, Serrilli AM, Rizza L, Frasca G, Cardile V, Bonina FP, et al. Aromadendrine, a new component of the flavonoid pattern of Olea europaea L. and its anti-inflammatory activity. Nat Prod Res. (2013) 27:340–9. doi: 10.1080/14786419.2012.693924
26. Yang J, iQian D, Jiang S, Shang E, Guo J, Duan J. Identification of rutin deglycosylated metabolites produced by human intestinal bacteria using UPLC–Q-TOF/MS. J Chromatogr B. (2012) 898:95–100. doi: 10.1016/j.jchromb.2012.04.024
27. Chen PX, Tang Y, Marcone MF, Pauls PK, Zhang B, Liu R, et al. Characterization of free, conjugated and bound phenolics and lipophilic antioxidants in regular- and non-darkening cranberry beans (Phaseolus vulgaris L). Food Chem. (2015) 185:298–308. doi: 10.1016/j.foodchem.2015.03.100
28. Gil-Martin E, Forbes-Hernandez T, Romero A, Cianciosi D, Giampieri F, Battino M. Influence of the extraction method on the recovery of bioactive phenolic compounds from food industry by-products. Food Chem. (2022) 378:131918. doi: 10.1016/j.foodchem.2021.131918
29. Vázquez-González M, Fernández-Prior Á, Bermúdez-Oria A, Rodríguez-Juan EM, Pérez-Rubio AG, Fernández-Bolaños J, et al. Utilization of strawberry and raspberry waste for the extraction of bioactive compounds by deep eutectic solvents. LWT – Food Sci Technol. (2020) 130:109645. doi: 10.1016/j.lwt.2020.109645
30. Santos SAO, Felix R, Pais ACS, Rocha SM, Silvestre AJD. The quest for phenolic compounds from Macroalgae: a review of extraction and identification methodologies. Biomolecules. (2019) 9:847. doi: 10.3390/biom9120847
31. Acosta-Estrada BA, Gutierrez-Uribe JA, Serna-Saldivar SO. Bound phenolics in foods, a review. Food Chem. (2014) 152:46–55. doi: 10.1016/j.foodchem.2013.11.093
32. Hmani I, Ktari L, Ismail A, Mallell C, El Bour M. Assessment of the antioxidant and antibacterial properties of red algae (Rhodophyta) from the north coast of Tunisia. Euro-Mediterr J Envi. (2021) 6:13. doi: 10.1007/s41207-020-00222-7
33. Pinteus S, Alves C, Monteiro H, Araújo E, Horta A, Pedrosa R. Asparagopsis armata and Sphaerococcus coronopifolius as a natural source of antimicrobial compounds. World J Microb Biot. (2015) 31:445–51. doi: 10.1007/s11274-015-1797-2
34. Farvin KHS, Jacobsen C. Phenolic compounds and antioxidant activities of selected species of seaweeds from Danish coast. Food Chem. (2013) 138:1670–81. doi: 10.1016/j.foodchem.2012.10.078
35. Yoshie-Stark Y, Hsieh P, Suzuki T. Distribution of flavonoids and related compounds from seaweeds in Japan. Tokyo Univ Fish. (2003) 89:1–6.
36. Maghraby YR, Farag MA, Kontominas MG, Shakour ZT, Ramadan AR. Nanoencapsulated extract of a red seaweed (Rhodophyta) species as a promising source of natural antioxidants. ACS Omega. (2022) 7:6539–48. doi: 10.1021/acsomega.1c05517
37. Ben-Saad H, Gargouri M, Kallel F, Chaabene R, Boudawara T, Jamoussi K, et al. Flavonoid compounds from the red marine alga Alsidium corallinum protect against potassium bromate-induced nephrotoxicity in adult mice. Environ Toxicol. (2017) 32:1475–86. doi: 10.1002/tox.22368
38. Mekinić IG, Skroza D, Šimat V, Hamed I, Cagalj M, Perković ZP. Phenolic content of brown algae (Pheophyceae) species: extraction, identification, and quantification. Biomolecules. (2019) 9:244. doi: 10.3390/biom9060244
39. Tanna B, Choudhary B, Mishra A. Metabolite profiling, antioxidant, scavenging and anti-proliferative activities of selected tropical green seaweeds reveal the nutraceutical potential of Caulerpa spp. Algal Res. (2018) 36:96–105. doi: 10.1016/j.algal.2018.10.019
Keywords: phenolic, ultrasound-assisted extraction, Asparagopsis taxiformis, deep eutectic solvent, antioxidant ability
Citation: Gao H, Wang Y, Guo Z, Liu Y, Wu Q and Xiao J (2022) Optimization of ultrasound-assisted extraction of phenolics from Asparagopsis taxiformis with deep eutectic solvent and their characterization by ultra-high-performance liquid chromatography-mass spectrometry. Front. Nutr. 9:1036436. doi: 10.3389/fnut.2022.1036436
Received: 04 September 2022; Accepted: 31 October 2022;
Published: 17 November 2022.
Edited by:
Natalia S. Podio, ICYTAC-CONICET-UNC, ArgentinaReviewed by:
Rita Celano, University of Salerno, ItalySelin Sahin Sevgili, Istanbul University, Turkey
Copyright © 2022 Gao, Wang, Guo, Liu, Wu and Xiao. This is an open-access article distributed under the terms of the Creative Commons Attribution License (CC BY). The use, distribution or reproduction in other forums is permitted, provided the original author(s) and the copyright owner(s) are credited and that the original publication in this journal is cited, in accordance with accepted academic practice. No use, distribution or reproduction is permitted which does not comply with these terms.
*Correspondence: Juan Xiao, xiaojuan209218@163.com