Transcriptome Analysis Reveals the Anti-cancerous Mechanism of Licochalcone A on Human Hepatoma Cell HepG2
 Jun Wang
 Bo Wei
 Kiran Thakur
 Chu-Yan Wang1
  Zhao-Jun Wei
- 1School of Biological Food and Environment, Hefei University, Hefei, China
- 2School of Food and Biological Engineering, Hefei University of Technology, Hefei, China
- 3School of Biological Science and Engineering, North Minzu University, Yinchuan, China
Hepatocellular carcinoma is a malignancy with a low survival rate globally, and there is imperative to unearth novel natural phytochemicals as effective therapeutic strategies. Licochalcone A is a chalcone from Glycyrrhiza that displayed various pharmacological efficacy. A globally transcriptome analysis was carried out to reveal the gene expression profiling to explore Licochalcone A's function as an anti-cancer phytochemical on HepG2 cells and investigate its potential mechanisms. Altogether, 6,061 dysregulated genes were detected (3,414 up-regulated and 2,647 down-regulated). SP1 was expected as the transcription factor that regulates the functions of most screened genes. GO and KEGG analysis was conducted, and the MAPK signaling pathway and the FoxO signaling pathway were two critical signal pathways. Protein-protein interaction (PPI) network analysis based on STRING platform to discover the hub genes (MAPK1, ATF4, BDNF, CASP3, etc.) in the MAPK signaling pathway and (AKT3, GADD45A, IL6, CDK2, CDKN1A, etc.) the FoxO signaling pathway. The protein level of essential genes that participated in significant pathways was consistent with the transcriptome data. This study will provide an inclusive understanding of the potential anti-cancer mechanism of Licochalcone A on hepatocellular, signifying Licochalcone A as a promising candidate for cancer therapy.
Introduction
Liver cancer is the sixth malignant neoplasm and is the fourth leading cause of cancer death worldwide (1). Hepatocellular carcinoma (HCC) affects 75% of patients with liver cancer (2). The pathogenesis of HCC is considered a complicated progression mainly influenced with complex factors (3). The environmental factors, eating habits, smoking, and alcohol consumption are related to the pathogenesis of HCC (4). In recent decades, the main principles of HCC treatment are operation, radiotherapy, and chemotherapy. However, all these strategies have been inadequate due to toxic side effects, drug resistance, and limited effectiveness (5, 6). Hence, there is an urgent need to explore potential HCC therapeutic methods.
The genus Glycyrrhiza, also known as licorice, includes two important species: Glycyrrhiza uralensis Fisch. and Glycyrrhiza glabra L. which are widely spread in Asia, Europe, America, and Africa (7). The Glycyrrhiza genus is widely used for food and medicinal purposes. The sweetness of Glycyrrhiza makes it widely used as a confectionary and condiments. It also contains various nutrition, such as saponins and chalcones, which enabled it to display antioxidant, antiproliferative, anti-inflammation, and immunoregulatory activities (8). It contains diverse phytochemicals such as saponins and chalcones. Licochalcone A (LCA), a chalcone extracted from licorice roots, demonstrated potential pharmacological properties in asthma, obesity, and radical scavenging and anti-cancer activity (9). Notably, multiple studies reported that LCA could block the metastasis in multiple cancer cells as prostate cancer cells PC-3, gastric cancer cells MKN-28 and MKN-45, osteosarcoma cells HOS and MG-63, lung cancer cells A549 and H460, breast cancer cell MDA-MB-231, and hepatoma cell HepG2 (9–14) in vitro. Nevertheless, the transcriptomics-based mechanism has not been fully elucidated.
RNA sequencing (RNA-seq) is a high-throughput sequencing developed in the next-generation sequencing technology context (15). RNA-seq can directly sequence the cDNA translated by the RNA, and the attained readings can then be matched to a reference genome to accomplish the transcriptional map. RNA-seq is an effective method for in-depth transcriptome exploration and is extensively applied in the biomedical field (16). Compared with other transcriptome methods such as DNA microarrays, RNA-seq has the advantage of high reproducibility, high accuracy, and low signal interference (17).
According to our previous study, LCA caused HepG2 cytotoxicity with IC50 (65.96 μM) after 24 h, induced cell cycle arrest and apoptosis, and elevated the cellular ROS levels in HepG2 cells (9). In the current study, the transcriptome profiling in LCA-treated Human Hepatoma cells HepG2 was conducted by RNA-seq technology to understand the underlying metabolic and signaling pathways. A progressed recognition of mechanism of action exerted by LCA at the omics levels will promote innovatively and effective therapeutic strategies to strive against HCC.
Materials and Methods
Materials
LCA (purity 91.12%) was extracted from Glycyrrhiza, which was obtained from Xingjiang province, China (9). The culture medium defined fetal bovine serum, and antibiotics (penicillin and streptomycin) were acquired from the Hyclone lab (Logan, UT, USA). The cell strain of human hepatoma cell HepG2 was obtained from Shanghai Wei atlas biological technology co., LTD. Antibodies were procured from Cell Signaling Technology (MA, USA).
Cell Culture Conditions and Treatments
HepG2 was cultured in the culture medium supplemented with 10% fetal bovine serum and 1% antibiotics at 37°C in a humidified atmosphere of 5% CO2 (18). The cells (3 × 10⁵) were seeded on 100 × 20 mm dishes and incubated overnight. After the treatment with 70 μM of LCA for 24 h, the cells were required. Non-exposed cells were used as controls.
Total RNA Isolation and Detection
The total RNA was extracted by the RNA simple Total RNA Kit (TIANGEN, Beijing, China). Each treatment had three duplicates (Control 1, Control 2, and Control 3; Treat A1, Treat A2, and Treat A3). The total RNA purity and integrity were evaluated by Agilent Technologies 2,100 Bioanalyzer. Then the integrated and purified RNA was quantified and examined spectrophotometrically. The samples were considered acceptable when the total amount of RNA was > 15 μg, the concentration was > 200 ng/μL, and the A260/A280 ratio ranged between 1.8 and 2.2.
cDNA Library Construction and Sequencing
The RNA-Seq process was completed at the Shanghai Personal Biotechnology (Shanghai, China) (19). For RNA-seq, the cDNA libraries were constructed using the mRNA-Seq sample preparation kit (Illumina, San Diego, USA). Briefly, the mRNA with polyA structure in the total RNA was enriched by poly-T oligo attached magnetic beads (Invitrogen, CA, USA). And then, the mRNA was regimented into small segments at a higher temperature. Then, these short pieces were used as templates to synthesize the first-strand cDNA with random hexamers primers and reverse transcriptase (Invitrogen, CA, USA). Subsequently, second-strand cDNA synthesis was completed with RNase H and DNA polymerase I. After the second strand was synthesized, the base T was replaced by U, thus achieving the strand-specific library.
These double-stranded cDNA segments were end-repaired, and a single “A” base and ligation of adapters were added. The altered suitable components were then isolated through agarose gel electrophoresis to achieve the final paired-end cDNA libraries with a proper length (250–350 bp). Later, RNA-seq was completed on the Illumina NextSeq500 platform (Illumina, San Diego, CA, USA).
Reads Processing and Assembly
The Cutadapt was utilized to filter low-quality reads (the base number of the mass value of Q ≤ 10 accounts for more than 20% of the entire read), the adaptor read, the N ratio of more than 5% of the reads from the raw reads to obtain the clean reads for further analysis. Then, the clean reads were blasted onto the human reference genome using Hisat2. Simultaneously, Q20 and Q30 were calculated. Three replicates were evaluated to minimize experimental errors, and filtered high-quality data was utilized for all downstream analyses. Raw Illumina sequences were uploaded to the National Center for Biotechnology Information Databank (NCBI) (accession number: PRJNA777752).
DEGs Analysis
To analyze the expression of differential expression genes (DEGs), the quantification of DEGs is necessary. Thus, the gene expression was normalized as fragments per kilobase of transcript per million mapped reads (FPKM) (16). The adjusted P-values were accustomed following the Benjamini- Hochberg method for regulating the false discovery rate (FDR). DESeq software was used to detect DEG based on|log2FoldChange| > 1, with P-value < 0.05. The principal component analysis (PCA) of each sample was implemented on the significantly expressed genes. The correlation heat map was generated by the R package, and the volcano plots were accomplished by the OmicStudio tools (https://www.omicstudio.cn/tool).
RNA-Seq Results Validation
14 DEGs Were Randomly Chosen to Validate the Sequencing Data by Quantitative Real-Time PCR (qRT-PCR). According to the Rigorous Principle, Every Primer for the Reaction Was Designed From the Primer 5.0 Software (Premier Biosoft International, Palo Alto, CA) According to the Thorough Guide (Table 1). Expression of β-Actin Was Utilized as an Internal Control (20). After RNA extraction with RNAsimple Total RNA Kit (TIANGEN, Beijing, China), the isolated RNA pellet was dissolved in 40 uL of ddH2O, and the concentrations and purity were evaluated by the Nanodrop ND2000 (Thermo Fisher). First-strand cDNA synthesis and qRT-PCR reaction were performed using FastKing One-Step RT-qPCR Kit (SYBR) (TIANGEN, Beijing, China). The qRT-PCR assays were set up on the LightCycler platform (Roche Diagnostics, Indianapolis, IN) with iTaq Universal SYBR Green Supermix Kit (Bio-Rad, USA). The 20 μL assay systems were as followed: 1μL of cDNA template, 0.8 μL of 10 μM primers, 10 μL SYBR Green Supermix, and 7.4 μl of ddH2O. The cycling conditions included a denaturation step at 95°C for 3 min, followed by 40 cycles at 95°C for 5 s and, and a final step of 60°C for 30 s. All the samples were run in triplicates, and the data were analyzed according to the 2−ΔΔCt method.
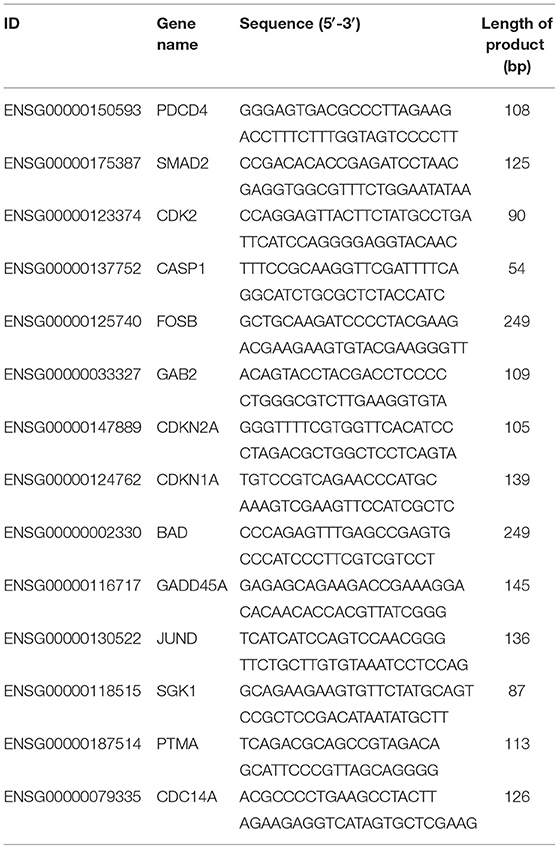
Table 1. List of primers used in the present study.
Upstream Transcription Factors Prediction
The upstream transcription factors (TFs) of assessed DEGs were predicted utilizing FunRich software, a self-governing tool primarily for functional enrichment analysis of enriched genes of transcription factor pathways (21). The screened elevated and depressed DEGs were uploaded to calculate the top predicted TFs.
Functional-Enrichment and Pathway Analysis
The Gene Ontology (GO) classification system (http://geneontology.org/) was applied to determine the possible functions of all the DEGs. The results were based on three independent ontologies: “biological process” (BP), “cellular component” (CC), and “molecular function” (MF). GO enrichment analysis blasted all the DEGs to terms in the GO database and screened out the significantly enriched GO terms of DEGs by a hypergeometric test with the complete genome as the background.
Kyoto Encyclopedia of Genes and Genomes (KEGG) (http://www.genome.jp/kegg) is a collection of databases that integrates data from genomic, chemical and system functions. Pathway enrichment analysis was conducted via the KEGG database to identify significantly enriched metabolic or signal transduction pathways, and the pathways with P-values < 0.05 were defined as significantly enriched pathways.
Analysis of Hub Genes in Significantly Enriched Pathways
As a search platform, including the comprehensive protein-protein interaction (PPI) information, the STRING database delivers a PPI valuation and assemblies. In this exploration, the detected targets were uploaded to the STRING database (http://www.string-db.org/). PPI node pairs with a medium score ≥ 0.4 were filtered out. A Cytoscape-module identified as cytoHubba v0.1 (https://apps.cytoscape.org/apps/cytohubba) (22) was employed to determine the hub genes by evaluating node scores according to relevant algorithms (Degree Centrality, Betweenness Centrality, and Closeness Centrality).
Western Blot
The treated HepG2 cells were washed with PBS and lysed with RIPA buffer (Sigma-Aldrich, USA) for 30 min until all the cell pellets were completely dissolved. After that, the cells were centrifuged at 14,000 rpm/min for 3 min and the supernatant was connected. Then the protein concentration was quantified by a BCA assay kit and 20–40 μg of each protein sample was separated by SDS-PAGE and located onto the PVDF membrane. After blocking with the blocking buffer (Beyotime, China), the membrane was incubated with a primary antibody (1/1,000 dilution) (Cell Signaling Technology, USA) at 4°C overnight, followed by secondary antibody (1/3,000 dilution) (Cell Signaling Technology, USA) for 1 h at room temperature. The signals were captured using a BeyoECL Sta Kit (Beyotime, China). β-actin was utilized as a reference control.
Statistical Analysis
In this study, One-way ANOVA with a t-test at p < 0.05 was conducted by SPSS 18.0. The Origin 2019 (Origin Labs) software was used to formulate the figures. Except otherwise stated, mean ± SD (n ≥ 3) was used for data expression.
Results
Transcriptome Sequence and Assembly
After eliminating the short and redundant reads, 45,105,590 (99.47%), 42,016,916 (99.47%), 43,653,726 (98.87%) clean reads from the control groups (Control 1, Control 2, and Control 3); and 40,769,130 (98.61%), 46,280,800 (99.41%), and 40,711,164 (99.46%) clean reads from the LCA-treated groups (Treat A1, Treat A2, and Treat A3) were obtained (Table 2). The scores of Q20 and Q30 in every sample were higher. In addition, 38,111,391 (84.49%), 38,156,266 (90.81%), and 40,769,640 (93.39%) clean reads from the control groups; 37,349,404 (91.61%), 41,332,943 (89.31%), and 36,367,891 (89.33%) clean reads from the LCA-treated groups were obtained, which successfully matched to the reference genome. Thus, it showed that the transcriptome data prepared with good qualities was suitable for advanced bioinformatic evaluation.
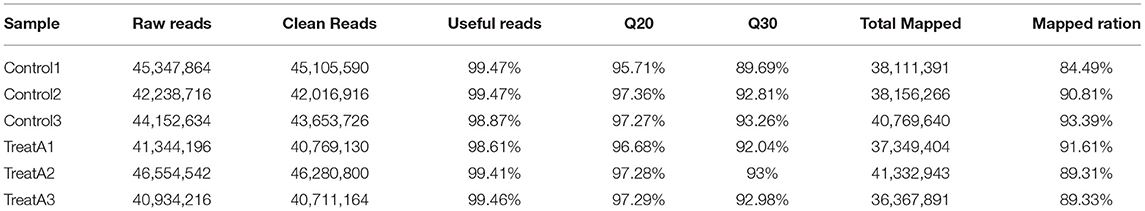
Table 2. Statistical analysis of the RNAs Libraries.
Identification and Analysis of DEGs
In Figure 1, the PCA analysis of these data demonstrated that each group was distinct from the other. In the heat map displayed in Figure 2, the genes were horizontally listed, one sample per column, red signified high expression genes, and green signified low expression genes. The heat map representation revealed a similarity in the transcriptomes within the three triplicate runs of the untreated group (Control 1, Control 2, and Control 3) and LCA treated group (Treat A 1, Treat A 2, and Treat A 3), respectively. However, as Figure 2 depicted, the expression of two different groups are distinguished clearly, consistent with the PCA analysis. DEGs analysis revealed that 6,061 genes were differentially expressed significantly between the LCA and control groups. As shown in the volcano map of DEGs (Figure 3), 3,414 genes were elevated and 2,647 genes were depressed.
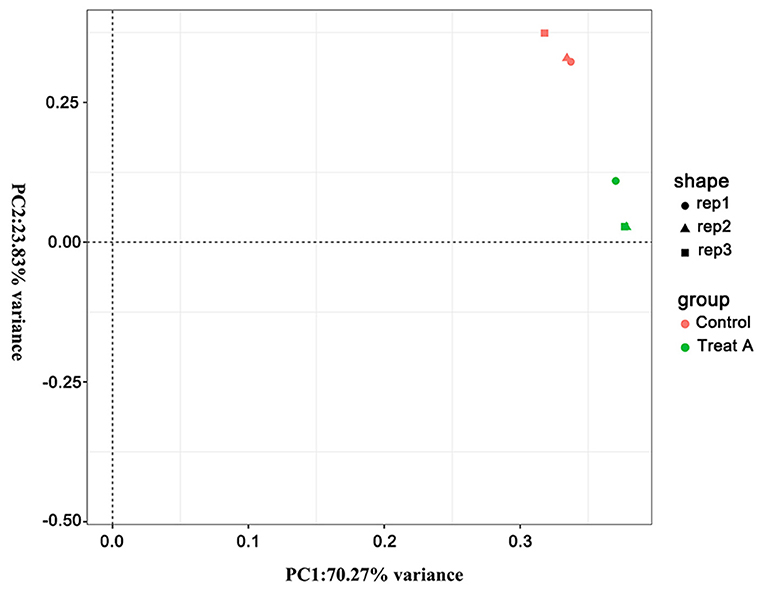
Figure 1. The PCA analysis of all samples. Different shapes represent different samples, different colors represent different groups.
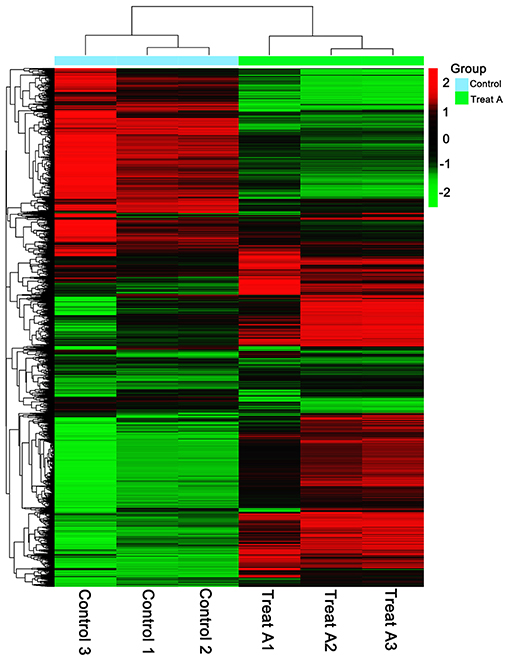
Figure 2. Heat map of lower (green) and higher (red) DEGs expression levels.
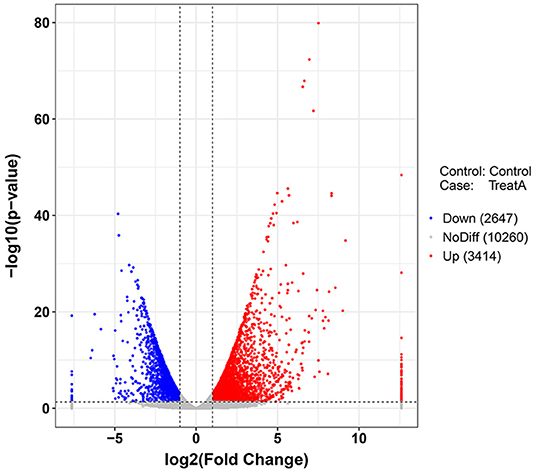
Figure 3. Volcano plot (p < 0.05) of down-regulated (blue) and up-regulated (red) DEGs expression levels. The blue bar indicates the percent of genes enriched to the transcript factors. The orange bar indicates the reference significance p = 0.05. The red bar indicates the significance of enrichment.
Validation of DEGs by qRT-PCR
14 DEGs Were Selected for qRT-PCR Analyses to Confirm the RNA-Seq Results. According to the qRT-PCR Data, the Tendency of 14 Chosen MRNAs Covering eight up-Regulated and six Down-Regulated MRNAs Were Following the Transcriptome Results (Figure 4). For Example, the Expression Levels of PDCD4 From qRT-PCR and RNA-Seq Were−2.86 and−1.96, respectively. The Corresponding Expression Levels of BAD From qRT-PCR and RNA-Seq Were 1.95 and 2.42, respectively. Our Data Indicated That Above Results of Transcriptomics Data Were Reliable.
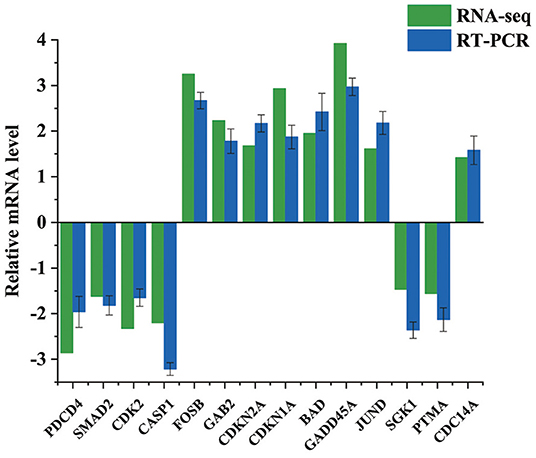
Figure 4. Validation of the DEGs by qRT-PCR. Bars show the relative expression level of DEGs. All the values were log2 transformed.
Upstream Transcription Factors Prediction
Upstream TFs of candidate elevated and depressed DEGs were predicted by FunRich. The top 10 TFs for increased and decreased DEGs were presented in Figures 5A,B, respectively. For increased DEGs, the top 10 TFs were HENMT1, NHLH1, STRA13, PPARG, RREB1, EGR1, CTCF, KLF7, SP4, and SP1. For decreased DE-miRNAs, the top 10TFs were MEF2A, NRF1, HOXA5, GFI1, LHX4, LHX3, SP1, ARID3A, NKX6-1, and POU2F1.
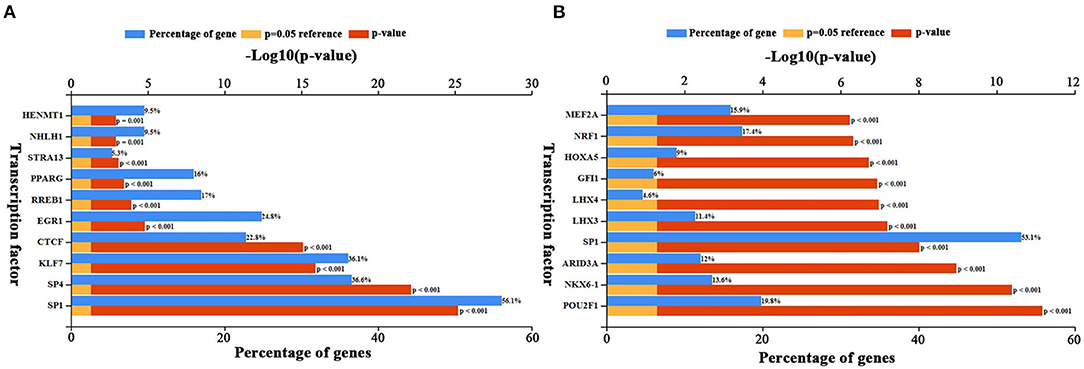
Figure 5. Predicted transcription factors of DEGs. (A) Transcription factors of up-regulated DEGs. (B) Transcription factors of down-regulated DEGs. The blue bars indicate the percentge of genes enriched to the transcription factor. The yellow bars indicate the reference significant enrichment (P-value = 0.05). The red bars indicate significant enrichment.
GO Enrichment and Classification Analysis
The significantly enriched GO terms were showed in Table 3. These DEGs were significantly enriched in the cellular component organization or biogenesis (GO:0071840) with the P-value = 7.75E-19; cellular component organization (GO:0016043) with the P-value = 9.95E-19; cellular metabolic process (GO:0044237) with the P-value = 1.13E-16; metabolic process (GO:0008152) with the P-value =1.2E-16; primary metabolic process (GO:0044238) with the P-value = 1.82E-15 in the biological process (BP)-associated category. In the cell component (CC) -associated category, the most significant GO terms were intracellular part (GO:0044424) with the P-value = 9.83E-70; intracellular (GO:0005622) with the P-value = 4.59E-61; intracellular membrane-bounded organelle (GO:0043231) with the P-value = 1.38E-58; membrane-bounded organelle (GO:0043227) with the P-value = 1.03E-57 and intracellular organelle part (GO:0044446) with the P-value = 2.25E-56. Furthermore, the most significantly enriched in the molecular function (MF) -associated category were protein binding (GO:0005515) with the P-value = 6.21E-56; binding (GO:0005488) with the P-value = 3.67E-44; heterocyclic compound binding (GO:1901363) with the P-value = 5.73E-16; organic cyclic compound binding (GO:0097159) with the P-value =7.69E-16 and enzyme binding (GO:0019899) with the P-value =1.51E-13.
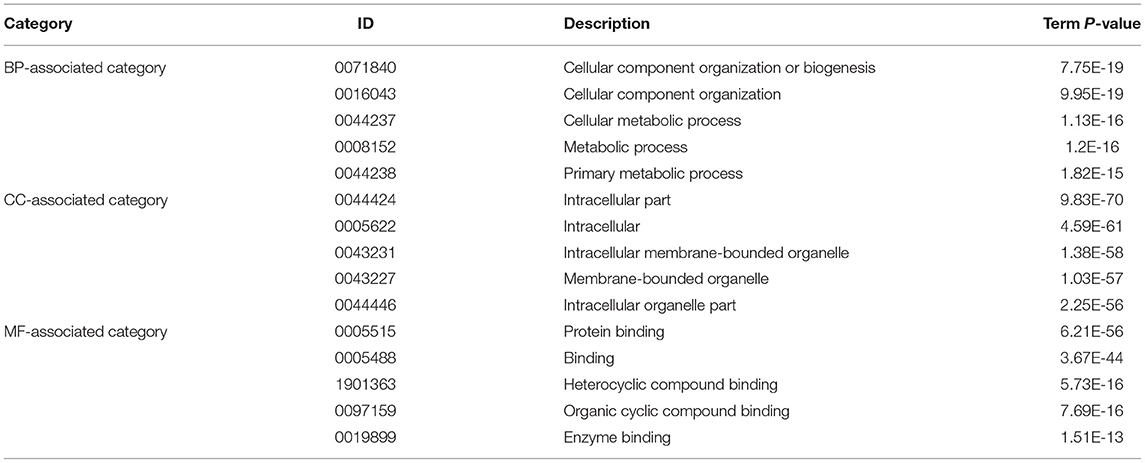
Table 3. The most significantly enriched GO terms.
KEGG Pathway Analysis
According to the KEGG pathway analysis, the DEGs were enriched into 263 identified pathways. And the identified pathways were classified into 33 subclasses of five main categories. For example, four of them belonged to the cellular process, three of them were connected with environmental information processing, four were related to genetic information processing, 12 pertained to metabolism, and 10 were associated with organism systems. And the signal transduction was the most enriched sub classification as shown in Figure 6A. Correspondingly, to further acknowledge the most significant pathways, the bubble chart of Figure 6B exhibited the top 20 significantly enriched pathways. As it is depicted, the DEGs were enriched in pathways as the MAPK signaling pathway, the FoxO signaling pathway, the P53 signaling pathway, the cell cycle, and the apoptosis. A total of 102 DEGs were enriched in the MAPK signaling pathway, including 63 increased genes and 39 down-regulated genes. A sum of 102 DEGs was enriched in the FoxO signaling pathway, including 30 increased genes and 28 decreased genes.
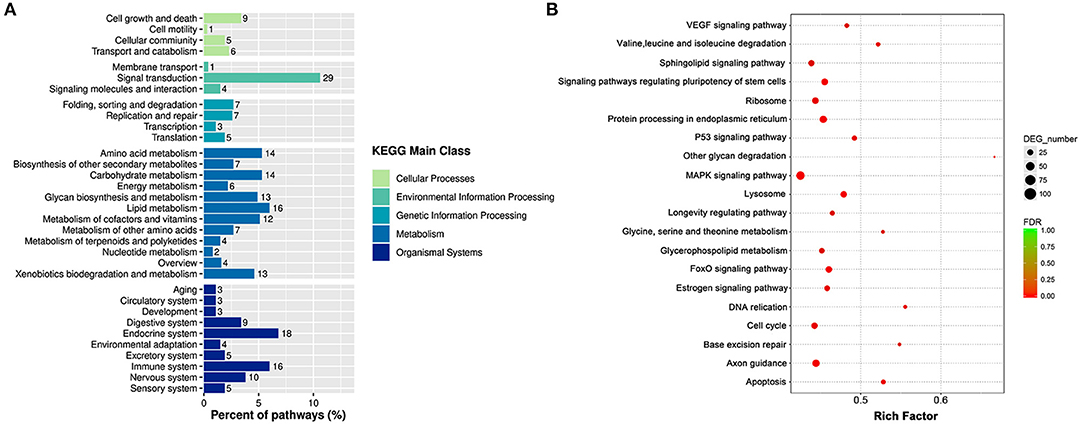
Figure 6. The KEGG enrichment analyses of DEGs. (A) Histogram of KEGG pathways based on the enrichment classification. (B) Scatter diagram of signal transduction pathways of KEGG.
Analysis of Hub Genes in Significantly Enriched Pathways
A PPI network was developed for the DEGs that participated in the MAPK signaling pathway, including 97 connected nodes and 818 edges (Figure 7A). Through relevant topology calculation, the top 30 nodes were filtered. Later, 23 overlapped genes amongst these top 30 nodes were selected as hub genes (Table 4), including ATF4, BDNF, CASP3, CDC42, FGF2, FOS, HRAS, HSPB1, IL1B, JUN, KRAS, MAP2K1, MAP2K3, MAP2K6, MAPK1, MAPK11, MAPK13, MAPK14, MAPK3, MAPK9, PRKACB, RELA, and SOS1 (Figure 7B). The PPI network of DEGs in the FoxO signaling pathway, which included 55 connected nodes and 310 edges as illustrated in Figure 8A. For hub gene identification, the degree algorithm in the Cytohubba packages was used to identify the top 30 nodes. And 23 shared genes overlapped these 30 nodes were filtered as hub genes (Table 5), including AKT3, ATM, BCL2L11, CAT, CCNB1, CDK2, CDKN1A, GADD45A, HRAS, IL6, KRAS, MAP2K1, MAPK1, MAPK14, MAPK3, NRAS, PDPK1, SGK1, SLC2A4, SMAD2, SOD2, SOS1, and STK11 (Figure 8B).
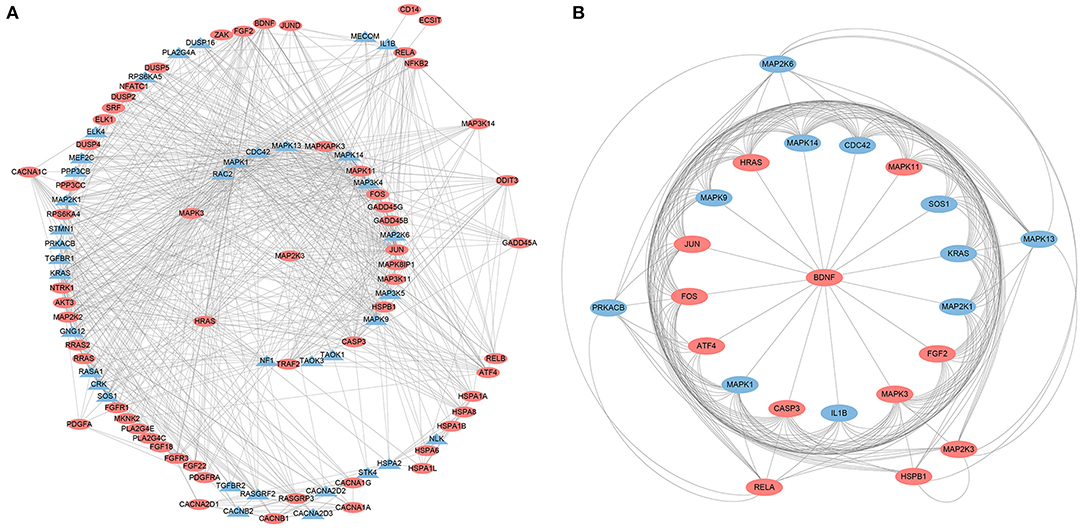
Figure 7. The PPI analysis of DEGs in the MAPK signaling pathways. (A) The entire PPI network of annotated interactions between genes. (B) A sub-network module for the hub genes. Red circles represent up-regulated genes, blue circles represent down-regulated genes.
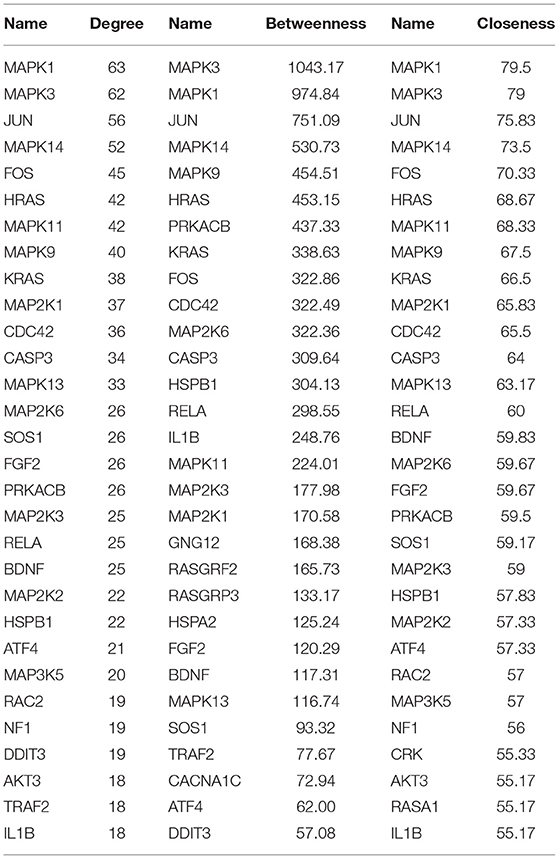
Table 4. Top 30 nodes of PPI network in the MAPK signaling pathway.
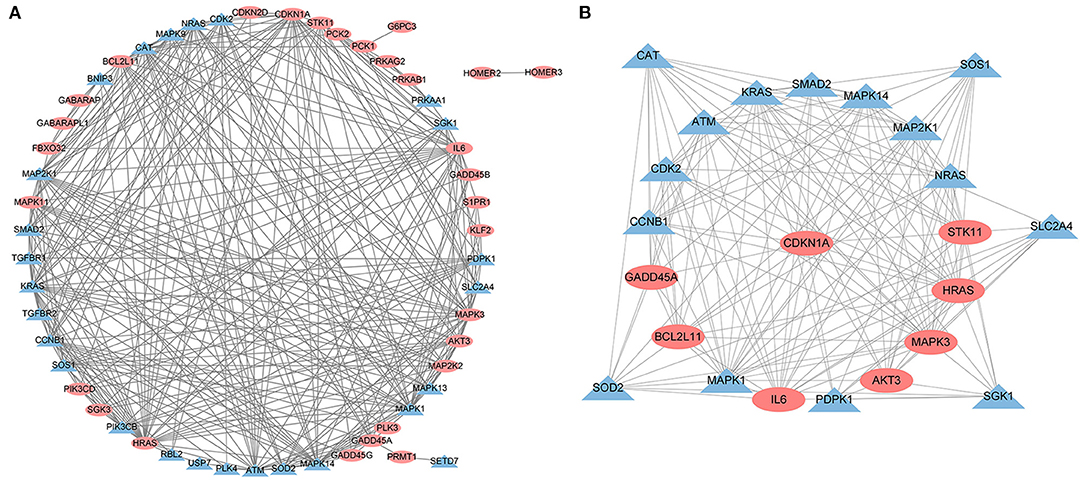
Figure 8. The PPI analysis of DEGs in the FoxO signaling pathways. (A) The entire PPI network of annotated interactions between genes. (B) A sub-network module for the hub genes. Red circles represent up-regulated genes, blue circles represent down-regulated genes.
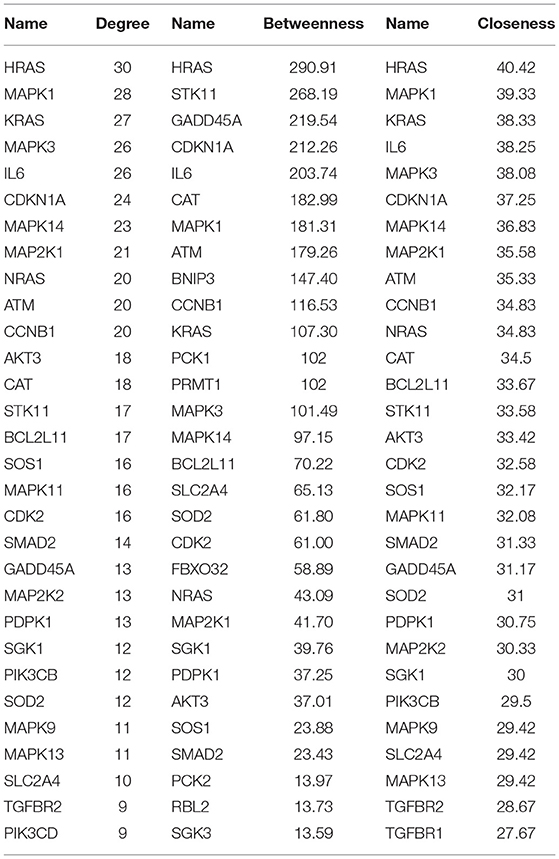
Table 5. Top 30 nodes of PPI network in the FoxO signaling pathway.
Detecting of DEGs in Significantly Enriched Pathways by Western Blot Assay
Through transcriptome data analysis, some essential genes (CDKN1A, GAB2, CDKN2A, CASP1, CDK2, PDCD4, and SMAD4) related to significant pathways were screened and further analyzed. HepG2 cells were treated with different concentrations of LCA (0μM, 30 μM, 50 μM, and 70 μM) for 24h, and then the above genes were selected for protein level analysis. The protein expression of CDKN1A, GAB2, and CDKN2A was significantly up-regulated, while the protein expression of CASP1, CDK2, PDCD4, and SMAD2 were down-regulated (Figure 9).
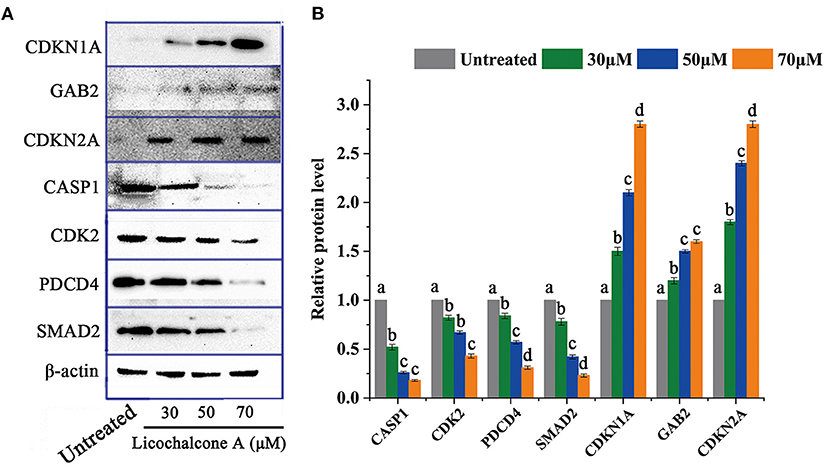
Figure 9. The protein level of DEGs in critical signaling pathways. (A) Protein expression profile. (B) Expression levels of related proteins. Significant differences between the two groups were denoted by different letters (p < 0.05).
Discussion
Lately, HCC has appeared as a principal cause of cancer-related mortality. Though the death rate of HCC has decreased owing to better-quality medical environments, many people still suffer from it every year. Glycyrrhiza is a prospective resource for food and medical purposes with low toxicity. According to the Food and Drug Administration (FDA) declaration, the Glycyrrhiza root extract is generally recognized as safe. And the European Food Safety Authority (EFSA) panel also states that the licorice extract as a food additive is safe for the main human adult population up to 100 mg on daily basis (7).
LCA, recognized as a chalcone extracted from Glycyrrhiza, possesses anti-cancer abilities. Our previous study reported that LCA derived from Glycyrrhiza could restrain cell viability, induce cell cycle arrest and apoptosis, and elevate the cellular ROS levels in HepG2 (8). The underlying mechanism of the anti-cancer activities of LCA remains elusive. The acknowledgment of the transcriptome level in the progression of LCA-induced anti-cancer effects on Human hepatoma cell HepG2 which can illustrate the fundamental mechanism to develop new agents for HCC.
As an efficient molecular biology tool, RNA-seq delivers extraordinary details about transcriptional machinery of an organism (23). We screened all the transcripts of HepG2 cells stimulated by LCA. RNA-seq analysis found 6,061 DEGs between the LCA and control groups, including 3,414 elevated genes and 2,647 down-regulated genes. Based on the obtained DEGs, the TFs prediction, GO, and KEGG analysis, PPI networks were performed to investigate the effect of LCA on the HepG2 cells.
TFs are a group of proteins that can bind DNA recognition sites to govern genomic transcription. Various studies have indicated that gene expression can be regulated by TFs (24). Thus, we predicted the TFs that can restrict these DEGs. SP1, a zinc-finger TF that preferentially attaches to many GC-rich motifs of promoter region (25), can regulate the most screened DEGs expression. It can act as a critical factor to modulate the mRNA profile. For example, a recent study has proved that SP1 is involved in the PI3K/Akt signaling pathway, thereby contributing to tumor angiogenesis and hepatocellular development (26). EGR1, a member of TFs regulating cell proliferation and differentiation, can be rapidly and transiently induced by multiple factors, such as cytokines and mechanical stresses (27). It has been proved that EGR1 can regulate CBX8 to exhibit oncogenic activity in HCC (28). KLF7 can regulate cell growth and differentiation in multiple tissues and organs (29). KLF7 bound to the promoter of Ccdc85c aggravated the HCC progression. CTCF controls the metallothionein family's transcription activity in HCC, and editing CTCF binding sites provides a novel hint for cancer treatment (30). The POU2F1 transcription factor is one of the most critical regulatory proteins in humans and other mammals. The promoted expression of POU2F1 accelerates the growth and metastasis of HCC through the FAT1 signaling pathway (31). HOXA5, which encoded a DNA-binding transcription factor, can control gene expression, cell morphogenesis, and differentiation in various cancer cells. A previous study found that HOXA5 inhibits invasion and metastasis of HCC by regulating the expression of UBC9 (32). MEF2A altered histone acetylation seems to play a crucial part in regulating gene transcription and carcinogenesis. The over expression of MEF2A activated hepatic cells participate in the pathogenesis of HCC (33). GFI1 interacts with other cofactors to block the transcription process in cells. In HCC, GFFI can mediate long non-coding RNA to restrain the cancer cell metastasis (34).
GO is a globally standardized functional category system of genes that delivers an updated controlled vocabulary to illustrate the properties of genes in organisms comprehensively. The GO databank comprises three categories of genes as MF, CC, and BP. From the results, the BP aspect was mainly enriched in cell metabolism and compound synthesis types. And as for the CC category, the genes were primarily enriched in the nucleus aspect. Besides, protein binding, ATP binding, DNA binding, and other functions were found in the MF category. In brief, the GO analysis correlates the DEGs with regulating the metabolic process, intracellular structure, and binding activities related to cancer progression.
KEGG is a utility database to exhibit complex functional and biological systems, generating statistics from the molecular level. One of the most prominent KEGG pathway analysis features is integrating the genome, chemistry, and system functions and visualizing the network of intermolecular interactions through powerful graphics functions. In the current study, the KEGG analysis specified that these DEGs were significantly enriched in the signal transduction category. And the MAPK signaling pathway and the FoxO signaling pathway are identified as significant pathways. The MAPK signaling pathway performs a crucial part in extracellular signal transduction into cellular responses. The MAPK signaling pathway amplifies and integrates signals from various stimuli and triggers appropriate physiological responses, including inflammation and apoptosis in mammalian cell proliferation, differentiation, and development (35). Many phytonutrients are reported to suppress metastasis through the MAPK signaling pathway in HepG2 cells (36). KEGG analysis in the present study identified 102 DEGs in connection with the MAPK signaling pathway. The PPI network depleted 23 hub genes in the MAPK signaling pathway, such as MAPK1, MAPK3 MAPK11, MAPK13, MAPK14, ATF4, BDNF, CASP3, etc. MAPK1 functions as a negative regulator for MAPKs and reduces oxidative stress involved in mitochondrial damages and cell death activation. And ATF4 can block the MAPK1 expression (37). MAPK3 was one of the first identified MAP kinases, participated in the cell-cycle process and controlled cell survival and apoptosis by regulating both the expression and the activity of proapoptotic proteins (38). MAPK11, MAPK13 and MAPK14 were members of p38 MAPKs (39). The p38 MAPKs was one of the four major MAPKs cascades and played an important role in cellular responses evoked by extracellular stimuli such as proinflammatory cytokines or physical stress. The p38 MAPKs also had high sequence homology with CDK family members, thus could cooperate with CDKs, and regulate the cell cycle. For liver tumorigenesis, the p38 MAPKs were essential for the cancer cell cycle progression and are identified as the promising therapeutic targets for the disease (40). BDNF participates in the activation of MAPKs and is a novel functional protein in HCC (41). CASP3 is the upstream binding factor in the MAPK signaling pathway. Anticarcinogen stimulates apoptosis of HCC through damaging mitochondria and activating CASP3 (42). Recent reports have revealed novel roles of the FoxO signaling pathway in cell proliferation and tumorigenesis. Many phytochemicals are reported to display their anti-cancer activities by mediating the FoxO signaling pathway. For example, the extract of Aegiceras corniculatum induced apoptosis on human colorectal cancer via the FoxO signaling pathway (43). It is renowned that the FoxO signaling pathway exerts an enormous function in HCC etiology. In this study, 26 hub genes related to the FoxO signaling pathway were screened out, such as AKT3, CDK2, CDKN1A, GADD45A, IL6, etc. AKT3 is often hyper activated in cancer disease and functions as a biomarker for therapy strategies. The disorder of AKT3 can promote spontaneous HCC (44). GADD45A acts as a stress sensor for cell damage and forms a complex with CDKN1A to administer the cell cycle process. IL6 is a pro-inflammatory cytokine response to phytochemicals (45). In HCC, the dysregulation of IL6 is responsible for anticarcinogen resistance (46).
The protein level of essential genes that participated in significant pathways was consistent with the relevant research. In this study, the protein level of CDKN1A, GAB2, and CDKN2A were elevated while the others were decreased. CASP1, as a vital member of the Caspases family, is involved in the MAPK signaling pathway, cell apoptosis, and other signaling pathways. Studies have shown that abnormal expression of CASP1 can induce cell apoptosis (47). CDK2 in cyclin, as an essential component of cell cycle mechanism, can form CDK2/cyclin E complex with cyclin E, and it is mainly active CDK2/cyclin A complex and phosphorylated E2F in the S phase of the cell cycle and remains in the nucleus in the form of CDK2 in G2 phase. A previous study revealed that phytochemicals could target the CDK2 to treat HCC (48). PDCD4, also known as a programmed cell death protein, participates in the apoptotic signaling pathway and acts as an inhibitor of tumorigenic transformation. For HCC, the dysregulated PDCD4 is testified to relate to the metastatic potential of cells (49). SMAD2 are critical components of intracellular pathways, which participate in many signal pathways such as the FoxO signaling pathway, cell cycle, etc. SMAD2 targets various DNA-binding proteins and regulates cell transcriptional response. The activation of SMAD2 can induce the epithelial-mesenchymal transition and invasion in HCC (50). Tumor suppressor gene CDKN1A, also known as p21, inhibits cell cycle progression, participates in the FoxO signal pathway, cell cycle, and p53 signal pathway. CDKN1A forms heterotrimeric complexes with cycle-dependent kinases. When CDKN1A is combined with CDK2, it can inhibit kinase activity and block the progress of the cell cycle. Some studies have shown that it can promote cell senescence, and the expression of CDKN1A in cancer cells often changes. The silencing of CDKN1A can promote the cell cycle, migration, and epithelial-mesenchymal transition progression of HCC (46). CDKN2A, known as P16, is a classical tumor inhibitor gene in various types of cancers. It regulates the cell cycle and the p53 signaling pathway. The reactivation of P16 exhibits antitumor potency in HCC (51). GAB2 is identified as an oncogene and binds to cell membrane receptors and downstream effectors to accelerate cell cancer. GAB2 mediates the process of HCC by integrating multiple signaling pathways (52).
Conclusion
In conclusion, this study is the first effort to evaluate the effect of LCA on the transcriptome profile for HepG2 cells. Based on an inclusive analysis of DEGs, TFs enrichments, GO, and KEGG analysis elucidated that LCA induced the anti-cancerous activity on HepG2 cells, in which the MAPK signaling pathway and the FoxO signaling pathway played an essential role. The protein level of essential genes that participated in significant pathways was consistent with the transcriptome data. These findings implied that LCA could be implemented as a promising functional food ingredient and assist therapy in HCC, promoting a comprehensive view of its anti-cancer effects. The RNA-sequencing data at the high-throughput platform provided potential biomarkers to discover novel therapeutic targets for HCC.
Data Availability Statement
Raw Illumina sequences were uploaded to the National Center for Biotechnology Information Databank (NCBI) (accession number: PRJNA777752).
Author Contributions
JW: investigation, conceptualization, writing (original draft), and funding acquisition. BW: investigation, conceptualization, and validation. KT: writing (review and editing). K-XL and C-YW: software and formal analysis. Z-JW: supervision and funding acquisition. All authors contributed to the article and approved the submitted version.
Funding
This study was supported by the Hefei University Scientific Research and Development Fund (20ZR09ZDB) and the talent fund of Hefei University (20RC48).
Conflict of Interest
The authors declare that the research was conducted in the absence of any commercial or financial relationships that could be construed as a potential conflict of interest.
Publisher's Note
All claims expressed in this article are solely those of the authors and do not necessarily represent those of their affiliated organizations, or those of the publisher, the editors and the reviewers. Any product that may be evaluated in this article, or claim that may be made by its manufacturer, is not guaranteed or endorsed by the publisher.
Abbreviations
LCA, Licochalcone A; HCC, Hepatocellular carcinoma; RNA-seq, RNA sequencing; DEGs, Different expression genes; FPKM, Fragments per kilobase of transcript per million mapped reads; TFs, Transcriptional factors; qRT-PCR, Quantitative real-time PCR; GO, Gene Ontology; KEGG, Kyoto Encyclopedia of Genes and Genomes; PPI, Protein-protein interaction; BP, Biological process; CC, Cell component; MF, Molecular function; PCA, Principal component analysis; FDA, Food and Drug Administration; NCBI, National Center for Biotechnology Information Databank.
References
1. Allemani C, Weir HK, Carreira H, Harewood R, Spika D, Wang XS, et al. Global surveillance of cancer survival 1995–2009: analysis of individual data for 25 676 887 patients from 279 population-based registries in 67 countries (CONCORD-2). Lancet. (2015) 385:977–1010. doi: 10.1016/S0140-6736(14)62038-9
2. Ely A, Bloom K, Maepa MB, Arbuthnot P. Recent update on the role of circular RNAs in hepatocellular carcinoma. J Hepatocell Carcinoma. (2021) 8:1–17. doi: 10.2147/JHC.S268291
3. Li S, Saviano A, Erstad DJ, Hoshida Y, Fuchs BC, Baumert T, et al. Risk factors pathogenesis and strategies for hepatocellular carcinoma prevention: emphasis on secondary prevention and its translational challenges. J Clin Med. (2020) 9:3817. doi: 10.3390/jcm9123817
4. Abdul-Latif M, Townsend K, Dearman C, Shiu KK, Khan K. Immunotherapy in gastrointestinal cancer: the current scenario and future perspectives. Cancer Treat Rev. (2020) 88:102030. doi: 10.1016/j.ctrv.2020.102030
5. Farcas M, Gavrea A-A, Gulei D, Ionescu C, Irimie A, Catana CS, et al. SIRT1 in the development and treatment of hepatocellular carcinoma. Front Nutr. (2019) 6:00148. doi: 10.3389/fnut.2019.00148
6. Yim SY, Kang SH, Shin JH, Jeong YS, Sohn BH, Um SH, et al. Low ARID1A expression is associated with poor prognosis in hepatocellular carcinoma. Cells. (2020) 9:2002. doi: 10.3390/cells9092002
7. Rizzato G, Scalabrin E, Radaelli M, Capodaglio G, Piccolo O. A new exploration of licorice metabolome. Food Chem. (2017) 221:959–68. doi: 10.1016/j.foodchem.2016.11.068
8. Sharifi-Rad J, Quispe C, Herrera-Bravo J, Belén LH, Kaur R, Kregiel D, et al. Glycyrrhiza genus: enlightening phytochemical components for pharmacological and health-promoting abilities. Oxid Med Cell Longev. (2021) 2021:7571132. doi: 10.1155/2021/7571132
9. Wang J, Zhang YS, Thakur K, Hussain SS, Zhang JG, Xiao GR, et al. Licochalcone A from licorice root an inhibitor of human hepatoma cell growth via induction of cell apoptosis and cell cycle arrest. Food Chem Toxicol. (2018) 120:407–17. doi: 10.1016/j.fct.2018.07.044
10. Fu Y, Hsieh TC, Guo J, Kunicki J, Lee MYWT, Darzynkiewicz Z, et al. Licochalcone-A a novel flavonoid isolated from licorice root (Glycyrrhiza glabra) causes G2 and late-G1 arrests in androgen-independent PC-3 prostate cancer cells. Biochem Biophys Res Commun. (2004) 322:263–70. doi: 10.1016/j.bbrc.2004.07.094
11. Xiao XY, Hao M, Yang XY, Ba Q, Li M, Ni SJ, et al. Licochalcone A inhibits growth of gastric cancer cells by arresting cell cycle progression and inducing apoptosis. Cancer Lett. (2011) 302:69–75. doi: 10.1016/j.canlet.2010.12.016
12. Lin RC, Yang SF, Chiou HL, Hsieh SC, Wen SH, Lu KH, et al. Licochalcone A-induced apoptosis through the activation of p38 MAPK pathway mediated mitochondrial pathways of apoptosis in human osteosarcoma cells in vitro and in vivo. Cells. (2019) 8:1441. doi: 10.3390/cells8111441
13. Qiu C, Zhang T, Zhang W, Zhou L, Yu B, Wang W, et al. Licochalcone A inhibits the proliferation of human lung cancer cell lines A549 and H460 by inducing G2/M cell cycle arrest and ER stress. Int J Mol Sci. (2017) 18:1761. doi: 10.3390/ijms18081761
14. Huang WC, Su HH, Fang LW, Wu SJ, Liou CJ. Licochalcone A inhibits cellular motility by suppressing E-cadherin and MAPK Signaling in breast cancer. Cells. (2019) 8:218. doi: 10.3390/cells8030218
15. Bao XY, Li SL, Gao YN, Wang JQ, Zheng N. Transcriptome analysis revealed that aflatoxin M1 could cause cell cycle arrest in differentiated Caco-2 cells. Toxicolo in vitro. (2019) 59:35–43. doi: 10.1016/j.tiv.2019.03.035
16. Jiang L, Peng LL, Cao YY, Thakur K, Hu F, Tang SM, et al. Transcriptome analysis reveals gene expression changes of the fat body of silkworm (Bombyx mori L) in response to selenium treatment. Chemosphere. (2020) 245:125660. doi: 10.1016/j.chemosphere.2019.125660
17. Sabino M, Carmelo VAO, Mazzoni G, Cappelli K, Capomaccio S, Ajmone-Marsan P, et al. Gene co-expression networks in liver and muscle transcriptome reveal sex-specific gene expression in lambs fed with a mix of essential oils. BMC Genomics. (2018) 19:236–236. doi: 10.1186/s12864-018-4632-y
18. Gabbia D, Carpi S, Sarcognato S, Cannella L, Colognesi M, Scaffidi M, et al. The extra virgin olive oil polyphenol oleocanthal exerts antifibrotic effects in the liver. Front Nutr. (2021) 8:715183. doi: 10.3389/fnut.2021.715183
19. Ding X, Yu Q, Hou K, Hu X, Wang Y, Chen Y, et al. Indirectly stimulation of DCs by ganoderma atrum polysaccharide in intestinal-like Caco-2/DCs co-culture model based on RNA-seq. J Funct Foods. (2020) 67:103850. doi: 10.1016/j.jff.2020.103850
20. Dai G, Chen X, He Y. The gut microbiota activates ahr through the tryptophan metabolite kyn to mediate renal cell carcinoma metastasis. Front Nutr. (2021) 8:712327. doi: 10.3389/fnut.2021.712327
21. Pathan M, Keerthikumar S, Ang CS, Gangoda L, Quek CYJ, Williamson NA, et al. FunRich: an open access standalone functional enrichment and interaction network analysis tool. Proteomics. (2015) 15:2597–601. doi: 10.1002/pmic.201400515
22. Chin CH, Chen SH, Wu HH, Ho CW, Ko MT, Lin CY. cytoHubba: identifying hub objects and sub-networks from complex interactome. BMC Syst Biol. (2014) 8:511. doi: 10.1186/1752-0509-8-S4-S11
23. Luckert C, Hessel S, Lenze D, Lampen A. Disturbance of gene expression in primary human hepatocytes by hepatotoxic pyrrolizidine alkaloids: a whole genome transcriptome analysis. Toxicolo in vitro. (2015) 29:1669–82. doi: 10.1016/j.tiv.2015.06.021
24. Dai Z. Transcription factors indirectly regulate genes through nuclear colocalization. Cells. (2019) 8:754. doi: 10.3390/cells8070754
25. Zhang X, Zhuang H, Han F, Shao X, Liu Y, Ma X, et al. Sp1-regulated transcription of RasGRP1 promotes hepatocellular carcinoma (HCC) proliferation. Liver Int. (2018) 38:2006–17. doi: 10.1111/liv.13757
26. Yin P, Zhao C, Li Z, Mei C, Yao W, Liu Y, et al. Sp1 is involved in regulation of cystathionine γ-lyase gene expression and biological function by PI3K/Akt pathway in human hepatocellular carcinoma cell lines. Cell Signal. (2012) 24:1229–40. doi: 10.1016/j.cellsig.2012.02.003
27. Xie X, Li S, Zhu Y, Liu L, Ke R, Wang J, et al. Egr-1 mediates leptin-induced PPARγ reduction and proliferation of pulmonary artery smooth muscle cells. Mol Biol Cell. (2018) 29:356–62. doi: 10.1091/mbc.E17-03-0141
28. Zhang CZ, Chen SL, Wang CH, He YF, Yang X, Xie D, et al. CBX8 exhibits oncogenic activity via AKT/β-Catenin activation in hepatocellular carcinoma. Cancer Res. (2018) 78:51–63. doi: 10.1158/0008-5472.CAN-17-0700
29. Laub F, Aldabe R, Friedrich V, Ohnishi S, Yoshida T, Ramirez F. Developmental expression of mouse krüppel-like transcription factor KLF7 suggests a potential role in neurogenesis. Dev Biol. (2001) 233:305–18. doi: 10.1006/dbio.2001.0243
30. Gong W, Liu Y, Qu H, Liu A, Sun P, Wang X. The effect of CTCF binding sites destruction by CRISPR/Cas9 on transcription of metallothionein gene family in liver hepatocellular carcinoma. Biochem Biophys Res Commun. (2019) 510:530–8. doi: 10.1016/j.bbrc.2019.01.107
31. Zhong Y, Huang H, Chen M, Huang J, Wu Q, Yan GR, et al. POU2F1 over-expression correlates with poor prognoses and promotes cell growth and epithelial-to-mesenchymal transition in hepatocellular carcinoma. Oncotarget. (2017) 8:44082–95. doi: 10.18632/oncotarget.17296
32. Liao Y, Wang C, Yang Z, Liu W, Yuan Y, Li K, et al. Dysregulated Sp1/miR-130b-3p/HOXA5 axis contributes to tumor angiogenesis and progression of hepatocellular carcinoma. Theranostics. (2020)10:5209–24. doi: 10.7150/thno.43640
33. Bai X, Wu LT, Liu Z, Li J, Li D, Xie H, et al. Overexpression of myocyte enhancer factor 2 and histone hyperacetylation in hepatocellular carcinoma. J Cancer Res Clin Oncol. (2008) 134:83–91. doi: 10.1007/s00432-007-0252-7
34. Liu Y, Piao XJ, Xu WT, Zhang Y, Zhang T, Xue H, et al. Calycosin induces mitochondrial-dependent apoptosis and cell cycle arrest and inhibits cell migration through a ROS-mediated signaling pathway in HepG2 hepatocellular carcinoma cells. Toxicol in vitro. (2021) 70:105052. doi: 10.1016/j.tiv.2020.105052
35. Zhang W, Liu HT. MAPK signal pathways in the regulation of cell proliferation in mammalian cells. Cell Res. (2002) 12:9–18. doi: 10.1038/sj.cr.7290105
36. Kumar N, Shrungeswara AH, Mallik SB, Biswas S, Mathew J, Nandakumar K, et al. Pinocembrin-enriched fractions of elytranthe parasitica (L) danser modulates apoptotic and MAPK cellular signaling in HepG2 cells. Anticancer Agents Med Chem. (2018) 18:1563–72. doi: 10.2174/1871520618666180911112127
37. Hocsak E, Szabo V, Kalman N, Antus C, Cseh A, Sumegi K, et al. PARP inhibition protects mitochondria and reduces ROS production via PARP-1-ATF4-MKP-1-MAPK retrograde pathway. Free Radical Biol Med. (2017) 108:770–84. doi: 10.1016/j.freeradbiomed.2017.04.018
38. Kolb RH, Greer PM, Cao PT, Cowan KH, Yan Y. ERK1/2 signaling plays an important role in topoisomerase II poison-induced G2/M checkpoint activation. PLoS ONE. (2012) 7:e50281. doi: 10.1371/journal.pone.0050281
39. Xu W, Liu R, Dai Y, Hong S, Dong H, Wang H. The role of p38γ in cancer: from review to outlook. Int J Biol Sci. (2021) 17:4036–46. doi: 10.7150/ijbs.63537
40. Shi C, Cheng WN, Wang Y, Li DZ, Zhou LN, Zhu YC, et al. p38γ overexpression promotes osteosarcoma cell progression. Aging. (2020) 12:18384–95. doi: 10.18632/aging.103708
41. Guo D, Hou X, Zhang H, Sun W, Zhu L, Liang J, et al. More expressions of BDNF and TrkB in multiple hepatocellular carcinoma and anti-BDNF or K252a induced apoptosis supressed invasion of HepG2 and HCCLM3 cells. J Exp Clin Cancer Res. (2011) 30:97. doi: 10.1186/1756-9966-30-97
42. Wang W, Zhu M, Xu Z, Li W, Dong X, Chen Y, et al. Ropivacaine promotes apoptosis of hepatocellular carcinoma cells through damaging mitochondria and activating caspase-3 activity. Biol Res. (2019) 52:36. doi: 10.1186/s40659-019-0242-7
43. Luo H, Hao E, Tan D, Wei W, Xie J, Feng X, et al. Apoptosis effect of Aegiceras corniculatum on human colorectal cancer via activation of FoxO signaling pathway. Food Chem Toxicol. (2019) 134:110861. doi: 10.1016/j.fct.2019.110861
44. Wang Q, Yu WN, Chen X, Peng XD, Jeon SM, Birnbaum MJ, et al. Spontaneous hepatocellular carcinoma after the combined deletion of akt isoforms. Cancer Cell. (2016) 29:523–35. doi: 10.1016/j.ccell.2016.02.008
45. Singh CK, Chhabra G, Ndiaye MA, Siddiqui IA, Panackal JE, Mintie CA, et al. Quercetin-resveratrol combination for prostate cancer management in TRAMP mice. Cancers. (2020) 12:2141. doi: 10.3390/cancers12082141
46. Li B, Li A, You Z, Xu J, Zhu S. Epigenetic silencing of CDKN1A and CDKN2B by SNHG1 promotes the cell cycle migration and epithelial-mesenchymal transition progression of hepatocellular carcinoma. Cell Death Dis. (2020) 11:823. doi: 10.1038/s41419-020-03031-6
47. Motani K, Kushiyama H, Imamura R, Kinoshita T, Nishiuchi T, Suda T. Caspase-1 protein induces apoptosis-associated speck-like protein containing a caspase recruitment domain (ASC)-mediated necrosis independently of its catalytic activity. J Biol Chem. (2011) 286:33963–72. doi: 10.1074/jbc.M111.286823
48. Zhu Y, Ke KB, Xia ZK, Li HJ, Su R, Dong C, et al. Discovery of vanoxerine dihydrochloride as a CDK2/4/6 triple-inhibitor for the treatment of human hepatocellular carcinoma. Mol Med. (2021) 27:15. doi: 10.1186/s10020-021-00269-4
49. Zhang S, Li J, Jiang Y, Xu Y, Qin C. Programmed cell death 4 (PDCD4) suppresses metastastic potential of human hepatocellular carcinoma cells. J Exp Clin Cancer Res. (2009) 28:71. doi: 10.1186/1756-9966-28-71
50. Yang Y, Liu Q, Li Z, Zhang R, Jia C, Yang Z, et al. GP73 promotes epithelial–mesenchymal transition and invasion partly by activating TGF-β1/Smad2 signaling in hepatocellular carcinoma. Carcinogenesis. (2018) 39:900–10. doi: 10.1093/carcin/bgy010
51. Hu H, Li Z, Chen J, Wang D, Ma J, Wang W, et al. P16 reactivation induces anoikis and exhibits antitumour potency by downregulating Akt/survivin signalling in hepatocellular carcinoma cells. Gut. (2011) 60:710–21. doi: 10.1136/gut.2010.220020
Keywords: Licochalcone A, HepG2 cells, transcriptome analysis, transcription factor, the MAPK signaling pathway, the FoxO signaling pathway
Citation: Wang J, Wei B, Thakur K, Wang C-Y, Li K-X and Wei Z-J (2021) Transcriptome Analysis Reveals the Anti-cancerous Mechanism of Licochalcone A on Human Hepatoma Cell HepG2. Front. Nutr. 8:807574. doi: 10.3389/fnut.2021.807574
Received: 02 November 2021; Accepted: 30 November 2021;
Published: 20 December 2021.
Edited by:
Miguel Angel Prieto Lage, University of Vigo, SpainReviewed by:
Javier E. Alvarez, University of Vigo, SpainMarta Barral Martínez, University of Vigo, Spain
Franklin Chamorro, University of Vigo, Spain
Copyright © 2021 Wang, Wei, Thakur, Wang, Li and Wei. This is an open-access article distributed under the terms of the Creative Commons Attribution License (CC BY). The use, distribution or reproduction in other forums is permitted, provided the original author(s) and the copyright owner(s) are credited and that the original publication in this journal is cited, in accordance with accepted academic practice. No use, distribution or reproduction is permitted which does not comply with these terms.
*Correspondence: Zhao-Jun Wei, zjwei@hfut.edu.cn
†These authors share first authorship