1
Department of Clinical Neuroscience, Imperial College London, London, UK
2
Department of Clinical Neurology, Centre for Functional Magnetic Resonance Imaging of the Brain, University of Oxford, Oxford, UK
The last 15 years have witnessed a steady increase in the number of resting-state functional neuroimaging studies. The connectivity patterns of multiple functional, distributed, large-scale networks of brain dynamics have been recognised for their potential as useful tools in the domain of systems and other neurosciences. The application of functional connectivity methods to areas such as cognitive psychology, clinical diagnosis and treatment progression has yielded promising preliminary results, but is yet to be fully realised. This is due, in part, to an array of methodological and interpretative issues that remain to be resolved. We here present a review of the methods most commonly applied in this rapidly advancing field, such as seed-based correlation analysis and independent component analysis, along with examples of their use at the individual subject and group analysis levels and a discussion of practical and theoretical issues arising from this data ‘explosion’. We describe the similarities and differences across these varied statistical approaches to processing resting-state functional magnetic resonance imaging signals, and conclude that further technical optimisation and experimental refinement is required in order to fully delineate and characterise the gross complexity of the human neural functional architecture.
Spontaneous, or ‘resting-state’, fluctuations in the blood oxygenation level-dependent (BOLD) signal, as measured by functional magnetic resonance imaging (FMRI), may present a valuable data resource for delineating the human neural functional architecture. Consistent, large-scale spatial patterns of coherent signal have been identified in the human brain using both FMRI (Biswal et al., 1995
; Lowe et al., 1998
) and positron emission tomography (PET; Shulman et al., 1997
; Raichle et al., 2001
). Techniques assessing functional connectivity, originally applied to BOLD FMRI data alongside studies of model-driven, task-evoked activation, have also proven useful for resting-state research and have greatly supported and contributed to increasing scientific interest in the spontaneous, or ‘default’ neural activity of the brain at baseline (Gusnard and Raichle, 2001
; Raichle et al., 2001
; Fox and Raichle, 2007
). As outlined in this article, these methods provide useful conceptual complements to the inferences made from task-FMRI data, and hence are increasingly being applied across multiple fields of neuroscience, to further inform our understanding of the fundamental organisation of processing systems in the human brain.
The majority of approaches to analysing resting-state FMRI data have thus far been spatially model-driven, with strong a priori hypotheses regarding the functional connectivity of a small number of brain regions of interest (ROIs) or individual voxel locations of interest. Recently, however, a great deal of attention has been focused on the patterns of connectivity between multiple ROIs within spatially distributed, large-scale networks, characterised via both model-driven (e.g., seed-based correlation analysis; Biswal et al., 1995
; Greicius et al., 2003
; Fox et al., 2005
) and data-driven analyses (e.g., independent component analysis; McKeown et al., 1998
; Kiviniemi et al., 2003
; Beckmann et al., 2005
). These patterns have been variously termed ‘intrinsic connectivity networks’ (Seeley et al., 2007
), or ‘resting-state networks’ (RSNs; Greicius et al., 2003
; Beckmann et al., 2005
; De Luca et al., 2006
). They are purported to reflect the intrinsic energy demands of neuron populations that, via firing together with a common functional purpose, have subsequently wired together through synaptic plasticity (e.g., Saini et al., 2004
; Lewis et al., 2009
). RSNs can be reliably and reproducibly detected at individual subject and group levels across a range of analysis techniques (Greicius et al., 2004
; Damoiseaux et al., 2006
; Shehzad et al., 2009
; Zuo et al., 2010b
).
A characteristic set of co-activating functional systems is found consistently across subjects (Beckmann et al., 2005
; Damoiseaux et al., 2006
; De Luca et al., 2006
; Fox and Raichle, 2007
; Smith et al., 2009
), stages of cognitive development (Fair et al., 2007
; Fransson et al., 2007
), degrees of consciousness (Boly et al., 2008
; Greicius et al., 2008
) and even (to some extent) across species (Vincent et al., 2007
). Moreover, individual networks have been shown to be heritable (Glahn et al., 2010
) and altered resting (and stimulus-guided) functioning of large-scale networks has been found in correlation with individual differences in behavioural performance (Fox et al., 2007
; Kelly et al., 2008
), as well as in disease (Greicius et al., 2004
; Castellanos et al., 2008
; Di Martino et al., 2009
; Seeley et al., 2009
) and under pharmacological manipulation (Anand et al., 2005
; Hong et al., 2009
; Kelly et al., 2009
). Therefore there is compelling evidence for RSNs as core functional networks in the mammalian brain. Accordingly, the increase in resting-state research has resulted in the development of a rich array of signal processing techniques. The following is a summary and review of the most widely applied methods, focussing primarily, but not exclusively, on seed-based correlation analysis (SCA) and independent component analysis (ICA). We discuss the commonalities, differences and potential interpretative pitfalls of these and other techniques, but begin by recapitulating the key characteristics and pre-processing requirements of the data.
Spatiotemporal Characteristics
RSNs are localised to grey matter regions (Beckmann et al., 2005
; De Luca et al., 2006
), and it is now accepted by many that they reflect functional systems supporting core perceptual and cognitive processes. Figure 1
(reproduced from Beckmann et al., 2005
) displays eight RSN maps commonly identified using ICA. These patterns of intrinsic functional connectivity are consistent with stimulus-evoked co-activation patterns in e.g., sensory and motor cortices, language and memory systems and higher cognitive control networks (Biswal et al., 1995
; Lowe et al., 1998
; Cordes et al., 2000
; Hampson et al., 2002
; Beckmann et al., 2005
; Seeley et al., 2007
; Smith et al., 2009
). Indeed, in some instances, subsets of RSNs appear to be either up-regulated or down-regulated during specific cognitive tasks. Thus they may be described as either ‘task-positive’ or (in the case of the DMN) ‘task-negative,’ in terms of the direction of correlation between the mean network activity and the event timings during the task (Shulman et al., 1997
; Gusnard and Raichle, 2001
; Greicius et al., 2003
; Fox et al., 2005
; Kelly et al., 2008
).
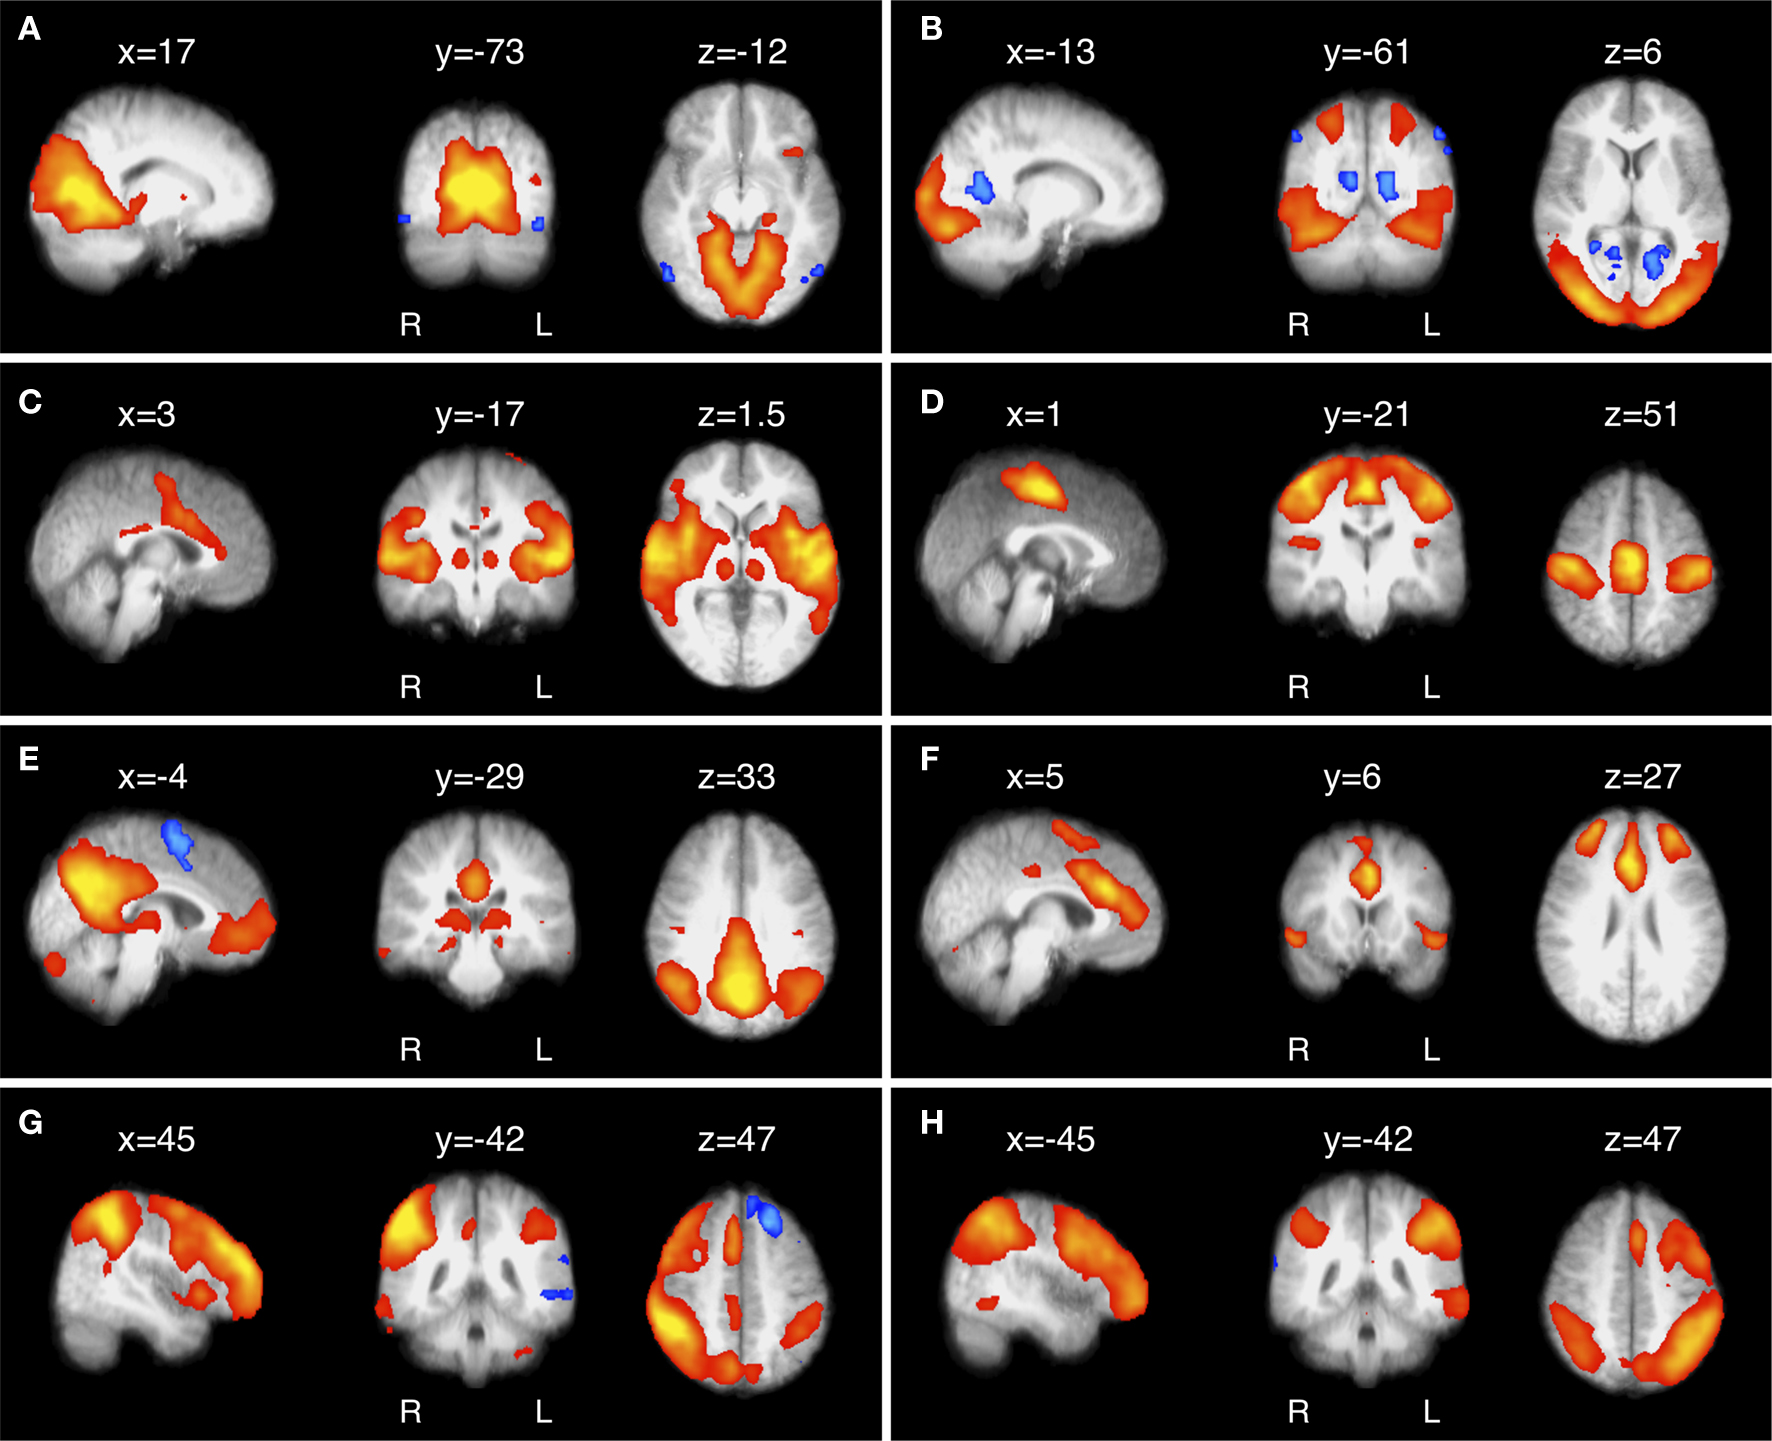
Figure 1. Eight of the most common and consistent RSNs identified by ICA. (A) RSN located in primary visual cortex; (B) extrastriate visual cortex; (C) auditory and other sensory association cortices; (D) the somatomotor cortex; (E) the ‘default mode’ network (DMN), deactivated during demanding cognitive tasks and involved in episodic memory processes and self-referential mental representations; (F) a network implicated in executive control and salience processing; and (G,H) two right- and left-lateralised fronto-parietal RSNs spatially similar to the bilateral dorsal attention network and implicated in working memory and cognitive attentional processes (for further details, see Beckmann et al., 2005
).
RSNs display reliable and consistent functional connectivity patterns with specific thalamic (Zhang et al., 2008
) and cerebellar nuclei (Habas et al., 2009
; Krienen and Buckner, 2009
; O’Reilly et al., 2009
). Studies of RSNs may therefore enable investigations of both cortico-cerebellar and cortico-subcortical connectivity associations, potentially in greater detail than previously achieved with structural connectivity measures. In particular, due to anatomical constraints (resolution limitations), the relationship of the cerebellum with the rest of the brain is currently more measurable with functional connectivity parcellation approaches than, for example, diffusion tensor imaging. Functional connectivity FMRI measures also provide complementary information to that gained from other imaging modalities and structural connectivity metrics, helping to further map and quantify the neural substrates of systems-level function and dysfunction (e.g., Buckner et al., 2005
; Greicius et al., 2009
; Seeley et al., 2009
).
Importantly, the occurrence of these various observations and the networks involved depend on the nature of neural processes being evoked or induced by the paradigm in question, or even the surrounding context of the resting-state scan. Furthermore, subtle changes in analytic approach to resting data, for example using slightly different spatial seeds in SCA (see Figure 2 and also Buckner et al., 2008
; Hayasaka and Laurienti, 2009
), or altering the model order dimensionality estimation in ICA (Kiviniemi et al., 2009
; Smith et al., 2009
), can have a significant impact on the spatial characteristics of the RSNs identified. For both biological and statistical reasons, sub-regions or ‘nodes’ of a given RSN may share ‘non-stationary’ (i.e., time-varying) connectivity relationships within that network or with other identified RSNs (Chang and Glover, 2010
; Cole et al., under review). Inferred characteristic RSN patterns can thereby be affected by multiple factors, in terms of the resultant connectivity relationships within and between networks.
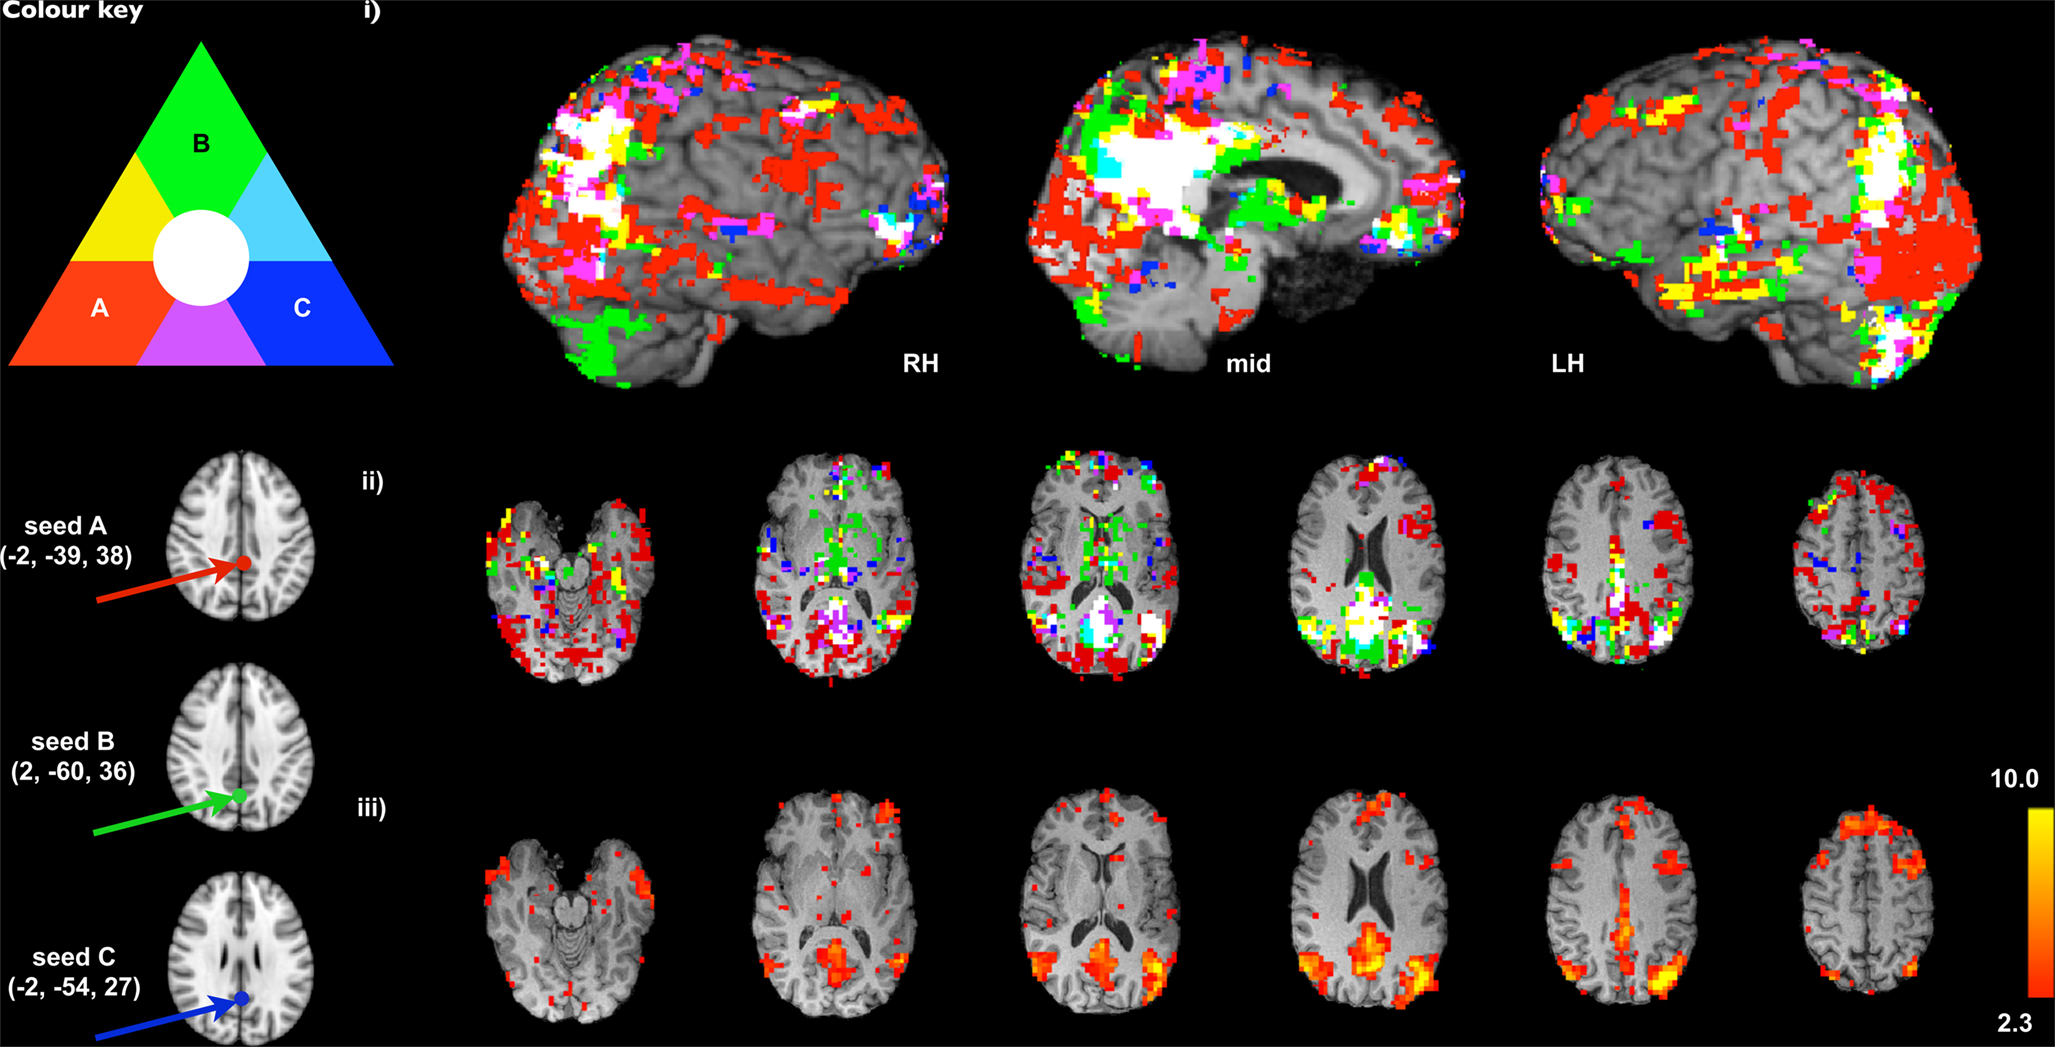
Figure 2. Comparison of SCA-derived versions of the DMN using three different seed voxel locations proposed in the literature (A: Fox et al., 2005
in red; B: Singh and Fawcett, 2008
in green; C: Greicius et al., 2003
, in dark blue). The results of SCA analysis using these seeds are displayed (i) as maximum intensity projections (searching up to 12 voxels below the surface or slice on 3-D renderings of a single subject’s high-resolution MRI; RH = right hemisphere, mid = midline, LH = left hemisphere), and (ii) as binarised thresholded Z-statistic images on selected slices in the space of the subject’s high resolution MRI (cluster-corrected z = 2.3, p < 0.05). It is clear from the extent of primary (non-overlapping) colours visible (largely red and green), particularly in prefrontal, occipital lobes and subcortical regions, that variations inherent in the seed-selection process can result in a large amount of variability into SCA analysis and subsequent interpretations. (iii) ICA-derived DMN map (Colour bar shows Z-statistic values).
Spectral Characteristics
RSNs are consistently referred to in the literature as ‘low-frequency,’ in terms of their spectral power distributions. Early frequency characterisation (Cordes et al., 2000
, 2001
) localised functionally relevant, spontaneous BOLD oscillations in the lower frequency ranges (0.01–0.08 Hz), separable from respiratory (0.1–0.5 Hz) and cardiovascular (0.6–1.2 Hz) signal frequencies. Additionally, more recent FMRI evidence suggests that, while it is true that the predominant spectral power of RSNs appears in practice at low frequencies, the signal contributions that extend into higher frequencies do so with equal consistency (Niazy et al., 2008
). Specifically, it has been shown that filtering RSN signals to account for the frequency content of their haemodynamic response function ‘flattens’ their power distribution from 0.01 Hz up to 0.15 Hz, instead of being biased towards the lower-frequency end of the spectrum (Smith et al., 2008
). This suggests that the low peak power characteristics of BOLD FMRI-derived RSNs are largely induced by the haemodynamics and that underlying RSN ‘neural’ dynamics may be more ‘broadband’ than previously thought. Note that many artefactual signals have spectral peaks that are either truly within similar low frequency ranges seen with RSNs, or are aliased by the FMRI temporal sampling into these ranges (e.g., Birn et al., 2008
); however it has also been shown that some methods such as ICA and RETROICOR can be used to significantly reduce or even remove these confounds (see below).
RSNs and Electrophysiological Recordings
Some groups have acquired simultaneous FMRI and electroencephalography (EEG) resting data, and report evidence of associations between RSN network activity and specific power profiles within broader EEG frequency spectra (e.g., Laufs et al., 2003
; Mantini et al., 2007
). With respect to questions regarding the frequency-specificity of resting FMRI data, and their somewhat indirect relationship with broadband EEG spectra, it remains unclear if low-frequency BOLD oscillations can be interpreted as relating directly to the oscillatory activity of neuronal assemblies. Valuable multimodal research with BOLD FMRI and direct electrophysiological recordings, for example in the primary sensory cortices of non-human primates (Logothetis et al., 2001
; Goense and Logothetis, 2008
), encourages inferred associations between activity in these two data types, despite their characteristic differences in terms of temporal resolution and underlying neurophysiological causes. Indeed, it may be the case that straightforward comparisons can be made across imaging modalities, providing representations of basic sensory or perceptual processes that can validly be interpreted as being analogous. However, given that neural activity across a broad range of oscillatory frequencies is believed to contribute to multi-faceted cognitive functioning (Varela et al., 2001
; Buzsaki and Draguhn, 2004
), drawing similar conclusions about possible interactions between low-frequency oscillations measured by FMRI and higher frequency neuronal oscillatory activity, for example measurable via EEG, is considerably more complex (e.g., Laufs, 2008
).
It has been shown that a wide range of sampling rates and a relatively small number of datapoints, compared to the rate and number of samples acquired during the majority of task-FMRI studies, can be used to measure sufficient BOLD activity for identifying RSNs. Typical resting experiments therefore are of the order of 5–10 min, though the identification of an optimal duration of a resting FMRI session (and the possible need for multiple sessions) is an open issue. Van Dijk et al. (2010)
suggest that 5 min of recording time is near-asymptotic with regard to correlation map stability. It is unlikely, however, that this generalises to cases where a more detailed parcellation of functional connectivity patterns is sought, e.g., by means of a higher-dimensional ICA decomposition (Kiviniemi et al., 2009
; Smith et al., 2009
), as in these cases the degree of partial temporal correlation between sub-systems increases, reducing the ability to easily delineate them. Additionally, no consensus exists as to whether there is a significant impact of the precise experimental setting, e.g., whether data is taken while subjects are asleep or awake (Horovitz et al., 2008
), and with eyes open or closed ( Marx et al., 2004
; Bianciardi et al., 2009a
). Several recent studies of the stability of RSN patterns through various sleep states (Fukunaga et al., 2006
; Horovitz et al., 2009
) indicate that the correlation patterns are relatively stable, except for weakening in deep sleep.
Resting BOLD data benefit from the majority of pre-processing steps routinely applied to ‘traditional’ task-related BOLD FMRI data (Beckmann et al., 2005
; Birn et al., 2006
). However, there are a number of subtle differences worth noting. For example, high pass temporal filtering applied to task-FMRI data may be overly aggressive with respect to removing some of the relevant RSN frequency information (though see Spectral characteristics), and a more conservative approach is required in order to preserve powers at low frequency.
Importantly, a substantial portion of the FMRI signal obtainable during rest can be attributed to spontaneous BOLD activity, compared to that attributable to scanner and phsyiological artefacts, even at high field strengths (Bianciardi et al., 2009b
); a finding which is presumably replicable in tasks with low cognitive load. However, it has been shown that non-neuronal physiological signals may interfere with end interpretations of resting BOLD data (Birn et al., 2006
). Removal of confounding signals, such as respiratory, pulsatile or cardiovascular noise is shown to improve the quality of data attributed to neural activity (Birn et al., 2006
, 2008
; Van Dijk et al., 2010
). It has therefore become common practice in FMRI research (particularly resting-state) to monitor such signals, with specific software packages accordingly developed, to retrospectively correct for their confounding effects post-acquisition (e.g., RETROICOR; Glover et al., 2000
) and it can be argued that such noise removal is of particular importance for functional connectivity studies, given the data-driven nature of the analysis, where spurious correlations induced by the presence of structured noise may severely increase the number of false-positive detections. Similarly, other sources of regionally-specific noise such as white-matter and cerebrospinal fluid signals should be accounted for in the analysis (e.g., Fox et al., 2005
), as optimal BOLD signal to noise ratio in these regions is far more susceptible to artefact than in cortical grey matter (Tohka et al., 2008
). A range of approaches can be employed here, either by (i) restricting the functional data analysis with binary grey matter masks thresholded at an arbitrary level (ii) by including time series from these tissues as nuisance covariates (as in Figure 2
), or (iii) by employing probabilistic grey matter covariates in inferential analysis stages; i.e., by using additional confound regressors at the between-subject analysis stage which, for any given voxel, encode the relative proportion of grey matter for each subject.
Although concerns about the confounding influence of physiological noise and other structured artefacts in FMRI datasets are clearly warranted, in most cases it has been shown that session-level ICA methods can reliably identify and account for the artefactual influence of non-grey matter, respiratory and cardiovascular signal fluctuation on RSNs (Kiviniemi et al., 2003
, 2009
; Beckmann et al., 2005
; De Luca et al., 2006
; Birn et al., 2008
). Note, however, that potential difficulties arise when attempting to separate physiological noise components from ‘true’ neural components using ICA [see Independent component analysis (ICA)]. Attempts to create automated artefact classification algorithms for components identified by ICA have generated mixed results, often with relatively high levels of misclassification (e.g., rates of between 0.2 and 0.3; Tohka et al., 2008
). At the group level (see Group-ICA), ICA methods can potentially lose some of the power of single-session data cleanup, so group-ICA approaches may benefit from further (ICA-based or other) cleanup at the pre-processing stage (Biswal et al., 2010
). Additionally, it is apparent that some artefactual components share a large degree of spatial and spectral overlap with RSNs, and at low dimensionalities even ‘mix’ and form parts of the same component in the end decomposition (Birn et al., 2008
). However, in most cases the spatial overlap of, for example, the ‘default mode network’ (DMN; Figures 1
E and 2
) and artefactual respiratory components is relatively minimal, both in the majority of single-subject cases and at the group-ICA level, with peak DMN parietal nodes being markedly distant from occipital regions strongly affected by respiratory fluctuation (Birn et al., 2008
). Additionally, it has recently been demonstrated that separating these signals post-acquisition by manually increasing the dimensionality of the ICA model order, rather than having to collect and utilise physiological data, may more easily account for these confounding effects (Starck et al., 2010
). Finally, of topical importance and discussed in detail below, recent evidence suggests that one specific pre-processing procedure commonly applied in connectivity analyses, that of subtracting the global mean signal, may induce spurious negative correlations between RSNs and thereby may do more harm than good (Murphy et al., 2009
).
Seed-Based Correlation Analysis (SCA)
Biswal and colleagues first identified low-frequency coherent, spontaneous BOLD fluctuations bilaterally in the somatomotor cortical regions using a seed-based approach to derive time course models of functional connectivity (Biswal et al., 1995
). This method requires the a priori selection of a voxel, cluster or atlas region – perhaps based on previous literature or functional activation maps from a localiser experiment – from which to extract time series data. These data are then used as a regressor in a linear correlation analysis or – when augmenting the model with confound regressors of no interest – in a general linear model (GLM) analysis, in order to calculate whole-brain, voxel-wise functional connectivity maps of co-variance with the seed region. This is termed univariate because the data in each voxel is regressed against the ‘model’ separately from every other voxel. The SCA technique has proven useful in revealing the connectivity properties of many seed areas, and has been applied in the literature by many groups (e.g., Greicius et al., 2003
; Fox et al., 2005
; Margulies et al., 2007
). The primary advantage of SCA over other methods is that the approach provides a direct answer to a direct question – it shows the network of regions most strongly functionally connected with the seed voxel or ROI). This straightforward interpretability, relative to other methods, makes SCA an attractive approach for many researchers. Recent assessment of the test-retest reliability of these methods has indicated that RSN connectivity relationships can be identified by SCA with moderate to high reliability (Shehzad et al., 2009
).
One potential weakness of SCA methods concerns the influence of structured spatial confounds, such as other RSNs (than the one under consideration) or structured noise, e.g., residual head motion effects or scanner-induced artefacts. Some of these effects may be partially removed by incorporating specific pre-processing such as temporal filtering, but the presence of residual confounds in the SCA reference time course can negatively influence SCA correlation maps in that estimated ‘networks’ also include voxels which describe the spatial extent of the artefact. More generally, the univariate approach of correlating the time series of a single voxel with those of each other voxel in a brain image disregards the richness of information available within the statistical relationships between multiple data points. Prior selection of the time series of one sub-region to correlate with and inform the activity of the network as a whole imposes anatomical restrictions on the measurement of network connectivity, and consequently on interpretations of systems-level hypotheses. Fundamentally there are as many possible ‘networks’ to be derived as there are possible seeds, so discussing and interpreting one resulting spatial map as a distinct and meaningful neurobiological system is an under-representation of the data, as all but one possible ‘network’ in the data are being ignored. Biologically, the choice of seed may bias connectivity findings towards specific, smaller or overlapping sub-systems, rather than larger, distinct networks (e.g., Buckner et al., 2008
). Finally, these issues are all contingent on investigator-specific (seed size or location) and subject-specific (spatial normalisation or functional localisation) choices potentially resulting from the method of a priori seed-selection employed (see Figure 2
). As a caveat, however, we must not underplay the importance to the current field of subjective expertise in carefully selecting seed regions, as well as in identifying and classifying RSNs, both of which have played a major role in shaping our current understanding of these effects.
To illustrate the issue of potential biases attached to seed-selection in SCA, Figure 2
presents a number of SCA-derived versions of the DMN, alongside the same RSN estimated by ICA (also see Buckner et al., 2008
). The DMN seed locations in MNI standard space were selected from three papers in the resting-state FMRI literature: A: Fox et al. (2005
, red); B: Singh and Fawcett (2008
, green) and C: Greicius et al. (2003
, dark blue). Results of SCA using these seeds were calculated using white-matter, CSF and motion confounds, and are displayed as maximum intensity projections (Figure 2
i), and as binarised statistical maps on selected slices in the space of the subject’s high resolution structural MRI (Figure 2
ii, cluster-corrected z = 2.3, p < 0.05). Though there is significant overlap in the extent of the inferred networks independent of the seed voxel location (white), it is clear from the extent of primary (non-overlapping) colours visible (largely red and green), particularly in prefrontal, occipital lobes and subcortical regions, that biases inherent in the seed-selection process can result in a large amount of variability into the results and subsequent interpretations. In order to validly discuss SCA results in terms of networks, some form of consensus mapping is required, where the different versions of a network are combined in order to generate a single consistent representation (e.g., using information theoretic principles such as clustering or principal component analysis (PCA) across the different maps). Figure 2
iii, for comparison, shows the ICA-derived DMN map from the same data (where the model order, i.e., the number of components, was estimated from the data; see Beckmann and Smith, 2004
, for details). Amongst the set of four spatial maps this component map has highest mean spatial correlation with the other three estimates of the DMN. The ICA approach, more fully discussed in the next section, therefore can be viewed as one possible way of generating such consensus maps, eliminating the need to specify explicit seed locations, though at the expense of losing specificity in relation to a single well-defined seed of interest. Note, however, that other aspects of the analysis (such as the choice of the model order in ICA, see below, or the number and nature of confound regressors in a SCA) are likely to introduce other types of variability in the final outputs.
It is important to note here that ‘validating’ network connectivity maps by simply highlighting visual similarities with a network identified by ICA, a practice adopted increasingly frequently in SCA studies, is not necessarily optimal for comparator selection or useful in terms of inference, without detailed quantification of this similarity. Importantly, for the above-demonstrated reasons, a large number of researchers are beginning to additionally adopt multivariate methods such as ICA in their standard approaches to analysing spontaneous BOLD fluctuations. Such approaches avoid many of these problems and thereby have complementary advantages to those of SCA methods. Finally, we should re-emphasise the main advantage, with SCA, of being able to ask a straightforward question about connectivity, and receiving a direct answer (within the limit of being able to formulate the original question by means of a well-defined seed).
Independent Component Analysis (ICA)
Initially recognised within neuroscience as a valuable method of separating multiple, uncorrelated signal waveforms in EEG data, ICA was first applied to FMRI data collected during an experimental task (McKeown et al., 1998
). Later the same techniques were applied to resting-state FMRI data (Kiviniemi et al., 2003
). ICA works by decomposing a two-dimensional data matrix into the time courses and associated spatial maps of the underlying ‘hidden’ signal sources. Although a number of differing approaches to ICA are used in neuroimaging (implemented as separate software packages), common concepts and core methods underlie their application. One common approach is to estimate maximally statistically independent, non-Gaussian components from FMRI data, by optimising a measure of non-Gaussianity in the estimated maps. Although ICA estimates component maps of maximal spatial independence (from each other), this does not preclude spatial overlap between components (see Beckmann et al., 2005
for details) The ICA method of exploratory FMRI analysis is regarded as preferable to that of PCA, as the spatial independence enforced upon components by (spatial) ICA dictates only that their time courses not be highly co-linear, resulting in a more biologically plausible systems model than that obtained from a PCA decomposition where the analysis enforces orthogonality between time courses, precluding the detection of signals which partially correlate in the temporal domain. Note that while temporal ICA can be carried out as an alternative to spatial ICA (component time courses are orthogonalised but spatial maps are not), it suffers from the same orthogonality issue as PCA and is more susceptible to noise due to the typically smaller number of observations available to drive the estimation.
Importantly, as with SCA, use of the ICA approach has identified networks of spontaneous coherence comparable to known sensory and cognitive processing systems (e.g., Figure 1
). Persuasively, these include the somatomotor cortical connectivity network found in the first resting connectivity experiments (Biswal et al., 1995
), sensory systems in visual and auditory cortices, and, of particular interest to those applying imaging to neuropsychiatric populations, networks apparently reflecting higher-level cognitive processes (e.g., the DMN). In this comparatively unrestricted way, ICA has been used to generate a ‘complete’ (if simple) picture of the functional hierarchy of integrative and dissociative relationships making up the spontaneous and evoked activity of the human brain (Kiviniemi et al., 2009
; Smith et al., 2009
). RSNs identified by ICA can be less prone to artefactual effects from noise (including fluctuations in the mean global signal) than those from SCA (see Acquisition and pre-processing of resting-state BOLD FMRI data; also Birn et al., 2008
; Murphy et al., 2009
), due to the ability of the method to account for the existence of such structured noise effects within additional (non-RSN) ICA components.
Despite some advantages over SCA approaches in terms of avoiding prior spatial assumptions and noise attached to the seed, and the ability to simultaneously compare the coherence of activity in multiple distributed voxels, ICA is not without its challenges. First, unlike PCA, an ICA decomposition is obtained by means of iterative optimisation. This stochastic nature induces a degree of run-to-run variability, so results obtained from such an analysis can differ between analysis runs on even the same data. This type of variability can be reduced when selecting more stringent convergence criteria and software now exists that enables ICA repeatability testing (e.g., ICASSO; Himberg et al., 2004
), which can be used to investigate the degree of variability, and estimate ‘average’ decompositions from across multiple ICA repeats.
Secondly, the processes of dimensionality reduction and model order selection are somewhat arbitrary (i.e., one has to tell ICA how many components to estimate). While approaches exist to optimally select the number of independent components for a given dataset according to statistical criteria (for recent reliability testing of multiple models see Zuo et al., 2010b
), it must be recognised that there can be no single, ‘best’ dimensionality or model order for the underlying neurophysiology of multiple distributed systems. There will always be multiple valid solutions for characterising the hierarchical complexity of RSN functional neurobiology. This level of ambiguity simply mirrors the general ambiguity in characterising the brain’s functional organisation: while we may validly conceptualise the existence of a visual, auditory, sensory-motor or language system, a more fine-grained characterisation might separate this into specific areas such as the hand knob, visual word form area, fusiform face area etc. Each one of these different types of characterisation is valid at a particular level of complexity. In the case of ICA decompositions, higher dimensionalities of the model have recently been advocated (Kiviniemi et al., 2009
; Smith et al., 2009
), although the robustness of a given level of decomposition relies on being supported by data quality (e.g. one cannot expect a robust 100-dimensional ICA decomposition from a typical 5-min single FMRI session).
Finally, whereas SCA guarantees a result in terms of identifying the brain regions most associated, or functionally connected, with the selected seed (presumed to closely correspond to the associated RSN), ICA results may be ‘split’ into a number of sub-networks, depending on the parameters of the analysis (e.g., at high model order dimensionalities). This can result in the estimation of a large number of components, which may be difficult to identify and classify (Tohka et al., 2008
). Further, one ICA decomposition of a given dataset may hide the fact that any given brain region may, over time, share varying connectivity patterns with multiple networks. This variability, or ambiguity, of regional co-activations between network nodes can be referred to as the ‘nonstationarity’ of a given area in terms of its connectivity with one or more RSNs, and equally affects multiple analysis approaches (for specific investigation of this, see Chang and Glover, 2010
, and, with respect to nonstationarity at the neural level, see Popa et al., 2009
).
Frequency-Domain Analyses
Since Cordes and colleagues originally characterised a number of functional networks of interest as low-frequency BOLD fluctuations, interest in understanding the frequency-specific characteristics of RSNs has developed in parallel to correlation-based methods (Cordes et al., 2000
). Specific techniques that have emerged to investigate these aspects of RSN phenomena include ‘amplitude of low frequency fluctuations’ (ALFF) indices (Zang et al., 2007
). The ALFF index is calculated by averaging the square root of the power spectrum of a given low-frequency BOLD time course across the frequencies filtered, then standardising the value relative to the global mean ALFF value. The assumption that all relevant neuronal information contributing to resting-state BOLD fluctuations can be represented by a single figure, calculated only from information inherent in the frequency domain, runs into problems when considering the argument for a greater level of broadband content in neural RSN oscillations than previously thought. This raises the possibility that potentially interesting information is being removed from the analysis by these mathematical procedures. Additionally, some work has suggested that low-frequency measures of resting data may be rather susceptible to cerebral vascular and respiratory artefacts (Zuo et al., 2010a
). Indeed, some aspects of the spatial maps derived from these techniques can appear, at least under qualitative examination, to resemble patterns queried as artefactual by experimenters using other techniques, particularly in midline brain regions (e.g., Birn et al., 2006
, 2008
).
With these issues in mind the ALFF approach has been more recently refined to account for ‘fractional’ inclusion of information in frequencies outside of the normal range (fALFF; Zou et al., 2008
). This is accomplished by calculating ‘the ratio of the power at each frequency to the integrated power of the entire frequency range’ (i.e., summing the oscillatory amplitudes across the ‘typical’ 0.01–0.08 Hz range, then dividing by the amplitude sum across a more inclusive range of 0–0.25 Hz). Additionally and optimally, this amended approach involves no bandpass filtering. Although questions may remain over the susceptibility of these techniques to physiological noise, recent independent testing reveals both ALFF and fALFF to have moderate to high levels of reliability and consistency in terms of the (primarily midline) spatial patterns generated (Zuo et al., 2010a
). Furthermore, useful diagnostic information about neural processes may be present in the oscillatory amplitude envelopes (e.g., Zang et al., 2007
; Zuo et al., 2010a
). Such techniques may thereby provide a useful complement to approaches such as SCA and ICA investigating, for example, inter-regional coherencies between multiple BOLD signals (e.g., as applied by Anand et al., 2005
).
A number of other frequency-dependent and time-series statistical approaches exist that can be applied to the analysis of spontaneous oscillatory activity in BOLD data. These include linear or nonlinear comparison of fractal dynamics (Wink et al., 2008
), measures of frequency-specific mutual information (Salvador et al., 2007
), and graph theoretic investigation of such networks in the context of their ‘small-world’ characteristics by multivariate partial correlation of spectral information from pre-defined ROIs (Salvador et al., 2005
; Achard et al., 2006
; Stam and Reijneveld, 2007
).
Regional Homogeneity
The regional homogeneity (ReHo) method (Zang et al., 2004
) is based on ‘Kendall’s coefficient of concordance’. This technique is sensitive to the ‘purity’ of clusters identified as expressing high functional connectivity with a model time series within a given cluster. By virtue of the assumption that neighbouring voxels are temporally similar, clusters identified as strongly connected during task or rest can be tested for their inner homogeneity and the degree to which this is modulated by a given paradigm or differs between groups (e.g., Liu et al., 2006
; Paakki et al., 2010
). The temporal variability within a cluster is reflected in the assigned homogeneity score. Advantages of the ReHo technique over, e.g., SCA, include its relative insensitivity to possible region-to-region and/or trial-to-trial variability of the haemodynamic response function. Also, unlike with ICA, no assumptions are made regarding the spatial independence of identified maps, and extensions to group analysis are relatively straightforward (Zang et al., 2004
). However, this approach is fundamentally local in nature and therefore exhibits a high degree of sensitivity to different levels of spatial smoothing. Also, the insensitivity to shape differences between clusters does preclude drawing inferences on the degree of correspondence between spatially remote regions, making it difficult to characterise the distributed nature of RSNs (Zang et al., 2004
).
The majority of techniques for multi-subject analysis of resting-state functional connectivity are not yet as well developed as at the single-subject level. Hence we here discuss only the fundamental principles, and recent advances relating to the two methodologies applied most widely: SCA and ICA. Most of the above-outlined pros and cons of both of these approaches still apply at the group level, along with additional caveats common to all attempts to combine functional neuroimaging datasets in this way, e.g., issues related to co-registration of data into a common space. The gross variability in cortical thickness, folding and, often, functional localisation between separate individuals or subject populations may cause problems for group level inferences. Such variability may instil a registration bias in the location of group analysis inputs (seed-ROIs) or outputs (one or more functionally connected nodes) towards one group or other, or towards a specific subjective characteristic. Similarly, the potential for mis-registration of individual session FMRI data following spatial normalisation may result in functionally segregated, but proximal, regions being assigned the same neuroanatomical label across subjects, marring valid inference. These sources of variability are local in nature and therefore their impact on inferred connectivity patterns is more prominent in voxel-based SCA. In cases of a region-based SCA or ICA such variability typically results in blurring of the estimated spatial patterns (see e.g., Figure 1
).
One recent study suggests that the network properties of systems, in terms of ‘small-world’ characteristics inherent in connectivity relationships between nodes, are better approximated by using single voxel seeds rather than larger ROI seeds (Hayasaka and Laurienti, 2009
). However, it seems possible that this may be true of a-priori ROIs (such as derived from a standard space template), but that data-derived ROIs (in analogy to ICA spatial maps) would result in seed regions with better performance.
The caveats listed above must inform any assumptions made when extending these findings to robust, efficient and unambiguous group-level interpretations of alterations in biologically plausible networks and their relevance to behaviour.
Group-Level SCA
Approaches to SCA, while widely applied and sharing common basic principles, are not universally standardised in terms of group analysis methods. Specifically, methodologies can vary in terms of the precise information brought forward from single-subject analyses to the higher level. In practice, most SCA group studies carry forward voxel-wise regression coefficients (e.g., Greicius et al., 2003
) or correlation coefficients (e.g., Fox et al., 2005
). These values are identified from an initial, whole-brain analysis of the functional connectivity with the time series extracted from a given seed region. At the higher level, these values are then converted to Z-statistics and averaged across subjects in a standard GLM, followed by standard hypothesis testing. The latter may or may not take into account between-subject variability, i.e., be a mixed-effects or fixed-effects cross-subject analysis).
Group-ICA
Although interest in RSN analysis has grown heavily over the past few years, it is only fairly recently that coherent methods have been proposed and validated for comparing such broad, systems-level activity patterns across subjects and/or sessions within an ICA-based framework. One immediate problem when running separate ICA decompositions in separate subjects is that of having to identify the correspondence between estimated spatial components, i.e., selecting which components to carry up to a between-subject analysis. Considering the possible existence of multiple different solutions even within the same subject’s data, there might not be any consistent one-to-one mapping between estimated sets of component maps when compared across different subjects. Early efforts advocated running single-session ICA, separately for each subject, then attempting to find the ‘best-fit’ component to an a priori RSN template at the individual level, to carry forward to group comparison stages (e.g., Greicius et al., 2003
; Esposito et al., 2005
; De Luca et al., 2006
). The self-organising, hierarchical clustering of independent components method (Esposito et al., 2005
), for example, involves carrying out single-session ICA prior to group analysis with multiple runs (for repeatability testing). However, these approaches are susceptible to the effects of multiple sources of gross variability inherent to unconstrained resting-state FMRI data. Although we know RSNs to be largely consistent across healthy individuals (Damoiseaux et al., 2006
), there are no guarantees of exact correspondence of identified component maps, including RSNs, across subjects. As mentioned above, at a given ICA dimensionality, one RSN could be potentially split into two sub-networks in some subjects, and appear as a single component in others. Such problems may even be driven purely by a difference in the amount of structured noise in certain subjects. This can lead to misinterpretation of apparent subject differences. Similarly, some researchers have advocated the use of separate ‘group-ICA’ runs per group or experimental condition to be compared prior to further GLM comparison (e.g., Harrison et al., 2008a
,b
). However, this approach may also be sub-optimal, as it biases towards false-positive findings of group or between-session differences (Calhoun et al., 2001
; Beckmann and Smith, 2005
).
Further, single-subject ICA followed by group-level matching of components across subjects fails to take advantage of the additional effective signal-to-noise present when all subjects are analysed simultaneously (for example, by the group-ICA methods described below). It is for this reason that group-level ICA can generally support a much higher-dimensional (and therefore more finely-detailed) decomposition than single-session ICA. On the other hand, single-subject ICA has much greater power to model/ignore session-level structured noise than group-level ICA approaches.
Working from the ‘top down’ by starting with a group-level ICA, and generating subject-specific versions of the resulting group maps solves the problem of between-subject RSN correspondence inherent in the process of combining single-session ICA data.
The first group-ICA model to emerge for FMRI was applied to task data (Calhoun et al., 2001
). In the first step of this procedure, data from all subjects are spatially normalised and dimensionality-reduced via PCA (separately for each subject). These reduced datasets are then assumed to contain the most important source signals that have been ‘mixed’ into the measurements. All reduced datasets are temporally concatenated prior to the application of group-ICA. This identifies voxels that share common temporal patterns of response within and between subjects. By means of temporal concatenation of multiple datasets (Figure 3
; also see Calhoun et al., 2001
), group-ICA can thereby estimate group-level independent components, including RSNs (Beckmann et al., 2005
). Due to the unconstrained nature of original BOLD signals in resting data across sessions and subjects such a concatenation approach is more suitable than an alternative tensor ICA method (Beckmann and Smith, 2005
).
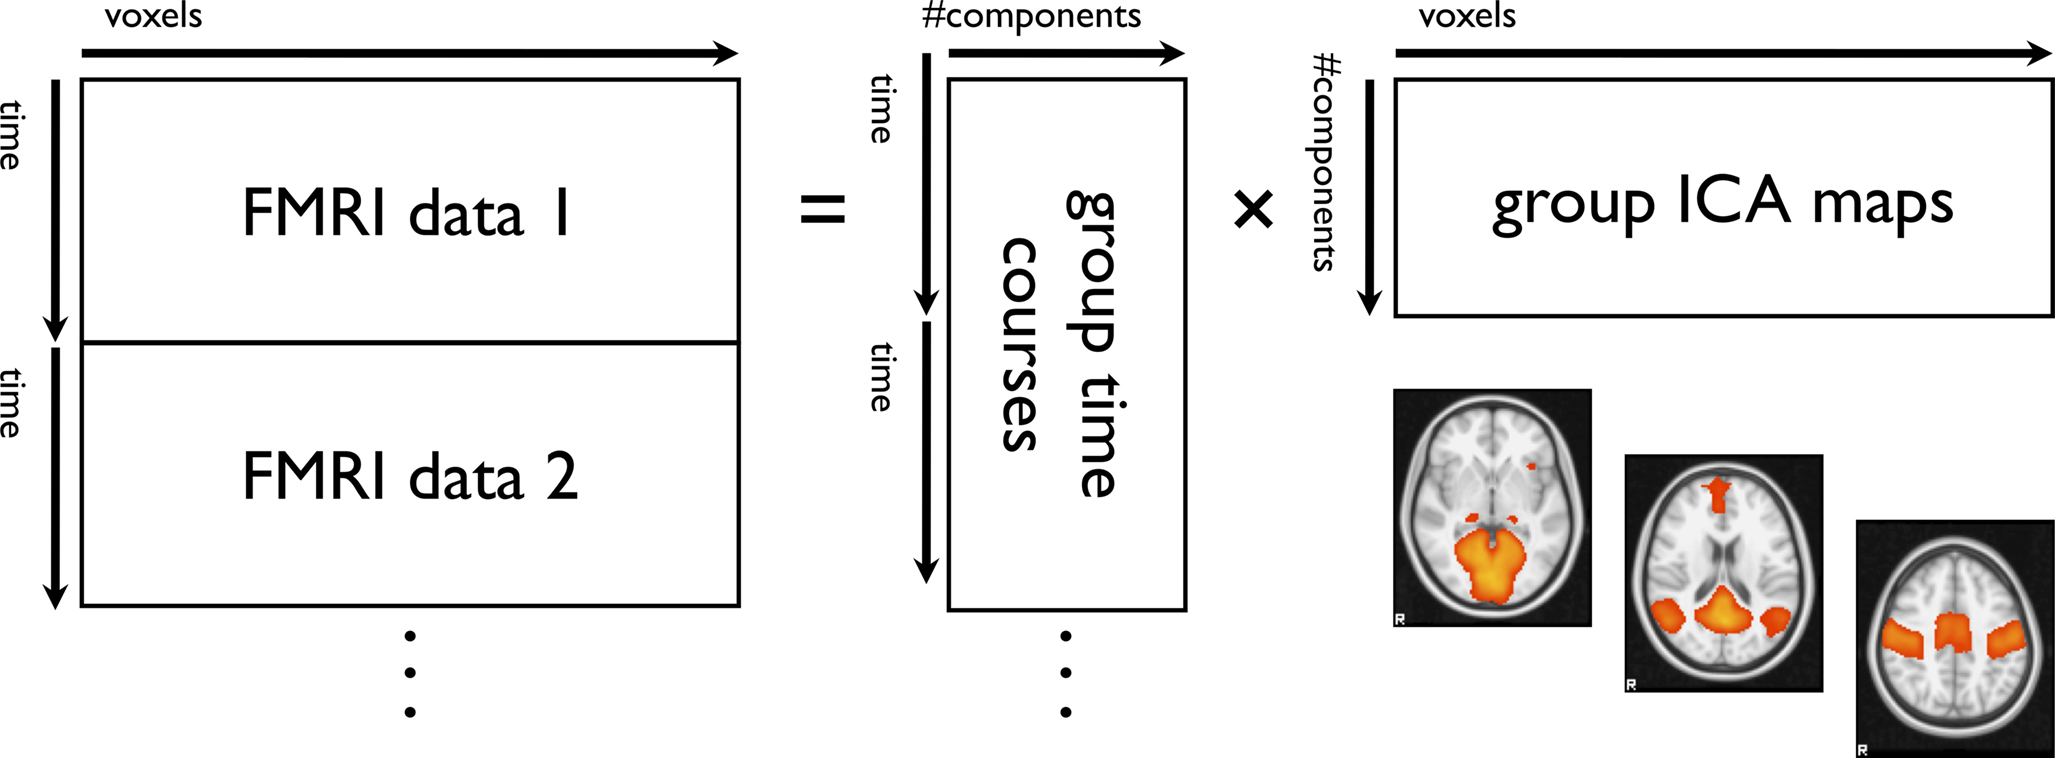
Figure 3. Schematic for temporal concatenation group-ICA.
In order to enable voxel-wise between-subject comparisons Calhoun and colleagues propose to create individual subject components from the group-decomposition via PCA back-projection/reconstruction (Calhoun et al., 2001
). Further extensions of this approach enable the testing of within-network (Calhoun et al., 2004a
) and between-network (Jafri et al., 2008
) connectivity relationships across different task conditions or subject groups. The back-projection method estimates, at the subject level, temporal and spatial information associated with each group component, by projecting the original single-subject data onto projection matrices which combine the group-level unmixing matrix and the subject-level PCA-derived matrices used for dimensionality reduction. Because these PCA matrices are calculated separately for each subject there is no guarantee that, in the reduced data space, consistent (across subjects) information is retained. Hence this approach can suffer from similar issues to those described above as problematic for combining single-session ICA datasets prior to group analysis. The dependence on subject-specific PCA reduction raises the probability of session-specific noise contributions sub-optimally influencing further analyses, thereby confounding any final cross-subject RSN comparisons.
A more recent approach (Beckmann et al., 2009
; Filippini et al., 2009
) estimates subject-specific RSNs from information contained within the original functional data via a ‘dual regression’ technique. This approach differs from back-reconstruction by using regression of the group-ICA spatial maps against the original, individual session, functional datasets. The spatial maps from a group-ICA decomposition are first used as a set of GLM (spatial) regressors in a multiple regression analysis. This process generates individualised, session-specific time courses for each independent component in each subject’s functional dataset (also see Calhoun et al., 2004b
). These time courses, rather than matrices calculated as part of back-projection, are then normalised and used as GLM (temporal) regressors in a second multiple linear regression against the functional datasets. This generates individualised spatial maps for each original group-level component. The analysis is carried out in a standard coordinate space, so that cross-subject voxel-wise non-parametric statistical testing of RSNs can be carried out. Estimated time series and spatial maps form unbiased least-squares approximations to the original ICA maps at the individual subject level. Note, however, that because the original ICA maps (as well as the subject-specific dual regression estimates) are derived in a data-driven fashion we can not use simple parametric tests in the between-subject analysis and therefore need to resort to non-parametric statistical assessments. This approach has been validated in terms of its ability to estimate session-level RSNs from group-level ICA spatial maps, consistently and more reliably than single-session template-matching approaches (Zuo et al., 2010b
).
It is of course interesting to discuss the most cutting-edge methodological and conceptual advances in current and future resting-state FMRI research. However, it is equally important to note some methodological and conceptual limitations, which it is necessary to be mindful of when conducting and interpreting such research.
Anti-Correlated Networks
A number of studies identifying inverse temporal relationships between systems referred to, for example, as task-positive and task-negative networks, in both the presence and absence of overt cognitive stimulation, have proposed that this coupling may be functionally relevant (Fox et al., 2005
; Fransson, 2005
; Castellanos et al., 2008
; Kelly et al., 2008
; Zuo et al., 2010b
). Specifically, this phenomenon is thought to hold functional significance in domains of attention, higher cognitive control and even consciousness, by reflecting the efficiency of neural resource allocation between competing and interacting systems, and ultimately the efficiency of global cognitive processing (Fox et al., 2005
; Kelly et al., 2008
). Similarly this issue may be central to disorders associated with cognitive impairment (Wang et al., 2007
; Castellanos et al., 2008
). However, there has been vigorous debate about the true ‘negativity’ of such between-network relationships. Principally, it is apparent that global mean signal regression, a pre-processing procedure routinely carried out in many SCA studies in order to correct for the influence of global, non-neuronal physiological noise, will bias towards finding such an effect of negative coupling, or ‘anti-correlation,’ between RSN time series (Murphy et al., 2009
). This finding may have important implications regarding the validity of a large portion of prior interpretations, primarily between the so-called task-negative DMN and task-positive attentional/cognitive control RSNs. However, whether these procedures actually create such an effect, or rather artificially enhance ‘true’ negative relationships existing between cognitive control RSNs, remains contentious, as multiple studies have not reached identical conclusions on this issue (Chang and Glover, 2009
; Fox et al., 2009
; Weissenbacher et al., 2009
; Van Dijk et al., 2010
).
An illustration of the simple mathematical steps underlying the removal of the global mean signal from any given data pool is given in Figure 4
. The removal of the global mean signal inevitably maps existing correlations into the full correlation range -1 to 1. This does indeed maximise the ability to delineate RSNs from each other, but at the expense of rendering the numerical value (and sign) of the correlation uninterpretable. Note that pair-wise correlations are altered systematically and dramatically without changes to the existence, structure or consistency of individual networks.
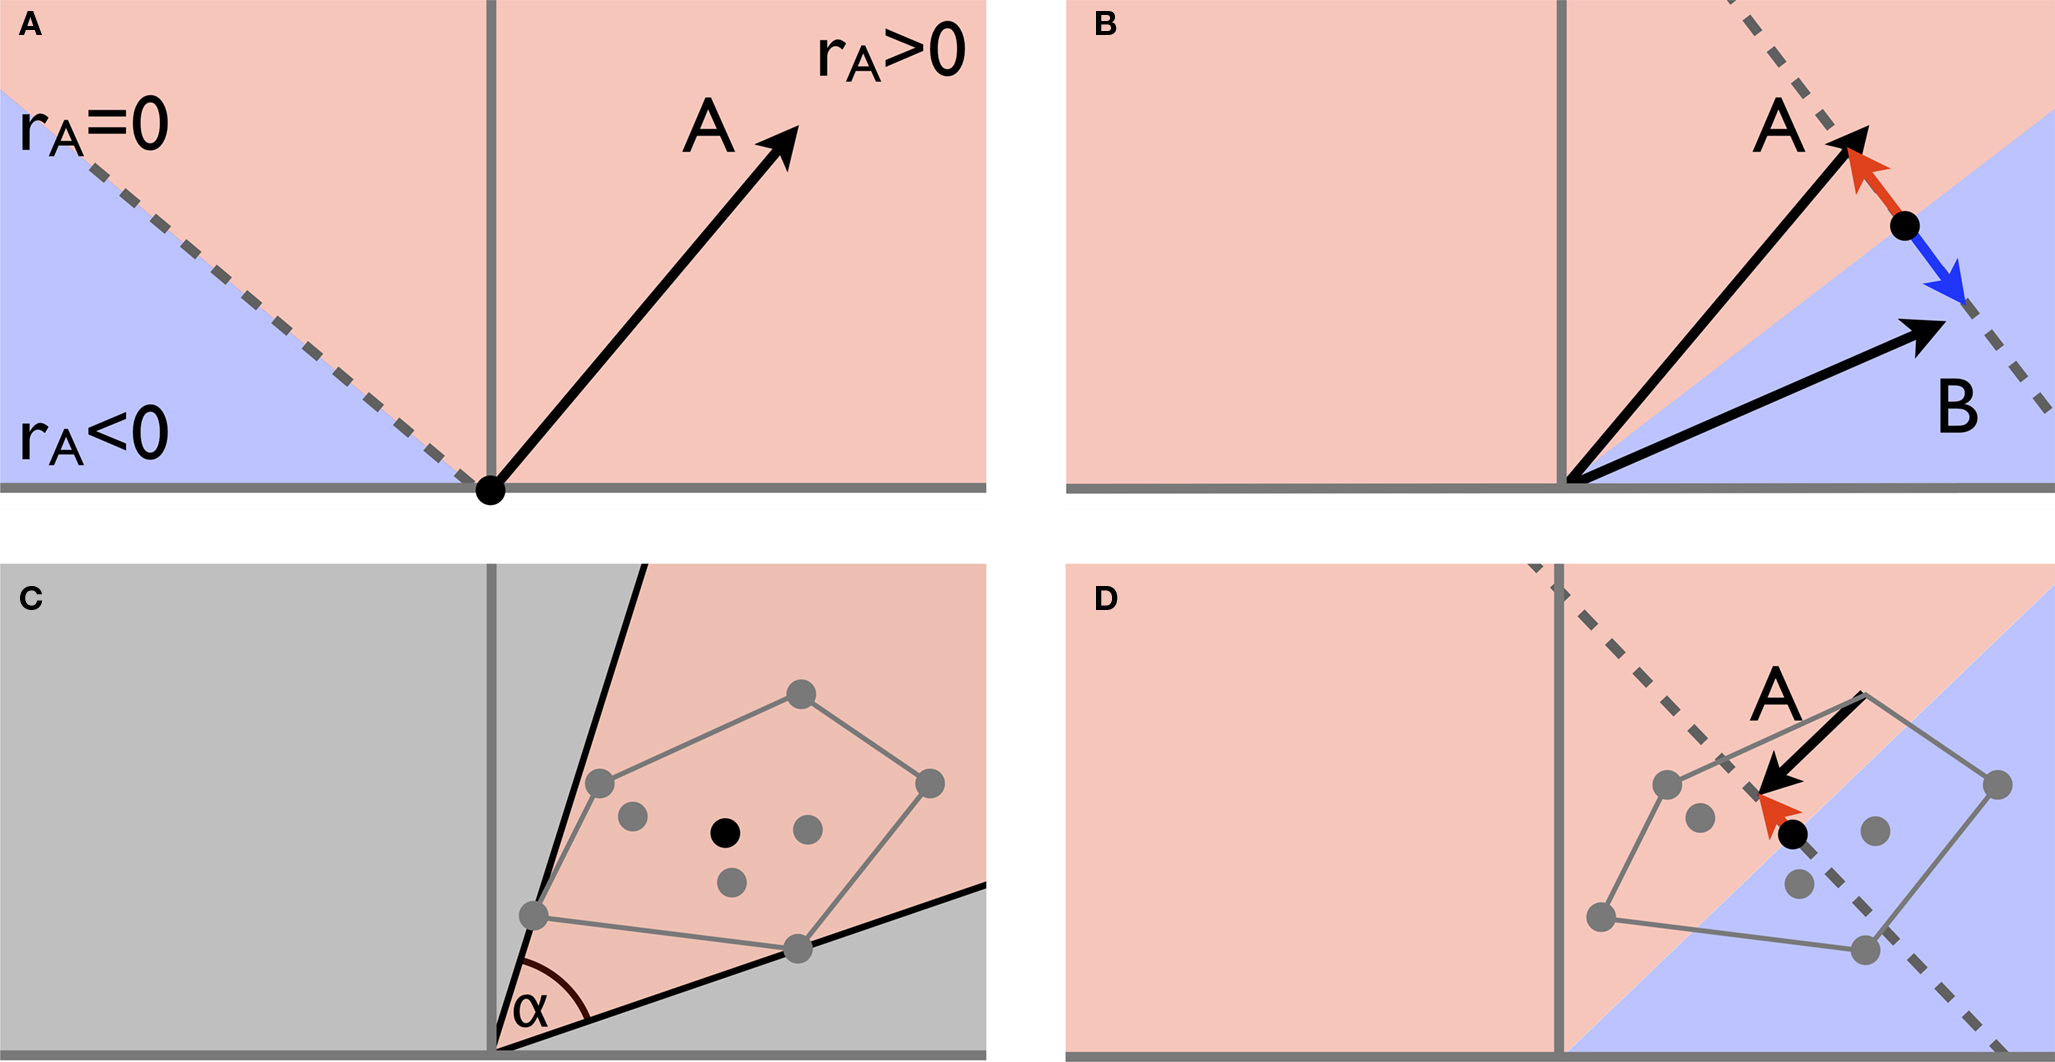
Figure 4. The vector-space illustration of global mean regression. (A) The characteristic time series for network A can be described as a single point in a high-dimensional vector space. Relative to 0 (the zero time series, black dot) the orthogonal plane (dotted line in this example) separates the vector space into an area of positive correlation (rA > 0) and a subspace of time series negatively correlated with A. The correlation between A and any other point is defined by the (cosine of) the inner angle: all points within ± 90° are positively correlated with A, whereas all other points are negatively correlated with A; (B) when regressing out the mean of two network-specific time series A and B, the 0 reference point is moved half-way between the two points and the original time series get projected onto the subspace perpendicular to this mean, thereby inducing perfect anti-correlation between A and B as the new characteristic vectors are now aligned at 180°; (C) in the more general case of multiple networks (grey dots) the range of possible differences in pair-wise correlations is again determined by the maximum range of the inner angles α: if α is small, pair-wise correlations differ by only a small amount and delineation of different networks becomes difficult, in this example all pair-wise correlations are positive; (D) the global mean necessarily lies within the convex hull spanned by all the individual characteristic time series. Global time-series regression moves the 0 reference point somewhere into the convex hull, thereby inevitably inducing spurious negative correlations between the characteristic time series associated with different RSNs. Global mean regression does increase the maximum inner angle between pairs of time courses and therefore facilitates delineation of networks from each other; the resulting correlation scores (and signs thereof), however, are no longer interpretable and reference to these should be avoided.
Despite outstanding questions regarding the methodological implications of artificially induced negative correlations between time series, their potential relevance to function should not be categorically disregarded (see e.g., Popa et al., 2009
). Indeed, the one critical finding on this issue may be precisely that of the great variability in the degree (and direction) of observed correlations between the DMN and multiple, inconsistently identified task-positive networks at rest. This seems to hold true in comparisons across individuals, and even over time within the same subject; whether between different scanning sessions or within a single session (Chang and Glover, 2010
). Based on this, it is important to investigate which factors (e.g., see Applications and extensions) contribute to changing the nature or strength of this relationship, as measured by correlations, with external expressions of behaviour or experimental manipulations. For example, in a recent study testing subjects across different conditions of pharmacotherapy, we overcame these methodological issues in two ways (Cole et al., under review). First, we employed multivariate, probabilistic ICA methods that do not involve global mean signal regression as a pre-processing step, and can account for non-neuronal physiological noise, thereby allowing the independent assessment of correlative relationships between RSNs previously identified as anti-correlated in the literature. Second, we characterise network relationships by means of examining the dynamic changes in the correlation between networks, identified by repeat measures between conditions within-subjects (see Figure 5
). As a method of assessing changes in the correlation between RSNs, such an approach may be complementary, even preferable, to between-group comparisons of RSN spatial maps generated by ICA or a priori seed region correlation. By focussing not just on differences between assumed ‘static’ RSN spatial maps, but also the time-varying, condition-specific characteristics of dynamically fluctuating systems, we avoid making restrictive anatomical assumptions that could limit the interpretability of between-network functional connectivity findings.
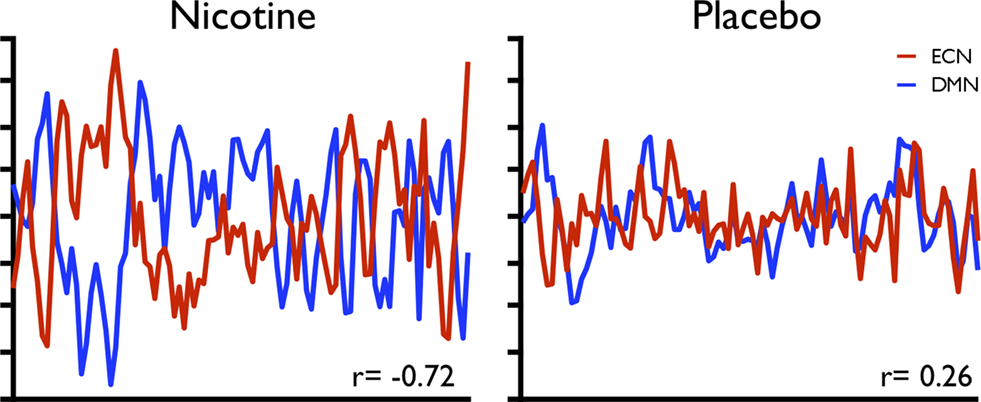
Figure 5. Variability in the strength of inverse coupling between two RSNs (the DMN and a putative executive control network sharing spatial similarity with a combination of regions overlapping with RSN maps from Figures 1
F,G,H) associated with individual differences in therapeutic behavioural changes following nicotine pharmacotherapy, compared to placebo. These data are taken from a single subject within a group of smokers tested using resting-state FMRI with repeat measures in a double-blind, placebo-controlled, crossover design (reproduced from Cole et al., under review).
Networks Within-Networks
Further to inconsistencies in connectivity relationships identified between networks, it is evident that such relationships can also vary within RSNs. For example, prior studies have proposed that distinct patterns of functional connectivity exist, which share some spatial overlap in their foci, but underlie different aspects of cognitive control (Dosenbach et al., 2007
; Seeley et al., 2007
). With an ICA-based approach one relevant point to consider here is the potential for ‘splitting’ of networks identified by increasing the number of components. Seeley et al. (2007)
identified such a split in a network suggested to be involved in executive function, revealing separate purported ‘control’ and ‘salience’ networks, an effect which has since been replicated (Sridharan et al., 2008
; Kiviniemi et al., 2009
) and further bolstered by functional and structural evidence from multiple neurological disorders (Seeley et al., 2009
). In studies attempting to fully parcellate the complex functional hierarchy of neural sub-systems, the use of high-dimensionality ICA is an important and useful tool (Abou-Elseoud et al., 2010
). However, it is important to distinguish between the value of varying the model order to prove a technical methodological point (i.e., demonstrate that systems can be made to split into sub-systems, potentially unrelated to the ability to assign biologically meaningful interpretations to such splits), and the value of concentrating on interpreting the results of a testable systems-level hypothesis in larger networks identified at lower model orders.
Reciprocal Task-Rest Interactions
Many authors, including those of the current article, are guilty of referring to the signals identified by various methods as RSNs (or similar terminology), when measurements have not per se been collected in the ‘resting-state’. Studies incorporating passive visual stimulation, instructed or self-initiated changes in mental state or focus, or occurring immediately following some other experimental manipulation, cannot be described as occurring during true, stimulus-unguided rest. However, a mass of novel data is rapidly rendering such dichotomous distinctions between experimental and resting-states as conceptually unhelpful (Fox and Raichle, 2007
; Poldrack et al., 2009
; Van Dijk et al., 2010
). Firstly, it has been established that the same functional networks are cohesively active during a multitude of tasks as well as at rest (Smith et al., 2009
). Secondly, several recent studies have demonstrated direct evidence of the influence exerted by task-related activity and performance over network activity in resting periods, and vice versa. The existence and strength of two-way interactions between task and ‘RSN’ activity has been linked to adaptive learning (Albert et al., 2009
; Lewis et al., 2009
), response to or recovery from high cognitive load (Pyka et al., 2009
; Van Dijk et al., 2010
), and individual differences in (Fox et al., 2007
; Hesselmann et al., 2008
; Hasson et al., 2009
; Sadaghiani et al., 2009
), or fine-tuning of, cognitive performance (Singh and Fawcett, 2008
). Further study is required to establish fully the range and nature of such relationships over varying periods of time.
Correlation and Causality
As is typically the case in task-FMRI studies, the majority of applied resting-state research also presents the results of statistical analyses (of spatiotemporal, neurophysiological information assumed to reflect neuronal processes), in conjunction with interpretations suggestive of cognitive and behavioural meaning. While strong correlations (e.g., between strength of a network such as the DMN at rest, and a behaviour measure such as reaction time or accuracy in a task) encourage conclusions of said RSNs being relevant to cognitive function, clinical presentation or treatment responsiveness, we can only speculate about the precise order of events and causal relationships between the nodes in this dynamic processing stream.
Dynamical Causal Modelling (DCM, Friston et al., 2003
), a popular approach for estimating effective connectivity between brain regions, relies on bilinear neural state equations where system dynamics are induced by external driving inputs, representing experimental manipulations or changes in experimental conditions. As such, DCM is currently ill-suited for the investigation of effective connectivity in resting FMRI data. In other work, attempts to estimate causal relationships between brain regions using lag-based methods such as Granger Causality Analysis (GCA, Goebel et al., 2003
) are also problematic. Haemodynamic “blurring” of the neural processes underlying the FMRI signal swamps any causal lag in the neural dynamics (typically of the order of a few milliseconds), and, further, variations in haemodynamic delay across brain regions (potentially of the order of seconds) will cause overwhelming bias in any attempt to estimate causality, thus rendering any causal inference unsafe (David, 2008
). Even the original proponents of GCA for FMRI state that “...one should rule out the possibility that influence found from one area to another based on temporal difference in signal variation is due to a systematic difference in the hemodynamic lag at the two areas.’’ (Roebroeck et al., 2005
). Unfortunately, in FMRI, we have in general no control over haemodynamic variabilities, and so cannot expect to use such analysis methodologies to estimate causality. Finally, however, there is the potential for more sophisticated network analysis methodology (such as Bayesian Network modelling) to infer causal connections, at least for networks with a limited numbers of nodes, but much work remains to be done to develop and validate these approaches for resting FMRI data; see Ramsey et al. (2010)
for pioneering work in this direction.
When analysing the relationship between different networks, questions that remain include whether or not specific RSNs of interest have an optimal degree of coupling with others. It could, for example, be that the activity in the DMN is suppressing activity and/or synchronicity in one or more task-positive networks during rest, and vice versa during task performance. Is this due to incidental network-specific over- or under-activity, or due to ‘true’ between-network dependencies? Are non-stationary shifts in between-network dynamics interpretable in terms of causal factors? Further study is required in order to address such questions, and that of which specific RSN nodes are involved in maintaining optimal relationships of within- and between-network connectivity (e.g., Sridharan et al., 2008
). Indeed, FMRI alone may be unsuitable for attributing causality in this way (Ramsey et al., 2010
), so multimodal approaches are required to provide further insight into such questions, for example via combining resting-state and task-FMRI with EEG or transcranial magnetic stimulation methods.
The methods presented here are now being widely applied by many imaging researchers worldwide, to probe specific questions relevant to brain function. Notable applications include those investigating individual differences, disease, development, neuroplasticity and treatment efficacy.
In the field of genetics, for example, specific allele variants implicated in neurodegeneration (Filippini et al., 2009
), neurodevelopment (Thomason et al., 2009
) and cognitive function (Liu et al., 2010
) have been associated with RSN functional connectivity phenotypes. Further, identification of these neural connectivity patterns extends into domains of actual clinical presentation, for example in Alzheimer’s disease (Greicius et al., 2004
; Wang et al., 2007
) and other neurodegenerative diseases (Seeley et al., 2009
), normal aging (Andrews-Hanna et al., 2007
; Damoiseaux et al., 2008
), as well as multiple neuropsychiatric (Liu et al., 2006
; Greicius et al., 2007
; Salvador et al., 2007
; Jafri et al., 2008
) and neurodevelopmental disorders (Zang et al., 2007
; Castellanos et al., 2008
; Di Martino et al., 2009
; Paakki et al., 2010
). Of particular importance is the fact that, relative to task-FMRI, such resting-state investigations require minimal task compliance and therefore allow for the study of differences in brain dynamics in non-normal populations, such as infants, sedated subjects or subjects with severe cognitive or physical impairments. Functional connectivity within and between distinct RSNs can be implicated in a very diverse range of behaviours and neuropsychiatric disorders. In particular, studies have identified a plethora of such relationships involving the DMN (for reviews see Buckner et al., 2008
; Greicius, 2008
; Broyd et al., 2009
). Existing results are promising, suggesting RSNs may be used to characterise patterns of neural activity and coherence approximating functional variability across multiple application domains. However, large ‘proof-of-concept’ studies with high statistical power (see e.g., Biswal et al., 2010
), as well as ongoing meta-analytic research, will make a valuable contribution to the field in years to come.
As noted before (Greicius, 2008
), applications of these correlative relationships (typically derived and significance-tested for proof of concept at the group level) to providing clinical diagnostics at the single-subject level are currently far from fully realised. Despite such concerns, pseudo-diagnostic information associating RSN function with within-subject dynamic, intervention-related changes in neurophysiology or behaviour are already apparent, for example in fields of learning (Albert et al., 2009
; Lewis et al., 2009
) and pharmacological intervention (Figure 5
; Anand et al., 2005
). Additionally, preliminary evidence exists for RSN-related metrics as potential screening devices, for example in Alzheimer’s disease (Rombouts et al., 2005
; Fleisher et al., 2009
).
The study of RSNs has revealed, and will continue to reveal, many interesting observations of the way in which spontaneous connectivity patterns alter under different conditions, though the concrete meaning of these inherent processes, seemingly fundamental to the human neural functional architecture, remains elusive. Task-based FMRI studies have provided the opportunity to test strict hypotheses regarding the discrete activity of a small number of regions in a given derived task model, albeit without necessarily explaining the true distributed nature and complexity of human brain function. One is led to expect that RSN activity measured with the exclusion of artificial, experimentally guided regional BOLD changes may provide a better approximation to the ‘baseline’ of brain function. However, the unrestricted nature of this data obviously engenders something of an interpretative minefield.
In order to use RSNs to generate a comprehensive neurocognitive functional ontology, it may therefore be beneficial to adopt an approach combining both task- and resting-FMRI. Whereas the majority of resting-state FMRI research has progressed with a view to the potential for results to ‘complement’ the findings of task-FMRI, one way of addressing questions of functional specialisations and interactions with RSNs may be to turn the system on its head, and adapt task-based approaches in order to complement and bolster the interpretations garnered from studies of spontaneous activity patterns, or RSNs. Due to the historic tendency for prior FMRI studies to avoid reporting or discussing task-related deactivations, this approach may particularly complement existing meta-analytic research comparing resting-state and task-activation studies. Hints at how such a groundbreaking approach might progress are starting to emerge in the literature, either via meta-analytic approaches (Smith et al., 2009
) or augmentation of the experimental method (Poldrack et al., 2009
). Future extensions should enable a more direct comparison of ‘mental state’ and resting-state network activity, enabling more definitive classification and diagnostic application of the latter, and thereby ultimately contributing to the thorough characterisation of the human neural functional architecture.
The authors declare that the research was conducted in the absence of any commercial or financial relationships that could be construed as a potential conflict of interest.
This work was supported by funding from the UK BBSRC and GSK. We thank all involved in the collection of data presented in Figure 2
, which are provided courtesy of the GSK Clinical Imaging Centre.
Biswal, B. B., Mennes, M., Zuo, X. N., Gohel, S., Kelly, C., Smith, S. M., Beckmann, C. F., Adelstein, J. S., Buckner, R. L., Colcombe, S., Dogonowski, A. M., Ernst, M., Fair, D., Hampson, M., Hoptman, M. J., Hyde, J. S., Kiviniemi, V. J., Kötter, R., Li, S. J., Lin, C. P., Lowe, M. J., Mackay, C., Madden, D. J., Madsen, K. H., Margulies, D. S., Mayberg, H. S., McMahon, K., Monk, C. S., Mostofsky, S. H., Nagel, B. J., Pekar, J. J., Peltier, S. J., Petersen, S. E., Riedl, V., Rombouts, S. A., Rypma, B., Schlaggar, B. L., Schmidt, S., Seidler, R. D., Siegle, G. J., Sorg, C., Teng, G. J., Veijola, J., Villringer, A., Walter, M., Wang, L., Weng, X. C., Whitfield-Gabrieli, S., Williamson, P., Windischberger, C., Zang, Y. F., Zhang, H. Y., Castellanos, F. X., and Milham, M. P. (2010). Towards discovery science of human brain function. Proc. Natl. Acad. Sci. U.S.A. 102, 4734–4739.
Buckner, R. L., Snyder, A. Z., Shannon, B. J., LaRossa, G., Sachs, R., Fotenos, A. F., Sheline, Y. I., Klunk, W. E., Mathis, C. A., Morris, J. C., and Mintun, M. A. (2005). Molecular, structural, and functional characterization of Alzheimer’s disease: evidence for a relationship between default activity, amyloid, and memory. J. Neurosci. 25, 7709–7717.
Castellanos, F. X., Margulies, D. S., Kelly, C., Uddin, L. Q., Ghaffari, M., Kirsch, A., Shaw, D., Shehzad, Z., Di Martino, A., Biswal, B., Sonuga-Barke, E. J., Rotrosen, J., Adler, L. A., and Milham, M. P. (2008). Cingulate-precuneus interactions: a new locus of dysfunction in adult attention-deficit/hyperactivity disorder. Biol. Psychiatry 63, 332–337.
Dosenbach, N. U., Fair, D. A., Miezin, F. M., Cohen, A. L., Wenger, K. K., Dosenbach, R. A., Fox, M. D., Snyder, A. Z., Vincent, J. L., Raichle, M. E., Schlaggar, B. L., and Petersen, S. E. (2007). Distinct brain networks for adaptive and stable task control in humans. Proc. Natl. Acad. Sci. U.S.A. 104, 11073–11078.
Fukunaga, M., Horovitz, S. G., van Gelderen, P. de Zwart, J. A., Jansma, J. M., Ikonomidou, V. N., Chu, R. Deckers, R. H., Leopold, D. A., and Duyn, J. H. (2006). Large-amplitude, spatially correlated fluctuations in BOLD fMRI signals during extended rest and early sleep stages. Magn. Reson. Imaging 24, 979–992.
Paakki, J. J., Rahko, J., Long, X. Y., Moilanen, I., Tervonen, O., Nikkinen, J., Starck, T., Remes, J., Tuula, H., Haapsamo, H., Jussila, K., Kuusikko-Gauffin, S., Mattila, M. L., Zang, Y. F., and Kiviniemi, V. (2010). Alterations in regional homogeneity of resting-state brain activity in autism spectrum disorders. Brain Res. [Epub ahead of print] doi:10.1016/j.brainres.2009.12.081.