Intrinsic variability in Pv, RRP size, Ca2+ channel repertoire, and presynaptic potentiation in individual synaptic boutons
- 1Department of Biochemistry, Weill Cornell Medical College, New York, NY, USA
- 2David Rockefeller Graduate Program, The Rockefeller University, New York, NY, USA
The strength of individual synaptic contacts is considered a key modulator of information flow across circuits. Presynaptically the strength can be parsed into two key parameters: the size of the readily releasable pool (RRP) and the probability that a vesicle in that pool will undergo exocytosis when an action potential fires (Pv). How these variables are controlled and the degree to which they vary across individual nerve terminals is crucial to understand synaptic plasticity within neural circuits. Here we report robust measurements of these parameters in rat hippocampal neurons and their variability across populations of individual synapses. We explore the diversity of presynaptic Ca2+ channel repertoires and evaluate their effect on synaptic strength at single boutons. Finally, we study the degree to which synapses can be differentially modified by a known potentiator of presynaptic function, forskolin. Our experiments revealed that both Pv and RRP spanned a large range, even for synapses made by the same axon, demonstrating that presynaptic efficacy is governed locally at the single synapse level. Synapses varied greatly in their dependence on N or P/Q type Ca2+ channels for neurotransmission, but there was no association between specific channel repertoires and synaptic efficacy. Increasing cAMP concentration using forskolin enhanced synaptic transmission in a Ca2+-independent manner that was inversely related with a synapse's initial Pv, and independent of its RRP size. We propose a simple model based on the relationship between Pv and calcium entry that can account for the variable potentiation of synapses based on initial probability of vesicle fusion.
Introduction
Synapses made by the same axon can have very different neurotransmitter release characteristics. There are reports of substantial variation in the probability of neurotransmitter release (Pr) using many techniques (Rosenmund et al., 1993; Murthy et al., 1997; Branco et al., 2008, 2010; Granseth and Lagnado, 2008; Matz et al., 2010; De Jong et al., 2012). Important influences on Pr at each synapse are the identity of target neurons (Markram et al., 1998; Reyes et al., 1998; Sylwestrak and Ghosh, 2012), the activity level and position on dendrites being contacted (Branco et al., 2008; De Jong et al., 2012), and the GABA concentration in the local microenvironment (Laviv et al., 2010). However, how these influences translate into different Pr values for synapses along the same axon is largely unknown.
Pr gives a measure of the all-or-none behavior of synapses, i.e., the probability that at least one synaptic vesicle will fuse following an action potential (AP). Two main building blocks influence Pr. First, the number of vesicles, n, at the active zone in a biochemical state that only requires calcium entry to trigger exocytosis [also known as the readily releasable pool (RRP)]. Second, the probability that each vesicle will fuse with the membrane in response to an AP (Pv). This parameter describes in part the likelihood that calcium influx within the active zone satisfactorily binds the calcium sensor to trigger exocytosis. In a binomial model of neurotransmitter release (Schneggenburger et al., 2002) the average number of vesicles that fuse in response to an AP will be the product of n and Pv, whereas Pr will be:
Various factors can influence Pv and RRP size independently (Ariel and Ryan, 2012). Although previous studies examined Pr variation across individual synapses, most measures of Pv and RRP are carried out only for ensembles of synapses (for example, Jockusch et al., 2007; Weston et al., 2011). A recent study explored Pv and RRP size at individual boutons of neurons in hippocampal cultures, and found substantial variation in both parameters, even for synapses made by the same axon (Ermolyuk et al., 2012). Pv correlated with the amount of presynaptic Ca2+ influx, suggesting this is a key control variable that sets differences in efficacy between synapses.
Given that there are multiple Ca2+ channel subtypes that contribute to the Ca2+ influx necessary for neurotransmitter release, we wondered whether different repertoires of Ca2+ channels might be associated with synapses of different strengths. There is evidence that individual boutons can vary substantially in their dependence on N or P/Q-type channels for exocytosis (Reuter, 1995). In young neurons grown in autaptic cultures, there was no correlation between Pr and the distribution of N or P/Q-type channels (Reid et al., 1997). However, that study did not directly examine individual synapses, and it is unclear whether its results can be extrapolated to more mature synapses. For example, during maturation of the calyx of Held synapse, P/Q-type channels become the main drivers of neurotransmitter release by more closely coupling to synaptic vesicles (Fedchyshyn and Wang, 2005). Thus, the role of Ca2+ channel heterogeneity across small individual synapses remains unclear.
In addition to differing in baseline neurotransmitter release properties, individual synapses can vary in how they are modulated. For example, type III metabotropic glutamate receptor 7 (mGluR7) is specifically enriched in presynaptic terminals that contact interneuron targets (Shigemoto et al., 1996; Lujan et al., 1997). Consequently, glutamate release from individual CA3 pyramidal cells is inhibited by type III mGluR agonists at synapses onto interneurons, but not pyramidal cells (Scanziani et al., 1998). Another example is the negative modulation of Pr by GABAB receptors. In young hippocampal neurons in autaptic culture, the agonist baclofen does not affect a subset of synapses with high Pr, suggesting receptors are heterogeneously distributed in presynaptic terminals of the same axon (Rosenmund et al., 1993). Beyond these examples, the issue of presynaptic synapse-specific modulation has not been extensively studied.
Here we extended previously developed optical measures of Pv and RRP size (Ariel and Ryan, 2010) to determine how these parameters vary across populations of individual nerve terminals. Subsequently, we studied whether different repertoires of N and P/Q type Ca2+ channels were predictive of synaptic strength. Finally, we examined how Pv and RRP size are impacted by direct activation of adenylyl cyclase by forskolin, a potentiator of presynaptic function, to determine the variability of how individual synapses can be potentiated.
Results
Measurements of Pv and RRP Size at Individual Synapses
To obtain reliable estimates of Pv and RRP size at individual synapses we extended a previously developed optical method based on the vesicular glutamate transporter fused to the pH-sensitive GFP pHluorin (vG-pH, Ariel and Ryan, 2010). The approach makes use of the single AP-sensitivity of vG-pH responses that can be averaged over many trials to obtain robust single bouton AP response estimates (see below). These are compared to measurements of the RRP size obtained by examining the kinetics and amplitudes of exocytosis in response to high-frequency (100 Hz) AP firing. To improve the robustness of RRP measurements at single synapses we modified our previous protocol for ensembles of synapses (Ariel and Ryan, 2010), enhancing the ability to detect a plateau phase indicative of RRP depletion in the kinetics of exocytosis during high frequency AP firing (Materials and Methods).
One of the main issues to consider when measuring responses from individual synapses is that potentially large statistical fluctuations are expected from a binomial process with a relatively low Pv and n (n = number of vesicles in the RRP). Our experiments consist of several trials where the stimulus is a single AP. These responses are averaged for each synapse and compared to the corresponding estimate of RRP size, giving a measure of Pv. If we assume that a binomial process with parameters Pv and n fully describes the behavior of a synapse during this kind of experiment, we can ask how much the measured Pv will fluctuate around the real Pv. The relative size of those fluctuations will depend on Pv, n, and the number of trials (k) in the experiment. From simple binomial statistics, the expected coefficient of variation (CV) in an estimate of Pv will be:
Note that these fluctuations are unavoidable and would be present even if using an idealized detection system without any noise. The main way to minimize their effect in any given experiment is to perform as many trials as possible. For example, an experiment to estimate Pv in single synapses with an expected CV of 15% would require 100 trials, assuming Pv = 0.1 and n = 4 [our averages under standard conditions, see Ariel and Ryan (2010)]. Obtaining such a large number of measurements is problematic because it requires long experiments and total cumulative exposures to laser illumination that can be detrimental to cell health. By extension, it is doubly difficult to execute a baseline measurement, follow it with a pharmacological application and measure the effect of that intervention. Furthermore, because our calculation only illustrates the CV of an average synapse, we expect many measurements—in lower Pv synapses—to be subject to larger fluctuations. For all of these reasons, we chose to increase the concentration of extracellular Ca2+ ions to 4 mM. Based on our previous results (Ariel and Ryan, 2010) we expected this would raise Pv to approximately 0.35. Using Equation 2, to measure Pv with an expected CV of 15% under these conditions requires only 21 trials. This allows relatively shorter experiments where maintaining cell viability is feasible.
To robustly estimate both Pv and RRP size from individual synapses, we repeated many trials where we measured the responses to both single APs (30 trials) and bursts at 100 Hz (12 trials). For each synapse, we calculated the SEs in the estimates of Pv and RRP size using conventional error propagation techniques (see Materials and Methods). The number of trials in our experimental design was sufficient to precisely determine Pv and RRP at individual synapses. In the case of RRP size, the median SE—expressed as % of TP—was 0.4%. In the case of Pv, the median SE was 0.06. In total, we measured Pv and RRP size in 410 synapses from 32 experiments (see Materials and Methods for further details). Figure 1 shows data from a representative experiment.
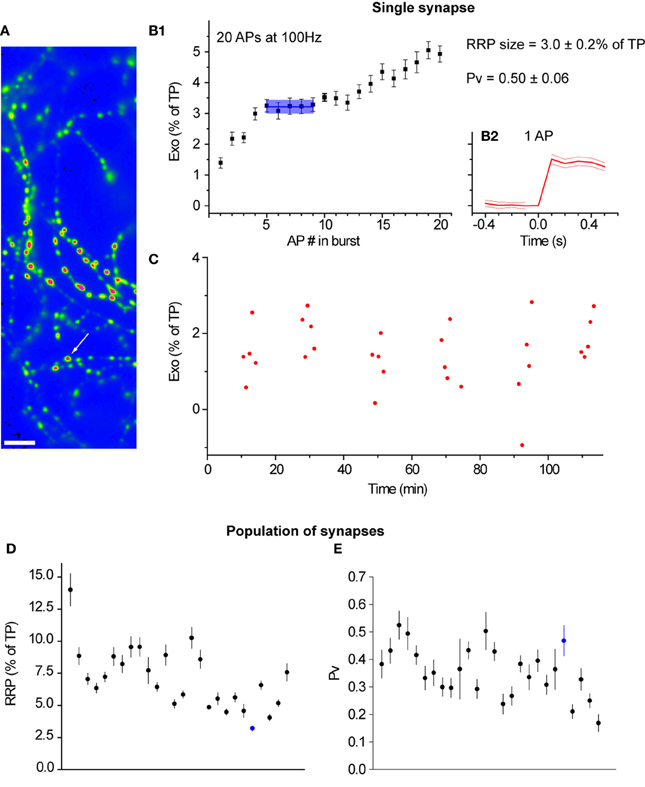
Figure 1. Pv and RRP size can be measured precisely at many individual synapses in parallel. (A) Field of boutons in a representative experiment. The image is the difference in fluorescence before and after the application of 50 mM NH4Cl and is smoothed for presentation purposes only. The arrow marks the synapse shown in detail in the rest of the figure. Scale bar = 5 μm. (B1) Cumulative exocytosis in response to 20 APs at 100 Hz for the indicated synapse (n = 12 trials). The blue line indicates the RRP size. The light blue shading indicates the region where a plateau, indicative of exhaustion of the RRP, was detected using our methods, along with the SE in the RRP size (see Materials and Methods). (B2) Exocytosis in response to a single action potential. The thick red line indicates an average over 30 trials. The thin red lines show the SE of this average. The vertical scale is the same as in (B1) and is aligned with that panel for convenience. (C) Responses to single APs for the indicated synapse. Note the stability in the response throughout almost 2 h of imaging. (D) RRP size and (E) Pv respectively for 26 synapses in this experiment that passed our filtering criteria (see Materials and Methods). Each point corresponds to an individual synapse. Synapses are ordered in both panels according to their single AP responses (as fraction of TP) from highest (left) to lowest (right). The synapse marked in blue is the one analyzed in (B1), (B2), and (C).
To check whether our RRP size results were consistent with previous measurements we estimated how many vesicles were present in the RRP. To that end we assumed that all synaptic vesicles were labeled with the vG-pH reporter and that, on average, there were 64 vesicles in the releasable pool of vesicles (Balaji and Ryan, 2007). Furthermore, we assumed that the releasable pool of vesicles constituted 60% of the total pool of labeled vesicles (Fernandez-Alfonso and Ryan, 2008). Combining these assumptions we estimated that, on average, there would be 106 labeled vesicles in each synapse. Comparing this to the average size (across all synapses) of the fluorescence response to a brief alkalinizing pulse of NH4Cl we estimated the fluorescence of an individual labeled synaptic vesicle. This parameter allowed us to calculate the average number of vesicles in the RRP (4.2 ± 0.1) which was in good agreement with our previous results using cell-wide measurements (Ariel and Ryan, 2010) and the number of docked vesicles observed by electron microscopy in hippocampal synapses in culture (Schikorski and Stevens, 1997). Using our estimates of Pv and n in Equation 2, the median expected CV of Pv measurements—due solely to statistical fluctuations—was 11% (range = 0–39%).
Individual Synapses Vary Considerably in Pv and RRP Size
Confident that we had robust measures of Pv and RRP size at individual boutons, we studied the variability in these basic exocytosis parameters between synapses. Interestingly, we found a large degree of variability in both parameters (Figure 2). Overall the average CV across the sampled population was 39% for Pv and 61% for RRP size. Furthermore, a considerable amount of this variability was present between synapses in the same experiment. The average CV of Pv within each experiment was 30% (range: 22–56%) and 42% for RRP size (range: 21–80%). The variability in RRP size was not a consequence of our normalization to the size of the total pool of vesicles within each synapse as the CVs were still large even when we considered raw ΔF values of RRP size (CVall = 61%; CVwithin = 37%; range = 15–56%). It is important to note that we could not initially rule out that synapses included in our experiments belonged to axons from different somas as we frequently had more than one neuron transfected in a given dish. Thus, variation between synapses might be due to differences between the neurons that give rise to various subsets of boutons in any given imaged field. To directly obtain estimates of the variability between synapses made by the same axon we took two approaches, detailed below.
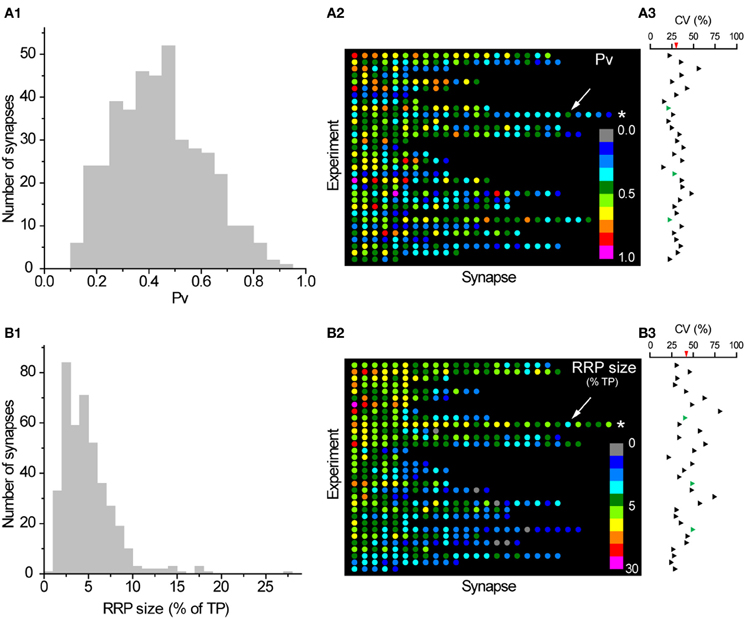
Figure 2. Large variation in Pv and RRP size between individual synapses. (A1) Histogram of Pv across synapses (a synapse with 1.1 ± 0.2 was excluded for convenience of presentation). (A2) Color map of Pv values in all synapses included in our analysis. Each row in this plot represents a single experiment and each dot within that row a single synapse from that experiment. Synapses are colored according to their Pv with cold colors representing low Pv values and warm colors representing high Pv values. The inset shows the Pv color scale. Synapses within each experiment are ranked according to their average response to a single AP (as % of TP) from left (highest) to right (lowest). Experiments are ordered according to their average synaptic response to a single AP from top (highest) to bottom (lowest). The asterisk highlights the experiment shown in Figure 1 and the arrow indicates the synapse shown in more detail in Figures (1B,C). (A3) The CVs in Pv values for each experiment are shown aligned with the corresponding row in (A2). The average CV in Pv across experiments is shown as a red triangle in the scale bar. Three experiments where all synapses belonged to the same axon are shown in green. (B1–B3) Histogram, color map, and CVs within each experiment of RRP size (as % TP), analogous to (A1–A3). Synapses in (B2) are ordered identically to (A2) so a dot in the equivalent position on the color maps represents the same synapse, while equivalent rows represent the same experiment. Note that the scaling of colors coding RRP sizes is logarithmic.
First, we used retrospective immunostaining for vG-pH to trace the entire axonal arbor in a subset of our experiments. In most cases (6/9) several transfected somas gave rise to axons that intercrossed in the imaged region such that we could not unambiguously determine that all synapses under study came from just one neuron. However, in three experiments retrospective tracing of processes proved that all imaged synapses were indeed formed by the same axon (green triangles in Figures 2A3 and 2B3). The CV of Pv in those experiments was 20% (n = 14 synapses), 27% (n = 10 synapses), and 22% (n = 24 synapses). On the other hand, the CV of RRP size was 40, 48, and 49%, respectively. This analysis shows that a large amount of variability is present in Pv and RRP size even between synapses made by the same axon, with the caveat that the conclusion is drawn from a small number of observations.
Second, in several cases we were able to determine unambiguously that small groups of adjacent boutons belonged to the same axonal branch. Close inspection of images taken during some experiments clearly showed isolated lengths of axon with groups of three or more boutons, arranged en passant. In total, this analysis revealed 64 synapses grouped in 17 axonal branches in 15 experiments. We calculated the CV in Pv and RRP size across boutons in each axonal branch (subsequently averaging across branches in experiments with more than one group of boutons that fulfilled the criteria). The average CV in Pv (across experiments) between boutons of the same axonal branch was 38%. This suggests that all of the variability in Pv between synapses in an experiment (CV = 30%, see above) is present even among boutons on the same axonal branch. Similarly, the average CV in RRP size (across experiments) between boutons of the same axonal branch (46%) was comparable to that of all boutons in a given experiment (42%, see above). In conclusion, synapses can differ greatly in Pv and RRP size, even if they are in close proximity on the same axonal branch.
Ca2+ Channel Repertoire does not Determine Efficacy of Neurotransmitter Release at Individual Synapses
Having established that synapses made by the same axon could vary substantially in Pv and RRP size, we explored the idea that different Ca2+ channel subtype repertoires at individual synapses might be associated with varying efficacies of neurotransmitter release.
Before addressing this issue directly, we first determined the relative contributions of N and P/Q type Ca2+ channels to exocytosis in response to 1 AP in our system. Using our previously developed methods to study exocytosis in groups of synapses (Ariel and Ryan, 2010), we found that ω-agatoxin IVA (a specific blocker of P/Q type Ca2+ channels) caused a 43 ± 8% decrease in single AP exocytosis (n = 12 experiments). Conversely, selectively blocking N type Ca2+ channels with ω-conotoxin GVIA caused an 82 ± 7% reduction in exocytosis (n = 10 experiments). In principle, the larger effect on exocytosis of blocking N-type Ca2+ channels could be due to the presence of more of those channels, a larger current per channel, or to closer coupling between that channel type and primed vesicles. To test the last of these possibilities, we measured the effects of ω-agatoxin IVA and ω-conotoxin GVIA on Ca2+ entry in response to a single AP, using MgGreen-AM. Blocking P/Q type Ca2+ channels reduced Ca2+ entry by 19 ± 2% (n = 4 experiments) whereas blocking N-type Ca2+ channels caused a 42 ± 6% decrease (n = 5 experiments). If the coupling of each Ca2+ channel subtype to vesicles were the same, we would expect the reduction in Ca2+ entry caused by either toxin to cause a decrease in exocytosis predictable by the curve that relates exocytosis and Ca2+ entry under control conditions [Figure 2C in Ariel and Ryan (2010)]. However, if N type channels were closer to vesicles, there should be a larger decrease in exocytosis for a given reduction in Ca2+ than expected from the control curve. Thus, plotting the exocytosis and Ca2+ entry data in the presence of toxins and comparing it to the control curve is a test of whether the coupling between Ca2+ channels and primed vesicles differs according to subtype. In fact, the data obtained in the presence of either toxin agrees well with our control curve relating exocytosis and Ca2+ entry (Figure 3). This indicates there is no difference in coupling between P/Q and N Ca2+ channel subtypes. Therefore, the larger contribution of N-type Ca2+ channels to exocytosis might be due to larger numbers of active channels in the presynaptic membrane or a higher current per channel.
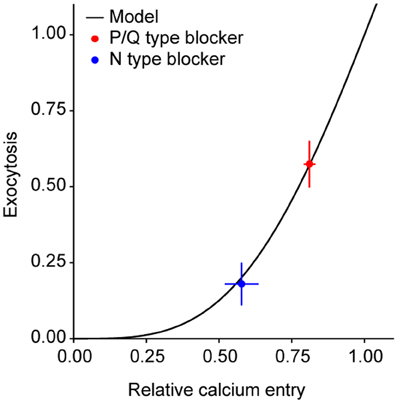
Figure 3. P/Q and N-type Ca2+ channels do not differ in their coupling to primed synaptic vesicles. Exocytosis as a function of the relative Ca2+ entry in response to 1 AP. The model is from a fit to exocytosis vs. Ca2+ entry data in a previous publication [Figure 2C in Ariel and Ryan (2010)]. For convenience, exocytosis and Ca2+ have been renormalized to the expected values for 1 AP at 4 mM extracellular Ca2+. Note the good agreement between the model and the data in the presence of toxins.
Once we had determined the relative importance of N and P/Q-type Ca2+ channels for exocytosis, we tested the hypothesis that different repertoires or “mixes” of Ca2+ channel subtypes are associated with synapses of different efficacies. To that end, in a subset of the experiments designed to measure properties at single synapses, we applied toxins specific to each Ca2+ channel subtype after measuring basal Pv and RRP size. We reasoned that if Ca2+ channel subtypes were differentially distributed across synapses with different efficacies, there would be a correlation between the effect of the toxins on single AP responses and Pv. On the other hand, a priori we did not expect a correlation between the effect of either toxin and RRP size.
Overall, blocking N-type Ca2+ channels led to a larger decrease in single AP responses at individual synapses (89 ± 1%, n = 101 synapses in 8 experiments, Figures 4A2,B) than blocking P/Q type Ca2+ channels (43 ± 3% n = 103 synapses in 9 experiments, Figures 4A1,B), as expected from the data in Figure 3. Interestingly, there was a larger range of effects across synapses when we blocked P/Q type channels (Figure 4B, STDEVP/Qeffect = 0.27 compared to STDEVNeffect = 0.14, compare also Figures 5A and 6A).
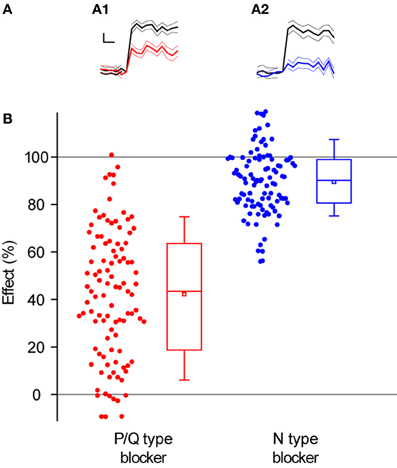
Figure 4. Block of P/Q-type Ca2+ channels leads to weaker and more variable decrease of exocytosis than block of N-type Ca2+ channels. (A) Representative single synapse responses to 1 AP stimulus before and after the application of toxins that block Ca2+ channel subtypes. (A1) Response to 1 AP before (black) and after (red) applying ω-agatoxin IVA (effect of toxin = 45 ± 12%). (A2) Response to 1 AP before (black) and after (blue) applying of ω-conotoxin GVIA (effect of toxin = 81 ± 11%). Each trace in (A1) and (A2) is an average of 30 trials with the thinner lines representing the SEs. Traces are normalized to the size of the response before applying the corresponding toxin and shown on the same scale. Scale bar: 0.2 s and 20% of pre-toxin response. (B) Effect of P/Q and N-type Ca2+ channel blockers across all synapses. The effect of a toxin is defined as the percentage decrease in single AP responses. Each dot corresponds to one synapse. Box whisker plots show the median (line), mean (point), 25–75 percentile (box), and 10–90 percentile (whisker) ranges (n = 103 synapses from 9 experiments for P/Q-type blocker, 101 synapses from 8 experiments for N-type blocker).
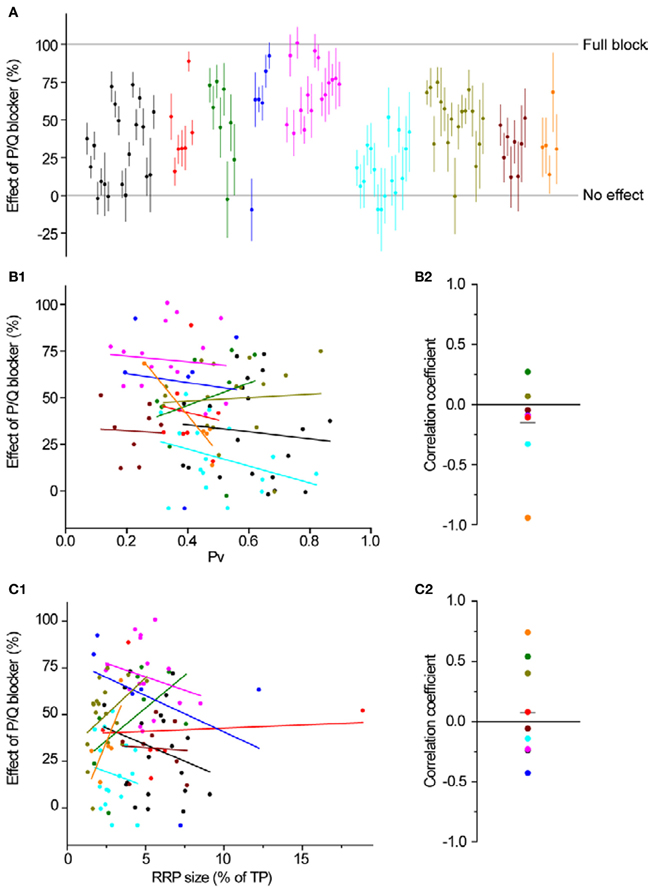
Figure 5. P/Q-type Ca2+ channel distribution is independent of Pv and RRP size. (A) The effect of ω-agatoxin IVA on exocytosis in response to a single AP. Different colors represent individual experiments, while each dot shows the effect of the blocker on a single synapse (with its SE). Experiments are ordered according to their responses to an individual AP from highest (left) to lowest (right). Within an experiment, synapses are also sorted from most (left) to least responsive (right). (B1,B2) Effect of a P/Q blocker is independent of Pv. (B1) Each dot is a synapse and the coloring scheme is the same as in (A). Lines represent best fits for each experiment, colored accordingly. (B2) Correlation coefficients of the effect of P/Q block with Pv for were not significantly different from 0 (one-sample, two-tailed t-test against null hypothesis μ = 0, P = 0.21, t-value = −1.36). Each dot represents the value of the correlation coefficient for 1 experiment, with colors consistent with the rest of the figure. The gray line represents the average correlation coefficient across experiments. (C1,C2) Effect of a P/Q blocker is independent of RRP size. Coloring and symbols are analogous to (B1) and (B2). Correlation coefficients of the effect of P/Q block with RRP size for each experiment were not significantly different from 0 (one-sample, two-tailed t-test against null hypothesis μ = 0, P = 0.60, t-value = 0.55).
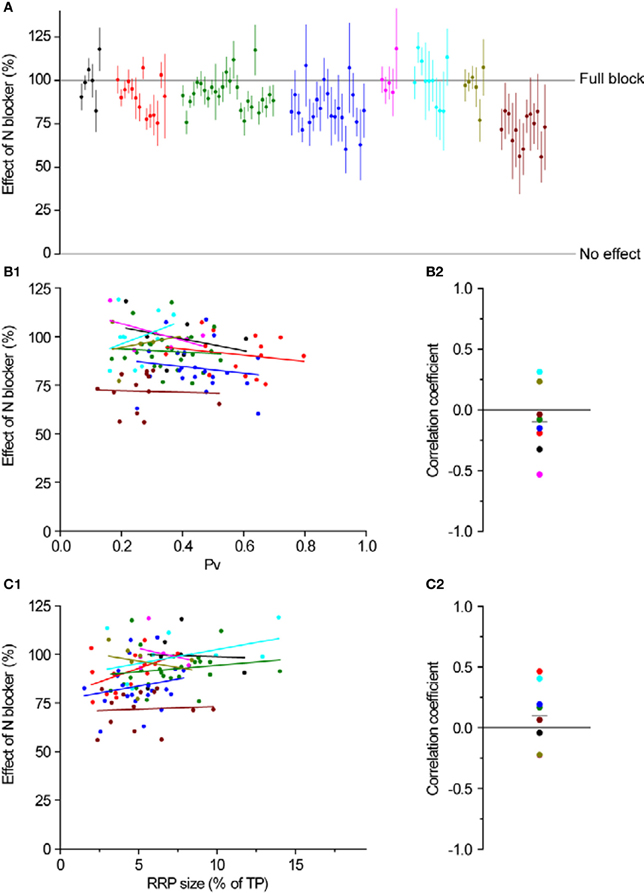
Figure 6. N-type Ca2+ channel distribution is independent of Pv and RRP size. (A) The effect of ω-conotoxin GVIA on exocytosis in response to a single AP. Different colors represent individual experiments, while each dot shows the effect of the blocker on a single synapse (with its SE). Experiments are ordered according to their responses to an individual AP from highest (left) to lowest (right). Within an experiment, synapses are also sorted from most (left) to least responsive (right). (B1,B2) Effect of an N blocker is independent of Pv. (B1) Each dot is a synapse and the coloring scheme is the same as in (A). Lines represent best fits for each experiment, colored accordingly. (B2) Correlation coefficients of the effect of N block with Pv for each experiment were not significantly different from 0 (one-sample, two-tailed t-test against null hypothesis μ = 0, P = 0.36, t-value = −0.98). Each dot represents the value of the correlation coefficient for 1 experiment, with colors consistent with the rest of the figure. The gray line represents the average correlation coefficient across experiments. (C1,C2) Effect of an N blocker is independent of RRP size. Coloring and symbols are analogous to (B1) and (B2). Correlation coefficients of the effect of N block with RRP size for each experiment were not significantly different from 0 (one-sample, two-tailed t-test against null hypothesis μ = 0, P = 0.32, t-value = 1.08).
Having established the average effects of each toxin at individual boutons, we analyzed the data more closely, searching for correlations between the effect of P/Q or N-type blockers and Pv or RRP size. As we expected, there was no correlation between the magnitude of inhibition of either toxin and RRP size (Figures 5C1,C2 and 6C1,C2). Similarly, we did not find any correlation between the effect of toxin and Pv (Figures 5B1,B2 and 6B1,B2). These results indicate that Ca2+ channel subtypes are not differentially distributed on boutons with different synaptic efficacies.
Malleability of Synapses—The cAMP Pathway
After studying the variability in Pv and RRP size, and its potential relation to Ca2+ channel subtypes, we wondered whether the baseline Pv or RRP size might influence how synapses would respond to a potentiating stimulus.
One way of altering synaptic strength is to increase intracellular concentrations of cAMP. This activates protein kinase A (PKA) and Epac, the guanine nucleotide exchange factor for the small G protein Rap, leading to increased Pv and/or RRP size in many different neuronal preparations (Chavez-Noriega and Stevens, 1994; Trudeau et al., 1996; Chen and Regehr, 1997; Trudeau et al., 1998; Sakaba and Neher, 2001; Kaneko and Takahashi, 2004; Huang and Hsu, 2006; Gekel and Neher, 2008; Yao and Sakaba, 2010). The most detailed and recent of these studies, using the elegant biophysical tools available in the calyx of Held preparation (Yao and Sakaba, 2010), showed that raising cAMP concentration leads to large increases in Pr and much smaller increases in RRP size. The larger Pr is not due to changes in Ca2+ entry but to an increase in vesicle fusogenicity, as assayed with Ca2+ uncaging.
To explore this pathway to synaptic potentiation in our system, we applied forskolin (50 μM). We selected forskolin because it activates adenlyl cyclase directly (Insel and Ostrom, 2003), bypassing possible variability in potentiation effects due to variations in cell surface receptors at different synapses. Single AP responses at 2 mM extracellular Ca2+ were larger (+125 ± 35%, n = 8 experiments, P ≤ 0.004, one-sample, one-tailed t-test with the null hypothesis μ ≤ 0, t-value = 3.58) due to effects on both Pv (+85 ± 27%, P = 0.008, one-sample, one-tailed t-test with the null hypothesis μ ≤ 0, t-value = 3.18) and RRP size (+22 ± 6%, P = 0.004, one-sample, one-tailed t-test with the null hypothesis μ ≤ 0, t-value = 3.60).
To clarify the basis of the changes in Pv, we studied the effects of forskolin on Ca2+ entry in response to a single AP, measured in two ways. First, we used the calcium sensitive dye MgGreen, in its AM-ester form. Second, we used the genetically encoded calcium indicator GCaMP3 (with a correction applied for its non-linear response to Ca2+, see Materials and Methods). These methods have complimentary advantages and disadvantages. MgGreen allows high temporal resolution, but it is impossible to completely rule out contributions from postsynaptic compartments [though most of the signal is sensitive to a P/Q and N-type Ca2+ channel blocker, see Ariel and Ryan (2010)]. Conversely, using GCaMP3 in sparsely transfected cultures, it is easy to restrict measurements to presynaptic compartments. However, this indicator is comparatively slow, and measurements may confound effects on Ca2+ entry and clearance. Using the above measurements of forskolin's effect on Pv, and the non-linear relationship between Pv and Ca2+ entry [Figure 2C in Ariel and Ryan (2010)], we estimated that if the entire effect of forskolin on Pv were due to an increase in Ca2+ entry, there would be a 24% rise in the latter. However, measurements with MgGreen (−3 ± 7%, n = 6, P = 0.73 in one-sample, one-tailed t-test with the null hypothesis μ = 0, t-value = −0.37) and GCaMP3 (−1 ± 11%, n = 6, P = 0.92 in one-sample, one-tailed t-test with the null hypothesis μ = 0, t-value = −0.10) showed no such increase (Figures 7A,B). This suggests that forskolin does not raise Pv through an increase in Ca2+ entry.
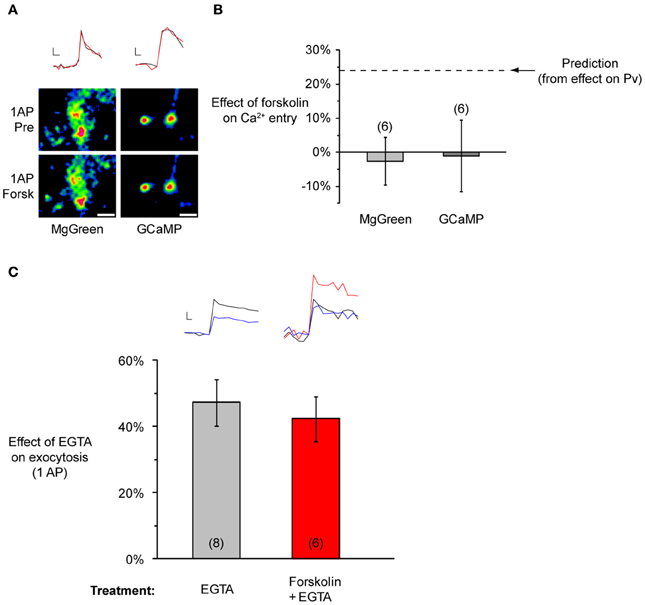
Figure 7. Forskolin does not affect calcium entry or coupling between Ca2+ and primed vesicles. (A) Representative experiments showing no effect of forskolin on Ca2+ entry. Top: Sample traces from a MgGreen (left) or GCaMP3 (right) experiment before (black) and after forskolin (red). Scale bar MgGreen: 20% of baseline peak, 25 ms. Scale bar GCaMP3: 20% baseline peak, 50 ms. Bottom: Representative responsive regions from each experiment. Each set of images corresponds to a subset of responsive regions included in the analysis. Images are averages of single AP difference images (n = 10 trials for MgGreen, n = 30 trials for GCaMP3), smoothed for presentation purposes only. Scale bar = 2 μm. (B) No effect on single AP Ca2+ entry, measured with MgGreen or GCAMP3 with 2 mM extracellular Ca2+. The dashed line indicates the predicted effect if forskolin's action on Pv were entirely through an increase in Ca2+ entry. (C) Forskolin does not change the effect of EGTA on single AP exocytosis (EGTA-AM applied for 90 s at 100 μM and washed for 10 min). Inset at top left: Sample traces from a single experiment before (black) and after a pulse of EGTA-AM (blue). Inset at top right: Sample traces from a single experiment in baseline conditions (black), after forskolin (red), and after adding pulse of EGTA-AM to the forskolin solution (blue). Scale bar MgGreen: 20% of pre forskolin peak, 10 ms.
Given that forskolin-induced Pv increases were not due to larger Ca2+ entry, two main possibilities remained to be tested. First, primed vesicles might be more tightly coupled to Ca2+ channels. Second, the vesicle fusion machinery might be in a more fusogenic state for any given calcium concentration. The first hypothesis is testable by applying the calcium buffer EGTA (Eggermann et al., 2012). If vesicles move closer to Ca2+ channels after forskolin application, then it should be more difficult for EGTA molecules to intercept Ca2+ as it diffuses from the channel mouth to calcium sensors on the vesicles. Therefore, we would expect the effect of EGTA on exocytosis to be smaller after applying forskolin. To test this idea, we measured single AP exocytosis before and after applying EGTA-AM (Figure 7C). As expected, this led to a reduction in exocytosis (47 ± 7%, n = 8 experiments). However, when we repeated the experiment adding forskolin before the EGTA exposure, the reduction in single AP exocytosis was indistinguishable from the control [42 ± 7%, n = 6 experiments, P = 0.66 in one-way ANOVA, F(1, 11) = 0.21]. This suggests forskolin does not modify the effective distance between vesicles and Ca2+ channels. Thus we conclude that forskolin likely acts by making vesicles more fusogenic. A purer test of this would be to artificially control rapid jumps in intracellular calcium using calcium uncaging, something that has only recently become technically feasible in a few preparations (Burgalossi et al., 2010; Trigo et al., 2012). However, our results are completely consistent with those found in the calyx of Held (Yao and Sakaba, 2010), and allow us to speculate that rises in cAMP cause an increase in primed vesicle fusogenicity, without affecting Ca2+ entry or vesicle-to-channel coupling.
All of the aforementioned measurements with forskolin were performed on groups of boutons using 2 mM extracellular Ca2+. However, our main goal in using forskolin was to test whether its potentiating effects would be different in synapses with initially different exocytosis properties. To that end, in a subset of the experiments in Figure 2 (6 experiments from 3 independent culture sets), we measured RRP size and Pv at single synapses, subsequently applied forskolin and estimated its effect on single AP responses. As expected from a simple model of exocytosis (see Discussion) the effect of forskolin at 4 mM extracellular Ca2+ (27 ± 5%, n = 81 boutons) was smaller than at 2 mM (+125 ± 35%, n = 8 experiments, see above). Interestingly, the effect of forskolin was very variable across synapses (Figure 8A) but showed a clear association with Pv. We consistently observed a negative correlation between the effect of forskolin and initial Pv (Figures 8B1,B2). Conversely, there was no correlation between the effect of forskolin and RRP size (Figures 8C1,C2). Therefore, synapses with lower basal Pv showed larger responses to the forskolin treatment.
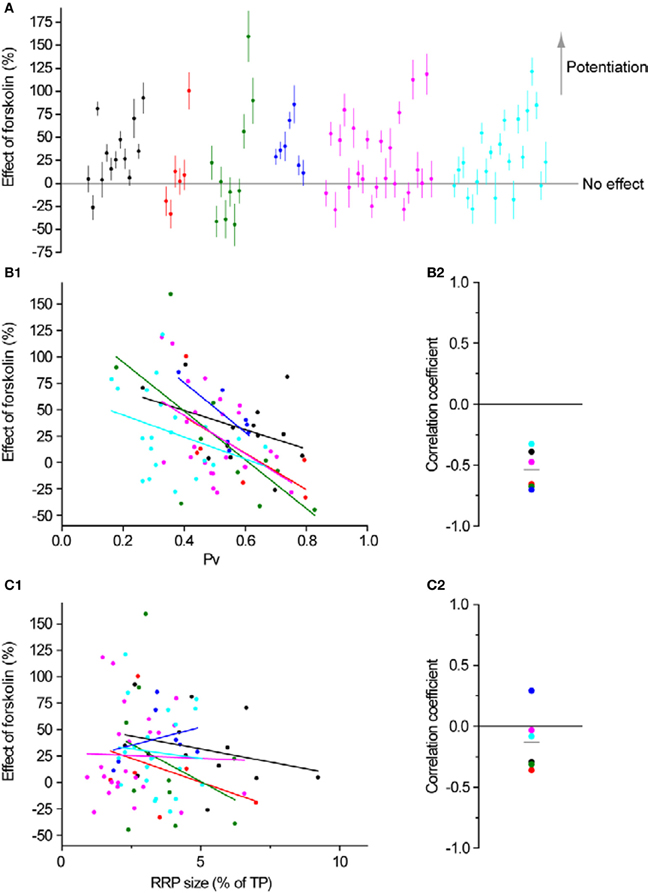
Figure 8. Synapses are differentially modulated by forskolin according to their baseline Pv. (A) Effect of forskolin on exocytosis in response to a single AP. Different colors represent individual experiments, while each dot shows the effect of the drug on a single synapse with its SE. Experiments are ordered according to their responses to an individual AP from highest (left) to lowest (right). Within an experiment, synapses are also sorted from most (left) to least responsive (right). (B1,B2) Effect of forskolin is negatively correlated with Pv. (B1) Each dot is a synapse and the coloring scheme is the same as in (A). Lines represent best fits for each experiment, colored accordingly. (B2) There is a negative correlation between the effect of forskolin and Pv (one-sample two-tailed t-test against null hypothesis μ = 0 for Pearson correlation coefficients, P = 0.0004, t-value = −8.17). Each dot represents the value of the correlation coefficient for 1 experiment, with colors consistent with the rest of the figure. The gray line represents the average correlation coefficient across experiments. (C1,C2) Effect of forskolin is independent of RRP size. Coloring and symbols are analogous to (B1) and (B2). Correlation coefficients of the effect of forskolin with RRP size for each experiment were not significantly different from 0 (one-sample two-tailed t-test against null hypothesis μ = 0, P = 0.25, t-value = −1.31).
To explore this relationship further, we binned the data in Figure 8B1 according to initial Pv. When the data are thus binned the inverse relationship between the effect of forskolin and initial Pv becomes even clearer (Figure 9). Furthermore, by incorporating the data obtained with 2 mM extracellular Ca2+, it becomes evident that this general trend also applies to cases where initial Pv is smaller because extracellular Ca2+ is lower. In the discussion, we present a simple model that can explain these observations.
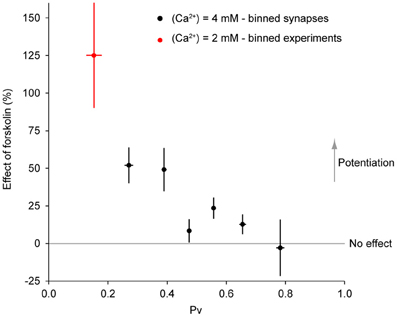
Figure 9. The effect of forskolin on exocytosis in response to a single action potential is negatively correlated with Pv. Combined data with 4 mM extracellular Ca2+ (Figure 8B1, binned across synapses) and 2 mM extracellular Ca2+ (see text, binned across experiments) shows an inverse relationship between initial Pv and the effect of forskolin (ρ = −0.88, P = 0.009).
Discussion
We present here methods that allow precise estimates of Pv and RRP size at the level of individual presynaptic terminals. We find there is great variability between synapses in their baseline Pv and RRP size, even when comparing boutons on the same axonal branch. We find that the exact repertoire of Ca2+ channel subtypes varies substantially between synapses, but is not predictive of synaptic efficacy. Finally, the potential for modulation by increasing cAMP levels is highly variable between individual presynaptic terminals, but overall follows a simple rule: synapses with lower initial Pv can be potentiated more.
Measurements at Individual Synapses
Previous reports have shown a large amount of variability in release properties between individual synapses of the same axon. Our study adds to a few others that have begun to systematically estimate the variability in Pv across synapses (Granseth and Lagnado, 2008; Ermolyuk et al., 2012). Our work illustrates a problem that is sometimes unrecognized when measuring properties of single AP potential exocytosis in individual small nerve terminals: statistical fluctuations inherent in the process being studied can render estimates of release parameters very imprecise, particularly when Pr, Pv, and/or n (the number of vesicles in the RRP) are low. This issue is particularly noteworthy because it cannot be sidestepped by improving the quality of the measurement system; rather, it is a consequence of the binomial nature of synaptic vesicle exocytosis. Equation 2 makes explicit how this will affect measurements of Pv. As mentioned above the more typically measured parameter is Pr, that is, the probability that a synapse will not fail in response to an AP. Using the same logic as for Equation 2, the CV in a measurement of Pr based on an experiment with k trials will be:
Thus, assuming Pr = 0.3 (a typical value reported with 2 mM extracellular Ca2+), to perform experiments where this parameter can be measured with an expected CV of less than 15% will require at least k = 88 runs. In addition, these runs need to be temporally spaced such that they are not influenced by short-term plasticity effects. These caveats are worth keeping in mind when designing and interpreting experiments where Pr and/or Pv are measured at individual synapses, particularly if conditions are such that these parameters are expected to be low. Given that physiological conditions typically involve higher temperatures and lower extracellular Ca2+ concentrations than those widely used for experiments in culture (Pyott and Rosenmund, 2002), this will likely lower Pr and further exacerbate this measurement challenge. Here, we purposefully shifted our synapses to a higher Pv regime and optimized our imaging conditions to ensure cell viability over the course of long experiments. Hopefully, further optimization will allow even more prolonged measurement windows under more physiological conditions.
Possible Determinants of Variation in Pv and RRP Size
The large amount of variability in both Pv and RRP size between synapses made by the same axonal branch begs the question of what factors are responsible for these differences. One major determinant is Ca2+ entry, which can vary systematically across synapses in a way that accounts for variability in Pv and Pr (Rozov et al., 2001; Koester and Johnston, 2005; Brenowitz and Regehr, 2007; Ermolyuk et al., 2012; Holderith et al., 2012; Sheng et al., 2012). Recent studies show that a critical control variable regulating Ca2+ entry is the number of Ca2+ channels at the presynaptic membrane (Holderith et al., 2012; Sheng et al., 2012). However, little is known about how the number of Ca2+ channels is set at the level of individual synapses. More generally, proteins that affect not only the number of Ca2+ channels, but their unitary currents, or their distribution in the active zone will be promising candidates for study. For example, the recent discovery that alpha2delta strongly affects Ca2+ trafficking and function makes it a promising candidate to explain differences between single synapses (Hoppa et al., 2012). Another molecule that has garnered recent attention is Rab3 interacting molecule (RIM), a protein enriched at active zones (Mittelstaedt et al., 2010) which controls Pv and RRP size through specific domains that interact directly with munc13 and Ca2+ channels, affecting priming, vesicle-to-channel coupling, and fusogenicity (Deng et al., 2011; Han et al., 2011; Kaeser et al., 2011). Additionally, RIM's relatively short half-life (around an hour, Yao et al., 2007) suggests it might act as a dynamic, rate-limiting control variable that sets synaptic strength. Finally, in a recent study, the levels of RIM at individual synapses were correlated with the total uptake of an antibody against a synaptic vesicle protein during stimulation (Lazarevic et al., 2011). While this is a comparatively crude measure of synaptic output, the correlation is nevertheless suggestive. Of course, there are many other molecules that might modulate Pv or RRP size and explain their variability between individual synapses. The methods we have developed here should aid in the search for those factors.
Ca2+ Channel Subtypes
The synapses in our study were more sensitive to block of N than P/Q-type Ca2+ channels. The relationship between the suppression of Ca2+ influx and the suppression of exocytosis by blockade of each channel was predicted well by the curve relating calcium influx and exocytosis in our system, determined previously (Ariel and Ryan, 2010). This correspondence indicates that both types of channels have similar coupling to release sites (Figure 3). The lack of difference in coupling between Ca2+ channel subtypes agrees with previous reports in hippocampal neurons (Wu and Saggau, 1995; Reid et al., 1998). This leaves differing numbers of channels or currents per channel as possible explanations for the larger effect of N-type block. Unitary Ca2+ channel properties were recently measured in the calyx of Held synapse and did not differ significantly between N and P/Q subtypes (Sheng et al., 2012). If this holds in our experimental system it would suggest that there are typically more N than P/Q-type Ca2+ channels in hippocampal synapses in culture.
An intriguing observation was the lower variance across synapses in the effect of an N-type inhibitor on single AP exocytosis, compared to a P/Q-type inhibitor (Figure 4). Initially, we speculated that some of this might be due to a ceiling effect, given that reductions in single AP responses by blocking N-type channels are close to the 100% bound. If this were the case, we would expect experiments with large average effects of either toxin (i.e., closer to the 100% bound) to have less variability among synapses in the effects of the toxin. However, the standard deviation of the effect of the toxin was not correlated with the average toxin effect for experiments in the presence of N-type (ρ = 0.32, P = 0.44, n = 8 experiments) or P/Q-type blockers (ρ = 0.35, P = 0.35, n = 9 experiments). This suggests that a ceiling effect cannot account for the larger variability between synapses in the effect of a P/Q-type Ca2+ channel blocker, compared to an N-type blocker.
An alternative explanation for the larger variability among synapses in the effect of a P/Q-type blocker, compared to an N-type blocker, can be found by analyzing the curve that relates exocytosis to Ca2+ entry (Figure 3). Since the average effect of P/Q-type blockers is smaller, synapses move down this curve to a region that is steeper than when they are blocked with an N-type blocker. Thus, comparable variance in block of Ca2+ entry will translate to larger variance in exocytosis for P/Q vs. N-type Ca2+ channel block. Since we did not measure Ca2+ entry directly at the level of single synapses we do not know whether this explanation fully accounts for the difference in variance between the effects of P/Q and N-type Ca2+ channel blockers, or whether other factors might play a role.
Our results rule out the hypothesis that different Ca2+ channel subtypes are associated with synapses of different efficacies. There was no clear relation between a synapse's initial Pv and the type of Ca2+ channels present. Thus, the relative mix of N and P/Q-type Ca2+ channels present at a presynaptic terminal does not affect baseline synaptic strength (in agreement with a previous study in younger, autaptic cultures, Reid et al., 1997). Rather, differences in how these channel subtypes can be modulated (Kisilevsky and Zamponi, 2008) suggest that Ca2+ channel repertoire will be critically important to how individual synapses' efficacy can be modified, and to their short-term plasticity properties.
Potentiation by Forskolin at Individual Synapses
An intriguing observation from our study was the negative correlation at the level of individual synapses between the effect of forskolin on single AP responses and Pv. To investigate this correlation in more detail we used a few simple models. A first step to study the effect of an activator on boutons with varying initial Pv is a model explaining why those synapses are different in the first place. There are two general explanations for Pv variation across boutons. The first option is that primed vesicles have different fusogenicities across different synapses. Alternatively, boutons might vary in the relative entry of Ca2+ ions in response to 1 AP. As regards forskolin, its effect on Pv seems likely to be due to an increase in the fusogenicity of primed vesicles. In Figure 10, we illustrate a hypothetical scenario with two synapses in which initial Pv varies due to differential Ca2+ entry and forskolin causes a uniform increase in fusogenicity. We base this model on the previously established relationship between Ca2+ entry and exocytosis in our system (Ariel and Ryan, 2010) and account for an increased fusogenicity in forskolin as a left-shift in that curve. Under these conditions, forskolin will cause a larger increase in exocytosis in response to 1 AP in the synapse with lower initial Pv. We emphasize that in this scenario forskolin causes the same increase in fusogenicity in both boutons. The differential effect on single AP exocytosis arises as a result of the shape of the Pv vs. Ca2+ entry curve and the initial position on that curve of a single AP at 4 mM in both synapses. An alternative scenario, where initial variation in Pv is due to differences in fusogenicity gives similar results, and the addition of forskolin's effects on RRP size do not modify the basic conclusion (not shown). Finally, if we imagine that the two synapses illustrated in Figure 10 are actually two external calcium conditions to which we expose a single synapse, this explains the larger effect of forskolin under conditions of smaller Ca2+ entry (Figure 9). Thus, a very simple model accounts well for the general trends seen in our data. While we cannot exclude that the effects of forskolin are not homogenous across boutons, we emphasize that in principle, this is not necessary to obtain non-homogenous effects on Pv. In fact, the model suggests that any intervention that uniformly increases the fusogenicity of primed vesicles across synapses will lead to bigger effects at boutons with lower initial Pv.
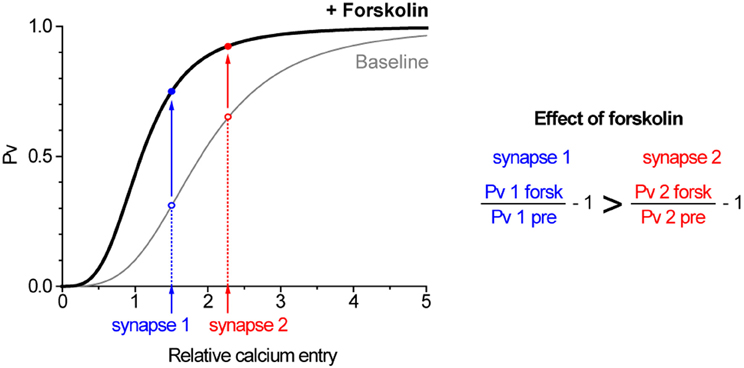
Figure 10. A simple model can explain how forskolin has a greater effect on synapses with lower Pv. The graph illustrates two synapses with differing Ca2+ entry in response to single AP (synapse 2 > synapse 1) in which primed vesicles have the same fusogenicity (gray curve). When forskolin is applied, the fusogenicity of primed vesicles increases equally in both synapses (black curve, shifted left) such that they increase their Pv (solid arrows). However, synapse 1, with an initially lower Pv, exhibits a larger increase. The baseline curve is the measured Hill relationship between Ca2+ and exocytosis (Ariel and Ryan, 2010), whereas the effect of forskolin is modeled as a leftward shift due to a 50% reduction in the Km of that relationship (see Discussion).
Potential for Future Experiments
The methods developed herein can be used to explore many potential determinants of intersynapse variability. Does the concentration of alpha2delta or RIM at a single synapse set Pv at that bouton? Do target-specific effects on presynaptic boutons act by modifying Pv, RRP size, or both? Are synapses formed by inhibitory and excitatory axons equally variable? Does the proximity of synapses to active astrocytes explain why some synapses are stronger than others (Perea and Araque, 2007)? These are a small sample of the many kinds of questions that can be addressed using our methods.
Conclusions
Overall, our study of individual synapse properties highlights the large amount of variability present in both basal exocytosis parameters and the degree to which those parameters can be modulated, even for synapses that belong to the same axon. While we cannot rule out that this variability is an artifact of our culture conditions, several examples in more intact preparations suggest it is representative of what actually occurs in vivo (Markram et al., 1998; Reyes et al., 1998). If this variability is indeed a defining feature of hippocampal neurons—or neurons in general—it is interesting to speculate whether it is simply a byproduct of cellular processes that use relatively few molecules (Ribrault et al., 2011) or whether, in addition, it has some adaptive value for neural circuit function (Branco and Staras, 2009).
Materials and Methods
Cell Culture and Optical Setup
We dissected hippocampal CA3-CA1 regions from 1- to 3-d-old Sprague Dawley rats (of either sex), dissociated the cells, and plated them onto poly-ornithine-coated glass as described previously (Ryan, 1999). We transfected cells with a chimera of the pH-sensitive GFP pHluorin and the vesicular glutamate transporter (vG-pH, Voglmaier et al., 2006), or the genetically encoded calcium indicator GCaMP3 (Tian et al., 2009), using calcium phosphate precipitation 6–9 days after plating. Imaging was performed after 13–25 days in vitro. Coverslips were mounted in a rapid-switching, laminar-flow perfusion, and stimulation chamber (volume ~75 μl) on the stage of a custom-built laser-illuminated epifluorescence microscope. Live-cell images were acquired with an Andor iXon+ (model #DU-897E-BV) back-illuminated electron-multiplying charge-coupled device camera. An Ar+ ion or solid-state diode pumped 488 nm laser was shuttered using acousto-optic modulation. Fluorescence excitation and collection was through a 40 × 1.3 NA Fluar Zeiss objective using 515–560 nm emission and 510 nm dichroic filters (Chroma), and a 1.6× Optivar. Laser power at the back aperture was ~4 mW for imaging of vG-pH and ~1 mW for imaging of GCaMP3 or Magnesium Green (MgGreen). APs were evoked by passing 1 ms current pulses, yielding fields of ~10 V/cm via platinum-iridium electrodes. Experiments analyzing the effects of forskolin with 2 mM external Ca2+ were performed at room temperature (~28–32°C in stimulation chamber), for all others the temperature was clamped at 30.0 ± 0.1°C. Cells were continuously perfused at 0.2–1.0 ml/min. in a Tyrode's saline solution containing (in mM) 119 NaCl, 2.5 KCl, 25 HEPES, buffered to pH 7.4, 30 glucose, 10 μM 6-cyano-7-nitroquinoxaline-2,3-dione (CNQX), and 50 μM D,L-2-amino-5-phosphonovaleric acid (AP5). For experiments with 2 mM external Ca2+ concentration, the perfusion solution contained (in mM) 2 CaCl2, 2 MgCl2, whereas for experiments with 4 mM external Ca2+ concentration, the solution contained 4 mM CaCl2 and no MgCl2. All chemicals were obtained from Sigma except for Ca2+ channel toxins (Alomone Labs) and MgGreen (Invitrogen). Due to the low baseline fluorescence of neurons that express vG-pH (Balaji and Ryan, 2007), we sometimes gave brief bursts with 6 APs at 33 Hz every 4 s to find transfected cells in a dish. Cells were allowed to rest 10 min after identification with 33 Hz stimuli, at least 45 s between 1 AP trials and at least 5 min between 100 Hz AP bursts. In cases where we equate single experiments with individual neurons, we confirmed this was the case by post-hoc immunostaining for vG-pH using an antibody against GFP (Invitrogen) and unambiguously tracing the imaged axons to a single transfected soma.
Imaging Conditions
We optimized our data acquisition integration time and the frequency of exposures according to the parameter we wished to measure. To estimate RRP size, we acquired data at 100 Hz by integrating for 9.74 ms in frame transfer mode and restricting imaging to a subarea of the CCD chip. The maximum width of the imaged field under those conditions was 167 pixels (41.75 μm). For most single AP trials using vG-pH, we used 2 Hz imaging, integrating for 25 ms. This gave us more precision, at the expense of slower imaging rates in those trials. This slower time resolution is still much faster than the fluorescence decay after stimulation due to endocytosis and reacidification, which takes at least several seconds (Armbruster and Ryan, 2011). For experiments evaluating the effects of forskolin with 2 mM extracellular Ca2+ we used 100 Hz imaging for single AP runs. Images were analyzed in ImageJ (http://rsb.info.nih.gov/ij/) using a custom-written plugin (http://rsb.info.nih.gov/ij/plugins/time-series.html). 2 μm diameter circular ROIs were placed on all varicosities that did not split or merge, and were stably in focus throughout all trials.
RRP Size Estimation
To determine the size of the RRP, we used a slightly modified version of a previously developed protocol (Ariel and Ryan, 2010). Briefly, we stimulated at 100 Hz in 2 mM (experiments with forskolin in the presence of 2 mM Ca2+) or 4 mM (all other cases) external Ca2+ and then used a semi-automatic method to search for plateaus in the ΔF response during stimulation (for example, see Figure 1B1). Sliding data windows of 5 or more APs were used to fit a linear model to the cumulative ΔF vs. AP number data. A plateau representing the RRP size was identified as the window where the absolute slope of ΔF vs. AP number was the smallest (i.e., the flattest region). To calculate the RRP size, we averaged the ΔF values within the identified window. Single AP ΔFs were estimated as the point to point difference before and after the stimulus except when the data was acquired at 100 Hz. In that case (experiments with forskolin in the presence of 2 mM Ca2+) we took the difference between the average 10 frames before the stimulus and 10 frames after the stimulus to estimate ΔFs.
Single Synapse Experiments
To measure Pv and RRP size at individual boutons (experiments in Figures 1, 2, 5, 6, and 8), we used an optimized protocol that minimized experimental noise and statistical fluctuations yet consistently ensured cell viability. Once a field with transfected synapses was identified, we briefly (<1 min) exposed the preparation to a modified Tyrode's solution buffered at pH = 7.40 with NH4Cl instead of HEPES. This solution alkalinizes the interior of all synaptic vesicles and the resulting ΔF is proportional to the total number of vG-pH molecules in the terminal. Given that there is typically one vG-pH molecule per synaptic vesicle, and that all vesicles are labeled (Balaji and Ryan, 2007), NH4Cl ΔF was considered proportional to the total number of vesicles in the synapse (or total pool, TP). The amount of exocytosis (Figures 1B1,B2,C) and RRP size (Figures 1D, 2B1,B2, 5C1, 6C1, 8C1) were therefore expressed as a fraction (or %) of the TP. Following the NH4Cl stimulus, we interleaved 30 single AP runs (spaced at least 45 s apart) and 12 trials designed to measure RRP size (where the stimulus was a 20 AP burst at 100 Hz, spaced at least 5 min apart). These runs served as a baseline to estimate Pv and RRP size. In a subset of experiments, we added forskolin or specific Ca2+ channel blockers to the media and measured the resulting effect on single AP responses in 30 independent trials. We ended each experiment with a final NH4Cl application to ensure boutons had not moved, split, merged, or fallen out of focus over the course of the experiment. In total, we initially measured Pv and RRP size at 624 individual synapses in 33 experiments from 10 independent culture sets.
We used this data set as a starting point and applied several quality control procedures to ensure synapses had appropriately high signal-to-noise, were stable throughout the experiment and provided a reliable estimate of RRP size. We designed criteria that eliminated synapses with obvious problems (such as instability or poor signal-to-noise) and left us with a high quality data set. In addition, we discarded experiments with less than 5 synapses that fulfilled these criteria.
Quality of signal
- Signal-to-noise of 1 AP average response >4
- Standard error (SE) of forskolin or Ca2+ channel blocker treatment effect <0.3 (where applicable).
Stability of signal
- Linear fit of 1 AP responses as a function of time does not show significant slope (at significance level α = 0.01)
- Linear fit of synchronous response to 20 APs (delivered in 100 Hz bursts) as a function of time does not show significant slope (at significance level α = 0.01).
RRP size determination
- In a few cases, there was not a strong reduction in exocytosis rates during the 100 Hz bursts designed to estimate RRP size. We wished to exclude these synapses where the RRP estimate would likely require a substantial correction for ongoing priming. To that end, we defined a variable that estimated the residual RRP recovery (repriming and exocytosis) during the detected plateau, and filtered our synapses according to that variable. As a measure of residual RRP recovery we took the product of the width of the plateau and the slope of a line fit in that region. We only accepted cases where there was, at most, a 15% recovery of the RRP during the plateau detected by our algorithm. In our final data set, the average recovery was 3.2% of the RRP size, indicating there is little contamination of our RRP estimates by priming. Note that this filter criterion does not apply to repriming and exocytosis after the detected plateau (for example, see Figure 1B1, exocytosis for APs 10 and higher). As mentioned in our previous manuscript (Ariel and Ryan, 2010), we interpret this as the RRP refilling process “catching up” due to the elevated Ca2+ inside the terminal, and generating newly primed vesicles that rapidly fuse with the membrane.
A total of 410 synapses in 32 experiments (66%) passed all criteria and formed the basis for further analysis. We examined whether the quality control filtering might bias our data in any way. Even before the filtering criteria were applied, we noted a skew toward more responsive synapses than expected, evidenced by a higher Pv (0.405 ± 0.008) compared to our previous average at 4 mM extracellular Ca2+ (0.35, Ariel and Ryan, 2010). We speculate this was due to an implicit bias toward selecting more responsive boutons for single synapse experiments. In addition, after applying our filtering criteria we were left with an even more responsive subset of synapses (Pv = 0.440 ± 0.008). This is unsurprising given that the filtering criteria include a signal-to-noise cut-off, which will be correlated with Pv. Thus, our experiments to study single synapse properties came from a population of boutons with higher Pv than those in other studies of exocytosis using vG-pH in our lab (Ariel and Ryan, 2010; Hoppa et al., 2012).
Forskolin was applied continuously at 50 μM. All measurements began at least 5 min after the start of incubation. Its effects on single AP exocytosis (Figures 8A,B1, and C1), Pv and RRP size (see text), or Ca2+ entry (Figures 7A,B) were calculated as Forsk/Pre-1. EGTA-AM was applied for 90 s at 100 μM, and allowed to wash-off for 10 min before measuring its effect on exocytosis. Its effect on single AP exocytosis (Figure 7C) was calculated as 1-EGTA/Pre.
To block P/Q-type Ca2+ channels we applied ω-agatoxin IVA (400 nM) for 2 min. To block N-type Ca2+ channels we applied ω-conotoxin GVIA (1 μM) for 2 min. Neither toxin showed any sign of wash-off during prolonged experiments. Toxin effects on single AP exocytosis (Figures 5A,5B1,5C1, 6A,B1, and C1) were calculated as 1-Toxin/Pre.
Imaging Conditions and Data Analysis of Ca2+ Indicator Experiments
To measure Ca2+ influx during single APs using MgGreen (Figures 7A,B, left), the indicator was loaded at 20 μM in its acetoxymethyl ester (AM) form for 10 min and washed-off for at least 10 min before imaging started. Single AP stimuli led to robust, focal responses distributed over neuritic fields. We analyzed ΔF/F0 of manually drawn ROIs placed on these punctate responsive regions, taking care to avoid somas. F0 was corrected point to point by subtracting local background from manually drawn ROIs on adjacent non-responsive regions. Imaging was performed at 100 Hz and the peak ΔF/F0 in response to a single AP was taken as the difference between the peak and the last 10 frames before the stimulus. To examine the effect of forskolin, responses were averaged across 10 trials before and after drug application. To examine the effect of Ca2+ channel blockers, responses were averaged across 6 trials before and 12 trials after drug application. In a few MgGreen experiments, there was a slight rundown in responses (~1% per minute). To correct for this effect, we fit a straight line to the responses in the absence of the drug as a function of time. We subsequently estimated the decrease expected from this rundown in drug trials and corrected the measurement of 1 AP ΔF/F0 in forskolin accordingly. When necessary, these corrected values were used to estimate the effect of the drug on single AP Ca2+ responses.
To measure Ca2+ increases after stimulation using GCaMP3, we imaged at 20 Hz, integrating for 19.70 ms during each frame (Figures 7A,B, right). The response to a single AP was calculated as the point to point difference before and after the stimulus. Responses were averaged across 30 trials before and after forskolin application. To normalize responses, at the end of each GCaMP3 experiment we exposed neurons to 200 μM ionomycin, which allows full Ca2+ exchange across the plasma membrane. The resulting maximal signal was used to normalize traces (Hoppa et al., 2012):
where F(0) is the last point before stimulation, Fmax is the maximal value reached during application of ionomycin and Fdark is the baseline fluorescence of our detector in the absence of illumination. This normalization allowed us to compare experiments with varying amounts of the indicator. GCaMP3 responses are non-linear with respect to Ca2+ in the range of interest (Tian et al., 2009) and must be linearized after normalization. To that end, a calibration curve was constructed (Hoppa et al., 2012) by measuring responses to 1–20 APs at 100 Hz, in 2 mM extracellular Ca2+ using both MgGreen—known to be a linear indicator in this range (Ariel and Ryan, 2010)—and GCaMP3. The resulting GCaMP3 vs. MgGreen data was fit to a generalized Hill equation. Using that equation and the optimized fit parameters, we could convert any normalized GCaMP3 ΔF to a linearized MgGreen equivalent, proportional to the actual ΔCa2+. These linearized values were then used to estimate the effect of forskolin on single AP Ca2+ responses.
Statistical Analysis
All values mentioned in the text are averages ± standard errors of the mean (SE) unless stated otherwise. All error bars in graphs are SEs unless stated otherwise.
Parametric statistics were used whenever possible (Sokal and Rohlf, 1994). To test the effects of forskolin treatment on single AP exocytosis, Pv, RRP size, and Ca2+ entry (as defined above), we performed one-sample t-tests using the null hypothesis μ = 0. Normality was assayed in all cases using the Shapiro-Wilk test, using α = 0.05 as a cut-off. When an ANOVA was used, the assumption of homogeneity of variances was assayed with Levene's test, using α = 0.05 as a cut-off. Both assumptions were met in all cases. t-tests were performed in Excel (Microsoft), Shapiro–Wilk, Levene, and ANOVAs were performed in STATISTICA 8 (StatSoft). The effects of forskolin on all parameters were also evaluated using paired t-tests comparing each measured parameter before and after forskolin application and gave the same results (not shown).
To test whether there were correlations between the effect of a drug (forskolin, or Ca2+ channel blockers) and either Pv or RRP size, we used one-sample, two-tailed t-tests on the correlation coefficients with the null hypothesis μ = 0.
Error Analysis
To estimate how precisely we could determine Pv and RRP size at individual synapses (Figures 1D,E), we extended the same formulas we had previously used to estimate errors in Pv and RRP size within cells (Ariel and Ryan, 2010). Our analysis is based on a SE propagation formula (Taylor, 1997):
then
Briefly, we relied on 3 traces from each bouton:
F1: response to 1 AP (average of 30 trials)
F20: response to 20 APs at 100 Hz (average of 12 trials)
FNH4Cl: response to a pulse of 50 mM NH4Cl, which alkalinizes all cellular compartments.
F1 traces were acquired at 2 Hz and we calculated ΔF1 as the difference between the last point before firing an AP and the first point after the stimulus. To estimate SEΔF1 we took the SE of the response to 1 AP across 30 trials.
We estimated SENH4Cl from the SE of the baseline and peak fluorescence during NH4Cl application:
where the SE was the standard deviation of the 10 first frames divided by the square root of 10 and of the i frames of the peak divided by the square root of i.
For the 20 AP traces we proceeded similarly, averaging the last 10 frames before the stimulus and the frames included in the plateau to obtain:
where the SE was the standard deviation divided by the square root of the number of observations in each case (10 for F20 pre and the number of points included in the plateau for F20 plateau). Thus:
In addition to these instrumental errors, given that we measured the responses to 20 APs at 100 Hz 12 times in each experiment we also obtained a statistical estimate of the error in ΔF20 plateau:
where SDΔF20 plateau,stat is the standard deviation of the plateau estimates in different trials. We added the instrumental and statistical contributions to the error in quadrature and combined them to get the total error for ΔF20 plateau:
Finally, we calculated RRP size and Pv with their associated errors:
These calculations provide the error bars for Pv and RRP size in individual synapses (Figures 1D,E).
To estimate the errors of the effects on single AP responses of Ca2+ channel toxins (Figures 5A and 6A), we first calculated the error in the ΔF1post (after each pharmacological treatment) using the same formulas as for ΔF1 and then used:
To estimate the errors of the effects on single AP responses of forskolin (Figure 8A), we used:
Conflict of Interest Statement
The authors declare that the research was conducted in the absence of any commercial or financial relationships that could be construed as a potential conflict of interest.
Acknowledgments
This work was supported by grants from the National Institutes of Health (Timothy A. Ryan). We thank members of the Ryan laboratory and Jeremy Dittman for useful discussions and Ricky Kwan and Yogesh Gera for technical support.
References
Ariel, P., and Ryan, T. A. (2010). Optical mapping of release properties in synapses. Front. Neural Circuits 4:18. doi: 10.3389/fncir.2010.00018
Ariel, P., and Ryan, T. A. (2012). New insights into molecular players involved in neurotransmitter release. Physiology (Bethesda) 27, 15–24.
Armbruster, M., and Ryan, T. A. (2011). Synaptic vesicle retrieval time is a cell-wide rather than individual-synapse property. Nat. Neurosci. 14, 824–826.
Balaji, J., and Ryan, T. A. (2007). Single-vesicle imaging reveals that synaptic vesicle exocytosis and endocytosis are coupled by a single stochastic mode. Proc. Natl. Acad. Sci. U.S.A. 104, 20576–20581.
Branco, T., Marra, V., and Staras, K. (2010). Examining size-strength relationships at hippocampal synapses using an ultrastructural measurement of synaptic release probability. J. Struct. Biol. 172, 203–210.
Branco, T., and Staras, K. (2009). The probability of neurotransmitter release: variability and feedback control at single synapses. Nat. Rev. Neurosci. 10, 373–383.
Branco, T., Staras, K., Darcy, K. J., and Goda, Y. (2008). Local dendritic activity sets release probability at hippocampal synapses. Neuron 59, 475–485.
Brenowitz, S. D., and Regehr, W. G. (2007). Reliability and heterogeneity of calcium signaling at single presynaptic boutons of cerebellar granule cells. J. Neurosci. 27, 7888–7898.
Burgalossi, A., Jung, S., Meyer, G., Jockusch, W. J., Jahn, O., Taschenberger, H., et al. (2010). SNARE protein recycling by alphaSNAP and betaSNAP supports synaptic vesicle priming. Neuron 68, 473–487.
Chavez-Noriega, L. E., and Stevens, C. F. (1994). Increased transmitter release at excitatory synapses produced by direct activation of adenylate cyclase in rat hippocampal slices. J. Neurosci. 14, 310–317.
Chen, C., and Regehr, W. G. (1997). The mechanism of cAMP-mediated enhancement at a cerebellar synapse. J. Neurosci. 17, 8687–8694.
De Jong, A. P., Schmitz, S. K., Toonen, R. F., and Verhage, M. (2012). Dendritic position is a major determinant of presynaptic strength. J. Cell Biol. 197, 327–337.
Deng, L., Kaeser, P. S., Xu, W., and Sudhof, T. C. (2011). RIM proteins activate vesicle priming by reversing autoinhibitory homodimerization of Munc13. Neuron 69, 317–331.
Eggermann, E., Bucurenciu, I., Goswami, S. P., and Jonas, P. (2012). Nanodomain coupling between Ca(2+) channels and sensors of exocytosis at fast mammalian synapses. Nat. Rev. Neurosci. 13, 7–21.
Ermolyuk, Y. S., Alder, F. G., Henneberger, C., Rusakov, D. A., Kullmann, D. M., and Volynski, K. E. (2012). Independent regulation of basal neurotransmitter release efficacy by variable Ca2+ influx and bouton size at small central synapses. PLoS Biol. 10:e1001396. doi: 10.1371/journal.pbio.1001396
Fedchyshyn, M. J., and Wang, L. Y. (2005). Developmental transformation of the release modality at the calyx of Held synapse. J. Neurosci. 25, 4131–4140.
Fernandez-Alfonso, T., and Ryan, T. A. (2008). A heterogeneous “resting” pool of synaptic vesicles that is dynamically interchanged across boutons in mammalian CNS synapses. Brain Cell Biol. 36, 87–100.
Gekel, I., and Neher, E. (2008). Application of an Epac activator enhances neurotransmitter release at excitatory central synapses. J. Neurosci. 28, 7991–8002.
Granseth, B., and Lagnado, L. (2008). The role of endocytosis in regulating the strength of hippocampal synapses. J. Physiol. 586, 5969–5982.
Han, Y., Kaeser, P. S., Sudhof, T. C., and Schneggenburger, R. (2011). RIM determines Ca(2)+ channel density and vesicle docking at the presynaptic active zone. Neuron 69, 304–316.
Holderith, N., Lorincz, A., Katona, G., Rozsa, B., Kulik, A., Watanabe, M., et al. (2012). Release probability of hippocampal glutamatergic terminals scales with the size of the active zone. Nat. Neurosci. 15, 988–997.
Hoppa, M. B., Lana, B., Margas, W., Dolphin, A. C., and Ryan, T. A. (2012). alpha2delta expression sets presynaptic calcium channel abundance and release probability. Nature 486, 122–125.
Huang, C. C., and Hsu, K. S. (2006). Presynaptic mechanism underlying cAMP-induced synaptic potentiation in medial prefrontal cortex pyramidal neurons. Mol. Pharmacol. 69, 846–856.
Insel, P. A., and Ostrom, R. S. (2003). Forskolin as a tool for examining adenylyl cyclase expression, regulation, and G protein signaling. Cell. Mol. Neurobiol. 23, 305–314.
Jockusch, W. J., Speidel, D., Sigler, A., Sorensen, J. B., Varoqueaux, F., Rhee, J. S., et al. (2007). CAPS-1 and CAPS-2 are essential synaptic vesicle priming proteins. Cell 131, 796–808.
Kaeser, P. S., Deng, L., Wang, Y., Dulubova, I., Liu, X., Rizo, J., et al. (2011). RIM proteins tether Ca2+ channels to presynaptic active zones via a direct PDZ-domain interaction. Cell 144, 282–295.
Kaneko, M., and Takahashi, T. (2004). Presynaptic mechanism underlying cAMP-dependent synaptic potentiation. J. Neurosci. 24, 5202–5208.
Kisilevsky, A. E., and Zamponi, G. W. (2008). Presynaptic calcium channels: structure, regulators, and blockers. Handb. Exp. Pharmacol. 184, 45–75.
Koester, H. J., and Johnston, D. (2005). Target cell-dependent normalization of transmitter release at neocortical synapses. Science 308, 863–866.
Laviv, T., Riven, I., Dolev, I., Vertkin, I., Balana, B., Slesinger, P. A., et al. (2010). Basal GABA regulates GABA(B)R conformation and release probability at single hippocampal synapses. Neuron 67, 253–267.
Lazarevic, V., Schone, C., Heine, M., Gundelfinger, E. D., and Fejtova, A. (2011). Extensive remodeling of the presynaptic cytomatrix upon homeostatic adaptation to network activity silencing. J. Neurosci. 31, 10189–10200.
Lujan, R., Roberts, J. D., Shigemoto, R., Ohishi, H., and Somogyi, P. (1997). Differential plasma membrane distribution of metabotropic glutamate receptors mGluR1 alpha, mGluR2 and mGluR5, relative to neurotransmitter release sites. J. Chem. Neuroanat. 13, 219–241.
Markram, H., Wang, Y., and Tsodyks, M. (1998). Differential signaling via the same axon of neocortical pyramidal neurons. Proc. Natl. Acad. Sci. U.S.A. 95, 5323–5328.
Matz, J., Gilyan, A., Kolar, A., McCarvill, T., and Krueger, S. R. (2010). Rapid structural alterations of the active zone lead to sustained changes in neurotransmitter release. Proc. Natl. Acad. Sci. U.S.A. 107, 8836–8841.
Mittelstaedt, T., Alvarez-Baron, E., and Schoch, S. (2010). RIM proteins and their role in synapse function. Biol. Chem. 391, 599–606.
Murthy, V. N., Sejnowski, T. J., and Stevens, C. F. (1997). Heterogeneous release properties of visualized individual hippocampal synapses. Neuron 18, 599–612.
Perea, G., and Araque, A. (2007). Astrocytes potentiate transmitter release at single hippocampal synapses. Science 317, 1083–1086.
Pyott, S. J., and Rosenmund, C. (2002). The effects of temperature on vesicular supply and release in autaptic cultures of rat and mouse hippocampal neurons. J. Physiol. 539, 523–535.
Reid, C. A., Bekkers, J. M., and Clements, J. D. (1998). N- and P/Q-type Ca2+ channels mediate transmitter release with a similar cooperativity at rat hippocampal autapses. J. Neurosci. 18, 2849–2855.
Reid, C. A., Clements, J. D., and Bekkers, J. M. (1997). Nonuniform distribution of Ca2+ channel subtypes on presynaptic terminals of excitatory synapses in hippocampal cultures. J. Neurosci. 17, 2738–2745.
Reuter, H. (1995). Measurements of exocytosis from single presynaptic nerve terminals reveal heterogeneous inhibition by Ca(2+)-channel blockers. Neuron 14, 773–779.
Reyes, A., Lujan, R., Rozov, A., Burnashev, N., Somogyi, P., and Sakmann, B. (1998). Target-cell-specific facilitation and depression in neocortical circuits. Nat. Neurosci. 1, 279–285.
Ribrault, C., Sekimoto, K., and Triller, A. (2011). From the stochasticity of molecular processes to the variability of synaptic transmission. Nat. Rev. Neurosci. 12, 375–387.
Rosenmund, C., Clements, J. D., and Westbrook, G. L. (1993). Nonuniform probability of glutamate release at a hippocampal synapse. Science 262, 754–757.
Rozov, A., Burnashev, N., Sakmann, B., and Neher, E. (2001). Transmitter release modulation by intracellular Ca2+ buffers in facilitating and depressing nerve terminals of pyramidal cells in layer 2/3 of the rat neocortex indicates a target cell-specific difference in presynaptic calcium dynamics. J. Physiol. 531, 807–826.
Ryan, T. A. (1999). Inhibitors of myosin light chain kinase block synaptic vesicle pool mobilization during action potential firing. J. Neurosci. 19, 1317–1323.
Sakaba, T., and Neher, E. (2001). Preferential potentiation of fast-releasing synaptic vesicles by cAMP at the calyx of Held. Proc. Natl. Acad. Sci. U.S.A. 98, 331–336.
Scanziani, M., Gahwiler, B. H., and Charpak, S. (1998). Target cell-specific modulation of transmitter release at terminals from a single axon. Proc. Natl. Acad. Sci. U.S.A. 95, 12004–12009.
Schikorski, T., and Stevens, C. F. (1997). Quantitative ultrastructural analysis of hippocampal excitatory synapses. J. Neurosci. 17, 5858–5867.
Schneggenburger, R., Sakaba, T., and Neher, E. (2002). Vesicle pools and short-term synaptic depression: lessons from a large synapse. Trends Neurosci. 25, 206–212.
Sheng, J., He, L., Zheng, H., Xue, L., Luo, F., Shin, W., et al. (2012). Calcium-channel number critically influences synaptic strength and plasticity at the active zone. Nat. Neurosci. 15, 998–1006.
Shigemoto, R., Kulik, A., Roberts, J. D., Ohishi, H., Nusser, Z., Kaneko, T., et al. (1996). Target-cell-specific concentration of a metabotropic glutamate receptor in the presynaptic active zone. Nature 381, 523–525.
Sokal, R. R., and Rohlf, F. J. (1994). Biometry: the Principles and Practice of Statistics in Biological Research. New York, NY: Freeman.
Sylwestrak, E. L., and Ghosh, A. (2012). Elfn1 regulates target-specific release probability at CA1-interneuron synapses. Science 338, 536–540.
Taylor, J. R. (1997). An Introduction to Error Analysis: the Study of Uncertainties in Physical Measurements. Sausalito, CA: University Science Books.
Tian, L., Hires, S. A., Mao, T., Huber, D., Chiappe, M. E., Chalasani, S. H., et al. (2009). Imaging neural activity in worms, flies and mice with improved GCaMP calcium indicators. Nat. Methods 6, 875–881.
Trigo, F. F., Sakaba, T., Ogden, D., and Marty, A. (2012). Readily releasable pool of synaptic vesicles measured at single synaptic contacts. Proc. Natl. Acad. Sci. U.S.A. 109, 18138–18143.
Trudeau, L. E., Emery, D. G., and Haydon, P. G. (1996). Direct modulation of the secretory machinery underlies PKA-dependent synaptic facilitation in hippocampal neurons. Neuron 17, 789–797.
Trudeau, L. E., Fang, Y., and Haydon, P. G. (1998). Modulation of an early step in the secretory machinery in hippocampal nerve terminals. Proc. Natl. Acad. Sci. U.S.A. 95, 7163–7168.
Voglmaier, S. M., Kam, K., Yang, H., Fortin, D. L., Hua, Z., Nicoll, R. A., et al. (2006). Distinct endocytic pathways control the rate and extent of synaptic vesicle protein recycling. Neuron 51, 71–84.
Weston, M. C., Nehring, R. B., Wojcik, S. M., and Rosenmund, C. (2011). Interplay between VGLUT isoforms and endophilin A1 regulates neurotransmitter release and short-term plasticity. Neuron 69, 1147–1159.
Wu, L. G., and Saggau, P. (1995). Block of multiple presynaptic calcium channel types by omega-conotoxin-MVIIC at hippocampal CA3 to CA1 synapses. J. Neurophysiol. 73, 1965–1972.
Yao, I., Takagi, H., Ageta, H., Kahyo, T., Sato, S., Hatanaka, K., et al. (2007). SCRAPPER-dependent ubiquitination of active zone protein RIM1 regulates synaptic vesicle release. Cell 130, 943–957.
Keywords: synapse, exocytosis, release probability, pHluorin, readily releasable pool, imaging
Citation: Ariel P, Hoppa MB and Ryan TA (2013) Intrinsic variability in Pv, RRP size, Ca2+ channel repertoire, and presynaptic potentiation in individual synaptic boutons. Front. Syn. Neurosci. 4:9. doi: 10.3389/fnsyn.2012.00009
Received: 20 November 2012; Paper pending published: 07 December 2012;
Accepted: 24 December 2012; Published online: 11 January 2013.
Edited by:
Dirk Feldmeyer, RWTH Aachen University, GermanyReviewed by:
Katalin Tóth, Centre de Recherche Universite Laval Robert-Giffard, CanadaFilippo Tempia, University of Turin, Italy
Copyright © 2013 Ariel, Hoppa and Ryan. This is an open-access article distributed under the terms of the Creative Commons Attribution License, which permits use, distribution and reproduction in other forums, provided the original authors and source are credited and subject to any copyright notices concerning any third-party graphics etc.
*Correspondence: Timothy A. Ryan, Department of Biochemistry, Weill Cornell Medical College, New York, NY 10065, USA. e-mail: taryan@med.cornell.edu
†Present address: Pablo Ariel, Department of Neuroscience, Columbia University, New York, NY, USA.