 Muhamed Barakovic1,2,3,4*†
 Gabriel Girard1,5,6†
 Simona Schiavi1,7
 David Romascano1
 Maxime Descoteaux8
 Cristina Granziera3,4
 Derek K. Jones2,9,10
 Giorgio M. Innocenti1,11,12‡
 Jean-Philippe Thiran1,5,6†
 Alessandro Daducci7†
- 1Signal Processing Lab 5, École Polytechnique Fédérale de Lausanne, Lausanne, Switzerland
- 2Cardiff University Brain Research Imaging Centre, Cardiff University, Cardiff, United Kingdom
- 3Translational Imaging in Neurology (ThINk) Basel, Department of Biomedical Engineering, University Hospital Basel and University of Basel, Basel, Switzerland
- 4Neurologic Clinic and Policlinic, Departments of Medicine, Clinical Research and Biomedical Engineering, University Hospital Basel and University of Basel, Basel, Switzerland
- 5CIBM Center for BioMedical Imaging, Lausanne, Switzerland
- 6Radiology Department, Centre Hospitalier Universitaire Vaudois and University of Lausanne, Lausanne, Switzerland
- 7Department of Computer Science, University of Verona, Verona, Italy
- 8Sherbrooke Connectivity Imaging Lab, Université de Sherbrooke, Sherbrooke, QC, Canada
- 9Neuroscience and Mental Health Research Institute, Cardiff University, Cardiff, United Kingdom
- 10Mary MacKillop Institute for Health Research, Australian Catholic University, Melbourne, VIC, Australia
- 11Department of Neuroscience, Karolinska Institutet, Stockholm, Sweden
- 12Brain and Mind Institute, École Polytechnique Fédérale de Lausanne, Lausanne, Switzerland
In the central nervous system of primates, several pathways are characterized by different spectra of axon diameters. In vivo methods, based on diffusion-weighted magnetic resonance imaging, can provide axon diameter index estimates non-invasively. However, such methods report voxel-wise estimates, which vary from voxel-to-voxel for the same white matter bundle due to partial volume contributions from other pathways having different microstructure properties. Here, we propose a novel microstructure-informed tractography approach, COMMITAxSize, to resolve axon diameter index estimates at the streamline level, thus making the estimates invariant along trajectories. Compared to previously proposed voxel-wise methods, our formulation allows the estimation of a distinct axon diameter index value for each streamline, directly, furnishing a complementary measure to the existing calculation of the mean value along the bundle. We demonstrate the favourable performance of our approach comparing our estimates with existing histologically-derived measurements performed in the corpus callosum and the posterior limb of the internal capsule. Overall, our method provides a more robust estimation of the axon diameter index of pathways by jointly estimating the microstructure properties of the tissue and the macroscopic organisation of the white matter connectivity.
1. Introduction
The white matter of the central nervous system comprises axons with different diameters (Peters et al., 1991) organized in pathways, tracts, bundles or fascicles. Diameters correlate with: (i) the size of the parent cell body (Tomasi et al., 2012); (ii) the size and density of synaptic boutons (Innocenti and Caminiti, 2017); (iii) conduction velocity (Hursh, 1937), which together with axon length determines conduction delays between brain sites; and possibly, (iv) the frequency of firing (Perge et al., 2012). Being able to quantify and characterise these different aspects may be critical to understanding sensory, motor, and cognitive functions. In particular, as the axon diameter is strictly related to conduction velocity (Ritchie, 1982; Drakesmith et al., 2019), it is associated with the flow of information between different cortical sites and is thus a critical feature when trying to understand the relationship between the structural and functional connectivity of the brain (Honey et al., 2010). Reliable estimates of axon diameter are also of utmost importance for interpreting pathological cases (DeLuca et al., 2004; Zikopoulos and Barbas, 2013; Huang et al., 2016).
First attempts to characterize the composition of neuronal pathways in the central nervous system used histological techniques (Aboitiz et al., 1992; Tomasi et al., 2012; Innocenti et al., 2018) and focused on samples of animal tissue. Besides being possible only ex vivo, these analyses require laborious measurements of axon diameters in a few slices along the course of known pathways. Per contra, diffusion-weighted magnetic resonance imaging (DW-MRI) is a non-invasive technology that can provide in vivo structural information on white matter pathways by probing the motion of water molecules and analyzing how it is influenced by the cellular structure of the tissue (Le Bihan and Breton, 1985; Moseley et al., 1990; Beaulieu and Allen, 1994). Compared to histological measurements, this technology is faster and non-invasive. Therefore, it can be applied to the living human brain, with enormous potential in terms of information that can be recovered.
On the one hand, it is possible to estimate the course of major pathways using tractography; for a review, see (Jeurissen et al., 2017) and references therein. These fiber-tracking methods approximate the macroscopic trajectory of axons by seeking pathways of maximum coherence of estimates of fibre orientation derived in each voxel from DW-MRI. Each reconstructed trajectory, or streamline, represents a coherent set of axons coursing together. Despite a large number of algorithms developed, none of the existing methods can provide information about the axon diameter of the individual reconstructed fiber bundles, as tractography only reconstructs their macroscopic trajectory. On the other hand, a variety of DW-MRI biophysical models have been proposed in the literature to obtain such information at the voxel level. Pioneering work in this field was done by Assaf et al. (2008), who proposed a method to estimate axon diameter distributions on an ex vivo spinal cord sample, exploiting the simple organization of the tissue with axons having a single, known orientation. Their model, AxCaliber, was later employed to study in vivo the axon composition of the corpus callosum in rodents (Barazany et al., 2009). A major limitation is that the DW-MRI signal must be acquired perpendicular to the axons main orientation and, hence, it requires prior knowledge on the orientation of the bundle to study. The ActiveAx technique developed by Alexander et al. (2010) removed this constraint by probing the DW-MRI signal along multiple directions and estimating orientationally-invariant features of the axons, thus not requiring any prior knowledge on their orientation. ActiveAx extended axon diameter index estimation to the whole brain but at the price of providing estimates of the mean axon diameter rather than the full distribution. The model was validated in monkeys and humans (Alexander et al., 2010; Dyrby et al., 2013), in vivo and ex vivo, and the estimated trend of the mean diameters in the corpus callosum agreed with histology.
Despite their attractiveness, current techniques for axon diameter estimation with DW-MRI suffer from several fundamental limitations which render them unsuitable for estimating conduction velocity and connectomics studies in the whole brain. First, the estimation is performed voxel-wise and independently in each imaging voxel, neglecting the fact that axons are continuous three-dimensional structures that are not limited to the extent of the voxel. This makes it impossible to infer the full course of the axons passing through that location or whether the estimated values correspond to distinct fiber bundles. Second, most methods implicitly assume a single axon population inside a voxel and cannot cope with complex fiber configurations such as crossing and fanning. In such voxels, [estimated to be as high as 90 % of all white-matter voxels (Jeurissen et al., 2013)], the models provide biased estimates as they suffer from severe overestimation of the axon diameters (Alexander et al., 2010), limiting de facto their applicability to specific areas of the brain, e.g., mid-sagittal plane of the corpus callosum. Recent advances extended these models to multiple fiber populations (Barazany et al., 2011; Zhang et al., 2011a; Auria et al., 2015; Farooq et al., 2016) and orientation dispersion (Zhang et al., 2011b), allowing for a more accurate estimation in complex fiber configurations. Although these methods showed consistent differences in the axon diameter index estimation from various axonal bundles, they remain limited to voxel-wise estimates, and are unable to recover bundle-specific methods. It would be desirable to obtain an accurate estimation along bundle trajectories, and in all white matter voxels, allowing for the characterization of the axon composition of individual fiber bundles. Lastly, the accuracy of the estimates crucially depends on the strength of the diffusion gradients that can be generated by the MRI scanners (Dyrby et al., 2013; Nilsson et al., 2017; Jones et al., 2018; Huang et al., 2020; Paquette et al., 2020) and other acquisition protocol (Gore et al., 2010; Siow et al., 2013; Kakkar et al., 2018; Xu et al., 2014, 2016; Drobnjak et al., 2016; Fan et al., 2020; Veraart et al., 2020), which affects the accuracy of the parameters as well (Drobnjak et al., 2010; Harkins et al., 2021); conventional human scanners are equipped with gradient systems up to 80 mT m−1, which do not provide the required sensitivity to axon diameters (Novikov et al., 2018; Veraart et al., 2020).
In this paper, we propose a novel method to overcome the above limitations and enable, for the first time, a non-invasive characterization of an invariant value of axon diameter index per streamline in the living human brain. Our method combines tractography with a microstructure model of the neuronal tissue and uses DW-MRI data acquired with a 3 T Connectom scanner capable of exploiting diffusion gradients up to 300 mT m−1. We demonstrate the favourable performance of our method comparing our estimates with existing histologically-derived measurements (Caminiti et al., 2009) performed in the corpus callosum and the posterior limb of the internal capsule. Estimating bundle-specific axon diameter index within each voxel of the whole white matter would represent a major advance in neuroscience, as this could shed more light on the relation between structural and functional connectivity (Honey et al., 2010) and improve our understanding of brain dynamics.
2. Theory and Background
2.1. Voxel-Wise vs. Bundle-Specific Axon Diameter Estimation
To illustrate the importance of bundle-specific axon diameter index estimation, let us consider the simple example in Figure 1. This synthetic dataset consists of two crossing fiber populations characterized by different axon compositions, with the green bundle containing larger axons than the blue one (Figure 1A). Today, the axon diameter index of a bundle is characterized using tractometry. This procedure indirectly approximates bundle-specific statistics by first estimating the axon diameter index with voxel-wise techniques in every voxel of the image (Figure 1B). For simplicity, we report only the estimated mean values rather than the full distributions. Then, the representative value of such a metric, for a given bundle, is obtained by averaging these values in all the voxels that are traversed by the streamlines belonging to the bundle. The purpose of this work is to develop a novel technique capable of estimating bundle-specific statistics, thus allowing us to obtain more reliable estimates of its axon composition (Figure 1D).
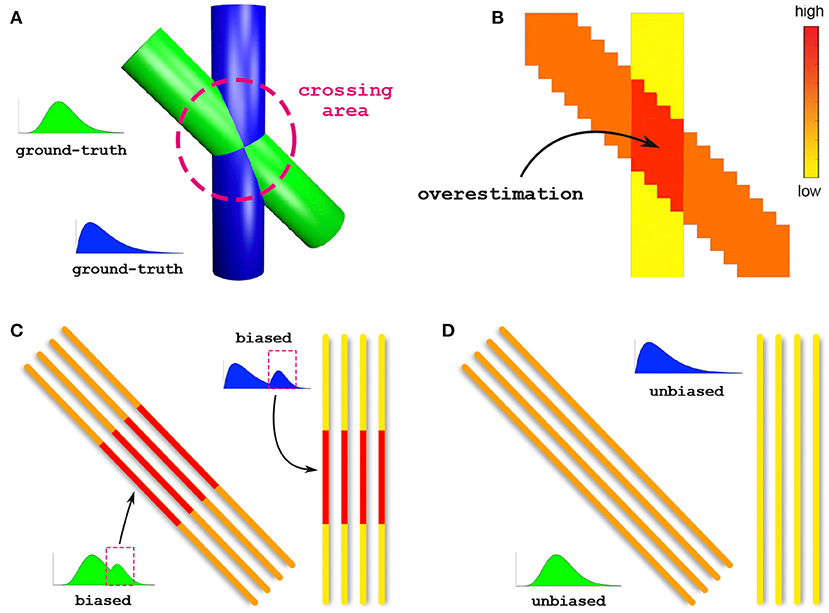
Figure 1. Voxel-wise vs. bundle-specific axon diameter estimation. (A) Schematic illustration of two crossing fiber populations characterized by different compositions: the green bundle contains larger axons than the blue. (B) Axon diameter estimation using a voxel-wise approach; for simplicity, we report the estimated mean diameters. The arrow points to the crossing region where such methods are known to especially suffer from overestimation. (C) Characterization of the axon diameter of a white matter bundle is typically done by averaging, along its entire course, the values previously estimated in every voxel; this indirect procedure is affected by such overestimated voxels and leads to biased results. (D) Estimation of bundle-specific axon diameter.
2.2. Microstructure-Informed Tractography
Even though DW-MRI is a quantitative imaging modality by nature, the sets of streamlines reconstructed by tractography are not truly quantitative (Jones and Cercignani, 2010; Jbabdi and Johansen-Berg, 2011; Jones et al., 2013). Microstructure-informed tractography (Sherbondy et al., 2009, 2010; Smith et al., 2013, 2015; Pestilli et al., 2014; Daducci et al., 2015b, 2016; Girard et al., 2017) is a recent methodological advance which aims to overcome such limitations by complementing tractography with biophysical models of the tissue microstructure. One of the recent proposed methods is the Convex Optimization Modeling for Microstructure Informed Tractography (COMMIT) (Daducci et al., 2015b). COMMIT assigns contibutions to the signal to each reconstructed streamline according to a microstructural forward-model and attempts to express all the acquired DW-MRI signals as a linear combination of the contributions arising from the whole set of streamlines:
where y contains the DW-MRI measurements in all voxels of the white matter, A is a matrix that accounts for the signal contributions of the streamlines in each voxel according to a given multi-compartment model (Panagiotaki et al., 2012) (possibly in addition to local voxel-wise contributions of tissue compartments, e.g., cerebrospinal fluid) and η is the acquisition noise. The unknown contributions x of all the compartments can then be efficiently estimated by solving the inverse problem using non-negative least squares:
Similarly to other filtering approaches, COMMIT assumes that the contributions of the streamlines are constant along their trajectories. More information on the method can be found in the original COMMIT manuscript (Daducci et al., 2015b).
3. Materials and Methods
3.1. Bundle-Specific Estimation
To enable estimation of the axon diameter index of individual bundles, similarly to the recently proposed COMMIT-T2 method (Barakovic et al., 2021), we extended the COMMIT framework with the Cylinder-Zeppelin-Ball model (Panagiotaki et al., 2012). The new formulation, COMMITAxSize, is presented in Figure 2. The proposed method considers each streamline as consisting of a population of axons with an unknown distribution of diameters, which must be estimated. The forward model (columns of the matrix A) was the DW-MRI signal arising from axons represented as parallel cylinders oriented in parallel to the tangent to the streamline in the voxel and with fixed diameters and fixed longitudinal diffusivity d∥. To account for different contributions arising from axons with distinct diameters, we considered 12 columns for each streamline corresponding to 12 cylinders with equally-spaced diameters in the range 1.5 μm to 7 μm. We modeled the extra-axonal compartment with anisotropic tensors, i.e., Zeppelins, having the same longitudinal diffusivity d∥. To capture different geometries of the extra-axonal space in every voxel, we considered multiple Zeppelins in every voxel, each with a distinct perpendicular diffusivity d⊥. Moreover, a distinct set of Zeppelins was included in A for every principal diffusion direction in a voxel. Finally, the cerebrospinal fluid was modeled as an isotropic tensor, i.e., Ball, with fixed diffusivity diso; an independent contribution was assigned to each voxel. The physical parameters were set according to values found in the literature (Alexander et al., 2010; Zhang et al., 2011b, 2012; Le Bihan and Iima, 2015): d∥ = 1.7 × 10⁻³ mm2 s−1, diso = 3.0 × 10⁻³ mm2 s−1, and four reasonable values equally-spaced from 0.5 × 10⁻³ mm2 s−1 to 1.0 × 10⁻³ mm2 s−1 for d⊥.
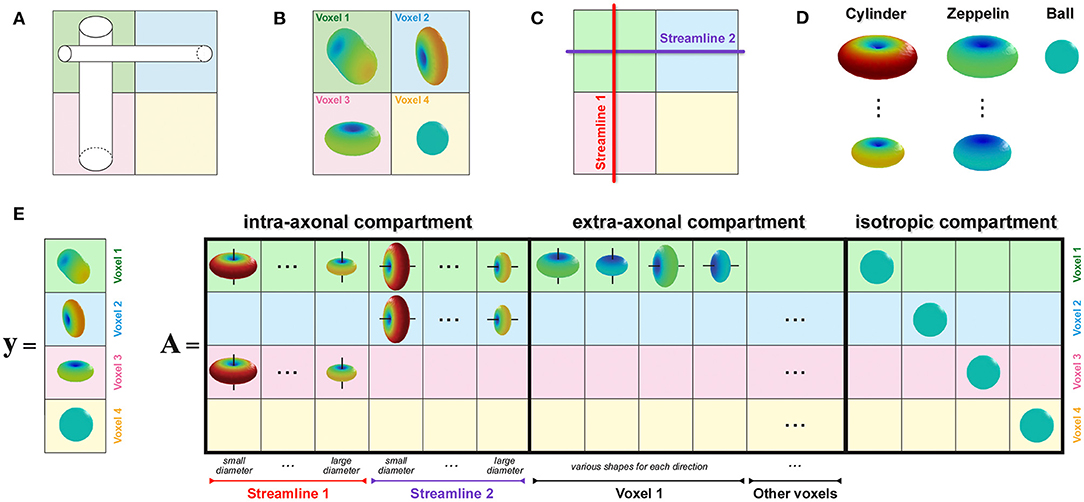
Figure 2. How to enable estimation of bundle-specific axon diameter index. (A) Simple crossing configuration of two fiber populations with different axon compositions, i.e., the vertical one is composed of larger axons than the horizontal, to illustrate the construction of the proposed formulation. (B) Corresponding DW-MRI signal in four representative voxels. (C) Example of two possible streamlines reconstructed with tractography. (D) Visual representation of the response functions in the Cylinder-Zeppelin-Ball forward model for each compartment. (E) The vector y contains a concatenation of the DW-MRI signal acquired in all voxels, while the matrix A is constructed by combining the response functions with the local orientations of the streamlines in each voxel.
The axon diameter index of a streamline, can be estimated from the coefficients x computed by COMMITAxSize as done in the ActiveAxAMICO method (Daducci et al., 2015a); in fact, the 12 contributions corresponding to a given streamline represent its volume-weighted cylinder diameter distribution. Unlike in Assaf et al. (2008), no assumptions are made on the axon diameter distribution to be estimated. The cylinder diameter distribution can be defined for a bundle, i.e., a group of streamlines coursing through a specific region of interest (ROI). Hence, we grouped streamlines sharing the same anatomical pathways in bundles as defined by an anatomical atlas. We then calculated the axon diameter index of a bundle by performing the weighted sum, column by column, of the cylinder signature of all streamlines of the bundle.
To facilitate visual inspection of the results, we extended the Axon Diameter Index (ADI) (Alexander et al., 2010) to streamlines (sADI), which is the mean of the distribution, and colored all streamlines accordingly. To compute the sADI, we excluded the contributions of the smallest (1.5 μm) and the biggest (7 μm) cylinder diameters. This is for two reasons: i) the used DW-MRI acquisition was shown to be insensitive to diameters smaller than 2 μm (Nilsson et al., 2017). ii) We found that the smallest cylinder captures, only partially, the signal of axons from 0 μm to 1.5 μm, and the biggest cylinder captures the signal of axons above 7 μm; hence, the coefficients corresponding to those columns of A are unreliable for the computation of the sADI. Simulations were performed to validate this assumption, see Supplementary Materials.
3.2. Data Acquisition
3.2.1. In-vivo Human Data
In vivo human data were acquired from 3 healthy volunteers on a Siemens Connectom 3 T MRI system (Cardiff University Brain Research Centre, Cardiff, Wales). The studies involving human participants were reviewed and approved by The School of Psychology Ethics Committee, Cardiff University. All participants provided written informed consent to participate in this study. Each subject was imaged five times over 2 weeks using the same DW-MRI acquisition protocol. The DW-MRI acquisition protocol used is the following: echo-time (TE) 80 ms, repetition time (TR) 3.900 ms, matrix size 110 × 110, 2 mm isotropic resolution. Other protocol parameters are reported in the Table 1.
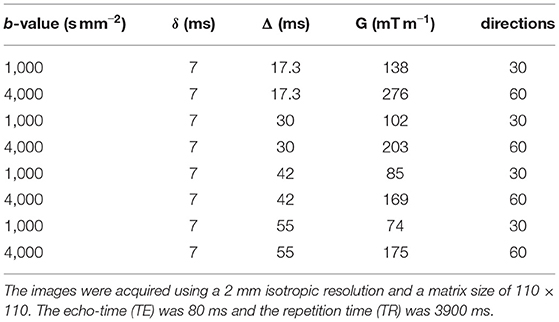
Table 1. DW-MRI acquisition protocol parameters.
Five non-diffusion weighted images (b0) were acquired, including one in reverse phase encoding. A 1 mm isotropic resolution T1-weighted anatomical image was also acquired, using a magnetization-prepared rapid acquisition gradient echo (MPRAGE) sequence: TE = 2 ms, inversion time = 857 ms, TR = 2.300 ms, matrix size = 256 × 256, flip angle = 9°.
3.2.2. Simulation Data
A numerical phantom was generated with a 45° crossing configuration between two bundles, from which, main directions were obtained at each voxel. The intra-axonal and extra-axonal signals were generated separately and then merged to generate unique numerical phantom (Rensonnet et al., 2018). For each bundle, the DW-MRI intra-axonal signal was simulated, using a distribution of parallel cylinders (Van Gelderen et al., 1994) following a gamma distribution. The first bundle had a gamma distribution with volume weighted mean diameter of 2.70 (shape = 3.2734 and scale = 0.2556). For the second bundle, the volume weighted mean diameter was 4.00 (shape = 3.5027 and scale = 0.3655). The extra-axonal signal was generated using a tensor with perpendicular diffusivity adapted to the local intra-axonal volume fraction, following the tortuosity approximation (Szafer et al., 1995). In single fiber voxels, the intra-axonal signal fractions were set to 0.3 and 0.6 for the vertical and diagonal bundles, respectively (i.e., the extra-axonal signal was a tensor with perpendicular diffusivity equal to 0.7 × D and 0.4 × D, respectively). The crossing voxels had an intra-axonal volume fraction of 0.9 (i.e., the extra-axonal signals were generated with a perpendicular diffusivity equal to 0.1 × D). All signals were summed to have a total signal fraction of 1 in each voxel. The diffusivity of the simulations were fixed to D = 1.7 × 10⁻³ mm2 s−1 (Alexander et al., 2010; Zhang et al., 2011b, 2012), both for intra-axonal and extra-axonal signals. The resulting dataset was corrupted with various levels of Rician noise. Furthermore, four additional dataset were generated, adding voxel-wise dispersion using a Watson distribution with k = 4, 8, 12, 16 (Zhang et al., 2011b, 2012).
For the voxel-wise estimation, the ADI for each voxel was estimated with the ActiveAx method (Alexander et al., 2010) implemented in the AMICO framework (Daducci et al., 2015b). For the COMMITAxSize method, the bundle-specific axon diameter index were estimated using both the ground-truth bundle trajectories and using the MrTrix3 second-order integration over Fiber Orientation Distribution (iFOD2) algorithm generating approximately 1,000 streamlines per bundle. Streamlines not ending at the bundle extremities were removed before processing with COMMITAxSize.
3.3. Data Pre-processing
The anatomical T1-weighted image was registered to the preprocessed average b0 image using FSL/FLIRT (Jenkinson and Smith, 2001) using rigid-body registration. The white matter and gray matter masks were estimated using FSL/FAST (Zhang et al., 2001). The brain cortical parcellation was performed using FreeSurfer (Destrieux et al., 2010). The DW-MRI images were corrected for magnetic field inhomogeneities, eddy currents (Andersson and Sotiropoulos, 2016) and motion using the TOPUP (Graham et al., 2017), and EDDY tools of FSL (Jenkinson and Smith, 2001). Subsequently, gradient non-linearity correction was performed (Jovicich et al., 2006; Rudrapatna et al., 2021). The shell with diffusion time Δ = 17.3 ms, G = 276 mT m−1 and b-value = 4000 s mm−2 was used to perform Constrained Spherical Deconvolution (CSD) (Tournier et al., 2007). Tractography was then performed using iFOD2 algorithm (Tournier et al., 2012), generating 10,000,000 streamlines seeding from the white matter mask. Streamlines not reaching the gray matter mask were removed. To make the computational time practical, a sub-set of 300,000 streamlines was randomly selected for each DW-MRI dataset.
3.4. Analysis of Specific Neuronal Connections
We report the sADI estimated for the streamlines passing through individual sectors of corpus callosum (CC) and of the posterior limb of the internal capsule (PIC). The midsagittal section of the CC was outlined using to the FreeSurfer parcellation, and the transverse section of the PIC was manually outlined on the T1-weighted image by an expert anatomist. The skeletons (longitudinal centerline) of both regions were computed and then subdivided into equally-spaced segments. The boundaries of each sector were drawn roughly perpendicular to the skeleton by associating all voxels within the outlines to their closest segment. We fixed 11 regions of interest (ROIs) in the CC showed in Figure 3A, and 6 ROIs in the PIC showed for each hemisphere in Figure 3E.
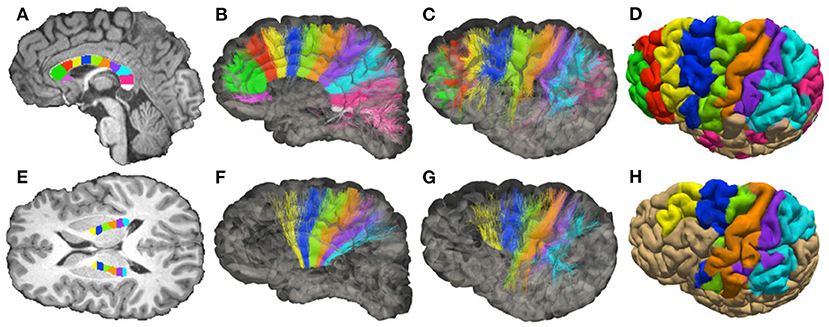
Figure 3. Topology of fibers in the Corpus Callosum (CC) and posterior limb of the internal capsule (PIC), reconstructed with DW-MRI tractography of a single healthy volunteer. (A) Subdivision of the mid-sagittal section of the CC in 11 sectors (corresponding to ROIs), see Supplementary Figure 9. (B,C) Streamlines colored according to the corresponding ROIs (medial and lateral views of the hemisphere). (D) Projection of the streamlines onto the pial surface. (E) Subdivision of PIC in 6 sectors (ROIs). (F,G) Streamlines colored according to the corresponding ROIs (medial and lateral view of the hemisphere). (H) Projection of the streamlines onto the pial surface.
Our in vivo study is focused on two well-characterized axonal tracts: the CC and the PIC. The CC has been well studied in the past with different methodologies, including DW-MRI (Barazany et al., 2009; Alexander et al., 2010). The PIC has been less studied with DW-MRI but is extremely important since it is traversed by cortico-descending axons involved in motor control, whose lesions lead to irreversible paralysis. Moreover, we concentrate the analysis on these two bundles since they are known to have a sufficiently large axon diameter, Figure 6. To study the topology of bundles, the CC and the PIC were segmented and subdivided in, respectively, 11 and 6 equal ROIs normalized for different individuals as described in section 3.4. The streamlines passing through regions of interest (ROIs) corresponding to these sectors were selected, and we analyzed their projections to and from the cortex. These projections correspond to corticofugal and corticopetal (for the CC) connections since DW-MRI does not distinguish the direction of the connections. Bundles of streamlines systematically organized from anterior to posterior connect the CC to similarly ordered slabs of cortex extending from the cingulate gyrus to the lateral sulcus (see Figure 3). This is usually neglected the aspect of CC topology, albeit already shown by tracer injections in the CC of the cat (Nakamura and Kanaseki, 1989), and is compatible with the ordering of CC connections already described with DW-MRI (Hofer et al., 2015). Also, anteroposteriorly organized bundles of streamlines connect the sectors of PIC to anteroposterior cortical territories, compatible with the topology shown by tracer injections and DW-MRI in monkeys (Morecraft et al., 2017) and DW-MRI in humans (Archer et al., 2018).
3.5. Comparison With Histology
The fiber composition of the CC obtained with COMMITAxSize was compared with postmortem measurements from a previous study (Caminiti et al., 2009); however, to evaluate the impact of histological sampling one of the sectors was measured again (see Supplementary Figure 8). Between 451 and 1934 axons stained for myelin were measured in CC sectors crossed by axons connecting the prefrontal, motor, parietal and visual cortices. From the histological data, we estimated the histogram of diameters in each sector. However, since DW-MRI estimates the signal fractions that are related to the volume occupied by axons of different diameter, not their number, the data was converted to volume-weighted distributions, to allow comparison with the DW-MRI estimates. In the absence of human data, the in vivo estimates of the PIC were compared with measurements of axons stained for myelin in the monkey PIC (Innocenti et al., 2018).
4. Results and Discussion
4.1. Numerical Simulations
Figure 4 compares the estimated ADI obtained using the conventional voxel-wise procedure and the proposed bundle-specific COMMITAxSize on the numerical phantom described in Section 3.2. The results from COMMITAxSize show more consistent estimates of the bundles mean cylinder diameter, compared to the voxel-wise method, in particular at low SNR (Figure 4 first column). Moreover, at SNR = 50 COMMITAxSize estimated on average a sADI of 2.90 μm and 4.01 μm compare to 3.37 μm and 4.25 μm for the ActiveAxAMICO (the mean ground-truth diameter of each bundle is 2.7 μm and 4.0 μm, respectively). The estimates provided by COMMITAxSize are both more robust to noise, and closer to the real values, when compared to voxel-wise estimates.
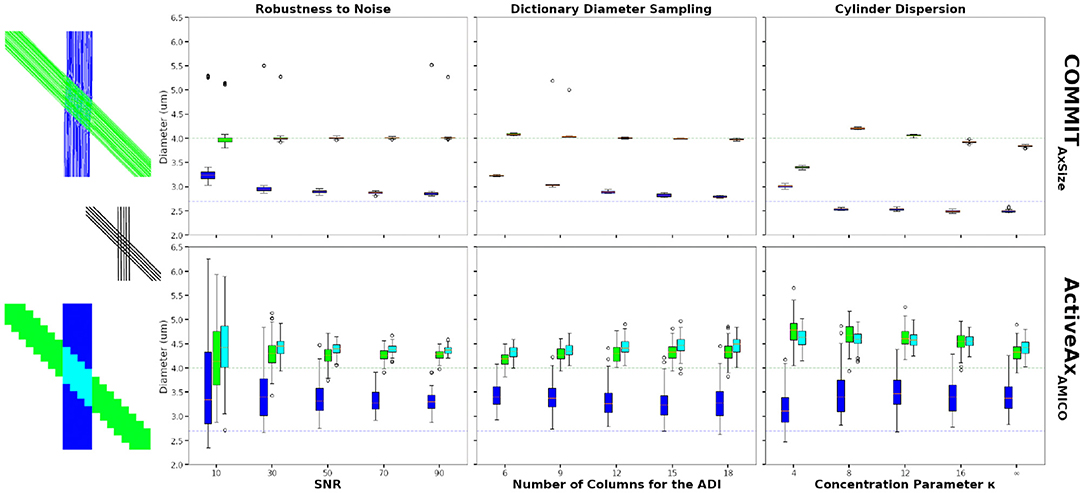
Figure 4. Axon diameter indexes (ADI) estimated on the 45-degrees crossing synthetic phantom. The figures show the bundle-specific ADI estimated using the COMMITAxSize method (top row) and the voxel-wise ADI estimated using the ActiveAxAMICO method (bottom row). The boxplots show the results 50 different Rician noise realisations for COMMITAxSize and 100 voxels sampled in each single bundle areas and in the crossing area, for the ActiveAxAMICO method. The mean ground truth cylinder diameter of the green and blue bundles are 4.0 μm, and 2.7 μm, respectively (colored dashed line). The first boxplot column show the estimated ADI at various SNR, the second column using various number of columns in matrix A to compute the ADI and the last column shows the estimates for data with various levels of dispersion.
The second columns of Figure 4 show the ADI estimates at SNR = 50, changing the dictionary diameter sampling of both methods. Results improve for COMMITAxSize increasing the sampling density, in particular for the bundle with the smallest mean diameter. Results of the voxel-wise method are similar using all dictionaries, with the best performances using 12 or 15 values. In all cases, COMMITAxSize outperformed the voxel-wise method. Although more elements in the dictionary improve the estimation, the optimisation problem becomes harder and increases the computation requirements. Nonetheless, a dictionary sampling of 12 columns in matrix A provides a reasonable estimate on synthetic data, while keeping the computation requirement feasible for in vivo data.
Finally, Figure 4 (third column) show the ADI estimated in the same phantom, but including various levels of dispersion (SNR = 50, dictionary diameter sampling of 12). Rather than using the ground-truth cylinder trajectories, we used probabilistic tractography to estimate their trajectories, capturing the dispersion information from the data. The rightmost boxplot shows the estimates using the probabilistic tractography with no dispersion (κ = inf). Using the probabilistic tractography streamlines, COMMITAxSize shows an underestimation of the mean diameter when compared to the ground-truth bundle trajectories. However, the increase in dispersion (lower κ value) show a systematic over-estimation of the mean diameter of the largest bundles, and little effect on the bundle with the smallest cylinder diameter. However, the trend changes at κ = 4, where both bundle ADI are estimated between 2.9 μm and 3.5 μm. This could be explained by the inability of probabilistic tractography to properly capture this high level of dispersion. Although COMMITAxSize cannot fully model the dispersion, the estimate along the streamlines provides more robust estimates of the bundle diameter than the voxel-wise method.
Moreover, contrary to the voxel-wise method, COMMITAxSize can disentangle bundles in crossing configurations and provide a reliable bundle-specific ADI in those areas. Something not achievable robustly with a voxel-wise method assuming a single fiber population. These numerical experiments showed the benefit of COMMITAxSize when estimating axon diameter indexes.
4.2. In vivo Data
Figure 5 shows the streamlines passing through the CC (A) and the PIC (C), colored following their corresponding sADI. Figures 5B,D show sADI projected onto the pial surface. In both bundles we studied, the largest sADI were found in sectors of PIC traversed by axons connecting the motor cortex (BA 4) while smaller sADI were found for other areas. This visualization reveals that streamlines with larger sADI connect the CC to the precentral gyrus, corresponding to the primary motor cortex (M1; Broadman area BA 4), the more lateral part of premotor cortex (BA 6), and the postcentral gyrus (BA 3,1,2) corresponding to the primary somatosensory cortex (S1). Streamlines with progressively smaller sADI terminate in the medial premotor cortex (BA 6) and the parietal cortex (BA 5,7 and 40) and still smaller sADI in the rostral prefrontal cortex (BA 8 and 9) and BA 44 and 45. In case of the CC, human postmortem material was used to validate the estimates obtained with our novel technique. The comparison was performed in four different ROIs. Figure 6 shows that the bundle sADI estimated with COMMITAxSize closely corresponds to the histological estimates within the DW-MRI range of sensitivity.
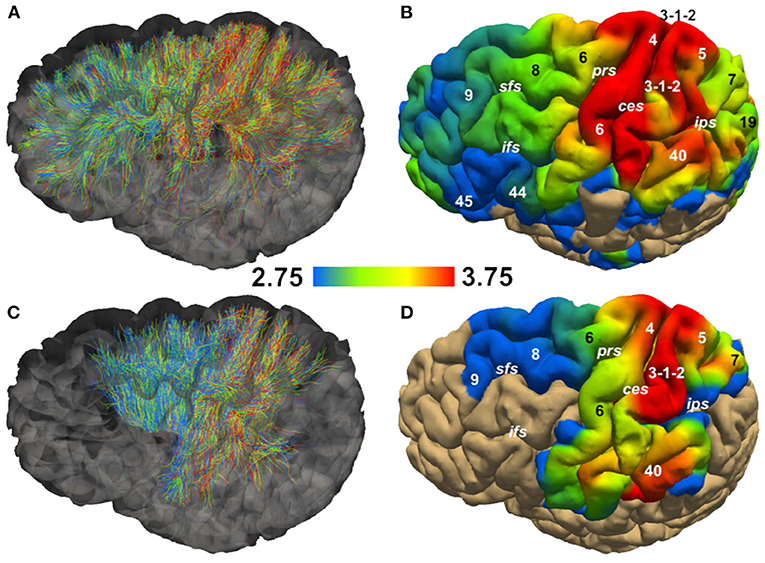
Figure 5. Streamline Axon Diameter Index (sADI) in the Corpus Callosum (CC) and posterior limb of the internal capsule (PIC) of a single healthy volunteer. (A,C) show streamlines colored according to their sADI. (B,D) show the projection of streamlines'sADI onto the pial surface; colors correspond to the sADI averaged across streamlines. Abbreviations: ces, central sulcus; ifs, inferior frontal sulcus; ips, interparietal sulcus; prs, precentral sulcus; sfs, superior frontal sulcus. Numbers correspond to Brodman areas.
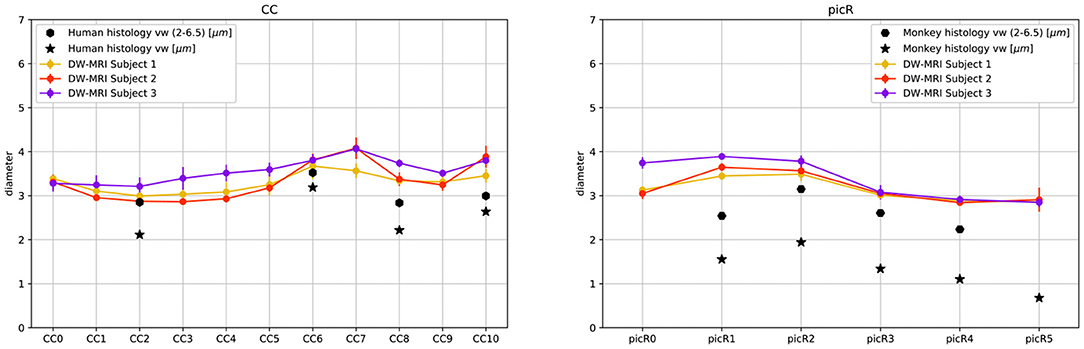
Figure 6. DW-MRI cylinder diameter distribution of CC and PIC sectors compared to histological mean volume-weighted axon diameter from human (CC) and monkey (PIC) histology. Star markers represent the means of volume weighted histological distributions; hexagon markers represent the means of volume weighted cylinder distributions in the range 2.0μm to 6.5μm.
In monkey species (Caminiti et al., 2009; Tomasi et al., 2012), a hierarchy of axon diameters exists with thicker and faster-conducting axons connecting the motor and somatosensory cortices, thinner and slower axons elsewhere. The streamlines coursing in the PIC were color-coded as above according to their estimated sADI. These with the high sADI mapped onto the dorsal part of the precentral BA 4 (M1) and postcentral (BA 3,1,2; S1) gyrus. Progressively smaller sADI mapped onto the parietal cortex (BA 5 and 7) and the premotor cortex (BA 6) and still smaller sADI onto the rostral prefrontal cortex (BA 8 and 9). This arrangement is similar to that demonstrated with injections of anterogradely transported tracers in corresponding areas of the monkey, although in the monkey the diameter of axons originating in the precentral gyrus exceeds that of axons originating in the postcentral gyrus (Innocenti et al., 2018). Identical findings were reproduced for different sectors of the CC and PIC in three subjects and five times for each subject, Figure 6 and Supplementary Figure 10.
Current technologies restrict the resolution of axon diameters to about 2.0 μm (Nilsson et al., 2017). Nevertheless, axons with larger diameter show a detectable contrast according to our simulations, see Supplementary Materials. Despite this limitation, since large axons are found preferentially in specific pathways, their absence in the expected pathways, or abnormal presence in unexpected pathways can disclose the neural basis of specific neurological or psychiatric pathologies (DeLuca et al., 2004; Zikopoulos and Barbas, 2013; Huang et al., 2016; Judson et al., 2017; Golden et al., 2020) and, possibly, of individual skills (de Manzano and Ullén, 2018).
4.3. Strengths and Limitations
Our proposed bundle-specific approach allows investigation of the intrinsic axon composition of white matter pathways as opposed to sampling their composition at discrete locations along their course, making no assumptions on the axon composition of a bundle. As the DW-MRI signal in each voxel is expressed as the combined contributions of multiple intersecting streamlines, our method naturally handles the presence of different pathways within a voxel and allows their individual contributions to be decoupled. This contrasts with methods in which a ‘powder average' of the diffusion-weighted signal is taken as part of the axon diameter estimation process (Veraart et al., 2018). On the contrary, in voxels with such complex fiber configurations, the current voxel-wise estimation approaches provide biased estimates. Another advantage of our approach is that the cylinder diameter distribution of a bundle could be mapped onto the cortex where it originates (and/or terminates), eliminating the ambiguities of following axon diameters at selected locations along the white matter pathways (Assaf et al., 2008; Barazany et al., 2009; Alexander et al., 2010).
One could argue that it has been demonstrated that although the axonal diameter of single axons can undergo local changes along its trajectory (Lee et al., 2019); the axon diameter distribution of diameters in a pathway remains stable over long distances (Tomasi et al., 2012).
Nevertheless, we stress that a streamline represents a group of axons that share a similar trajectory; thus, our method estimates an average diameter for the represented group. Moreover, by discretizing the intra-axonal signal in the contributions arising from multiple impermeable cylinders (Van Gelderen et al., 1994), each streamline can be composed of a different amount of cylinders with different diameters without imposing any prior on the eventual distribution.
By decomposing the signal of each voxel into three components (intra-axonal, extra-axonal and isotropic compartments) and regularizing the intra-axonal signal fractions along streamlines, we were able to detect the signal fractions corresponding to each component. In particular, we discretized the signal coming from each cylinder diameter using the formula for impermeable cylinders of Van Gelderen et al. (1994) and what we estimated through the COMMITAxSize method was the weighting factor in front of each diameter di, which is of the order of (Burcaw et al., 2015). Similarly, we discretized the signal coming from the extra-axonal compartment in two main components, parallel and perpendicular, along each principal direction. Both components were fixed using physically plausible constant values for the diffusion coefficient (Alexander et al., 2010; Zhang et al., 2012). Moreover, for the perpendicular direction, we accounted for four possible diffusion coefficients (i.e., in each voxel for each main direction we estimated five possible fractions of extra-axonal signal: one parallel to the fiber population and four perpendiculars to it). The remaining fraction of the signal in each voxel was then captured by the signal contribution of an isotropic compartment with fixed diffusivity. With these parameters, we do not account for the eventual residual time dependence of the extra-axonal diffusion tensor. However, by allowing a different fraction for each discretized value in the perpendicular direction, we account for a positive contribution of this compartment. Indeed, although we acquired data with strong gradients, we are not in a regime for which the extra-axonal signal may not be completely suppressed (Veraart et al., 2019). The model we used in the signal discretization, as well as the acquisition parameters chosen for the DW-MRI sequence, can be improved to be more sensitive to microstructure features.
Recent studies have suggested that axons may vary in diameter along their length, may present undulations and microscopic orientation dispersion (Brabec et al., 2020; Lee et al., 2020a; Rafael-Patino et al., 2020) which impacts the estimate obtained with DW-MRI (Lee et al., 2020b). The impact of those tissue properties on COMMITAxSize will be addressed in future studies. Furthermore, the volume fractions selected for our simulation experiment were limited by the choice of substrate simulator (Rafael-Patino et al., 2020). Future numerical simulations will address more complex configurations, and more realistic substrates will be constructed (e.g., varying volume fractions and diameter distributions).
In this study, we proposed to estimate the bundle-specific axon diameter index implementing the Cylinder-Zeppelin-Ball forward model. We believe that the selection of the optimal microstructure forward model and dictionary parameters could be improved in future studies. In particular, the dictionary discretization used (i.e., 12 values for the intra-axonal component) and fixed values for diffusivities, which may cause loss of accuracy (Jelescu et al., 2016), will be two aspects to explore extensively. Moreover, various tractography algorithms will be tested to build the COMMITAxSize dictionary (e.g., deterministic and probabilistic, and tractography parameters). Future works will address these aspects, including the exploiting different diffusion acquisition protocols, using similar approaches as in Drobnjak et al. (2016) and Nilsson et al. (2017), to find an optimal set of parameters and protocols improving the sentitivity to the tissue properties (Lampinen et al., 2017). Another important aspect to mention is that the COMMITAxSize may be inaccurate in the diseased brain, affected by focal lesions along white matter tracts. However, it may be applicable to developmental disorders, psychiatric disorders and neurological diseases such as epilepsy.
5. Conclusion
In this paper, we focused on the non-invasive characterization of the composition of central nervous system pathways in the living human brain from DW-MRI acquisitions. In particular, we tackled some fundamental limitations of current voxel-wise techniques and proposed a novel formulation to estimate the axon diameter index of a fiber bundle all along its trajectory, rather than sampling it at a few selective locations along its course. We compared our bundle-specific approach to the state-of-the-art voxel-wise methods, both on synthetic and in vivo human brain data, comparing our findings with histological measurements in two well-studied cortical pathways. Our results demonstrated the feasibility and the benefits of our proposed formulation. Moreover, the bundle composition estimated agree with histology and known anatomy. Further studies could extend the present approach to other pathways in the central nervous system, enhancing the human connectome enterprise (Craddock et al., 2013; Jbabdi et al., 2015; Glasser et al., 2016).
Data Availability Statement
The raw data supporting the conclusions of this article will be made available by the authors, without undue reservation.
Ethics Statement
Ethical review and approval was not required for the study on human participants in accordance with the local legislation and institutional requirements. The patients/participants provided their written informed consent to participate in this study. Written informed consent was obtained from the individual(s) for the publication of any potentially identifiable images or data included in this article.
Author Contributions
MB, GG, DR, SS, MD, CG, DJ, GI, J-PT, and AD conceptualized the problem. MB and AD developed, implemented, and tested the technical framework. DJ provided the MRI data. MB and GI validated the framework. GI contextualized the framework with a biological and application-oriented perspective. MB, GG, SS, GI, and AD wrote the manuscript.
Funding
The work was supported by the Swiss National Science Foundation 31003A_157063 and 205320_175974 as well as by the Rita Levi Montalcini Programme for young researchers of the Italian Ministry of Education, University and Research (MIUR). The MRI data were acquired at the UK National Facility for in vivo MR Imaging of Human Tissue Microstructure funded by the EPSRC (grant EP/M029778/1), and The Wolfson Foundation. DJ is supported by a Wellcome Trust Investigator Award (096646/Z/11/Z) and a Wellcome Trust Strategic Award (104943/Z/14/Z).
Conflict of Interest
The authors declare that the research was conducted in the absence of any commercial or financial relationships that could be construed as a potential conflict of interest.
Acknowledgments
We want to acknowledge U. Rudrapatna, C. M.W. Tax and the CUBRIC center for computational resources and for the acquisition of the DW-MRI data; R.A.W. Galuske and the Technische Universitt Darmstadt for human post-mortem histological samples. We also acknowledge E.J. Canales-Rodriguez for fruitful discussions about optimal estimation of parameters. We acknowledge access to the facilities and expertise of the CIBM Center for Biomedical Imaging, a Swiss research center of excellence founded and supported by Lausanne University Hospital (CHUV), University of Lausanne (UNIL), Ecole polytechnique fdrale de Lausanne (EPFL), University of Geneva (UNIGE) and Geneva University Hospitals (HUG).
Supplementary Material
The Supplementary Material for this article can be found online at: https://www.frontiersin.org/articles/10.3389/fnins.2021.646034/full#supplementary-material
References
Aboitiz, F., Scheibel, A. B., Fisher, R. S., and Zaidel, E. (1992). Fiber composition of the human corpus callosum. Brain Res. 598, 143–153. doi: 10.1016/0006-8993(92)90178-c
Alexander, D. C., Hubbard, P. L., Hall, M. G., Moore, E. A., Ptito, M., Parker, G. J., et al. (2010). Orientationally invariant indices of axon diameter and density from diffusion MRI. Neuroimage 52, 1374–1389. doi: 10.1016/j.neuroimage.2010.05.043
Andersson, J. L., and Sotiropoulos, S. N. (2016). An integrated approach to correction for off-resonance effects and subject movement in diffusion MR imaging. Neuroimage 125, 1063–1078.
Archer, D. B., Vaillancourt, D. E., and Coombes, S. A. (2018). A template and probabilistic atlas of the human sensorimotor tracts using diffusion MRI. Cereb. Cortex 28, 1685–1699. doi: 10.1093/cercor/bhx066
Assaf, Y., Blumenfeld-Katzir, T., Yovel, Y., and Basser, P. J. (2008). AxCaliber: a method for measuring axon diameter distribution from diffusion MRI. Magn. Reson. Med. 59, 1347–1354. doi: 10.1002/mrm.21577
Auria, A., Romascano, D., Canales-Rodriguez, E., Wiaux, Y., Dirby, T. B., Alexander, D., et al. (2015). “Accelerated microstructure imaging via convex optimisation for regions with multiple fibres (AMICOx),” in 2015 IEEE International Conference on Image Processing (ICIP) (Quebec).
Barakovic, M., Tax, C. M., Rudrapatna, U., Chamberland, M., Rafael-Patino, J., Granziera, C., et al. (2021). Resolving bundle-specific intra-axonal t2 values within a voxel using diffusion-relaxation tract-based estimation. Neuroimage 227:117617.
Barazany, D., Basser, P. J., and Assaf, Y. (2009). in vivo measurement of axon diameter distribution in the corpus callosum of rat brain. Brain 132(Pt 5), 1210–1220. doi: 10.1093/brain/awp042
Barazany, D., Jones, D., and Assaf, Y. (2011). “AxCaliber 3D,” in In Proceedings of the 19th Scientific Meeting of ISMRM (Montreal, QC).
Beaulieu, C., and Allen, P. (1994). Water diffusion in the giant axon of the squid: implications for diffusion-weighted MRI of the nervous system. Magn. Reson. Med. 32, 579–583.
Brabec, J., Lasič, S., and Nilsson, M. (2020). Time-dependent diffusion in undulating thin fibers: Impact on axon diameter estimation. NMR Biomed. 33:e4187. doi: 10.1002/nbm.4187
Burcaw, L., Fieremans, E., and Novikov, D. (2015). Mesoscopic structure of neuronal tracts from time-dependent diffusion. Neuroimage 114, 18–37.
Caminiti, R., Ghaziri, H., Galuske, R., Hof, P. R., and Innocenti, G. M. (2009). Evolution amplified processing with temporally dispersed slow neuronal connectivity in primates. Proc. Natl. Acad. Sci. U.S.A. 106, 19551–19556.
Craddock, R. C., Jbabdi, S., Yan, C. G., Vogelstein, J. T., Castellanos, F. X., Di Martino, A., et al. (2013). Imaging human connectomes at the macroscale. Nat. Methods 10, 524–539. doi: 10.1038/nmeth.2482
Daducci, A., Canales-Rodriguez, E., Zhang, H., Dyrby, T., Alexander, D., and Thiran, J.-P. (2015a). Accelerated microstructure imaging via convex optimization (AMICO) from diffusion MRI data. Neuroimage 105, 32–44.
Daducci, A., Dal Palù, A., Lemkaddem, A., and Thiran, J. P. (2015b). COMMIT: convex optimization modeling for microstructure informed tractography. IEEE Trans. Med. imaging 34, 246–257. doi: 10.1109/TMI.2014.2352414
Daducci, A., Palú, A. D., Descoteaux, M., and Thiran, J. P. (2016). Microstructure informed tractography: pitfalls and open challenges. Front. Neurosci. 10:247. doi: 10.3389/fnins.2016.00247
de Manzano, Ö, and Ullén, F. (2018). Same Genes, different brains: neuroanatomical differences between monozygotic twins discordant for musical training. Cereb Cortex 28, 387–394. doi: 10.1093/cercor/bhx299
DeLuca, G. C., Ebers, G. C., and Esiri, M. M. (2004). Axonal loss in multiple sclerosis: a pathological survey of the corticospinal and sensory tracts. Brain 127(Pt 5), 1009–1018. doi: 10.1093/brain/awh118
Destrieux, C., Fischl, B., Dale, A., and Halgren, E. (2010). Automatic parcellation of human cortical gyri and sulci using standard anatomical nomenclature. Neuroimage 53, 1–15. doi: 10.1016/j.neuroimage.2010.06.010
Drakesmith, M., Harms, R., Rudrapatna, S. U., Parker, G. D., Evans, C. J., and Jones, D. K. (2019). Estimating axon conduction velocity in vivo from microstructural MRI. Neuroimage 203:116186. doi: 10.1016/j.neuroimage.2019.116186
Drobnjak, I., Siow, B., and Alexander, D. C. (2010). Optimizing gradient waveforms for microstructure sensitivity in diffusion-weighted MR. J. Magn. Reson. 206, 41–51. doi: 10.1016/j.jmr.2010.05.017
Drobnjak, I., Zhang, H., Ianu, A., Kaden, E., and Alexander, D. C. (2016). Pgse, ogse, and sensitivity to axon diameter in diffusion mri: Insight from a simulation study. Magn. Reson. Med. 75, 688–700. doi: 10.1002/mrm.25631
Dyrby, T., Sogaard, L., Hall, M., Ptito, M., and Alexander, D. (2013). Contrast and stability of the axon diameter index from microstructure imaging with diffusion MRI. Magn. Reson. Med. 70, 711–721. doi: 10.1002/mrm.24501
Fan, Q., Nummenmaa, A., Witzel, T., Ohringer, N., Tian, Q., Setsompop, K., et al. (2020). Axon diameter index estimation independent of fiber orientation distribution using high-gradient diffusion MRI. Neuroimage 222:117197. doi: 10.1016/j.neuroimage.2020
Farooq, H., Xu, J., Nam, J., Keefe, D., Yacoub, E., Georgiou, T., et al. (2016). Microstructure Imaging of Crossing (MIX) White Matter Fibers from diffusion MRI. Sci. Rep. 6:38927. doi: 10.1038/srep38927
Girard, G., Daducci, A., Petit, L., Thiran, J.-P., Whittingstall, K., Deriche, R., et al. (2017). AxTract: toward microstructure informed tractography. Hum. Brain Mapp. 38, 5485–5500. doi: 10.1002/hbm.23741
Glasser, M. F., Coalson, T. S., Robinson, E. C., Hacker, C. D., Harwell, J., Yacoub, E., et al. (2016). A multi-modal parcellation of human cerebral cortex. Nature 536, 171–178. doi: 10.1038/nature18933
Golden, C. E. M., Yee, Y., Wang, V. X., Harony-Nicolas, H., Hof, P. R., Lerch, J. P., et al. (2020). Reduced axonal caliber and structural changes in a rat model of Fragile X syndrome with a deletion of a K-Homology domain of Fmr1. Transl. Psychiatry 10:280. doi: 10.1038/s41398-020-00943-x
Gore, J. C., Xu, J., Colvin, D. C., Yankeelov, T. E., Parsons, E. C., and Does, M. D. (2010). Characterization of tissue structure at varying length scales using temporal diffusion spectroscopy. NMR Biomed. 23, 745–756. doi: 10.1002/nbm.1531
Graham, M. S., Drobnjak, I., Jenkinson, M., and Zhang, H. (2017). Quantitative assessment of the susceptibility artefact and its interaction with motion in diffusion MRI. PLoS ONE 12:e0185647. doi: 10.1371/journal.pone.0185647
Harkins, K. D., Beaulieu, C., Xu, J., Gore, J. C., and Does, M. D. (2021). A simple estimate of axon size with diffusion MRI. Neuroimage 227:117619. doi: 10.1016/j.neuroimage.2020.117619
Hofer, S., Wang, X., Roeloffs, V., and Frahm, J. (2015). Single-shot T1 mapping of the corpus callosum: a rapid characterization of fiber bundle anatomy. Front. Neuroanat. 9:57. doi: 10.3389/fnana.2015.00057
Honey, C., Thivierge, J.-P., and OlSporns (2010). Can structure predict function in the human brain? Neuroimage 52, 766–776. doi: 10.1016/j.neuroimage.2010.01.071
Huang, S., Tobyne, S., Nummenmaa, A., Witzel, T., Wald, L., Mcnab, J., et al. (2016). Characterization of axonal disease in patients with multiple sclerosis using High-Gradient- Diffusion MR imaging. Radiology 280, 244–251. doi: 10.1148/radiol.2016151582
Huang, S. Y., Tian, Q., Fan, Q., Witzel, T., Wichtmann, B., McNab, J. A., et al. (2020). High-gradient diffusion MRI reveals distinct estimates of axon diameter index within different white matter tracts in the in vivo human brain. Brain Struct. Funct. 225, 1277–1291. doi: 10.1007/s00429-019-01961-2
Hursh, J. B. (1937). Conduction velocity and diameter of nerve fibers. Am. J. Physiol. Legacy Content 2, 382–390. doi: 10.1002/brb3.61
Innocenti, G. M., and Caminiti, R. (2017). Axon diameter relates to synaptic bouton size: structural properties define computationally different types of cortical connections in primates. Brain Struct. Funct. 222, 1169–1177. doi: 10.1007/s00429-016-1266-1
Innocenti, G. M., Caminiti, R., Rouiller, E. M., Knott, G., Dyrby, T. B., Descoteaux, M., et al. (2018). Diversity of cortico-descending projections: histological and diffusion MRI characterization in the monkey. Cereb. Cortex 29, 788–801. doi: 10.1093/cercor/bhx363
Jbabdi, S., and Johansen-Berg, H. (2011). Tractography: where do we go from here? Brain Connect. 1, 169–183. doi: 10.1089/brain.2011.0033
Jbabdi, S., Sotiropoulos, S. N., Haber, S. N., Van Essen, D. C., and Behrens, T. E. (2015). Measuring macroscopic brain connections in vivo. Nat. Neurosci. 18, 1546–1555. doi: 10.1038/nn.4134
Jelescu, I. O., Veraart, J., Fieremans, E., and Novikov, D. S. (2016). Degeneracy in model parameter estimation for multi-compartmental diffusion in neuronal tissue. NMR Biomed. 29, 33–47. doi: 10.1002/nbm.3450
Jenkinson, M., and Smith, S. (2001). A global optimisation method for robust affine registration of brain images. Med. Image Anal. 5, 143–156. doi: 10.1016/s1361-8415(01)00036-6
Jenkinson, M., and Smith, S. (2001). A global optimisation method for robust affine registration of brain images. Med. Image Anal. 5, 143–156.
Jeurissen, B., Descoteaux, M., Mori, S., and Leemans, A. (2017). Diffusion MRI fiber tractography of the brain. NMR Biomed. 42:e3785–22. doi: 10.1002/nbm.3785
Jeurissen, B., Leemans, A., Tournier, J.-D., Jones, D. K., and Sijbers, J. (2013). Investigating the prevalence of complex fiber configurations in white matter tissue with diffusion magnetic resonance imaging. Hum. Brain Mapp. 34, 2747–2766. doi: 10.1002/hbm.22099
Jones, D. K., Alexander, D. C., Bowtell, R., Cercignani, M., Dell'Acqua, F., McHugh, D. J., et al. (2018). Microstructural imaging of the human brain with a 'super-scanner': 10 key advantages of ultra-strong gradients for diffusion MRI. Neuroimage 182, 8–38. doi: 10.1016/j.neuroimage.2018.05.047
Jones, D. K., and Cercignani, M. (2010). Twenty-five pitfalls in the analysis of diffusion MRI data. NMR Biomed. 23, 803–820. doi: 10.1002/nbm.1543
Jones, D. K., Knösche, T. R., and Turner, R. (2013). White matter integrity, fiber count, and other fallacies: The do's and don'ts of diffusion MRI. Neuroimage 73, 239–254. doi: 10.1016/j.neuroimage.2012.06.081
Jovicich, J., Czanner, S., Greve, D., Haley, E., Van Der Kouwe, A., Gollub, R., et al. (2006). Reliability in multi-site structural MRI studies: Effects of gradient non-linearity correction on phantom and human data. Neuroimage 30, 436–443. doi: 10.1016/j.neuroimage.2005.09.046
Judson, M. C., Burette, A. C., Thaxton, C. L., Pribisko, A. L., Shen, M. D., Rumple, A. M., et al. (2017). Decreased axon caliber underlies loss of fiber tract integrity, disproportional reductions in white matter volume, and microcephaly in angelman syndrome model mice. J. Neurosci. 37, 7347–7361. doi: 10.1523/JNEUROSCI.0037-17.2017
Kakkar, L. S., Bennett, O. F., Siow, B., Richardson, S., Ianu, A., Quick, T., et al. (2018). Low frequency oscillating gradient spin-echo sequences improve sensitivity to axon diameter: an experimental study in viable nerve tissue. Neuroimage 182, 314–328. doi: 10.1016/j.neuroimage.2017.07.060
Lampinen, B., Szczepankiewicz, F., Mårtensson, J., van Westen, D., Sundgren, P. C., and Nilsson, M. (2017). Neurite density imaging versus imaging of microscopic anisotropy in diffusion MRI: a model comparison using spherical tensor encoding. Neuroimage 147, 517–531. doi: 10.1016/j.neuroimage.2016.11.053
Le Bihan, D., and Breton, E. (1985). Imagerie de diffusion in vivo par résonance magnétique nucléaire. Comptes rendus de l'Acad. Sci. 301, 1109–1112.
Le Bihan, D., and Iima, M. (2015). Diffusion magnetic resonance imaging: What water tells us about biological tissues. PLoS Biol. 13:e1002203. doi: 10.1371/journal.pbio.1002203
Lee, H. H., Jespersen, S. N., Fieremans, E., and Novikov, D. S. (2020a). The impact of realistic axonal shape on axon diameter estimation using diffusion MRI. Neuroimage 223:117228. doi: 10.1016/j.neuroimage.2020.117228
Lee, H. H., Papaioannou, A., Kim, S. L., Novikov, D. S., and Fieremans, E. (2020b). A time-dependent diffusion MRI signature of axon caliber variations and beading. Commun. Biol. 3:354. doi: 10.1038/s42003-020-1050-x
Lee, H. H., Yaros, K., Veraart, J., Pathan, J. L., Liang, F. X., Kim, S. G., et al. (2019). Along-axon diameter variation and axonal orientation dispersion revealed with 3D electron microscopy: implications for quantifying brain white matter microstructure with histology and diffusion MRI. Brain Struct. Funct. 224, 1469–1488. doi: 10.1007/s00429-019-01844-6
Morecraft, R. J., Binneboese, A., Stilwell-Morecraft, K. S., and Ge, J. (2017). Localization of orofacial representation in the corona radiata, internal capsule and cerebral peduncle in Macaca mulatta. J. Comparat. Neurol. 525, 3429–3457. doi: 10.1002/cne.24275
Moseley, M., Cohen, Y., Kucharczyk, J., Mintorovitch, J., Asgari, H., Wendland, M., et al. (1990). Diffusion-weighted MR imaging of anisotropic water diffusion in cat central nervous system. Radiology 176, 439–445. doi: 10.1148/radiology.176.2.2367658
Nakamura, H., and Kanaseki, T. (1989). Topography of the corpus callosum in the cat. Brain Res. 485, 171–175. doi: 10.1016/0006-8993(89)90679-3
Nilsson, M., Lasič, S., Drobnjak, I., Topgaard, D., and Westin, C. F. (2017). Resolution limit of cylinder diameter estimation by diffusion MRI: the impact of gradient waveform and orientation dispersion. NMR Biomed. 30:e3711. doi: 10.1002/nbm.3711
Novikov, D. S., Kiselev, V. G., and Jespersen, S. N. (2018). On modeling. Magn. Res. Med. 79, 3172–3193. doi: 10.1002/mrm.27101
Panagiotaki, E., Schneider, T., Siow, B., Hall, M. G., Lythgoe, M. F., and Alexander, D. C. (2012). Compartment models of the diffusion MR signal in brain white matter: A taxonomy and comparison. Neuroimage 59, 2241–2254. doi: 10.1016/j.neuroimage.2011.09.081
Paquette, M., Eichner, C., Knösche, T. R., and Anwander, A. (2020). Axon diameter measurements using diffusion mri are infeasible. bioRxiv. doi: 10.1101/2020.10.01.320507
Perge, J. A., Niven, J. E., Sterling, P., Mugnaini, E., and Balasubramanian, V. (2012). Why do axons differ in caliber? J. Neurosci. 32, 626–638. doi: 10.1523/JNEUROSCI.4254-11.2012
Pestilli, F., Yeatman, J. D., Rokem, A., Kay, K. N., and Wandell, B. A. (2014). Evaluation and statistical inference for human connectomes. Nat. Methods 11, 1058–1063. doi: 10.1038/nmeth.3098
Peters, A., Palay, S., and Webster, H. (1991). The Fine Structure of the Nervous System: Neurons and Their Supporting Cells. Oxford University Press.
Rafael-Patino, J., Romascano, D., Ramirez-Manzanares, A., Canales-Rodríguez, E. J., Girard, G., and Thiran, J. P. (2020). Robust monte-carlo simulations in diffusion-MRI: effect of the substrate complexity and parameter choice on the reproducibility of results. Front. Neuroinform. 14:8. doi: 10.3389/fninf.2020.00008
Rensonnet, G., Scherrer, B., Warfield, S. K., Macq, B., and Taquet, M. (2018). Assessing the validity of the approximation of diffusion-weighted-MRI signals from crossing fascicles by sums of signals from single fascicles. Magn. Reson. Med. 79, 2332–2345. doi: 10.1002/mrm.26832
Ritchie, J. (1982). On the Relation between Fibre Diameter and Conduction Velocity in Myelinated Nerve Fibres. Proc. R. Soc. B Biol. Sci. 217, 29–35.
Rudrapatna, U., Parker, G. D., Roberts, J., and Jones, D. K. (2021). A comparative study of gradient nonlinearity correction strategies for processing diffusion data obtained with ultra-strong gradient MRI scanners. Magn. Res. Med. 85, 1104–1113. doi: 10.1002/mrm.28464
Sherbondy, A. J., Dougherty, R. F., Ananthanarayanan, R., Modha, D. S., and Wandell, B. A. (2009). Think global, act local; projectome estimation with BlueMatter. Lecture Notes in Computer Science (including subseries Lecture Notes in Artificial Intelligence and Lecture Notes in Bioinformatics).
Sherbondy, A. J., Rowe, M. C., and Alexander, D. C. (2010). “MicroTrack: an algorithm for concurrent projectome and microstructure estimation,” in Lecture Notes in Computer Science (including subseries Lecture Notes in Artificial Intelligence and Lecture Notes in Bioinformatics) (Beijing).
Siow, B. M. C. W., Drobnjak, I., Ianus, A., Christie, I. N., Lythgoe, M. F., and Alexander, D. C. (2013). Axon radius estimation with oscillating gradient spin echo (OGSE) diffusion MRI. Diffus. Fundam. 18, 1–6.
Smith, R. E., Tournier, J. D., Calamante, F., and Connelly, A. (2013). SIFT: spherical-deconvolution informed filtering of tractograms. Neuroimage 67, 298–312. doi: 10.1016/j.neuroimage.2012.11.049
Smith, R. E., Tournier, J. D., Calamante, F., and Connelly, A. (2015). SIFT2: enabling dense quantitative assessment of brain white matter connectivity using streamlines tractography. Neuroimage 119, 338–351. doi: 10.1016/j.neuroimage.2015.06.092
Szafer, A., Zhong, J., and Gore, J. C. (1995). Theoretical model for water diffusion in tissues. Magn. Reson. Med. 33, 697–712.
Tomasi, S., Caminiti, R., and Innocenti, G. M. (2012). Areal differences in diameter and length of corticofugal projections. Cereb. Cortex 22, 1463–1472. doi: 10.1093/cercor/bhs011
Tournier, J.-D., Calamante, F., and Connelly, A. (2007). Robust determination of the fibre orientation distribution in diffusion MRI: non-negativity constrained super-resolved spherical deconvolution. Neuroimage, 35, 1459–1472. doi: 10.1016/j.neuroimage.2007.02.016
Tournier, J. D., Calamante, F., and Connelly, A. (2012). MRtrix: diffusion tractography in crossing fiber regions. Int. J. Imaging Syst. Technol. 22, 53–66. doi: 10.1002/ima.22005
Van Gelderen, P., Despres, D., Vanzijl, P., and Moonen, C. (1994). Evaluation of restricted diffusion in cylinders. Phosphocreatine in rabbit leg muscle. J. Magn. Reson. Ser. B 103, 255–260.
Veraart, J., Fieremans, E., and Novikov, D. S. (2019). On the scaling behavior of water diffusion in human brain white matter. Neuroimage 185, 379–387. doi: 10.1016/j.neuroimage.2018.09.075
Veraart, J., Fieremans, E., Rudrapatna, U., Jones, D., and Novikov, D. (2018). “Breaking the power law scaling of the dMRI signal on the Connectom scanner reveals its sensitivity to axon diameters,” in Proceedings of the 27th Scientific Meeting of ISMRM (Paris).
Veraart, J., Nunes, D., Rudrapatna, U., Fieremans, E., Jones, D. K., Novikov, D. S., et al. (2020). Noninvasive quantification of axon radii using diffusion MRI. eLife 9:e49855. doi: 10.7554/eLife.49855
Xu, J., Li, H., Harkins, K. D., Jiang, X., Xie, J., Kang, H., et al. (2014). Mapping mean axon diameter and axonal volume fraction by MRI using temporal diffusion spectroscopy. Neuroimage 103, 10–19. doi: 10.1016/j.neuroimage.2014.09.006
Xu, J., Li, H., Li, K., Harkins, K. D., Jiang, X., Xie, J., et al. (2016). Fast and simplified mapping of mean axon diameter using temporal diffusion spectroscopy. NMR Biomed. 29, 400–410. doi: 10.1002/nbm.3484
Zhang, H., Dyrby, T. B., and Alexander, D. C. (2011a). “Axon diameter mapping in crossing fibers with diffusion MRI,” Medical image computing and computer-assisted intervention : MICCAI. International Conference on Medical Image Computing and Computer-Assisted Intervention (Toronto, ON).
Zhang, H., Hubbard, P., Parker, G., and Alexander, D. (2011b). Axon diameter mapping in the presence of orientation dispersion with diffusion MRI. Neuroimage 56, 1301–1315. doi: 10.1016/j.neuroimage.2011.01.084
Zhang, H., Schneider, T., Wheeler-Kingshott, C. A., and Alexander, D. C. (2012). NODDI: Practical in vivo neurite orientation dispersion and density imaging of the human brain. Neuroimage 61, 1000–1016. doi: 10.1016/j.neuroimage.2012.03.072
Zhang, Y., Brady, M., and Smith, S. (2001). Segmentation of brain MR images through a hidden Markov random field model and the expectation-maximization algorithm. IEEE Trans. Med. Imaging 20, 45–57. doi: 10.1109/42.906424
Keywords: human brain, white-matter axon signature, diffusion MRI, tractography, microstructure, microstructure informed tractography
Citation: Barakovic M, Girard G, Schiavi S, Romascano D, Descoteaux M, Granziera C, Jones DK, Innocenti GM, Thiran J-P and Daducci A (2021) Bundle-Specific Axon Diameter Index as a New Contrast to Differentiate White Matter Tracts. Front. Neurosci. 15:646034. doi: 10.3389/fnins.2021.646034
Received: 24 December 2020; Accepted: 17 May 2021;
Published: 15 June 2021.
Edited by:
Tim B. Dyrby, Technical University of Denmark, DenmarkReviewed by:
Viktor Vegh, The University of Queensland, AustraliaIvana Drobnjak, University College London, United Kingdom
Copyright © 2021 Barakovic, Girard, Schiavi, Romascano, Descoteaux, Granziera, Jones, Innocenti, Thiran and Daducci. This is an open-access article distributed under the terms of the Creative Commons Attribution License (CC BY). The use, distribution or reproduction in other forums is permitted, provided the original author(s) and the copyright owner(s) are credited and that the original publication in this journal is cited, in accordance with accepted academic practice. No use, distribution or reproduction is permitted which does not comply with these terms.
*Correspondence: Muhamed Barakovic, muhamed.barakovic@epfl.ch
†These authors have contributed equally to this work
‡Dedicated This paper to our friend and colleague Giorgio M. Innocenti, who passed away on January 12, 2021