
- Department of Anatomy and Neurobiology, University of Tennessee Health Science Center, Memphis, TN, USA
The hypothalamus contains nuclei and cell populations that are critical in reproduction and that differ significantly between the sexes in structure and function. To examine the molecular and genetic basis for these differences, we quantified gene expression in the hypothalamus of 39 pairs of adult male and female mice belonging to the BXD strains. This experimental design enabled us to define hypothalamic gene coexpression networks and provided robust estimates of absolute expression differences. As expected, sex has the strongest effect on the expression of genes on the X and Y chromosomes (e.g., Uty, Xist, Kdm6a). Transcripts associated with the endocrine system and neuropeptide signaling also differ significantly. Sex-differentiated transcripts often have well delimited expression within specific hypothalamic nuclei that have roles in reproduction. For instance, the estrogen receptor (Esr1) and neurokinin B (Tac2) genes have intense expression in the medial preoptic and arcuate nuclei and comparatively high expression in females. Despite the strong effect of sex on single transcripts, the global pattern of covariance among transcripts is well preserved, and consequently, males and females have well matched coexpression modules. However, there are sex-specific hub genes in functionally equivalent modules. For example, only in males is the Y-linked gene, Uty, a highly connected transcript in a network that regulates chromatin modification and gene transcription. In females, the X chromosome paralog, Kdm6a, takes the place of Uty in the same network. We also find significant effect of sex on genetic regulation and the same network in males and females can be associated with markedly different regulatory loci. With the exception of a few sex-specific modules, our analysis reveals a system in which sets of functionally related transcripts are organized into stable sex-independent networks that are controlled at a higher level by sex-specific modulators.
Introduction
The hypothalamus controls many facets and phases of reproductive behavior. Several sub-nuclei and regions within the hypothalamus differ significantly between males and females. For example, in several species including human, a cluster of cells in the preoptic area is significantly larger in males and is crucial for the expression of male sexual behavior (Gorski et al., 1978; De Jonge et al., 1989; Hofman and Swaab, 1989). In contrast, the anteroventral periventricular area is significantly larger in female rats and is involved in luteinizing hormone release and ovulation (Simerly, 1998). These morphological and functional differences almost certainly contribute to differential vulnerabilities to diseases such as depression, stress disorders, obesity, and anorexia (Woods et al., 2003; Halbreich, 2006; Kajantie and Phillips, 2006; Asarian and Langhans, 2010).
In mammalian species, sex-dependent variation in brain structure and function is triggered mainly by genes linked to the sex chromosomes (Chrs) and to the downstream effects of gonadal hormones. Apart from these proximal causes, another layer of influence on sexual differentiation comes from widespread sequence variants distributed across the entire genome. These autosomal variants may explain marked strain-to-strain variation in the level of sexual dimorphism. For example, in mice, a sexually dimorphic preoptic nucleus in the DBA/2J strain is undetectable in the C57BL/6J strain (Brown et al., 1999; Mathieson et al., 2000). Such global strain-dependent effects on brain differentiation suggest that there is significant interplay between the sex determinants and autosomal genotype. These autosomal modulators of sex differences likely contribute to the many sex-specific quantitative trait loci (QTLs) that influence a large number of behavioral, physiological, and molecular traits (Melo et al., 1996; Weiss et al., 2006; Bhasin et al., 2008; van Nas et al., 2009).
Sex-specific QTLs are essentially DNA sequence variants that modulate phenotypes that have some level of sex differences and are detected to a greater or lesser degree as a function of genotype and sex. The sex-dependent effects extend to genetic loci that control the expression of genes, i.e., expression QTLs (eQTLs). Large-scale genomic studies of gene expression have found extensive transcriptional variation between the sexes in several somatic tissues including the brain (Yang et al., 2006; Reinius et al., 2008, 2010; van Nas et al., 2009). Genetic mapping of such expression traits invariably identifies sex-biased eQTLs (Yang et al., 2006; Bhasin et al., 2008; van Nas et al., 2009). These data suggest that sex has pervasive effects on the regulation of transcript levels, and that gene expression is modulated by a combination of sex-dependent and sex-independent genetic factors.
While gene expression in the brain is not as sexually divergent as in other tissues (for example, liver, kidney, or muscle), several hundred transcripts do differentiate the male and female brain transcriptomes (Yang et al., 2006; van Nas et al., 2009). However, with the exception of a few genes located on the sex Chrs that have dosage imbalance, the effect of sex is generally modest for most genes located on autosomal Chrs. On average, expression of “sexually dimorphic” transcripts varies less than 10% between the sexes (Yang et al., 2006; van Nas et al., 2009; Reinius et al., 2010). This is a relatively modest effect of sex on transcripts. How does this modest variation contribute to the widespread effect of sex on physiology and behavior? It is likely that the more extreme functional differences between the sexes arise from subtle combinatorial differences of hundreds of transcripts. This raises the questions as to what genetic regulatory mechanisms maintain network stability and what mechanisms contribute to the typical dichotomization? Prompted by such questions, we have taken a systems-level approach to compare gene expression and transcriptional networks in males and females.
Here we systematically examine transcript levels in the hypothalamus using a sex-balanced panel of 39 inbred mouse strains belonging to the BXD family. These strains were derived from crosses between C57BL/6J (B6) and DBA/2J (D2) parental strains. The progeny BXDs are known to segregate for traits related to the hypothalamus including volumetric differences (Garlow et al., 2005; Boone et al., 2008; Badea et al., 2009). We use weighted gene coexpression network analysis (WGCNA) to construct networks of transcripts based on genetic and sex differences across all 39 BXD strains (Zhang and Horvath, 2005). Global network structure is remarkably similar between males and females, but we did identify several pivotal transcripts that are crucial in sex-dependent hypothalamic networks.
Materials and Methods
Mouse Strains
The BXD recombinant inbred strains are derived from crossing the B6 and D2 parental strains and inbreeding for over 20 generations (Taylor et al., 1999; Peirce et al., 2004). All mice used in this study were born and housed at the University of Tennessee Health Science Center. Mice were kept at an average of 3–4 per cage in a temperature-controlled vivarium (22°C) and maintained at a 12 h light/dark cycle. All animal protocols were approved by the Animal Care and Use Committee. We studied a total of 50 BXD strains, but only acquired matched male–female data pairs for 39 strains (35 BXD strains, parental B6 and D2, and two reciprocal F1 hybrids). The average age of mice was 78 days. We provide more detail on the experimental design and precise age and time of sacrifice of all cases at http://www.genenetwork.org/dbdoc/INIA_Hyp_RMA_1110.html.
Tissue Dissection and Sample Processing
Mice were euthanized by quick cervical dislocation. The brain was quickly removed and immersed in RNAlater (Ambion)1 and stored in 4°C for 2–3 days. To dissect the hypothalamus, the brain was placed with the ventral side facing up in a coronal matrix. Using the medial mammillary body as landmark, a vertical cut was made right along the posterior boundary of the hypothalamus. A second vertical cut was made 2 mm from the first cut. This edge lies slightly caudal to the optic chiasm and cuts through the retrochiasmatic nucleus. The hypothalamus was then sliced out from this 2 mm thick section.
Each of the 39 mouse strains is represented by male and female samples (total of 78 microarray samples). Each individual sample consisted of tissue pooled from two mice of the same strain and sex that are usually littermates. The total number of mice used was 78 females and 78 males. RNA was purified using the RNAeasy micro kit on the QIAcube system (Qiagen)2. RNA purity and concentration was checked using 260/280 nm absorbance ratio and RNA integrity was analyzed using the Agilent Bioanalyzer 2100 (Agilent Technologies)3.
Microarray Data Analysis
Total RNA was processed using standard protocols and hybridized to the Affymetrix Mouse Gene 1.0 ST arrays4. This array contains ∼34,700 probe sets that target ∼29,000 well-defined transcripts (RefSeq mRNA isoforms). A single probe set is a collection of about 27 probes that target known exons within a single gene. The multiple probes design provides a more comprehensive coverage of transcripts from a single gene. Male and female samples were interleaved and processed together to avoid batch confounds. Details on the strain, age, and sex of each sample can be obtained from the information available for the INIA Hypothalamus Affy MoGene 1.0 ST (Nov10) data set on www.genenetwork.org.
Probe set level intensity values were extracted from the CEL files using the Affymetrix GeneChip Operating Software. Data normalization was performed using the R package “Affy” available from www.Bioconductor.org. The Robust Multichip Averaging protocol was used to process the expression values. The array data was then log transformed and rescaled using a z-scoring procedure to set the mean of each sample at eight expression units with a SD of 2 units. The entire data set can be downloaded from www.genenetwork.org using the accession number GN281 (http://www.genenetwork.org/webqtl/main.py?FormID = sharinginfo&GN_AccessionId = 281) and also from the NIH Gene Expression Omnibus5 using the GEO accession number GSE36674. For this study we used a subset of cases that were represented by both male and female samples – 78 sex-balanced arrays. Statistical power provided by this sample size (N = 39 strains) was estimated using the R function power.t.test6 with the SD set at 0.17, which is the average value. Only transcripts with above average expression (minimum expression value above 8.5 on a log2 scale) were included for further analysis (17,192 probe sets). We used a two-tailed paired t-test to identify transcripts with significant expression difference between males and females. We applied the Benjamini and Hochberg false discovery rate (FDR) method and selected differentially expressed transcripts using a 10% FDR criterion.
Quantitative RT-PCR
For RT-PCR, RNA samples were prepared from the hypothalamus of male and female mice of the BXD60 strain. We selected BXD60 to test the strain-independent effect of sex because we had more mice of this strain in the colony than either B6 or D2. A total of eight male and eight female mice were used and tissue was pooled from two animals of the same sex per sample (i.e., four male samples and four female samples). After standard RNA quality control, 2 μg of mRNA was reverse transcribed into cDNA using the GE Health First-Strand cDNA Synthesis Kit7.
Primers targeting Ddx3y, Tac2, Esr1, Oxtr, Nmur2, and Adamts2 were generated using Primer3 (Rozen and Skaletsky, 2000). Each assay was designed to span exons and was checked in silico using the ProbeFinder tool (version 2.45) available from the Roche-Applied-Science website8. Primer efficiencies were also evaluated using a cDNA dilution series. PCR was performed on the Roche LightCycler 480 system (see text footnote 8). The reaction mix consisted of 2 μl of cDNA, 0.2 μl of left and right primers (20 μM), 0.1 μl of 10 μM probe from the Universal Probe Library (see text footnote 8), 5 μl of the Roche 2X LC480 master mix, and 2.7 μl of DNase free water. Thermal cycles were 95°C (5 min); 50 cycles of 95°C (10 s), 60°C (30 s), 72°C (10 s).
Reactions were carried out in technical triplicates. Cycle thresholds (Ct) of the three technical replicates were averaged (raw Ct values are provided in Supplementary Material S1) and normalized to the Ct value for Actin beta (Actb) to derive ΔCt (Livak and Schmittgen, 2001). The ΔΔCt method was used to evaluate relative expression difference between males and females. Statistical comparison between the four male and four female samples was done using one-tailed Student’s t-tests.
Construction of Coexpression Networks
Weighted gene coexpression network analysis was used to define coexpression modules in the hypothalamus. For this computationally intense process, we further filtered the data to include only those probe sets with well-defined gene targets and with high expression variance (σ2 ≥ 0.02) across the samples. This left us with a subset of 6,391 probe sets. Network analysis was carried out using the WGCNA R package. The analytical framework for WGCNA is laid out in Zhang and Horvath (2005). Briefly, a similarity matrix is constructed for the data set by computing the absolute pairwise Pearson product correlations for all transcripts based on expression variation across the BXD population. A power function, β, is used to transform the similarity matrix into an adjacency matrix that provides a measure of connection strengths between pairs of transcripts. The relative interconnectedness between two transcripts is estimated by computing a topological overlap matrix (TOM). This is a robust measure of connection similarities between transcripts and has been applied to biological networks (Ravasz et al., 2002). TOM is then used to define modules, which are then segregated into branches by hierarchical clustering.
Male and female networks were constructed independently but using the same parameters. We used standard criteria defined in Zhang and Horvath (2005) and set the soft-thresholding β at nine for both males and females. To compare male and female modules, we examined the fraction of transcripts that grouped together in both sexes (Langfelder et al., 2011). Fisher’s exact test was also used to compute the significance of overlap between modules. Together with the percent overlap and Fisher’s exact p-values, we identified corresponding male and female modules. Male modules are labeled M1, M2, etc., and female modules are labeled F1, F2, etc. For ease of comparison, label numbers of highly similar modules were matched between sexes. For further analysis, each module was summarized by the first principal component and module eigenvectors were used for correlational analyses. Hub genes in modules were identified using the network connectivity values for each transcript. All these functions were implemented within the comprehensive WGCNA R package.
Genetic Analysis of Transcripts
For QTL mapping, the entire hypothalamus transcriptome data set was uploaded to GeneNetwork9. A total of 3,795 informative microsatellite and SNP markers were used for interval mapping of all transcripts. We report the linkages as likelihood ratio statistic (LRS) scores (LOD score = LRS/4.61). Genome-wide significant and suggestive thresholds were estimated by permutation analysis. Additional details on the mapping algorithm used by GeneNetwork are provided in Mozhui et al. (2008) and Peirce et al. (2006).
Other Bioinformatics Resources
Gene ontology enrichment was analyzed for the modules using tools available on DAVID (version 6.710; Dennis et al., 2003). For in situ analysis of transcript expression in the hypothalamus, we used the mouse brain resource provided by the Allen Brain Atlas11 (Lein et al., 2007).
Results
Sex Difference in Gene Expression in the Hypothalamus
A set of 48 transcripts and cognate genes in the hypothalamus differ significantly in expression between the sexes at an FDR threshold of 0.1 (Table 1). Thirteen of these are located on the sex Chrs and 35 are located on autosomes. Transcripts of genes on the sex Chrs have the largest effects with 6- to over 40-fold differences in expression for Xist, Eif2s3y, Ddx3y, Uty, and Kdm5d. Effect sizes for the remaining 43 transcripts are more modest. The mean difference for autosomal transcripts is only ∼10%. Autosomal genes include estrogen receptor Esr1, tachykinin neuropeptide Tac2, neuropeptide receptor Npbwr1, and oxytocin and prolactin receptors Oxtr and Prlr. Analysis of functional categories for the autosomal transcripts shows direct relevance to hypothalamic functions with enrichment in genes related to gland development, growth regulation, neurotransmission, and neuropeptide activity (Table 2).
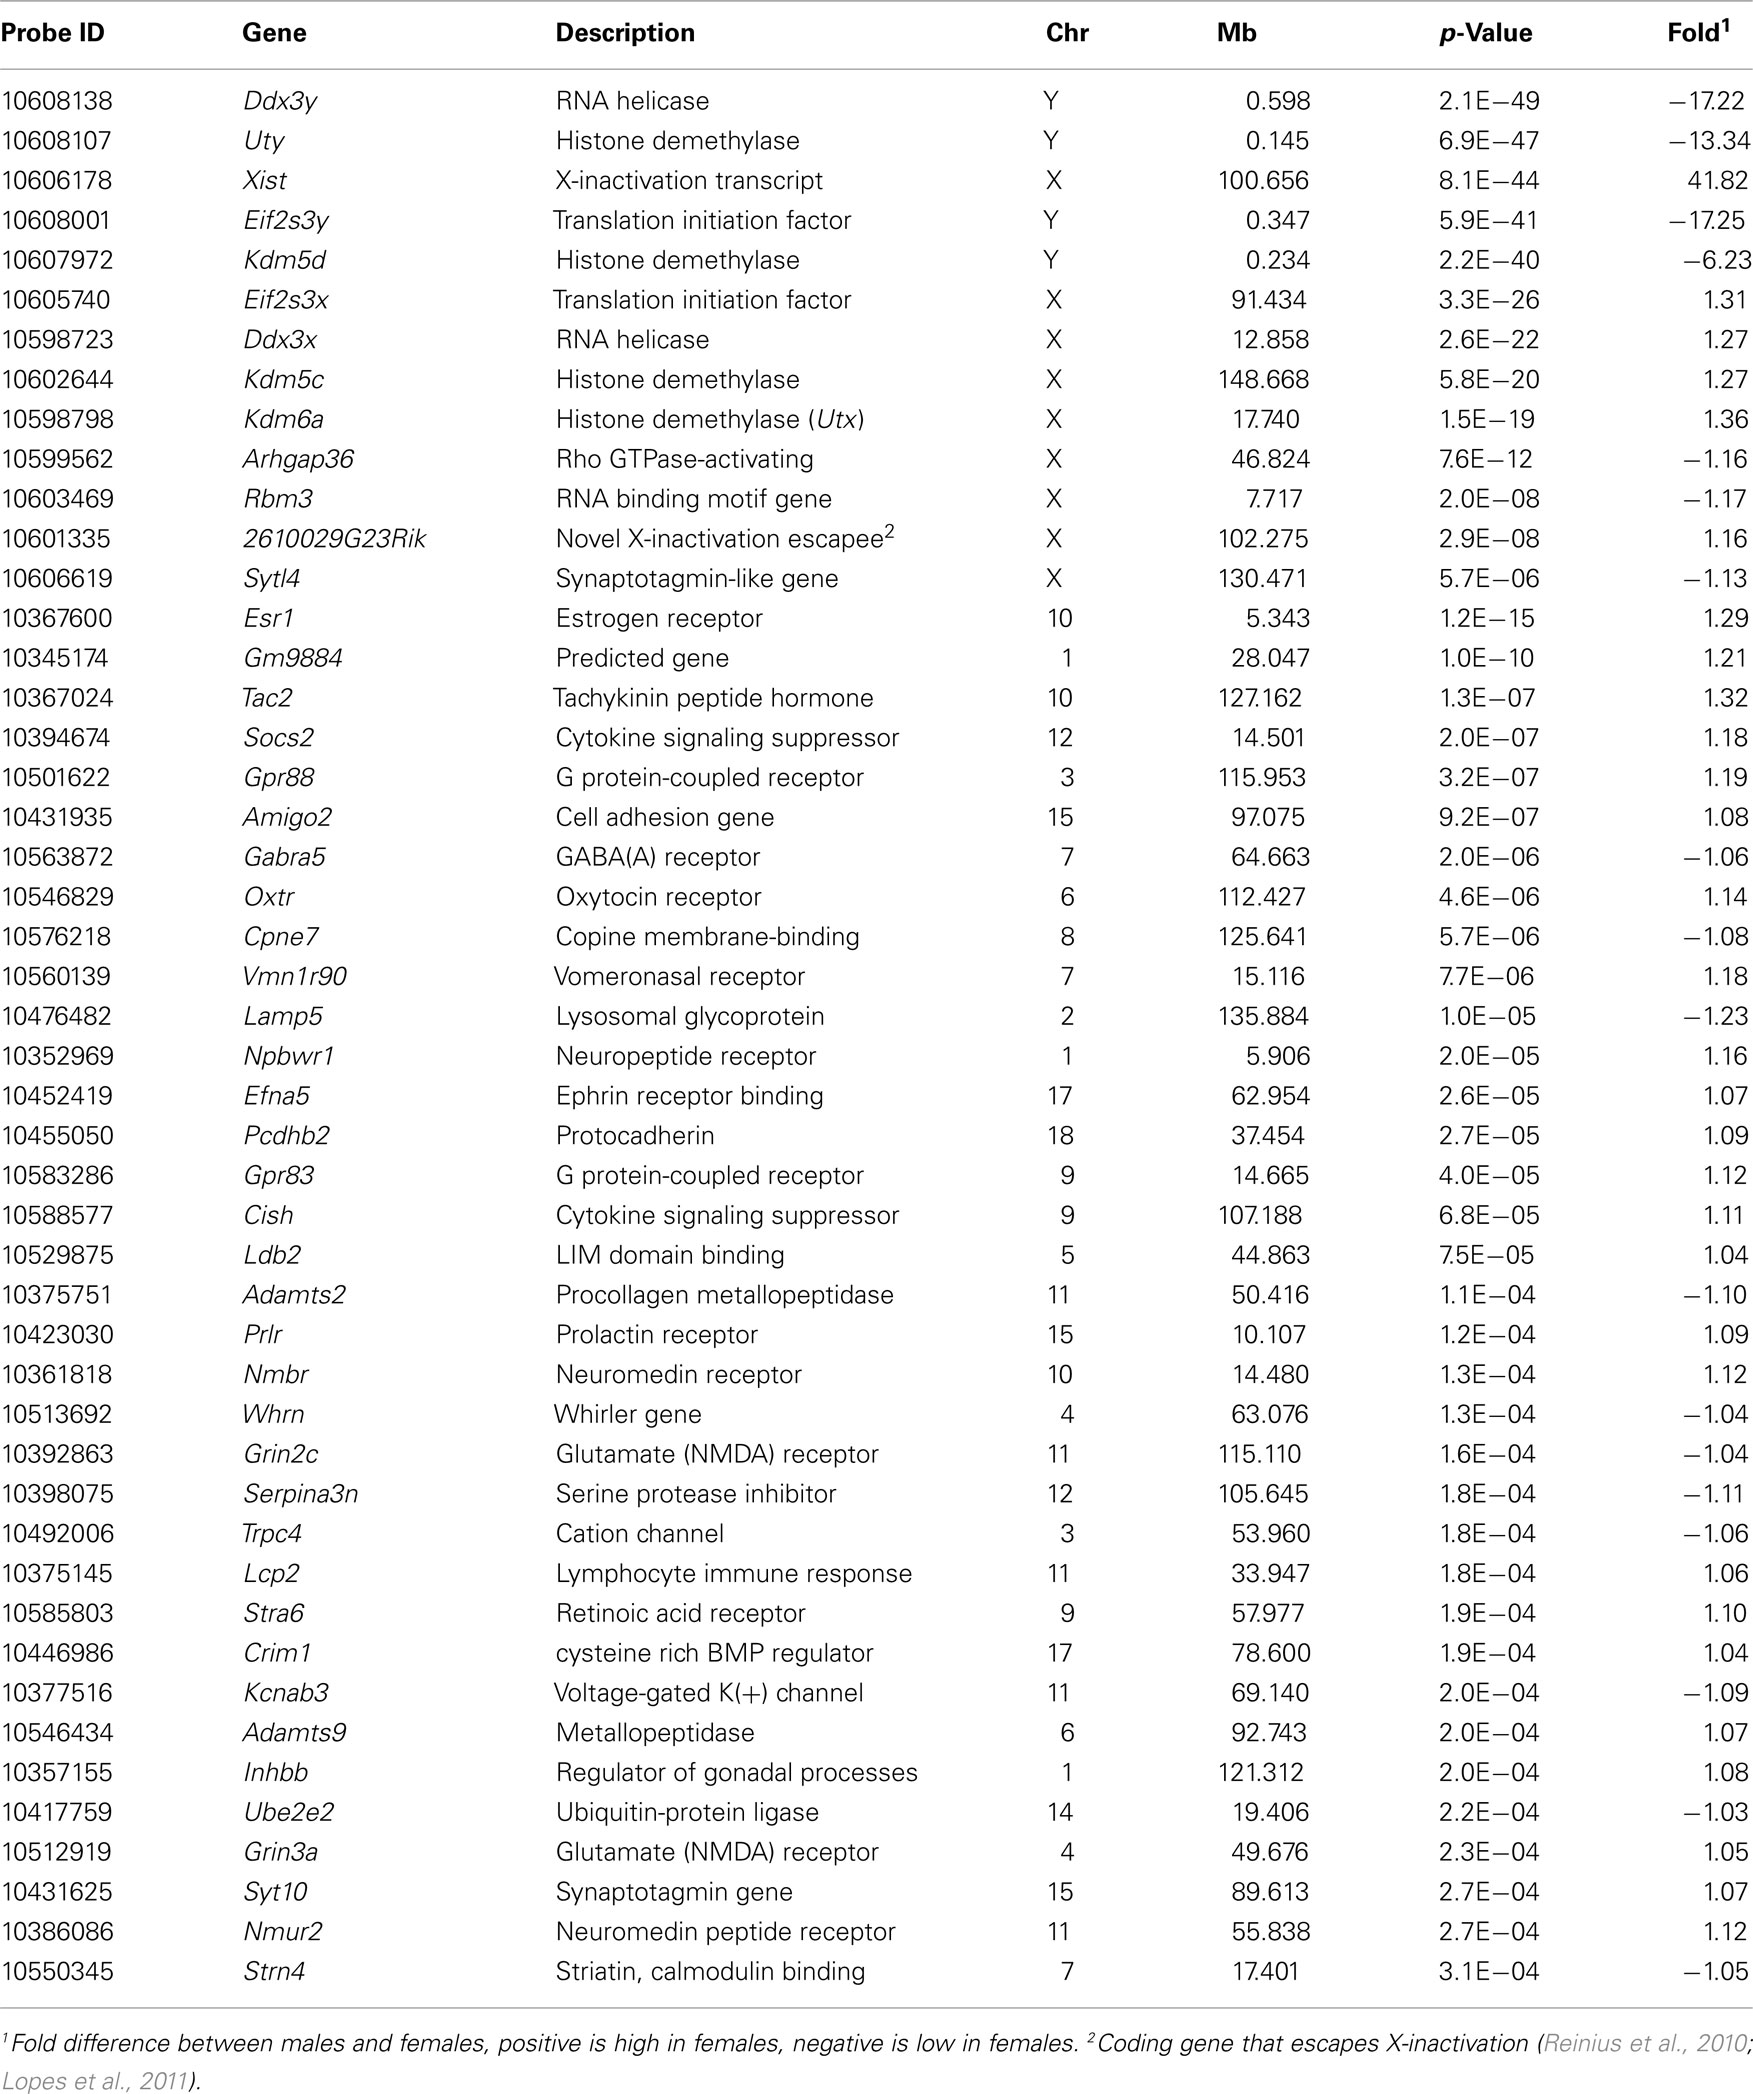
Table 1. Transcripts with differential expression (FDR of 0.10) between males and females in the hypothalamus.
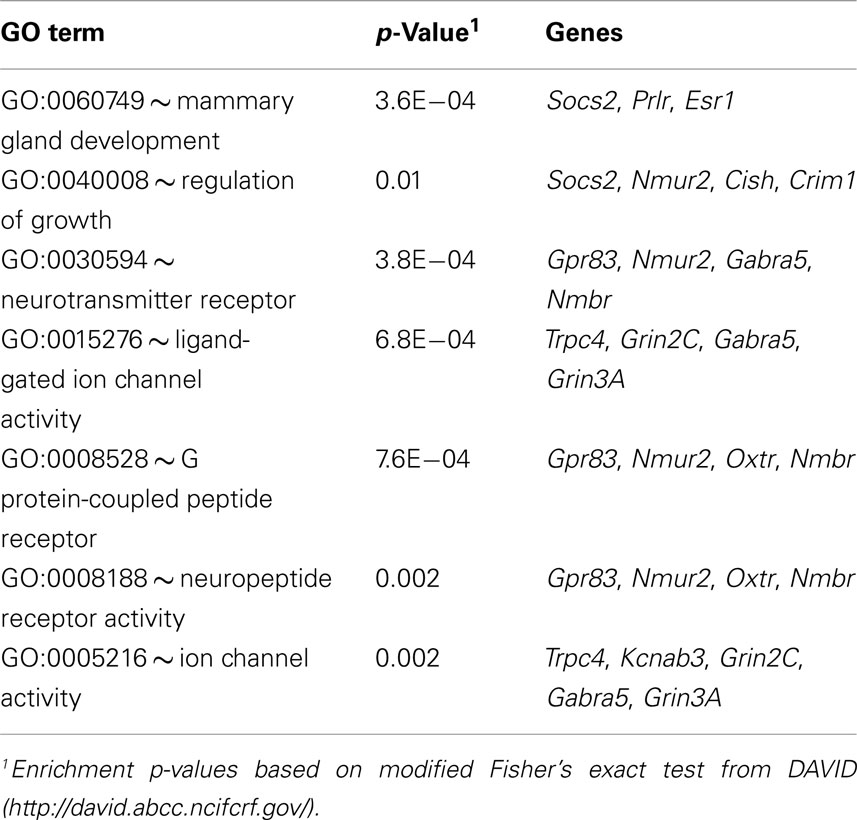
Table 2. Enriched gene functions among autosomal transcripts with sex differences in the hypothalamus.
We selected six transcripts with expression difference ranging from 17-fold to 10% for quantitative RT-PCR. These transcripts are male high Ddx3y and Adamts2, and female high Tac2, Esr1, Oxtr, and Nmur2. The quantitative PCR confirmed the male exclusive expression of Ddx3y and the female biased expression of Esr1 (∼60% higher expression in females) and Nmur2 (∼50% higher expression in females; Figure A1 in Appendix). And while the expression difference did not reach statistical significance, the PCR analysis also showed higher female expression of Oxtr by about 20% and higher male expression of Adamts2 by 7%. The failure to reach statistical significance is likely due to the low power provided by the small sample size for RT-PCR (four male and four female samples). The only gene that showed no sex difference in the PCR analysis was Tac2.
Discrete Expression of Sexually Divergent Transcripts in the Hypothalamus
We examined patterns of in situ expression for transcripts that have sex-skewed expression using the Allen Brain Atlas. Several of the genes have highly localized expression in areas that are also sexually dimorphic by morphological or functional criteria (Lenz and McCarthy, 2010; Majdic and Tobet, 2011). For example, Tac2, Esr1, and Efna5 have intense expression in the medial preoptic nucleus and arcuate nucleus whereas Amigo2, Gabra5, and Cpne7 have intense expression in the ventromedial hypothalamus (see Figure 1). These expression differences likely contribute to the sex-specificity of these areas in the hypothalamus.
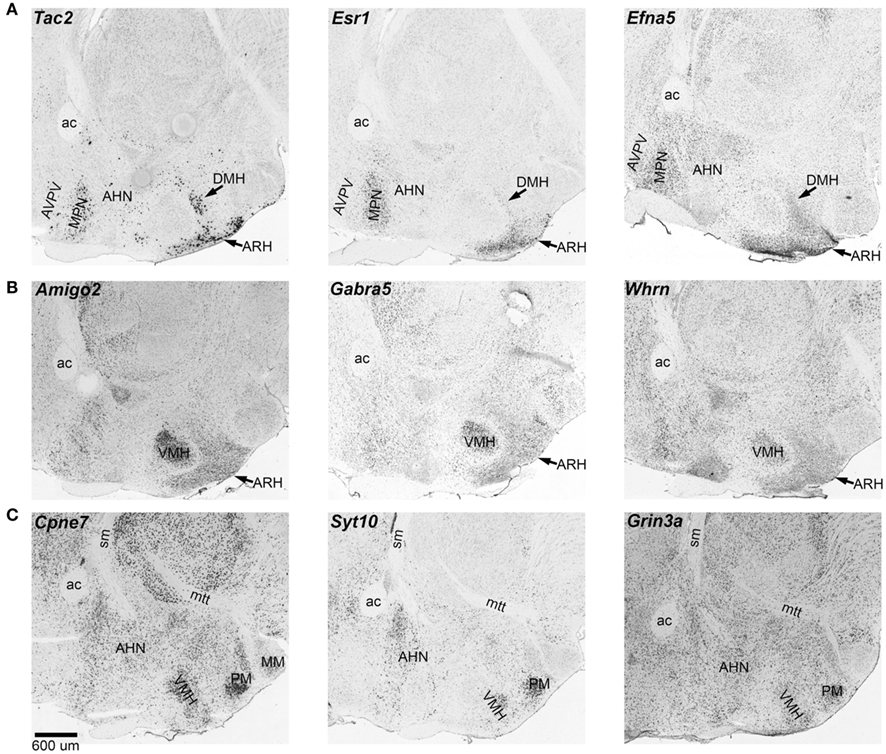
Figure 1. Expression of sexually dimorphic transcripts in the hypothalamus. Several transcripts with sex differences in the hypothalamus are characterized by localized expression in sexually dimorphic areas. These images show in situ expression in sagittal sections. (A) Tac2, Esr1, and Efna5 have intense expression in the medial preoptic areas and the arcuate nucleus. (B) Amigo2, Gabra5, and Whrn have more localized expression in the ventromedial hypothalamus. (C) Cpne7, Syt10, and Grin3a have relatively more intense expression in the ventromedial hypothalamus, the anterior hypothalamus, and the mammillary areas. ac, anterior commissure; AHN, anterior hypothalamic nucleus; ARH, arcuate hypothalamic nucleus; AVPV, anteroventral periventricular nucleus; DMH, dorsomedial hypothalamus; MM, medial mammillary nucleus; MPN, medial preoptic nucleus; mtt, mammillothalamic tract; sm, stria medullaris; PM, premammillary nucleus; VMH, ventromedial hypothalamus. In situ data from Allen Brain Atlas
Comparison of Coexpression Networks in Females and Males
Coexpression modules defined by WGCNA link transcripts by expression similarity and topological overlap (Zhang and Horvath, 2005). Overall, transcripts in the hypothalamus group into 12 modules in females and 14 modules in males. These range in size from 35 to over 2,000 members. The sexually dimorphic transcripts are dispersed and no single module is particularly enriched for sex-differentiated transcripts. Transcripts that show low coexpression and fail to cluster in a specific module are relegated to modules labeled F0 in females and M0 in males (full list of transcripts and modules, module membership scores, and sex difference p-values are provided in Supplementary Material S2).
Comparison of female and male modules showed high degree of network concordance and sets of transcripts that cluster together in females also tend to cluster together in males (Figures 2A,B). As a result, most of the modules identified in females have corresponding modules in males that share 60–80% overlap in transcript members (Figure 2C). These are associated with highly significant Fisher’s exact p-values (Figure 2D). The preserved modules are also characterized by very similar enrichment in gene functions in males and females (Supplementary Material S3).
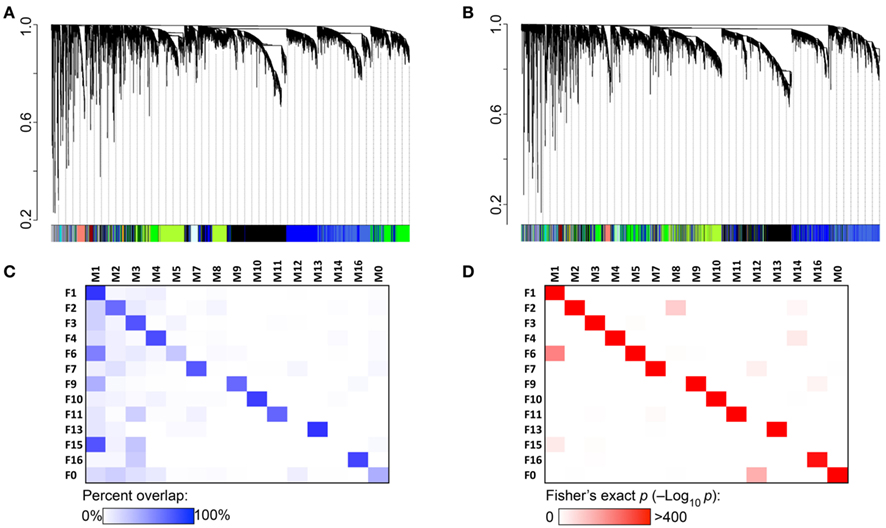
Figure 2. Coexpression network concordance between females and males. (A) Each branch of the dendrogram represents hierarchical clustering of coexpressed transcripts in the female hypothalamus. Modules identified by this method are assigned color IDs shown at the bottom of the graph. (B) Male coexpression networks were independently constructed. To evaluate the level of network concordance, a transcript in the male network was identified by the color assignment in females. This shows that transcripts that cluster together in females generally cluster together in males. (C) There is 60–80% overlap between female and corresponding male modules. Corresponding modules are designated by the same label number, e.g., F1, F2 in females (row labels), and M1, M2 in males (column labels). Transcripts that do not fall into any coexpressed module are categorized to F0 and M0. (D) Significance level of network preservation is provided by the Fisher’s exact test (−log10 p).
Two female modules that lack direct correspondence with male modules are F6 and F15. The 790 transcripts in F6 are divided between two male modules – M1 and M5. In the case of F15, 23 of the 34 transcripts are in the M1 module and F15 is more appropriately a subset of M1 rather than a female-specific network. Similarly in males, modules M8 and M14 are subsets of larger female modules. Sixty-three of the 123 transcripts in M8 are in F2, and the 44 transcripts in M14 are divided between F2 and F4. Only the M12 module appears to be male specific as most transcripts in this network (22 out of 49) are classified to F0 in females.
Large-Scale Functional Organization of Gene Networks
The expression of multiple transcripts in a module was summarized by the first principal component (PC1; Supplementary Material S2). The PC1 eigenvalues for the modules, referred to as the module eigengenes (MEs), were used to generate pairwise adjacency matrix. This represents the meta-network of module connectivities in each sex (Figures 3A,B). This visualization of inter-module associations identified positively correlated as well as inversely correlated modules. The global view also revealed functional organization among the gene networks that depicts a balance between cellular processes that regulate gene expression (Figures 3C,D). The two largest modules are F1 and F2 in females and M1 and M2 in males. F1/M1 is enriched in transcriptional and translation genes and is the most well connected module in both sexes. The ME of this presumably influential hub module is positively correlated with the MEs of F3/M3 and F9/M9, which are enriched in neural and physiological functions (Figures 3C,D). In marked contrast to the positive correlation between the pro-transcriptional and F3/M3 and F9/M9 modules, F1/M1 is inversely correlated with the MEs of F2/M2 and F4/M4. The F2/M2 and F4/M4 modules are enriched in nucleosome assembly and DNA packaging genes such as Hist1h2bb, Hist1h2aa, and Hist4h4. These histone genes are involved in chromatin remodeling and in the regulation of transcriptional gene inactivation. Overall, the analysis shows that the functional organization of coexpressed transcripts is highly preserved in males and females.
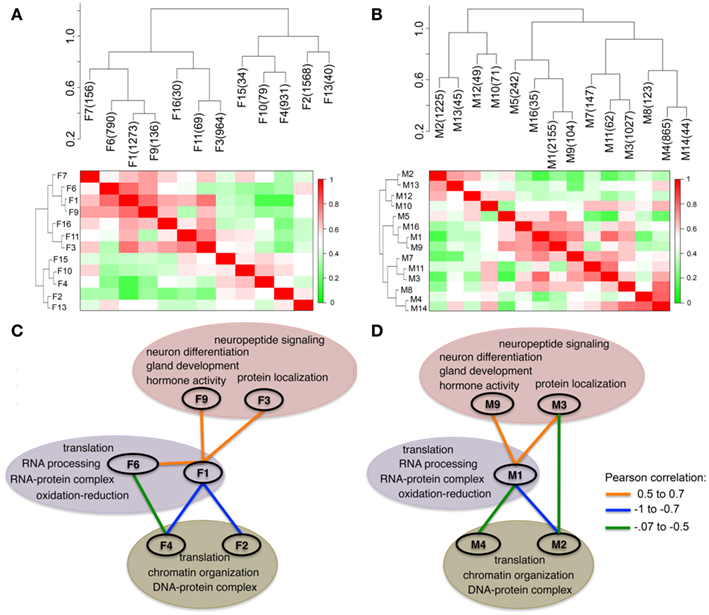
Figure 3. Functional organization of modules in the hypothalamus. Each module is summarized by the first principal component, referred to as the module eigengene (ME). The dendrograms and heat maps show the adjacency plots that relate the MEs in females (A) and in males (B). There are positively correlated (red), and inversely correlated (green) modules. Module labels and module sizes are shown. Highly connected modules in females (C) and males (D) were organized by enriched gene functions. Functional organization of transcripts is very similar between sexes. Enriched gene functions that characterize the modules are highlighted. There is inverse association between networks enriched for transcription, translation, and energy metabolism (F1/M1 and F6 in purple bubble) and networks enriched for DNA packaging (F2/M2 and F4/M4 green bubble). In both males and females, modules enriched in hypothalamus related functions (F3/M3, F9/M9 in pink bubble) are positively correlated with M1 and F1. The colored lines connecting the modules show the Pearson product correlations between the MEs.
Sex-Specific Networks for Chr X and Y Paralogs – Kdm6a and Uty
While the global architecture is well preserved between the sexes, there are sex-specific differences in finer network structure. This is particularly evident for some of the sexually divergent genes on the sex Chrs. In females, the X-linked transcripts, Kdm6a (or Utx) and Xist (X inactive-specific transcript), are both members of the F2 module. In males, Xist is assigned to M0 and Kdm6a is in M4. In place of Kdm6a, the Y-linked paralog, Uty (ubiquitously transcribed tetratricopeptide repeat gene, Y Chr), forms a highly connected hub in the M2 module along with another Y-linked transcript Kdm5d. In females, both Uty and Kdm5d are in F0.
To examine transcripts that are closely associate with Uty and the female paralog, Kdm6a, we extracted a sub-network centered around Uty from M2 and a sub-network centered around Kdm6a from F2 (Figures 4A,B). The connections between Uty/Kdm6a and the other transcripts are based on genetic correlations across the BXDs and Figure 4 highlights the top 15 covariates. Both Uty and Kdm6a are positively correlated with Thoc2 (RNA processing THO complex 2), Xrn1 (5′-3′ exoribonuclease 1), and Rbm26 (RNA binding motif protein 26). This shows that in males, Uty replaces Kdm6a in a module that is generally well preserved between the sexes. Additionally, Uty is negatively correlated with histone transcripts Hist1h3g (Figure 5A) and Hist1h1b and positively correlated with the chromatin modification transcript Kdm5d (Figure 5B). This indicates a function for Uty in histone processing and chromatin modification that is homologous to that of Kdm6a.
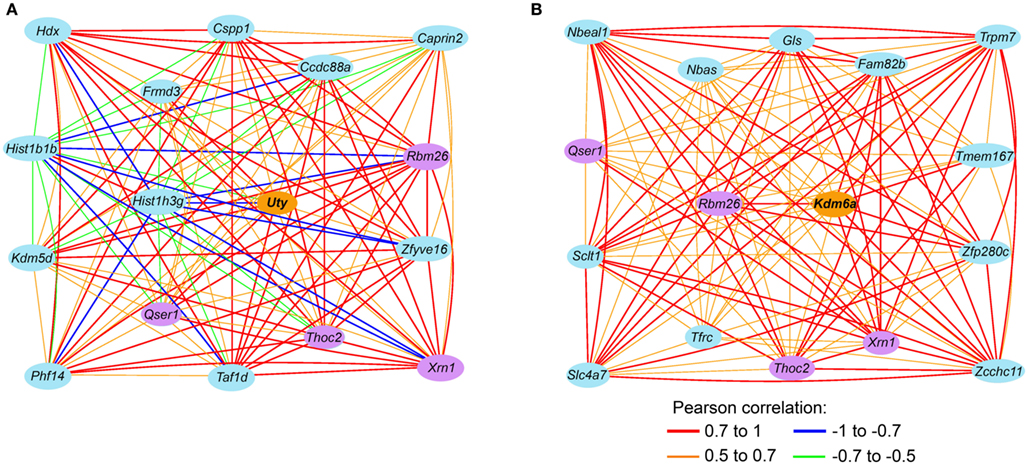
Figure 4. Sex-specificity in Uty and Kdm6a (Utx) sub-networks. (A) This gene network is a subset of the M2 module in males and shows the top15 covariates of Uty (lines code the Pearson product correlations between transcripts). In females, Uty had poor coexpression and is relegated to F0. (B) In the corresponding female module, the position of Uty is replaced by the female paralog Kdm6a. The sub-network of F2 shows the top 15 covariates of Kdm6a. Transcripts correlated with both Uty and Kdm6a are highlighted by purple ovals.
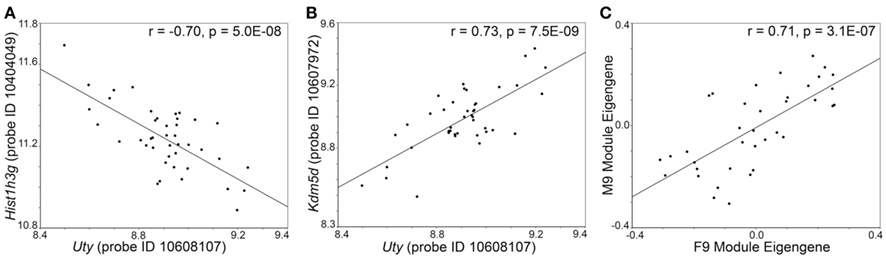
Figure 5. Genetic correlation between transcripts and modules. In the male hypothalamus, expression of Uty is negatively correlated with the histone transcript Hist1h3g(A) and positively correlated with the histone modification transcript Kdm5d (B). This is a male specific correlation between transcripts. (C) The F9 module in females and M9 module in males have high network preservation. The scatter plot shows the correlation between the eigengenes for F9 and M9. The genetic covariance of transcript in F9 and M9 is independent of sex.
Focus on a Module Related to Hypothalamic Functions
F3 and F9 in females and M3 and M9 in males are enriched in transcripts related to hormone activity and neuropeptide signaling (Figures 3C,D). F3/M3 is relatively large (964/1,027 transcript members) and has a broad enrichment profile, including the GO terms: protein localization, RNA processing, and translation. F9/M9 is relatively small (136/104 transcript members) and is more specifically enriched in transcripts related to neuronal functions, gland development, and neuropeptide signaling. Examples of enriched GO categories in F9 and M9 are provided in Table 3 (full lists of enriched gene functions for the modules are in Supplementary Material S3). We consider F9/M9 as the module most related to hypothalamic functions and the endocrine system.
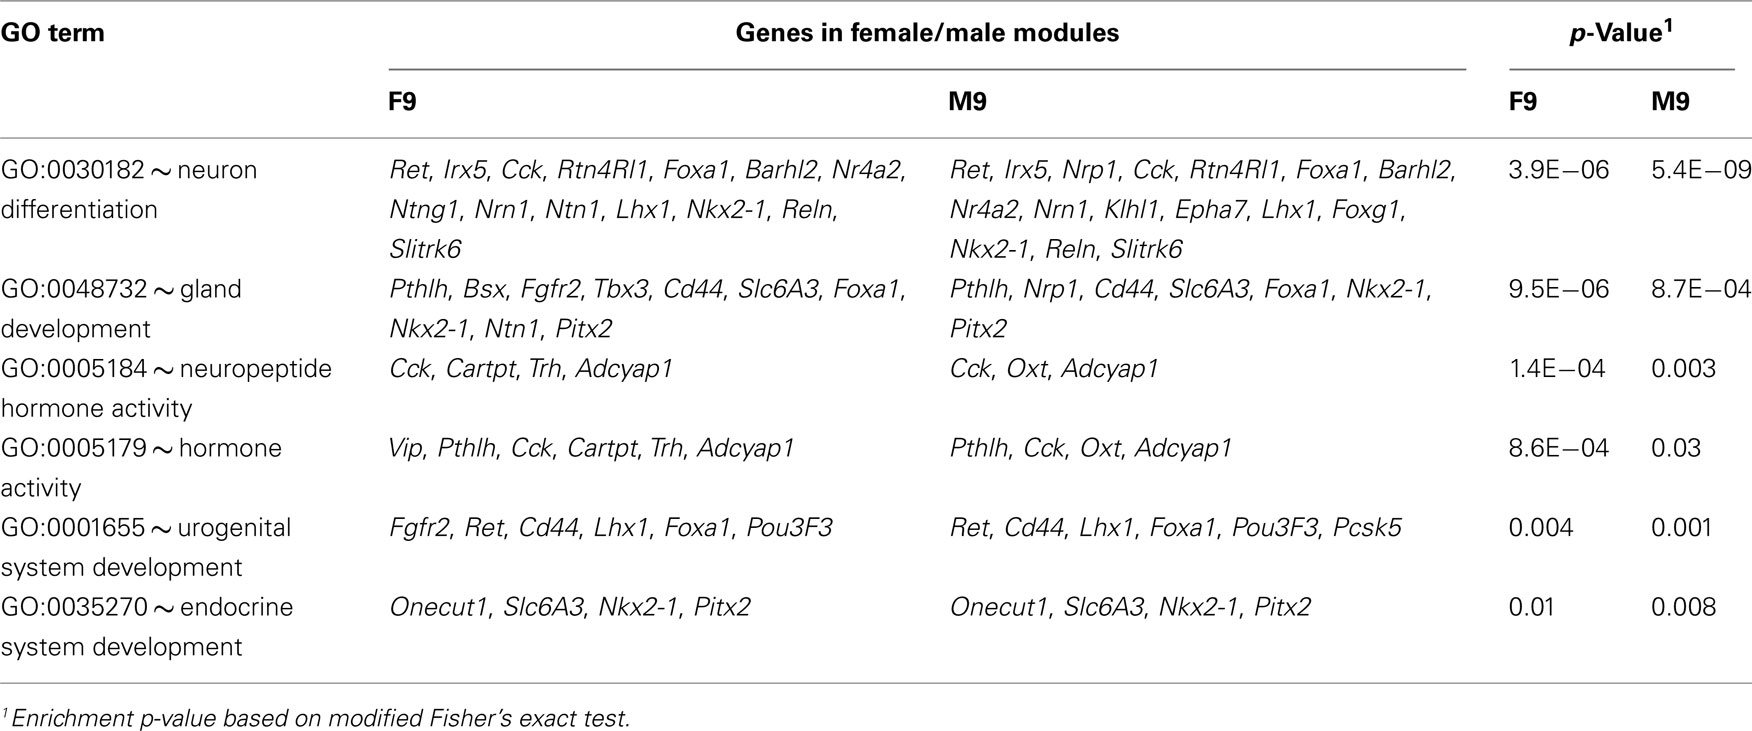
Table 3. Concordant enriched gene functions in the female F9 and male M9 modules.
There is extensive overlap between the female and male modules, and 81 out of the 104 transcripts in M9 are also in F9. There is significant correlation between the MEs of F9 and M9 across the BXDs, which indicates similar expression variation in males and females (Figure 5C). We selected the top 30 transcripts with the highest module membership scores in F9 and M9 for more extensive in situ analysis. These are transcripts that have the strongest correlations with the MEs for F9 and M9. Analysis of in situ labeling in the hypothalamus showed that transcripts in F9/M9 generally have more intense expression in the posterior hypothalamic nucleus and in the mammillary areas than other hypothalamic regions (three examples provided in Figure 6). F9/M9 therefore represents a functionally cohesive network of tightly correlated transcripts that is preserved between the sexes and that has co-localized expression in the hypothalamus.
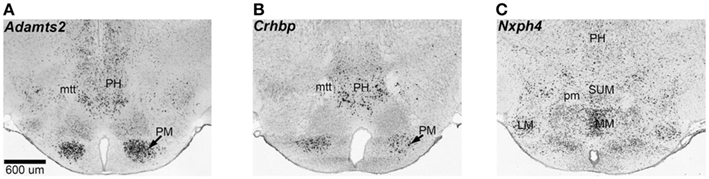
Figure 6. Spatial coexpression of transcripts in the F9/M9 network. The F9 and M9 modules represent a network of transcripts that have high genetic covariance independent of sex, and spatial coexpression in the hypothalamus. The coronal sections show in situ patterns for three members of F9 and M9: Adamts2(A), Crhbp (B), and Nxph4 (C). These transcripts have high expression in the mammillary areas and the posterior hypothalamus. Adamts2 and Crhbp have pronounced expression in the premammillary and posterior hypothalamic nuclei and Nxph4 has relatively intense expression in the lateral and medial mammillary areas. Several other members of F9/M9 show similar expression patterns. LM, lateral mammillary nucleus; MM, medial mammillary nucleus; mtt, mammillothalamic tract; PH, posterior hypothalamus; pm, principal mammillary tract; PM, premammillary nucleus; SUM, superior mammillary nucleus. In situ data from Allen Brain Atlas.
Sex-Specific Genetic Regulation of Transcripts
We used the top 30 transcripts with high module memberships in M9 and F9 to evaluate whether transcripts with concordant coexpression in males and females also share similar genetic regulation. This analysis revealed significant sex-specificity in eQTLs associated with the transcripts. Genetic loci that have trans-regulatory associations with multiple transcripts (trans-QTL hotspots) are detected on Chrs 5, 6, 10, and 12 in females and Chrs 2, 3, 11, and 19 in males (Figure 7A; genome-wide QTL heat map in Figure A2 in Appendix). There is also a potentially shared eQTL on Chr 8 that may be common to both sexes. We specifically examine the eQTL hotspots on Chrs 10 and 11 because cognate genes of transcripts in F9/M9 are located in these eQTLs. In the female-specific eQTL on Chr 10 is Nxph4 (neurexophilin 4), and in the male specific eQTL on Chr 11 is Adamts2 (ADAM metallopeptidase with thrombospondin 2). Both Nxph4 and Adamts2 have high module memberships in F9 and M9.
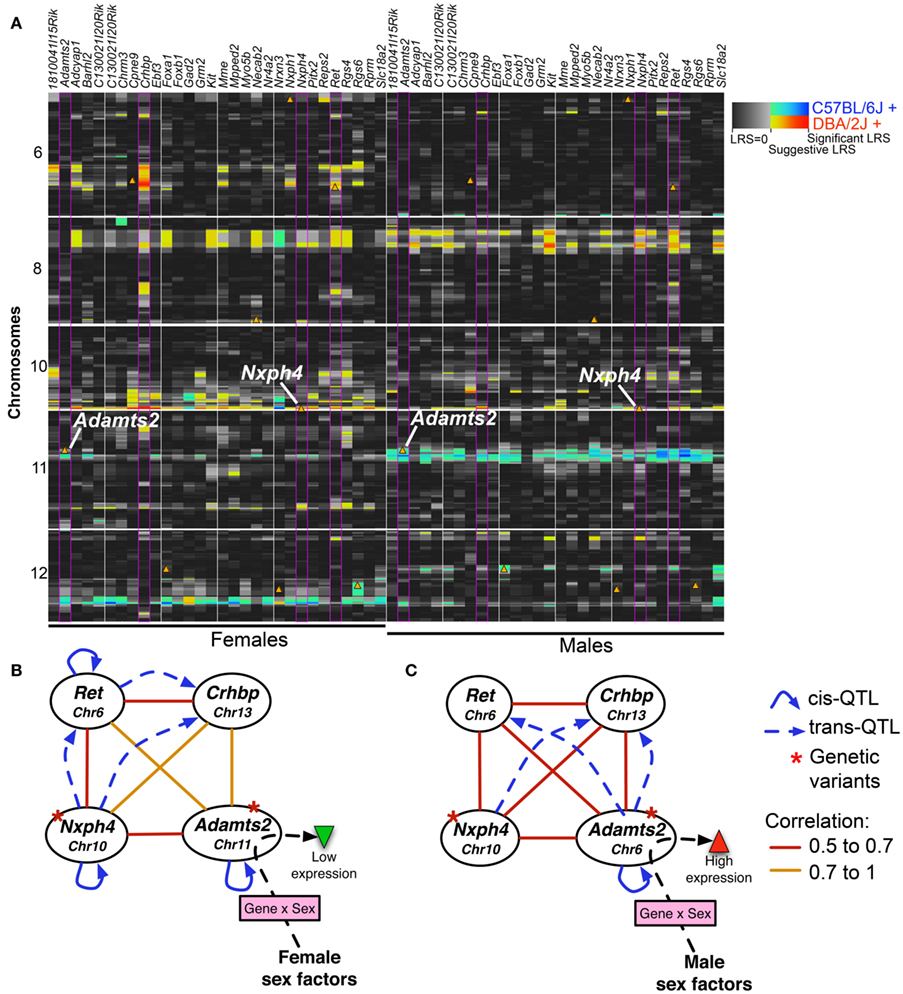
Figure 7. Sex-specific eQTLs for coexpressed transcripts. (A) 30 transcripts in modules F9 and M9 with the highest connectivity scores were used for eQTL mapping. To provide a side-by-side comparison of eQTLs in females (left) and males (right), LRS are displayed as a heat map. Each column represents a transcript (gene names are shown above). Only chromosomes 6, 8, 10, and 12 are shown (full image for the entire genome is available as supplemental). The color intensity encodes the linkage strength and the parental allele effect. Locations of cognate genes are shown by triangles. Four transcripts (highlighted by purple borders in heat map) were used to illustrate a potential model of gene expression regulation in females (B) and males (C). The four transcripts form a consistent coexpression network in both sexes. However, depending on sex effect, the focal eQTL with trans-effect on Ret and Crhbp shifts from Nxph4 in females to Adamts2 in males. This depicts Adamts2, which has higher expression in males, as a point of sex-by-gene interaction. Solid arrows represent cis-QTLs and dashed arrows represent trans-QTLs; straight lines show Pearson product correlations.
Nxph4 is cis-regulated and maps close to the parent gene (i.e., a cis-QTL). This cis-effect is however specific to females (genome-wide QTL maps in Figure A3 in Appendix). Nxph4 also has a missense mutation (Thr60Met) that segregates in the BXDs. Because of this underlying genetic variation and its membership in the module, we nominate Nxph4 as a candidate for the eQTL on Chr 10. Similarly, Adamts2 is cis-regulated and maps to the eQTL on mid-Chr 11. Although the cis-QTL for Adamts2 is detected in males and females, the cis-effect is stronger in males (Figure A4 in Appendix). Additionally, Adamts2 is differentially expressed and shows ∼10% higher expression in the male hypothalamus (Table 1). For these reasons, we nominate Adamts2 as a male-biased candidate in the Chr 11 eQTL.
To illustrate the potential regulatory network underlying the sex-specificity in eQTLs, we use trans-regulated members of M9/F9, Ret and Crhbp, as examples. Nxph4, Adamts2, Ret, and Crhbp form a correlated network in both females and males. In females, the Crhbp and Ret transcripts are modulated by the QTL near Nxph4 (Figure 7B). Additionally, Ret has a female-specific cis-QTL and may also modulate the expression of Crhbp in females. In contrast, the effect of Adamts2 on this network is stronger in males, and both Ret and Crhbp have higher associations with the eQTL near Adamts2 (Figure 7C). In this model the focal regulatory locus linked to the transcript network is shifted from Nxph4 in females to Adamts2 in males. This may be due to interactions with sex-specific factors that result in the higher expression of Adamts2 in males. While the correlation network is intact in both sexes, this shift may result in the sex-specificity of eQTLs that modulate the network.
Discussion
In this study we analyzed the molecular basis of sex differences by comparing transcript abundance and expression networks in the male and female hypothalamus. The major points are: (1) there are sex-specific expression signatures in the hypothalamus that are consistent with the role of this brain region in the regulation of reproduction and modulation of the neuroendocrine system; (2) sexually divergent transcripts tend to have high expression in sexually dimorphic structures such as the preoptic area and arcuate nucleus; (3) transcriptional networks are, with few exceptions, highly preserved in both males and females, and transcripts are organized into functionally matched modules regardless of sex; (4) sex differences are detected at the small-scale network architecture and there is also sex-specific genetic regulation of transcript modules. The data sets we have generated are publicly available from www.genenetwork.org and the module assignment and connectivity scores and MEs are all provided as Supplementary Material.
How the Hypothalamus Compares to Other Brain Regions
Sex linked transcripts such as Xist and Uty show consistent expression differences between males and females that are largely independent of tissue or brain region (Yang et al., 2006; van Nas et al., 2009; Reinius et al., 2010). These transcripts serve as reliable markers of sex-specific expression and in the hypothalamus, there is significant male bias for the Y Chr transcripts – Ddx3y, Uty, Kdm5d and Eif2s3y – and female bias for the X Chr transcripts – Xist, Ddx3x, Kdm6a or Utx, Eif2s3x, and 2610029G23Rik. In contrast to the genes that are located on Chrs X and Y, the effect of sex on autosomal transcripts is highly dependent on tissue and organ. Even within the brain, there is remarkable level of spatial specificity in transcripts that are modulated by sex (Reinius et al., 2010).
Given the functional profile of the hypothalamus, is gene expression in this part more sexually divergent than in other parts of the brain? In this study, we compared expression in 39 male and 39 female inbred lines using the Affymetrix Mouse Gene 1.0 ST arrays. The estrus cycle of the female mice was not factored in the analysis. However, our design provides high power (beta of 0.9) to detect ∼10% expression difference between the sexes at a significance level of 0.001. Compared to a similarly powered analysis in the BXDs (Reinius et al., 2010), the hypothalamus does appear to be more sex sensitive than other brain areas. For example, at a stringent FDR of 0.05, the hypothalamus has 29 sex-biased transcripts compared to 12 in the hippocampus (assayed on the Affymetrix M430v2 arrays), and 19 in the neocortex (assayed on the Illumina Mouse-6v1.1 arrays). This is not a dramatic difference but does suggests a higher level of sex-specificity in the hypothalamus.
Surprisingly, based on findings by Reinius et al. (2010), the striatum is still by far the most sexually dimorphic in gene expression. At comparable statistical criteria, the striatum, which was assayed on the Illumina Mouse-6v1.1 arrays, has over 170 sexually divergent transcripts. An important point to note is the difference in array platforms that makes this an imperfect comparison. Nevertheless, if the number of differentially expressed genes is used as the main index, then the striatum is apparently more primed to the influence of sex than the hypothalamus. However, there is an important difference in the functional categories that are modulated by sex in the two brain regions that emphasizes the direct role of the hypothalamus in reproductive functions. In the striatum, the transcripts that show expression difference are mostly enriched in genes involved in neuron differentiation and neuronal signaling (Reinius et al., 2010). While these genes lack obvious and direct connections to sex-related functions, their differential expression in males and females may contribute to gender differences in behavior that have been attributed to striatal functions, e.g., addiction, motivation, and drug response (Becker, 1999; Becker and Hu, 2008). In the hypothalamus, the differentially expressed transcripts include steroid hormone and neuropeptide receptors (Esr1, Oxtr, Prlr), and genes involved in gland development and sex hormone regulation (Socs2, Tac2). These transcripts uniquely cater to the role of the hypothalamus as the mediator of neural and hormonal interactions in reproductive processes. Expression differences of these transcripts likely have more direct impact on reproductive functions and sex-related physiology and behavior.
Network Concordance between the Sexes
The brain transcriptome is organized into modules representing groups of correlated and functionally related genes (Oldham et al., 2006, 2008; Winden et al., 2009). In the hypothalamus, most male modules overlap significantly with corresponding female modules. In agreement with previous findings (van Nas et al., 2009), coexpression networks are highly preserved between the sexes. We did detect a few networks that could be considered sex-specific. On closer inspection, we found that these putative sex-specific networks were either subsets within larger networks or were represented in two separate networks in the other sex. Only one module in males, M12, has low preservation in females and the network members were mostly assigned to the female F0 module.
While modules are largely intact in both males and females, there may be sex differences in the fine-scale architecture and in the identity of central hub genes. We found this to be the case for the M2/F2 module, which is enriched in transcripts involved in chromatin remodeling and gene silencing. In males, the Y Chr gene, Uty, is a highly connected member of M2. In females, Uty does not group into any defined network and instead, the position of Uty is replaced by its paralog on Chr X – Kdm6a. To date, the function of Uty has not been clearly established, although its sequence similarity with Kdm6a implies a role in histone demethylation and gene activation (Hong et al., 2007; Xu et al., 2008). The observations that Uty occupies a central position in M2 and is a key member of a module related to nucleosome assembly and DNA packaging, and that Uty expression correlates with other histone modification genes, suggest overlapping functions between Uty and Kdm6a.
Discrete Expression in Hypothalamic Nuclei
For this study we relied on hand dissections of the hypothalamus carried out across a relatively large cohort of genetically defined and diverse strains of mice. An alternative would have been to dissect the hypothalamus into smaller regions and this may have yielded more robust sex effects. However, the approach we adopted is a broad, systems-level profiling of the whole hypothalamus rather than a detailed analysis of a restricted area or a specific cell type. The coexpression networks were therefore based on transcript connectivity across different genotypes, cell types, and hypothalamic regions. These are genetic covariance networks that are defined by expression correlations across the BXD strains. While this approach does not provide the specificity of a single cell analysis, it does provide meaningful overview of functionally relevant gene networks that operate on a larger scale. This is particularly informative since no single cell in the brain works in isolation, but rather, engages in complex cellular networks.
Despite the low spatial resolution, the coexpression analysis was able to discern some level of regional specificity. For example, several transcripts with high module membership in F9/M9 show localized expression in the posterior hypothalamic nucleus and mammillary areas. This means that, to an extent, the genetically correlated set of transcripts also shares some level of spatial coexpression within the hypothalamus. This suggests that the variation captured by the F9/M9 module should be reflected by corresponding strain differences in structure and function of the posterior hypothalamic areas – a prediction that could be tested efficiently in selected subsets of BXD strains.
Expression of Sexually Divergent Transcripts
Spatial specificity is also seen for several of the sex-differentiated autosomal transcripts. This set of transcripts tends to have more intense expression in regions such as the medial preoptic area, arcuate nucleus, and ventromedial hypothalamus. These hypothalamic areas have enriched expression in steroid and peptide hormone receptors and play important roles in the regulation of the endocrine system and in the expression of sex-related behavior (Simerly, 1998; Lenz and McCarthy, 2010; Majdic and Tobet, 2011). Consistent with this, two of the autosomal transcripts with the most significant expression difference between males and females – Esr1 and Tac2 – have direct roles in gonadal hormone regulation. The estrogen receptor-α, encoded by Esr1, functions as a nuclear transcription factor and has been implicated in the regulation of sexually divergent gene expression that is conserved across species (Reinius et al., 2008). Tac2 encodes the neuromodulatory peptide neurokinin B that is a crucial component of the hypothalamo-pituitary-gonadal axis and implicated in the regulation of reproduction (Rance et al., 2010; Lasaga and Debeljuk, 2011; Navarro et al., 2012).
According to the array data, both Esr1 and Tac2 have ∼30% higher expression in females and the in situ shows that both are localized to the medial preoptic area and arcuate nucleus. Quantitative RT-PCR confirmed a significantly higher expression of Esr1 in the female hypothalamus compared to males. However the PCR analysis found no difference in the level of Tac2 between males and females. Tac2 plays a role in regulation of reproductive hormones (Rance et al., 2010; Lasaga and Debeljuk, 2011; Navarro et al., 2012), and it is likely that the expression of this gene varies according to the estrus cycle in females. We did not account for the estrus cycle in either the array or RT-PCR analysis and this may have contributed to the results. In the case of the array data, female samples were collected from over 70 mice at different phases of the estrus cycle. In contrast, samples for the RT-PCR were collected from only eight males and eight females. The array data may have captured a sex difference in Tac2 that was related to the estrus cycle but not detectable in the smaller cohort used for RT-PCR.
Modulation of Networks by Sex-Specific Regulatory Loci
It is intriguing that while the covariance structure is very similar between males and females, the regulatory loci associated with the transcripts are very distinct. For the highly correlated members of M9/F9, we found only one potentially shared trans-QTL hotspot on Chr 8 and a number of sex-specific QTLs distributed across the genome. Studies in other tissues have also yielded similar results that indicate that sex-specificity is a general feature of transcript regulation (Yang et al., 2006; Wang et al., 2007; Bhasin et al., 2008; van Nas et al., 2009). In fact, differences in the regulation of gene expression has been proposed as a mechanism by which variants in the genome exert a sex-specific effect on a number of phenotypes and diseases (Ober et al., 2008).
In general, loci with cis-acting regulation are more concordant between the sexes than loci with trans-acting regulation (Bhasin et al., 2008). Type 1 error is a possible reason for the low preservation of trans-QTLs (Bhasin et al., 2008; Ober et al., 2008) and may indeed account for several of the trans-QTLs in the hypothalamus. However, the two sex-specific eQTLs on Chrs 10 and 11 are supported by other lines of evidence. First, both loci contain genes that are highly connected members of M9/F9 – Nxph4 in the female-specific Chr 10 eQTL and Adamts2 in the male-specific Chr 11 eQTL. Second, both of these genes are cis-regulated and therefore reasonable candidates. Finally, the expression patterns of Adamts2 and Nxph4 in the hypothalamus are similar to those of their putative targets in F9/M9.
Adamts2 encodes a procollagen N-proteinase, and deletion of this gene results in male infertility, suggesting a role for Adamts2 in reproductive functions (Li et al., 2001). In the array data, we found ∼10% higher expression in males compared to females. The RT-PCR also showed ∼7% higher expression of Adamts2 in males, although the modest difference did not reach statistical significance. The eQTL hotspot and the higher expression in males indicate that Adamts2 is a potential locus of interaction between genetic and sex-specific factors. Its expression difference between males and females may contribute to the sex-specificity of eQTLs associated with F9/M9 transcripts.
In summary, we show that while sex has a significant effect on individual transcripts, global coexpression networks in the hypothalamus are well matched and highly preserved between males and females. These tightly correlated sets of transcripts are modulated by multiple genetic variants that exert their influence in a sex-specific manner and maintain highly stable molecular networks.
Conflict of Interest Statement
The authors declare that the research was conducted in the absence of any commercial or financial relationships that could be construed as a potential conflict of interest.
Acknowledgments
This work was supported by Integrative Neuroscience Initiative on Alcoholism grants U01AA13499, U01AA017590, U01AA0016662. The authors are also grateful to Arthur Centeno and Lorne Rose, and the Molecular Resource Center at UTHSC.
Supplementary Material
The Supplementary Material for this article can be found online at http://www.frontiersin.org/Neurogenomics/10.3389/fnins.2012.00063/abstract
Footnotes
References
Asarian, L., and Langhans, W. (2010). A new look on brain mechanisms of acute illness anorexia. Physiol. Behav. 100, 464–471.
Badea, A., Johnson, G. A., and Williams, R. W. (2009). Genetic dissection of the mouse brain using high-field magnetic resonance microscopy. Neuroimage 45, 1067–1079.
Becker, J. B. (1999). Gender differences in dopaminergic function in striatum and nucleus accumbens. Pharmacol. Biochem. Behav. 64, 803–812.
Becker, J. B., and Hu, M. (2008). Sex differences in drug abuse. Front. Neuroendocrinol. 29:36–47. doi: 10.1016/j.yfrne.2007.07.003
Bhasin, J. M., Chakrabarti, E., Peng, D. Q., Kulkarni, A., Chen, X., and Smith, J. D. (2008). Sex specific gene regulation and expression QTLs in mouse macrophages from a strain intercross. PLoS ONE 3, e1435. doi: 10.1371/journal.pone.0001435
Boone, E. M., Hawks, B. W., Li, W., and Garlow, S. J. (2008). Genetic regulation of hypothalamic cocaine and amphetamine-regulated transcript (CART) in BxD inbred mice. Brain Res. 1194, 1–7.
Brown, R. E., Mathieson, W. B., Stapleton, J., and Neumann, P. E. (1999). Maternal behavior in female C57BL/6J and DBA/2J inbred mice. Physiol. Behav. 67, 599–605.
De Jonge, F. H., Louwerse, A. L., Ooms, M. P., Evers, P., Endert, E., and Van De Poll, N. E. (1989). Lesions of the SDN-POA inhibit sexual behavior of male Wistar rats. Brain Res. Bull. 23, 483–492.
Dennis, G. Jr., Sherman, B. T., Hosack, D. A., Yang, J., Gao, W., Lane, H. C., and Lempicki, R. A. (2003). DAVID: database for annotation, visualization, and integrated discovery. Genome Biol. 4, P3.
Garlow, S. J., Boone, E., Li, W., Owens, M. J., and Nemeroff, C. B. (2005). Genetic analysis of the hypothalamic corticotropin-releasing factor system. Endocrinology 146, 2362–2368.
Gorski, R. A., Gordon, J. H., Shryne, J. E., and Southam, A. M. (1978). Evidence for a morphological sex difference within the medial preoptic area of the rat brain. Brain Res. 148, 333–346.
Halbreich, U. (2006). Major depression is not a diagnosis, it is a departure point to differential diagnosis – clinical and hormonal considerations (a commentary and elaboration on Antonejevic’s paper). Psychoneuroendocrinology 31, 16–22.
Hofman, M. A., and Swaab, D. F. (1989). The sexually dimorphic nucleus of the preoptic area in the human brain: a comparative morphometric study. J. Anat. 164, 55–72.
Hong, S., Cho, Y. W., Yu, L. R., Yu, H., Veenstra, T. D., and Ge, K. (2007). Identification of JmjC domain-containing UTX and JMJD3 as histone H3 lysine 27 demethylases. Proc. Natl. Acad. Sci. U.S.A. 104, 18439–18444.
Kajantie, E., and Phillips, D. I. (2006). The effects of sex and hormonal status on the physiological response to acute psychosocial stress. Psychoneuroendocrinology 31, 151–178.
Langfelder, P., Luo, R., Oldham, M. C., and Horvath, S. (2011). Is my network module preserved and reproducible? PLoS Comput. Biol. 7, e1001057. doi: 10.1371/journal.pcbi.1001057
Lasaga, M., and Debeljuk, L. (2011). Tachykinins and the hypothalamo-pituitary-gonadal axis: an update. Peptides 32, 1972–1978.
Lein, E. S., Hawrylycz, M. J., Ao, N., Ayres, M., Bensinger, A., Bernard, A., Boe, A. F., Boguski, M. S., Brockway, K. S., Byrnes, E. J., Chen, L., Chen, T. M., Chin, M. C., Chong, J., Crook, B. E., Czaplinska, A., Dang, C. N., Datta, S., Dee, N. R., Desaki, A. L., Desta, T., Diep, E., Dolbeare, T. A., Donelan, M. J., Dong, H. W., Dougherty, J. G., Duncan, B. J., Ebbert, A. J., Eichele, G., Estin, L. K., Faber, C., Facer, B. A., Fields, R., Fischer, S. R., Fliss, T. P., Frensley, C., Gates, S. N., Glattfelder, K. J., Halverson, K. R., Hart, M. R., Hohmann, J. G., Howell, M. P., Jeung, D. P., Johnson, R. A., Karr, P. T., Kawal, R., Kidney, J. M., Knapik, R. H., Kuan, C. L., Lake, J. H., Laramee, A. R., Larsen, K. D., Lau, C., Lemon, T. A., Liang, A. J., Liu, Y., Luong, L. T., Michaels, J., Morgan, J. J., Morgan, R. J., Mortrud, M. T., Mosqueda, N. F., Ng, L. L., Ng, R., Orta, G. J., Overly, C. C., Pak, T. H., Parry, S. E., Pathak, S. D., Pearson, O. C., Puchalski, R. B., Riley, Z. L., Rockett, H. R., Rowland, S. A., Royall, J. J., Ruiz, M. J., Sarno, N. R., Schaffnit, K., Shapovalova, N. V., Sivisay, T., Slaughterbeck, C. R., Smith, S. C., Smith, K. A., Smith, B. I., Sodt, A. J., Stewart, N. N., Stumpf, K. R., Sunkin, S. M., Sutram, M., Tam, A., Teemer, C. D., Thaller, C., Thompson, C. L., Varnam, L. R., Visel, A., Whitlock, R. M., Wohnoutka, P. E., Wolkey, C. K., Wong, V. Y., Wood, M., Yaylaoglu, M. B., Young, R. C., Youngstrom, B. L., Yuan, X. F., Zhang, B., Zwingman, T. A., and Jones, A. R. (2007). Genome-wide atlas of gene expression in the adult mouse brain. Nature 445, 168–176.
Lenz, K. M., and McCarthy, M. M. (2010). Organized for sex – steroid hormones and the developing hypothalamus. Eur. J. Neurosci. 32, 2096–2104.
Li, S. W., Arita, M., Fertala, A., Bao, Y., Kopen, G. C., Langsjo, T. K., Hyttinen, M. M., Helminen, H. J., and Prockop, D. J. (2001). Transgenic mice with inactive alleles for procollagen N-proteinase (ADAMTS-2) develop fragile skin and male sterility. Biochem. J. 355, 271–278.
Livak, K. J., and Schmittgen, T. D. (2001). Analysis of relative gene expression data using real-time quantitative PCR and the 2(-delta delta C(T)) method. Methods 25, 402–408.
Lopes, A. M., Arnold-Croop, S. E., Amorim, A., and Carrel, L. (2011). Clustered transcripts that escape X inactivation at mouse XqD. Mamm. Genome 22, 572–582.
Majdic, G., and Tobet, S. (2011). Cooperation of sex chromosomal genes and endocrine influences for hypothalamic sexual differentiation. Front. Neuroendocrinol. 32:137–145. doi: 10.1016/j.yfrne.2011.02.009
Mathieson, W. B., Taylor, S. W., Marshall, M., and Neumann, P. E. (2000). Strain and sex differences in the morphology of the medial preoptic nucleus of mice. J. Comp. Neurol. 428, 254–265.
Melo, J. A., Shendure, J., Pociask, K., and Silver, L. M. (1996). Identification of sex-specific quantitative trait loci controlling alcohol preference in C57BL/6 mice. Nat. Genet. 13, 147–153.
Mozhui, K., Ciobanu, D. C., Schikorski, T., Wang, X., Lu, L., and Williams, R. W. (2008). Dissection of a QTL hotspot on mouse distal chromosome 1 that modulates neurobehavioral phenotypes and gene expression. PLoS Genet. 4, e1000260. doi: 10.1371/journal.pgen.1000260
Navarro, V. M., Ruiz-Pino, F., Sanchez-Garrido, M. A., Garcia-Galiano, D., Hobbs, S. J., Manfredi-Lozano, M., Leon, S., Sangiao-Alvarellos, S., Castellano, J. M., Clifton, D. K., Pinilla, L., Steiner, R. A., and Tena-Sempere, M. (2012). Role of neurokinin B in the control of female puberty and its modulation by metabolic status. J. Neurosci. 32, 2388–2397.
Ober, C., Loisel, D. A., and Gilad, Y. (2008). Sex-specific genetic architecture of human disease. Nat. Rev. Genet. 9, 911–922.
Oldham, M. C., Horvath, S., and Geschwind, D. H. (2006). Conservation and evolution of gene coexpression networks in human and chimpanzee brains. Proc. Natl. Acad. Sci. U.S.A. 103, 17973–17978.
Oldham, M. C., Konopka, G., Iwamoto, K., Langfelder, P., Kato, T., Horvath, S., and Geschwind, D. H. (2008). Functional organization of the transcriptome in human brain. Nat. Neurosci. 11, 1271–1282.
Peirce, J. L., Li, H., Wang, J., Manly, K. F., Hitzemann, R. J., Belknap, J. K., Rosen, G. D., Goodwin, S., Sutter, T. R., Williams, R. W., and Lu, L. (2006). How replicable are mRNA expression QTL? Mamm. Genome 17, 643–656.
Peirce, J. L., Lu, L., Gu, J., Silver, L. M., and Williams, R. W. (2004). A new set of BXD recombinant inbred lines from advanced intercross populations in mice. BMC Genet. 5, 7. doi: 10.1186/1471-2156-5-7
Rance, N. E., Krajewski, S. J., Smith, M. A., Cholanian, M., and Dacks, P. A. (2010). Neurokinin B and the hypothalamic regulation of reproduction. Brain Res. 1364, 116–128.
Ravasz, E., Somera, A. L., Mongru, D. A., Oltvai, Z. N., and Barabasi, A. L. (2002). Hierarchical organization of modularity in metabolic networks. Science 297, 1551–1555.
Reinius, B., Saetre, P., Leonard, J. A., Blekhman, R., Merino-Martinez, R., Gilad, Y., and Jazin, E. (2008). An evolutionarily conserved sexual signature in the primate brain. PLoS Genet. 4, e1000100. doi: 10.1371/journal.pgen.1000100
Reinius, B., Shi, C., Hengshuo, L., Sandhu, K. S., Radomska, K. J., Rosen, G. D., Lu, L., Kullander, K., Williams, R. W., and Jazin, E. (2010). Female-biased expression of long non-coding RNAs in domains that escape X-inactivation in mouse. BMC Genomics 11, 614. doi: 10.1186/1471-2164-11-614
Rozen, S., and Skaletsky, H. (2000). Primer3 on the WWW for general users and for biologist programmers. Methods Mol. Biol. 132, 365–386.
Simerly, R. B. (1998). Organization and regulation of sexually dimorphic neuroendocrine pathways. Behav. Brain Res. 92, 195–203.
Taylor, B. A., Wnek, C., Kotlus, B. S., Roemer, N., Mactaggart, T., and Phillips, S. J. (1999). Genotyping new BXD recombinant inbred mouse strains and comparison of BXD and consensus maps. Mamm. Genome 10, 335–348.
van Nas, A., Guhathakurta, D., Wang, S. S., Yehya, N., Horvath, S., Zhang, B., Ingram-Drake, L., Chaudhuri, G., Schadt, E. E., Drake, T. A., Arnold, A. P., and Lusis, A. J. (2009). Elucidating the role of gonadal hormones in sexually dimorphic gene coexpression networks. Endocrinology 150, 1235–1249.
Wang, S. S., Schadt, E. E., Wang, H., Wang, X., Ingram-Drake, L., Shi, W., Drake, T. A., and Lusis, A. J. (2007). Identification of pathways for atherosclerosis in mice: integration of quantitative trait locus analysis and global gene expression data. Circ. Res. 101, e11–e30.
Weiss, L. A., Pan, L., Abney, M., and Ober, C. (2006). The sex-specific genetic architecture of quantitative traits in humans. Nat. Genet. 38, 218–222.
Winden, K. D., Oldham, M. C., Mirnics, K., Ebert, P. J., Swan, C. H., Levitt, P., Rubenstein, J. L., Horvath, S., and Geschwind, D. H. (2009). The organization of the transcriptional network in specific neuronal classes. Mol. Syst. Biol. 5, 291.
Woods, S. C., Gotoh, K., and Clegg, D. J. (2003). Gender differences in the control of energy homeostasis. Exp. Biol. Med. 228, 1175–1180.
Xu, J., Deng, X., Watkins, R., and Disteche, C. M. (2008). Sex-specific differences in expression of histone demethylases Utx and Uty in mouse brain and neurons. J. Neurosci. 28, 4521–4527.
Yang, X., Schadt, E. E., Wang, S., Wang, H., Arnold, A. P., Ingram-Drake, L., Drake, T. A., and Lusis, A. J. (2006). Tissue-specific expression and regulation of sexually dimorphic genes in mice. Genome Res. 16, 995–1004.
Zhang, B., and Horvath, S. (2005). A general framework for weighted gene co-expression network analysis. Stat. Appl. Genet. Mol. Biol. 4, Article 17.
Appendix
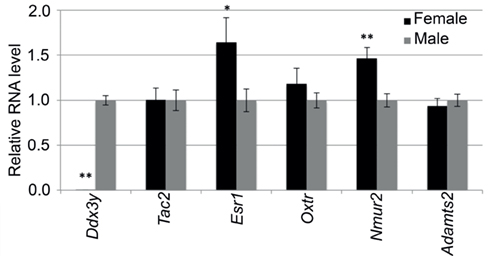
Figure A1. Quantitative RT-PCR analysis of selected transcripts in the hypothalamus. Expression difference is represented as fold-change in females relative to males (N = 4 females, 4 males). mRNA levels of Ddx3y, Tac2, Esr1, Oxtr, Nmur2, and Adamts2 were normalized to the reference transcript Actb. Error bars are ± SE of the mean. * P < 0.05, ** p < 0.01.
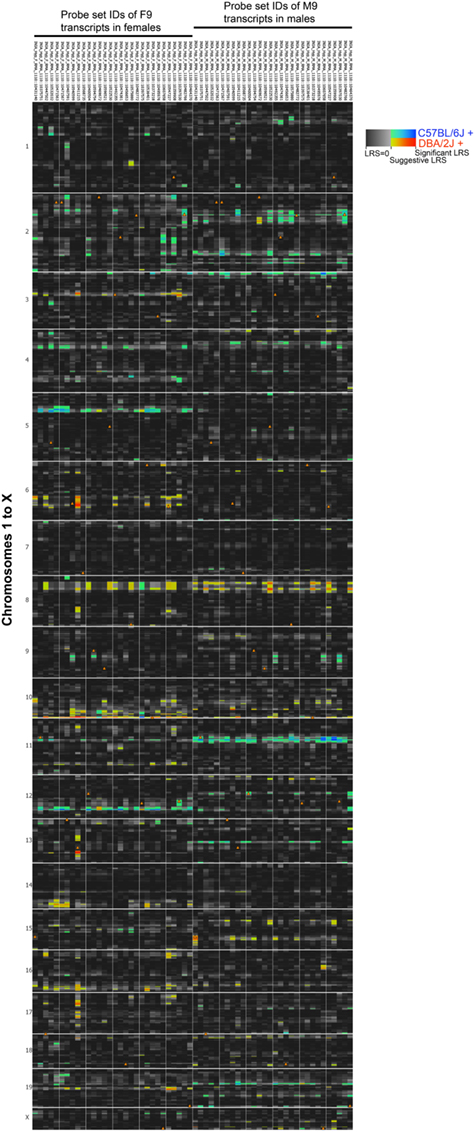
Figure A2. Sex-specific eQTLs for coexpressed transcripts. Thirty transcripts in modules F9 and M9 with high network connectivities were used for eQTL mapping. To provide a side-by-side comparison of eQTLs in females (left) and males (right), LRS are displayed as a heat map. Each column represents a transcript and rows represent chromosome 1 to x. The color intensity encodes the linkage strength and the parental allele effect. Locations of cognate genes are shown by triangles.
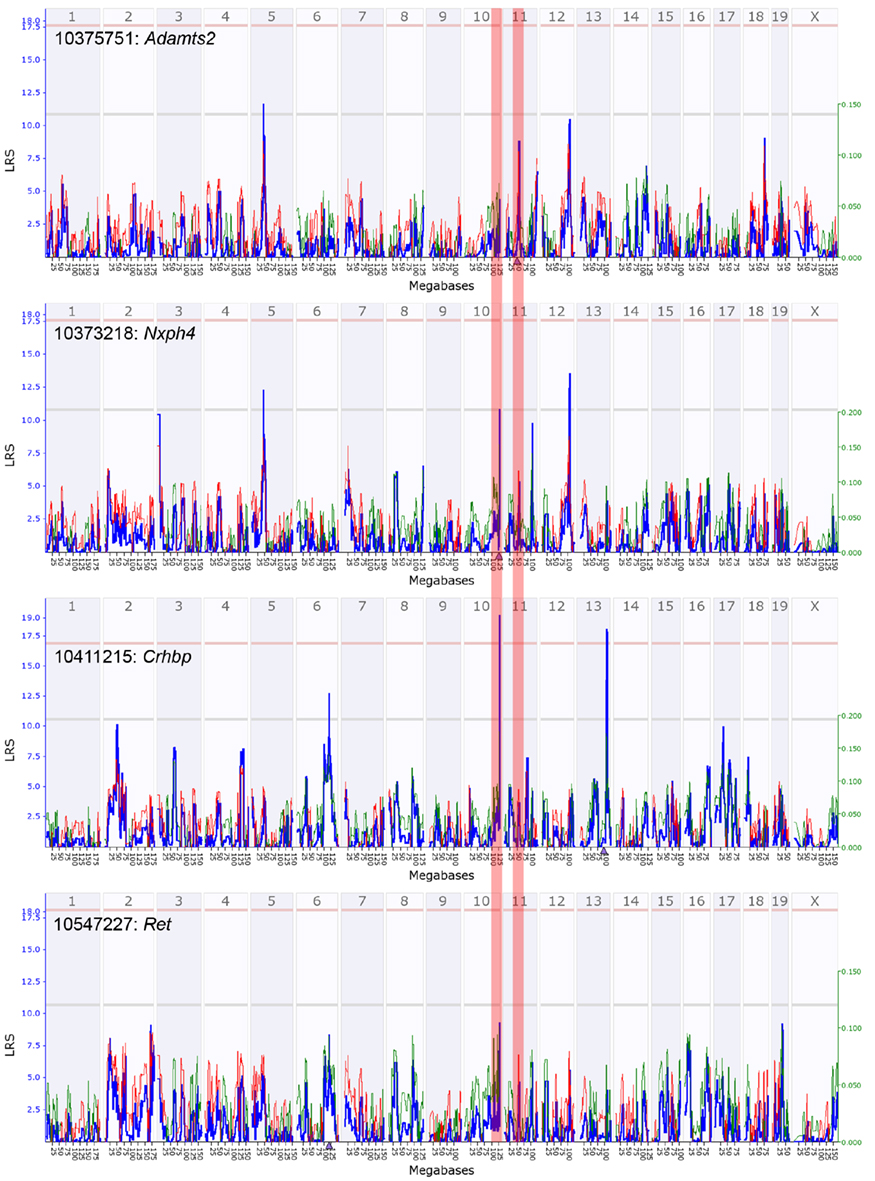
Figure A3. Quantitative trait loci maps of F9 members in females. These are genome-wide QTL maps for F9 members – Adamts2, Nxph4, Crhbp, and Ret. The Nxph4 transcript has a suggestive cis-QTL on distal chromosome 10 (highlighted zone). Crhbp has a significant trans-QTL on distal chromosome 10. Ret also has a weak trans-QTL near Nxph4 on distal Chr 10. Adamts2 has a sub-suggestive cis-QTL on chromosome 11 (highlighted zone) and its effect is weaker in females. x-axis represents chromosomes 1 to x and the y-axis shows the LRS scores. Horizontal lines indicate the genome-wide suggestive and significant thresholds.
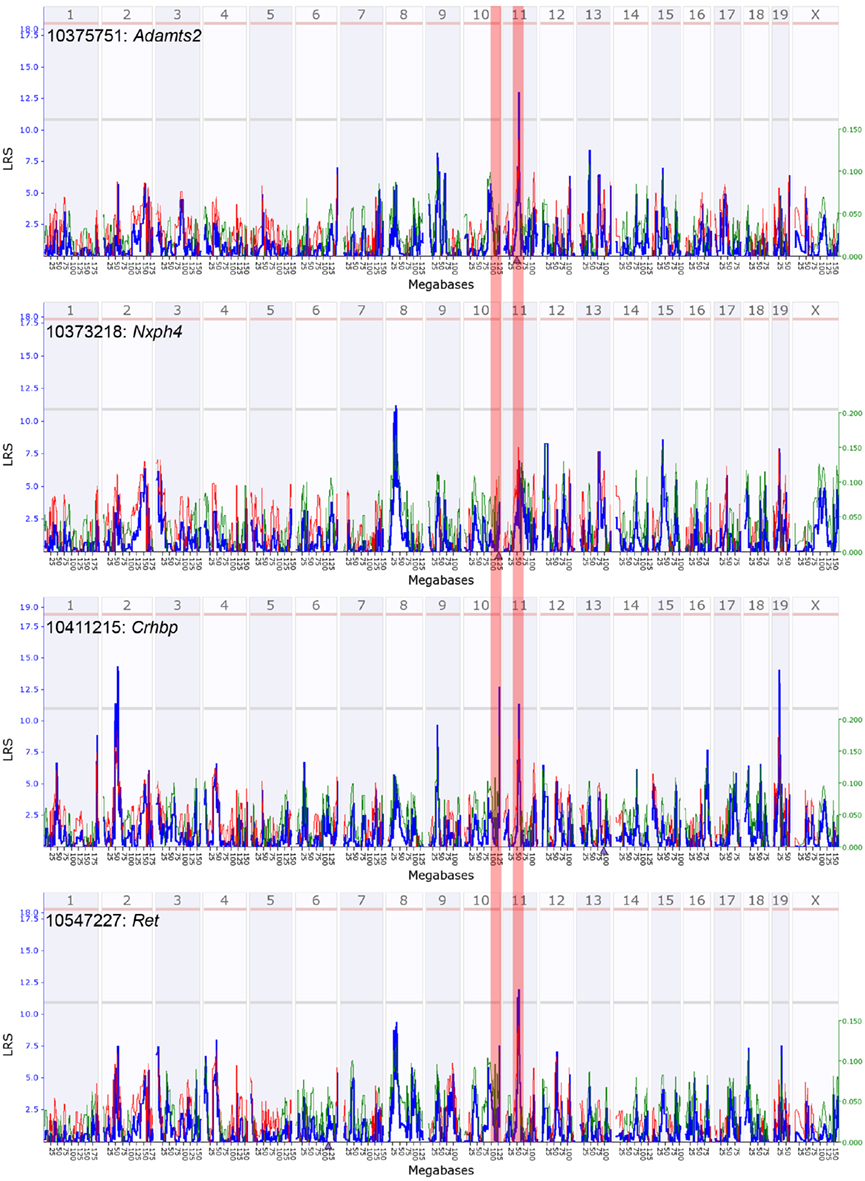
Figure A4. Quantitative trait loci maps of M9 members in males. These are genome-wide QTL maps for M9 members – Adamts2, Nxph4, Crhbp, and Ret. The Adamts2 transcript has a suggestive cis-QTL on mid chromosome 11 (highlighted zone). Crhbp and Ret have suggestive trans-QTL on mid chromosome 11. Nxph4, located on chromosome 10, does not map as a cis-QTL in males (highlighted zone). x-axis represents chromosomes 1 to x and the y-axis shows the LRS scores. Horizontal lines indicate the genome-wide suggestive and significant thresholds.
Keywords: hypothalamus, sex-specificity, eQTL, weighted gene coexpression networks
Citation: Mozhui K, Lu L, Armstrong WE and Williams RW (2012) Sex-specific modulation of gene expression networks in murine hypothalamus. Front. Neurosci. 6:63. doi: 10.3389/fnins.2012.00063
Received: 20 January 2012; Accepted: 10 April 2012;
Published online: 11 May 2012.
Edited by:
Michael F. Miles, Virginia Commonwealth University, USAReviewed by:
Alfredo Ghezzi, The University of Texas at Austin, USAJiuyong Xie, The University of Manitoba, Canada
Copyright: © 2012 Mozhui, Lu, Armstrong and Williams. This is an open-access article distributed under the terms of the Creative Commons Attribution Non Commercial License, which permits non-commercial use, distribution, and reproduction in other forums, provided the original authors and source are credited.
*Correspondence: Khyobeni Mozhui, Department of Anatomy and Neurobiology, University of Tennessee Health Science Center, 855 Monroe Avenue, Suite 515, Memphis, TN 38163, USA. e-mail: kmozhui@uthsc.edu