Reduced Gray Matter Volume in the Social Brain Network in Adults with Autism Spectrum Disorder
 Wataru Sato1*†
  Takanori Kochiyama2†
  Shota Uono1
  Sayaka Yoshimura1
  Yasutaka Kubota3
  Reiko Sawada1
  Morimitsu Sakihama4 Motomi Toichi5,6
- 1Department of Neurodevelopmental Psychiatry, Habilitation and Rehabilitation, Graduate School of Medicine, Kyoto University, Kyoto, Japan
- 2Brain Activity Imaging Center, Advanced Telecommunications Research Institute International, Kyoto, Japan
- 3Health and Medical Services Center, Shiga University, Shiga, Japan
- 4Rakuwa-kai Otowa Hospital, Kyoto, Japan
- 5Faculty of Human Health Science, Kyoto University, Kyoto, Japan
- 6The Organization for Promoting Neurodevelopmental Disorder Research, Kyoto, Japan
Autism spectrum disorder (ASD) is a neurodevelopmental disorder characterized by behavioral impairment in social interactions. Although theoretical and empirical evidence suggests that impairment in the social brain network could be the neural underpinnings of ASD, previous structural magnetic resonance imaging (MRI) studies in adults with ASD have not provided clear support for this, possibly due to confounding factors, such as language impairments. To further explore this issue, we acquired structural MRI data and analyzed gray matter volume in adults with ASD (n = 36) who had no language impairments (diagnosed with Asperger’s disorder or pervasive developmental disorder not otherwise specified, with symptoms milder than those of Asperger’s disorder), had no comorbidity, and were not taking medications, and in age- and sex-matched typically developing (TD) controls (n = 36). Univariate voxel-based morphometry analyses revealed that regional gray matter volume was lower in the ASD than in the control group in several brain regions, including the right inferior occipital gyrus, left fusiform gyrus, right middle temporal gyrus, bilateral amygdala, right inferior frontal gyrus, right orbitofrontal cortex, and left dorsomedial prefrontal cortex. A multivariate approach using a partial least squares (PLS) method showed that these regions constituted a network that could be used to discriminate between the ASD and TD groups. A PLS discriminant analysis using information from these regions showed high accuracy, sensitivity, specificity, and precision (>80%) in discriminating between the groups. These results suggest that reduced gray matter volume in the social brain network represents the neural underpinnings of behavioral social malfunctioning in adults with ASD.
Introduction
Autism spectrum disorder (ASD) is a behaviorally defined neurodevelopmental disorder characterized primarily by impairment in social interactions (American Psychiatric Association, 2013). For example, several behavioral studies have reported that individuals with ASD, compared with typically developing (TD) individuals, exhibit less attention to others’ faces (Trepagnier et al., 2002), reduced emotional reactions (Yirmiya et al., 1989), and facial mimicry (Yoshimura et al., 2015) to others’ facial expressions, and reduced ability to read the others’ mental states from their eyes (Baron-Cohen et al., 2001).
Regarding the underlying neural mechanism of such behavioral social impairments, some researchers have proposed that a network of specific brain regions that are involved in processing social signals, called the “social brain” network (Brothers et al., 1990; Adolphs, 2003; Blakemore, 2008), may be impaired in individuals with ASD (Emery and Perrett, 2000; Johnson et al., 2005; Bachevalier and Loveland, 2006; Frith, 2007; Pelphrey and Carter, 2008). Although details differ among researchers regarding which brain regions are included in the network, the regions typically are said to include the inferior occipital gyrus (IOG), posterior fusiform gyrus (FG), posterior middle temporal gyrus (MTG, including its adjacent regions such as the superior temporal sulcus and gyrus; cf. Allison et al., 2000), amygdala, inferior frontal gyrus (IFG), orbitofrontal cortex (OFC, including both medial and lateral areas; cf. Rudebeck and Murray, 2011), and dorsomedial prefrontal cortex (DMPFC). Ample functional neuroimaging and neuropsychological evidence in TD individuals suggests that these social brain regions are related to specific processing for social stimuli, such as the visual analysis of faces in the IOG, FG, and MTG (for a review, see Haxby et al., 2000), emotional processing in the amygdala and OFC (for reviews, see Calder et al., 2001; Rolls, 2004), motor resonance in the IFG (for a review, see Rizzolatti et al., 2001), and mindreading in the DMPFC (for a review, see Frith and Frith, 2003). Consistent with this proposal, several previous functional neuroimaging studies in individuals with ASD have reported that during the processing of social stimuli, individuals with ASD show reduced activity in regions within the social brain network, such as the IOG (e.g., Deeley et al., 2007; Scherf et al., 2010; Sato et al., 2012), FG (e.g., Critchley et al., 2000; Schultz et al., 2000; Pierce et al., 2001), MTG (e.g., Critchley et al., 2000; Pelphrey et al., 2005; Williams et al., 2006), amygdala (e.g., Baron-Cohen et al., 1999; Critchley et al., 2000; Pierce et al., 2001), IFG (e.g., Baron-Cohen et al., 1999; Hall et al., 2003; Dapretto et al., 2006), OFC (e.g., Ashwin et al., 2007; Kana et al., 2009; Kaiser et al., 2010), and DMPFC (e.g., Castelli et al., 2002; Pierce et al., 2004; Wang et al., 2007) (for reviews, see Philip et al., 2012; Nickl-Jockschat et al., 2015). These theoretical and empirical findings suggest that the decreased activity in the social brain network underlies the behavioral social impairment in individuals with ASD.
To complement this understanding of the neural underpinnings of ASD, several structural magnetic resonance imaging (MRI) studies have investigated structural neural abnormalities in individuals with ASD. However, to date, the results have been inconsistent across studies (e.g., Abell et al., 1999; for reviews, see Duerden et al., 2012; Nickl-Jockschat et al., 2012; Yang et al., 2016). These inconsistent results may be at least partly explained by abnormal trajectories of brain development in ASD (for a review, see Sacco et al., 2015). However, even studies testing only adult participants have reported inconsistent findings (Abell et al., 1999; McAlonan et al., 2002; Hadjikhani et al., 2006; Schmitz et al., 2006, 2008; Craig et al., 2007; Wilson et al., 2009; Toal et al., 2010; Dziobek et al., 2010; Scheel et al., 2011; Ecker et al., 2012, 2013; Lai et al., 2013; Mueller et al., 2013; Bernhardt et al., 2014; Riedel et al., 2014; Balardin et al., 2015; Gebauer et al., 2015; Itahashi et al., 2015; Lai et al., 2015; Libero et al., 2015; for a review, see Yang et al., 2016). Although several studies reported reduced gray matter volume or cortical thickness in the social brain regions among individuals with ASD, including the IOG (Hadjikhani et al., 2006; Ecker et al., 2012), FG (Hadjikhani et al., 2006; Craig et al., 2007; Toal et al., 2010; Ecker et al., 2012), MTG (Hadjikhani et al., 2006; Craig et al., 2007; Scheel et al., 2011; Ecker et al., 2012; Mueller et al., 2013), amygdala (Craig et al., 2007; Lai et al., 2015), IFG (Hadjikhani et al., 2006; Mueller et al., 2013), OFC (Hadjikhani et al., 2006; Craig et al., 2007), and DMPFC (Abell et al., 1999; Hadjikhani et al., 2006), only a few studies reported problems in multiple social brain regions. Furthermore, no reported study has provided evidence as to whether the brain regions that exhibit reduced gray matter volume actually constitute the network in adults with ASD.
These inconsistent findings across structural MRI studies in adults with ASD may be explained by confounding factors such as language impairments, which are major and heterogeneous in ASD (for reviews, see Boucher, 2012; Mody and Belliveau, 2013). Language anomalies (e.g., language delay) are included in the diagnostic criteria of the International Classification of Diseases 10 (World Health Organization, 1992) and in the Diagnostic and Statistical Manual of Mental Disorders, Fourth Edition, Text Revision (DSM-IV-TR) (American Psychiatric Association, 2000); however, they are not included in the DSM-5 (American Psychiatric Association, 2013). For the first two diagnostic systems, individuals with and without language/communication impairments, in addition to the core ASD symptoms of social deficits and repetitive/restricted tendencies, are diagnosed with autistic disorder and Asperger syndrome/disorder, respectively. Some previous studies of individuals with ASD have revealed widespread changes in gray matter structures associated with language impairments (Lai et al., 2015; Sharda et al., 2017). For example, Sharda et al. (2017) found that poorer language ability was associated with greater cortical thickness in the temporal and frontal cortices. Some studies also compared the brain structure in children with autistic disorders and Asperger disorder/syndrome and reported at least partially discrete structural abnormalities (Kwon et al., 2004; McAlonan et al., 2008). Regarding this issue, the majority of the abovementioned structural MRI studies investigating ASD in adults (excluding McAlonan et al., 2002) included (at least partially) individuals with autistic disorders or did not report the subtypes of ASD of the participants. Therefore, it is possible that the structural abnormalities related to language impairments could overshadow those in the social brain regions. In addition, factors, such as comorbidity and medication, may act as confounding factors and have not been controlled or reported in some previous structural MRI studies in adults with ASD.
To provide further evidence regarding structural neural abnormalities in ASD, we acquired structural MRI data from adults with ASD who had no language impairments (diagnosed with Asperger’s disorder or pervasive developmental disorder not otherwise specified [PDD-NOS], with symptoms milder than those of Asperger’s disorder), had no comorbidities, and were not taking medication. We also tested age- and sex-matched TD controls. First, we analyzed group differences in regional gray matter volume using univariate voxel-based morphometry (VBM). The univariate VBM was used to identify the brain regions showing differences in gray matter volume between groups. Next, to identify group differences at a network level, we applied a multivariate approach and conducted a partial least squares (PLS) analysis (McIntosh et al., 1996). PLS analysis was used to identify the brain network (i.e., the sets of correlated voxels) that could be used to discriminate between the ASD and TD groups. We further conducted PLS discriminant analysis (PLS-DA) (Barker and Rayens, 2003) using information derived from the PLS analysis to determine the accuracy, sensitivity, specificity, and precision of the brain network in discriminating between groups. We also explored the association between the regional/network-level gray matter volume reduction and the severity of social malfunctioning related to ASD. Although direct evidence from previous structural MRI studies in ASD groups has not been consistent, based on results suggestive of an impaired social brain network in adults with ASD and our controlling for possible confounding factors, we predicted that the univariate VBM would show decreased regional gray matter volume in the social brain regions in the ASD group. We also predicted that the multivariate PLS and PLS-DA would identify the social brain network and reveal a correlated reduction in gray matter volume in ASD, which would differentiate between the ASD and TD groups with certain degree of accuracy, sensitivity, specificity, and precision, and would be correlated with the severity of social malfunctioning.
Materials and Methods
Participants
The ASD group consisted of 36 adults with ASD (11 females, 25 males; mean ± SD [range] age = 27.0 ± 8.0 [18–53] years). The group consisted of 21 (7 females, 14 males) individuals with Asperger’s disorder and 15 (4 females, 11 males) with PDD-NOS; both of these diagnoses are included within the ASD category in the DSM-5 (American Psychiatric Association, 2013). As defined in the DSM-IV-TR (American Psychiatric Association, 2000), PDD-NOS includes the heterogeneous subtypes of ASD, ranging from so-called atypical autism to a subgroup with symptoms milder than those of Asperger’s disorder (i.e., satisfying fewer diagnostic criteria than required for a diagnosis of Asperger’s disorder). In this study, only high-functioning PDD-NOS participants with milder symptoms than those associated with Asperger’s disorder were included. The diagnosis was made using the DSM-IV-TR via a stringent procedure in which every item of the ASD diagnostic criteria was investigated in interviews with participants and their parents (and professionals who helped them, if any) by at least two psychiatrists with expertise in developmental disorders. Only participants who met at least one of the four social impairment items (i.e., impairment in nonverbal communication including lack of joint attention, sharing interest, relationship with peers, and emotional and interpersonal mutuality) without satisfying any items of the criteria of autistic disorder, such as language delay, were included. Comprehensive interviews were administered to obtain information on the participant’s developmental histories for diagnostic purposes. Neurological and psychiatric issues other than those associated with ASD were ruled out. Participants were not taking medication. The intelligence quotients (IQs) of all participants in the ASD group had been assessed at other facilities and were reported to be within the normal range. Participants who agreed to newly undergo IQ tests (n = 33) were assessed using the revised Wechsler Adult Intelligence Scale, third edition (Nihon Bunka Kagakusha, Tokyo, Japan). All participants in the ASD group were recruited on a voluntary basis at Kyoto University, Rakuwa-kai Otowa Hospital, and the Organization for Promoting Neurodevelopmental Disorder Research. Although two additional individuals planned to participate in the present study, MRI scans of these individuals could not be conducted because macroscopic structural abnormalities due to a previous traffic accident, and artifacts due to orthodontic appliances, respectively, were detected during prescan procedures.
The symptom severity of the participants who were willing to undergo a further detailed interview (n = 25) was assessed quantitatively using the Childhood Autism Rating Scale (CARS) (Schopler et al., 1986). The CARS is an effective tool used to evaluate the severity of ASD symptoms in adults, adolescents, and children (Mesibov et al., 1989). The CARS includes 15 items used to assess ASD-related behaviors. Each item is scored from 1.0 to 4.0 in 0.5 increments, with higher scores indicative of more severe symptoms. Total scores range from 15 to 60.
The TD group consisted of 36 adults (11 females, 25 males; mean ± SD [range] age = 24.9 ± 5.5 [20–43] years) who were matched for age (t-test, p > 0.10) and sex (χ2-test, p > 0.10) with the ASD group. A psychiatrist or psychologist administered a short structured diagnostic interview using the Mini-International Neuropsychiatric Interview (Sheehan et al., 1998); no neuropsychiatric problem was detected in any participant. All participants in the TD group were recruited on a voluntary basis at Kyoto University.
After the procedures were fully explained, all participants provided written informed consent for participation. This study was approved by the local ethics committee of the Primate Research Institute, Kyoto University, and was conducted in accordance with institutional ethical provisions and the Declaration of Helsinki.
MRI Acquisition
Image scanning was performed using a 3-T MRI system (MAGNETOM Trio, A Tim System, Siemens, Erlangen, Germany) at the ATR Brain Activity Imaging Center using a 12-channel head coil. Small elastic pads were placed on both sides of the head to minimize head motion and on-line visual inspection using a video camera confirmed that none of the participants showed observable head movement. A T1-weighted high-resolution anatomical image was obtained using a magnetization-prepared rapid-acquisition gradient-echo sequence (repetition time = 2,250 ms; echo time = 3.06 ms; inversion time = 1,000; flip angle = 9°; field of view = 256 mm × 256 mm; voxel size = 1 mm × 1 mm × 1 mm).
Image Analysis
All image analyses were implemented in MATLAB R2012b (MathWorks, Natick, MA, United States). Image preprocessing and VBM analysis were performed using the statistical parametric mapping package, SPM81 and the VBM8 toolbox2. First, two of the study authors (WS and TK) independently conducted the visual inspection of T1 images and confirmed no macroscopic lesions or artifacts in the images. Then, image preprocessing was performed using the VBM8 toolbox with default settings. All T1 images were segmented into gray matter, white matter, and cerebrospinal fluid using an adaptive maximum a posteriori (AMAP) approach (Rajapakse et al., 1997). Intensity inhomogeneity in the MR image was modeled as slowly varying spatial functions and thus corrected in the AMAP estimation. The segmented images were then used for a partial volume estimation using a simple model with mixed tissue types to improve segmentation (Tohka et al., 2004). Furthermore, a spatially adaptive non-local-means denoising filter was applied to deal with spatially varying noise levels (Manjón et al., 2010). A Markov random field cleanup was used to improve the image quality. The gray matter images in native space were subsequently normalized to the standard stereotactic space defined by the Montreal Neurological Institute using the Diffeomorphic Anatomical Registration with the Exponentiated Lie Algebra algorithm approach (Ashburner, 2007). We used predefined templates provided in the VBM8 toolbox, derived from 550 healthy brains from the IXI-database3. The resulting normalized images of the gray matter were modulated using Jacobian determinants with non-linear warping only (i.e., m0 image in the VBM8 outputs) to exclude the effect of total intracranial volume. Finally, the normalized modulated images of the gray matter were resampled to a resolution of 1.5 mm × 1.5 mm × 1.5 mm and smoothed using a 8-mm full-width at half-maximum isotropic Gaussian kernel.
To identify the brain regions associated with differences between the groups, we conducted VBM using a general linear model analysis, with group as the effect-of-interest factor and sex and age as the effect-of-no-interest covariates. The association between group difference and the volume of the gray matter was tested using T-statistics and reported as a Z-score after the T-value was transformed into the standard normal distribution. Voxels were deemed to be statistically significant if they reached the extent threshold of p < 0.05, after false-discovery rate (FDR) correction for multiple comparisons based on the topological FDR procedure (Chumbley and Friston, 2009), with a cluster-forming threshold (CFT) of p < 0.01 (uncorrected). Note that the main results were unchanged after the non-stationary cluster extent corrections (Hayasaka et al., 2004). According to a recent study (Eklund et al., 2016), the parametric cluster size inference may inflate the false positive rate at a CFT of p < 0.01. Hence, to validate our results, we conducted follow-up analyses using Permutation Analysis of Linear Models software4 (Winkler et al., 2014), which is a permutation-based inference tool for nonparametric statistics. The threshold for significance was set at p < 0.05 after correcting for family wise error using the threshold-free cluster enhancement approach (Smith and Nichols, 2009). Only the effects that reached significance in both of these parametric and nonparametric analyses are reported. We also explored the effects of ASD subtype (Asperger’s disorder vs. PDD-NOS) using these predefined thresholds. The clusters that showed significant group difference (TD > ASD) were used as an inclusive mask.
The brain structures were labeled anatomically according to the Automated Anatomical Labeling atlas (Tzourio-Mazoyer et al., 2002) included in the MRIcron software5 and the probabilistic cytoarchitectonic atlas included in the SPM Anatomy toolbox6 (Eickhoff et al., 2005). Corresponding Brodmann’s areas were also identified using the MRIcron software. The group difference in gray matter volume was illustrated by plotting the gray matter values extracted at the peak voxels after adjusting for the effects of no interest by regressing out age- and sex-related variance.
To identify the brain network associated with group differences, we performed PLS (McIntosh et al., 1996) using PLSGUI7. The normalized images of the gray matter corrected for intracranial volume (i.e., m0 image in the VBM8 outputs) were analyzed. PLS is a multivariate statistical analysis that examines distributed sets of correlated voxels; PLS conducts singular value decomposition for voxels, similar to traditional principal component analyses, but the solutions are constrained to external variables (McIntosh and Lobaugh, 2004). In this study, we searched for the voxel distributions associated with the group differences (ASD vs. TD) using the mean centering PLS analysis. PLS analysis with mean centering is a data-driven version of PLS, in which a set of latent variables (LVs) that explain the maximum covariance between the gray matter volume data and the group effects are derived without explicitly contrasting the two groups. Hence, this type of PLS is referred to as discriminant analysis (Krishnan et al., 2011). The spatial pattern of brain voxels was characterized by voxel saliences indicating the degree to which each voxel was related to each LV (i.e., weight for a given LV).
The statistical significance of the resultant LVs was assessed using permutation tests that were repeated 1,000 times (cf. Krishnan et al., 2011) with a threshold of p < 0.01. The reliability of the voxel saliences was determined by estimating their standard error using bootstrap sampling, in which 1,000 random samplings of the participants with replacement allowing duplication were performed (cf. Krishnan et al., 2011). The bootstrap ratio (BSR) was then calculated for each voxel by dividing the voxel salience by its bootstrapped standard error. The threshold of the BSR was set to ±3.3, corresponding approximately to a p-value of 0.001.
To evaluate the ability of the PLS analysis to discriminate between the ASD and TD groups, we performed PLS-DA (Barker and Rayens, 2003) with leave-one-out cross-validation using the classification toolbox (Ballabio and Consonni, 2013). The inputs were the gray matter voxels showing significant BSR of the LVs in the above PLS analysis. For a baseline comparison, we also analyzed the whole brain gray matter voxels as inputs. For classification performance, the accuracy ([correctly selected ASD individuals + correctly rejected TD individuals]/[total ASD individuals + total TD individuals]), sensitivity (correctly selected ASD individuals/total ASD individuals), specificity (correctly rejected TD individuals/total TD individuals), and precision (correctly selected ASD individuals/[correctly selected ASD individuals + wrongly selected TD individuals]) were computed.
To explore the association between the regional/network-level gray matter volume reduction and the severity of ASD, we performed correlational analyses. For the overall symptom severity index, we calculated the total CARS score. For the social mulfunctioning index, we also caluculated the sub-total of five items (no. 1, 2, 7, 11, and 12) that were commonly categorized into the social functioning construct in previous studies evaluating the factor structure of the CARS (cf. Magyar and Pandolfi, 2007), as in previous studies (Uono et al., 2011; Yoshimura et al., 2015). To investigate the association between these indices and regional gray matter volume in the ASD group, we conducted VBM analyses using general linear models, with the index (total or social CARS score) as the effect-of-interest factor and sex and age as the effect-of-no-interest covariates. We selected those regions that showed significant group differences in the above VBM analysis as regions of interest. The significance threshold was the same as that in the above VBM analysis. Next, to explore the association between the indices and network-level gray matter volume, we used the brain score derived from the above PLS analysis as the dependent variable and conducted general linear model analyses using the index (total or social CARS score) as the effect-of-interest factor and sex and age as the effect-of-no-interest covariates. The significance threshold was the same as that in the above PLS analysis.
Results
Background Information
The demographics and psychiatric information of the ASD and TD groups are summarized in Table 1. The total CARS scores in the ASD group were comparable with those of participants with high-functioning ASD, including those with Asperger’s disorder and PDD-NOS, reported in previous studies (t-test, p > 0.1) (Koyama et al., 2007; Uono et al., 2011; Sato et al., 2012), indicating that symptoms in the ASD group were severe. The full-scale IQs of all participants in the ASD group were within the normal range. All participants were right handed.
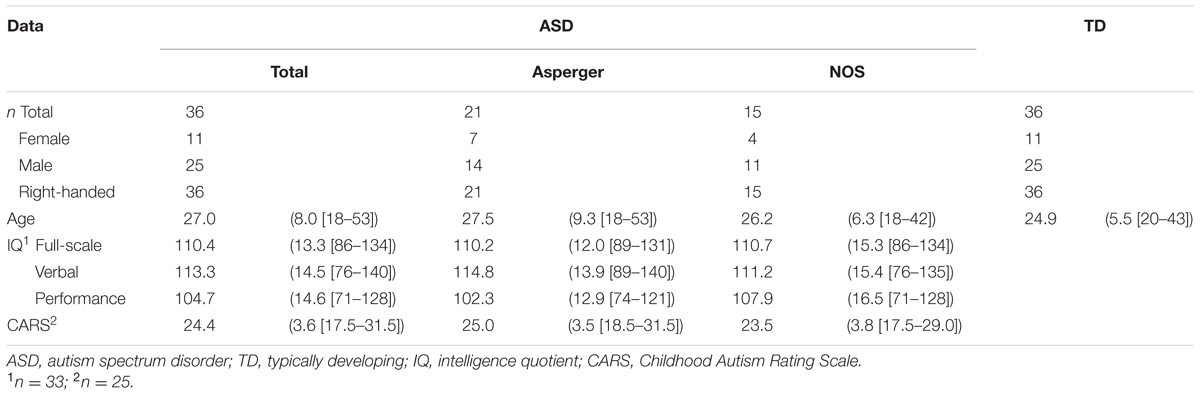
TABLE 1. Mean (with SD [range]) background information of participants.
Voxel-Based Morphometry
To identify the brain regions associated with the differences between the groups, structural MRI data were analyzed by univariate VBM, with group as the effect-of-interest and age and sex as the effect-of-no-interest covariates. The results revealed a significant main effect for group, in which there were reduced volume in the ASD compared with the TD group in the right posterior region including the IOG and MTG, in the left posterior–limbic region including the FG and amygdala, in the right limbic region including the amygdala, in the right lateral prefrontal region covering the IFG, and in the bilateral medial prefrontal region including the right OFC and left DMPFC (Table 2 and Figure 1). There was no significant cluster for a main effect for group indicating a heightened volume for the ASD compared with the TD group. Similarly, an exploration of the effects of ASD subtype did not reveal any significant clusters. A visual inspection of the adjusted gray matter volume (Supplementary Figure S1) showed that the values were in the order of Asperger’s disorder <PDD-NOS<TD in some regions (e.g., MTG) and were comparable across the Asperger’s disorder and PDD-NOS groups in other regions (e.g., FG).
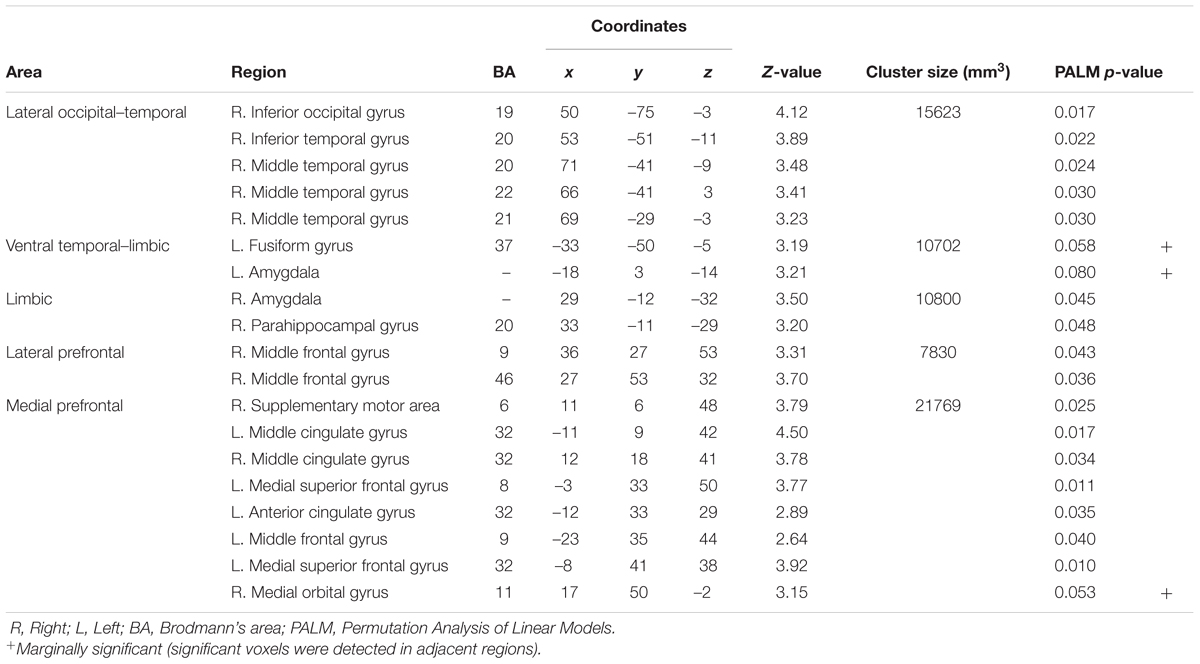
TABLE 2. Brain regions that exhibited significantly lower gray matter volume in the autism spectrum disorder (ASD) group than in the typical developing group.
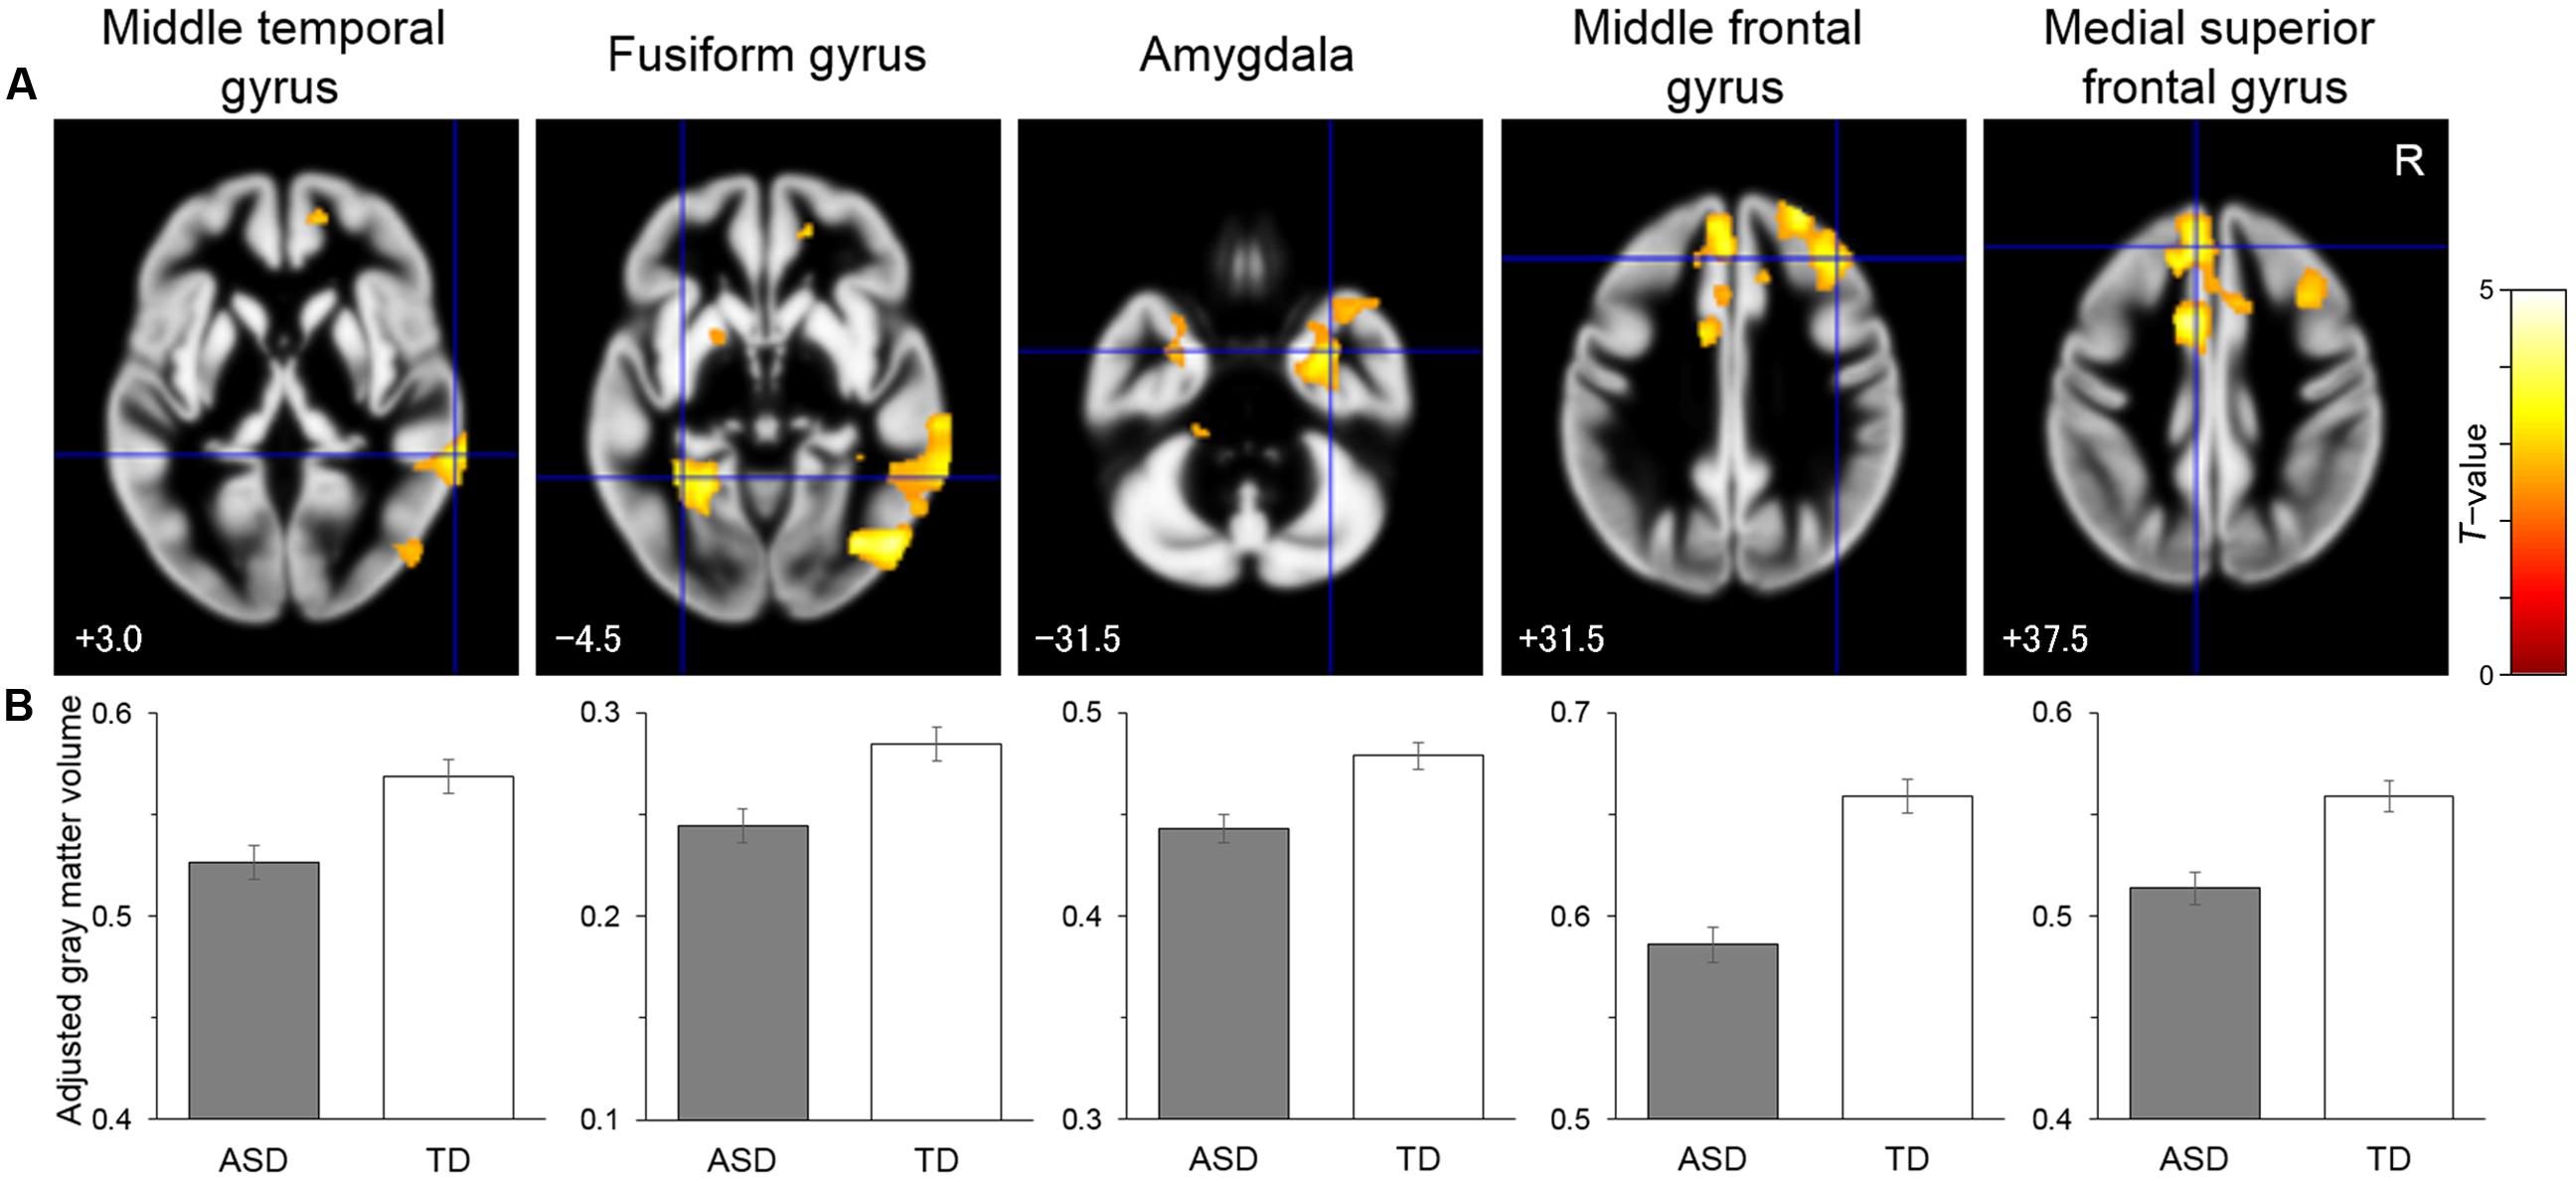
FIGURE 1. Brain regions showing significantly reduced gray matter volume in the autism spectrum disorder (ASD) group relative to the typically developing (TD) group. (A) Statistical parametric maps. The areas are overlaid on the template gray matter image. Numbers below the slices indicate the z-axis of the Montreal Neurological Institute system coordinates. The blue crosses indicate the activation foci and the red–yellow color scale represents the T-value. R, right hemisphere. (B) Mean (with SE) adjusted gray matter volume at the peak voxel. Effects of no interest (sex and age) were cavaried out.
PLS and PLS-DA
To identify the brain network (i.e., the sets of correlated voxels) associated with the group differences, PLS analysis was performed for the gray matter images. The results revealed that the first LV showed significant discrimination between the groups (p = 0.003; Figure 2) and explained 100% of the crossblock covariance. The spatial distribution of brain voxels that negatively weighted on this LV (i.e., ASD < TD) included all of the social brain regions that showed group differences in the above regional gray matter volume analyses (i.e., the right IOG, left FG, right MTG, bilateral amygdala, right IFG, right OFC, and left DMPFC).
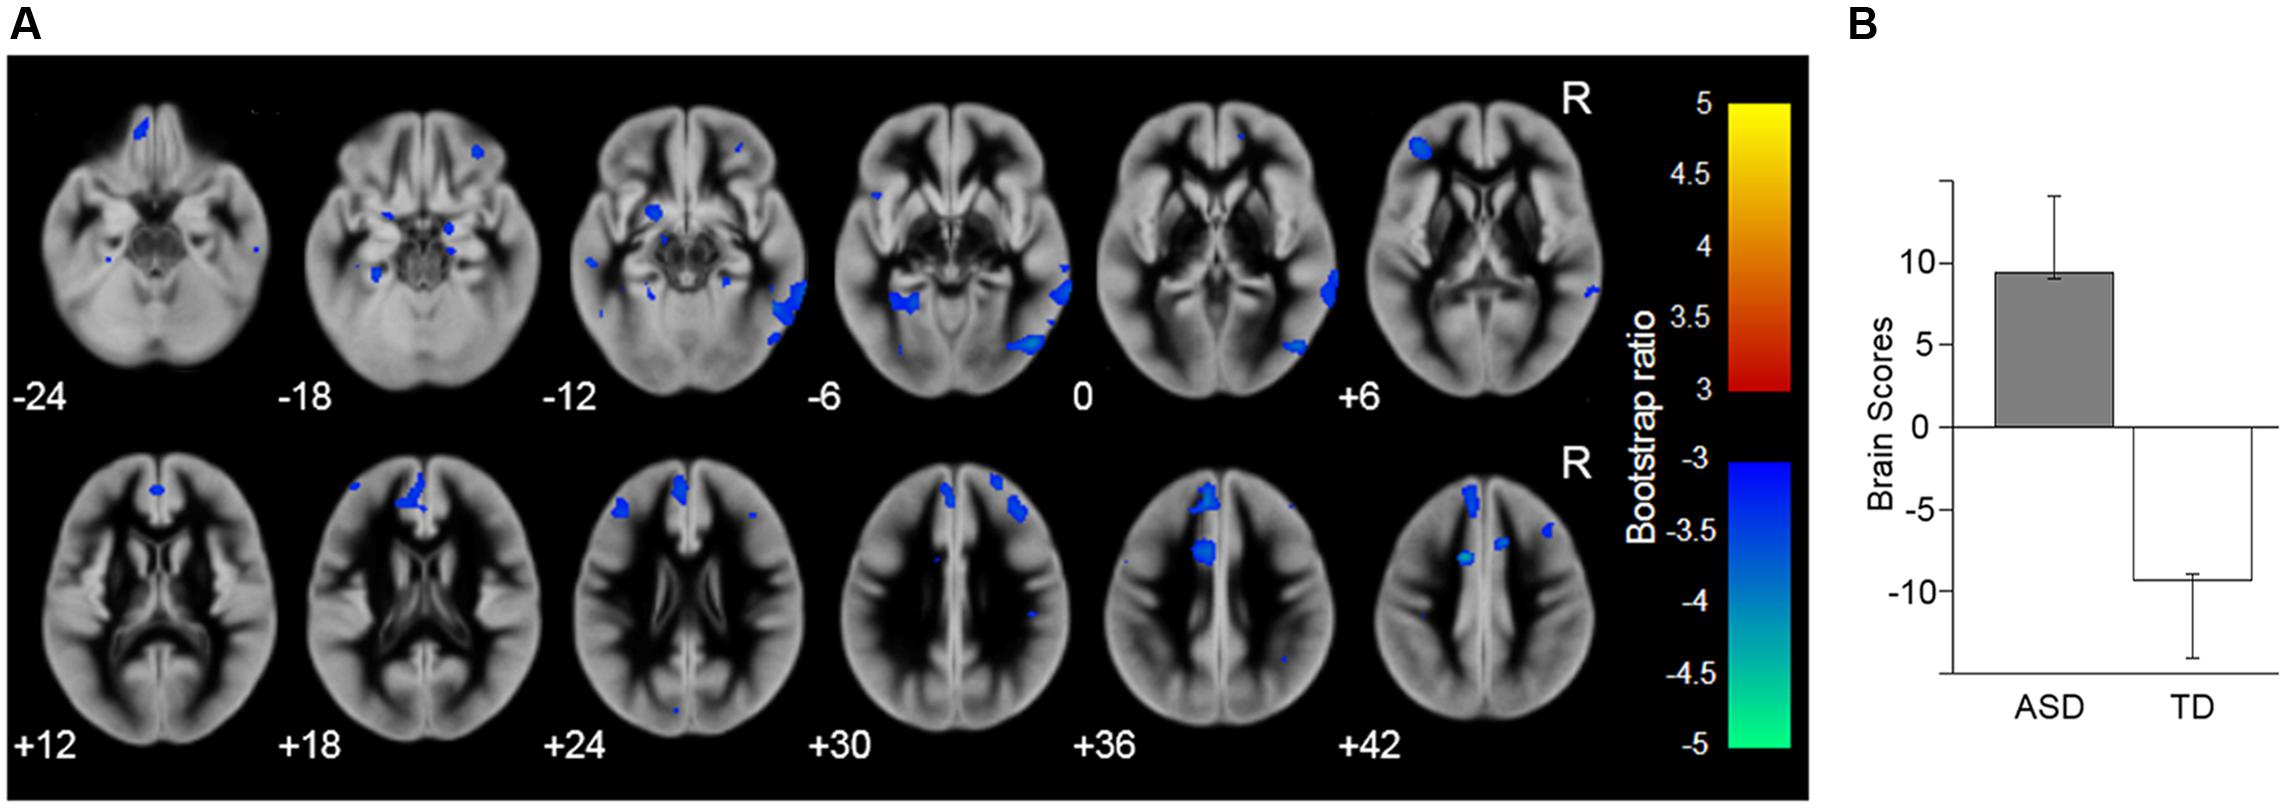
FIGURE 2. Brain network showing the latent variable that significantly discriminated the autism spectrum disorder (ASD) and typically developing (TD) groups. (A) Latent variable maps. The blue–cyan color indicates the reduced gray matter volume in the ASD compared with the TD group; the red–yellow color indicates the opposite direction. The areas are overlaid on the template gray matter image. Numbers below the slices indicate the z-axis of the Montreal Neurological Institute system coordinates. R, right hemisphere. (B) The mean (with the upper and lower 95% confidence limits) brain scores of the latent variable (i.e., the degree to which the pattern of gray matter volume across the whole brain, identified by the latent variable, is expressed in each participant).
To evaluate the ability of the PLS analysis to discriminate between the ASD and TD groups, PLS-DA was performed using information from the LV derived from the PLS analysis. The analysis using the LV information showed sufficiently high accuracy, sensitivity, specificity, and precision (all >80%) compared with the analysis using the whole brain voxels as input information (Figure 3).
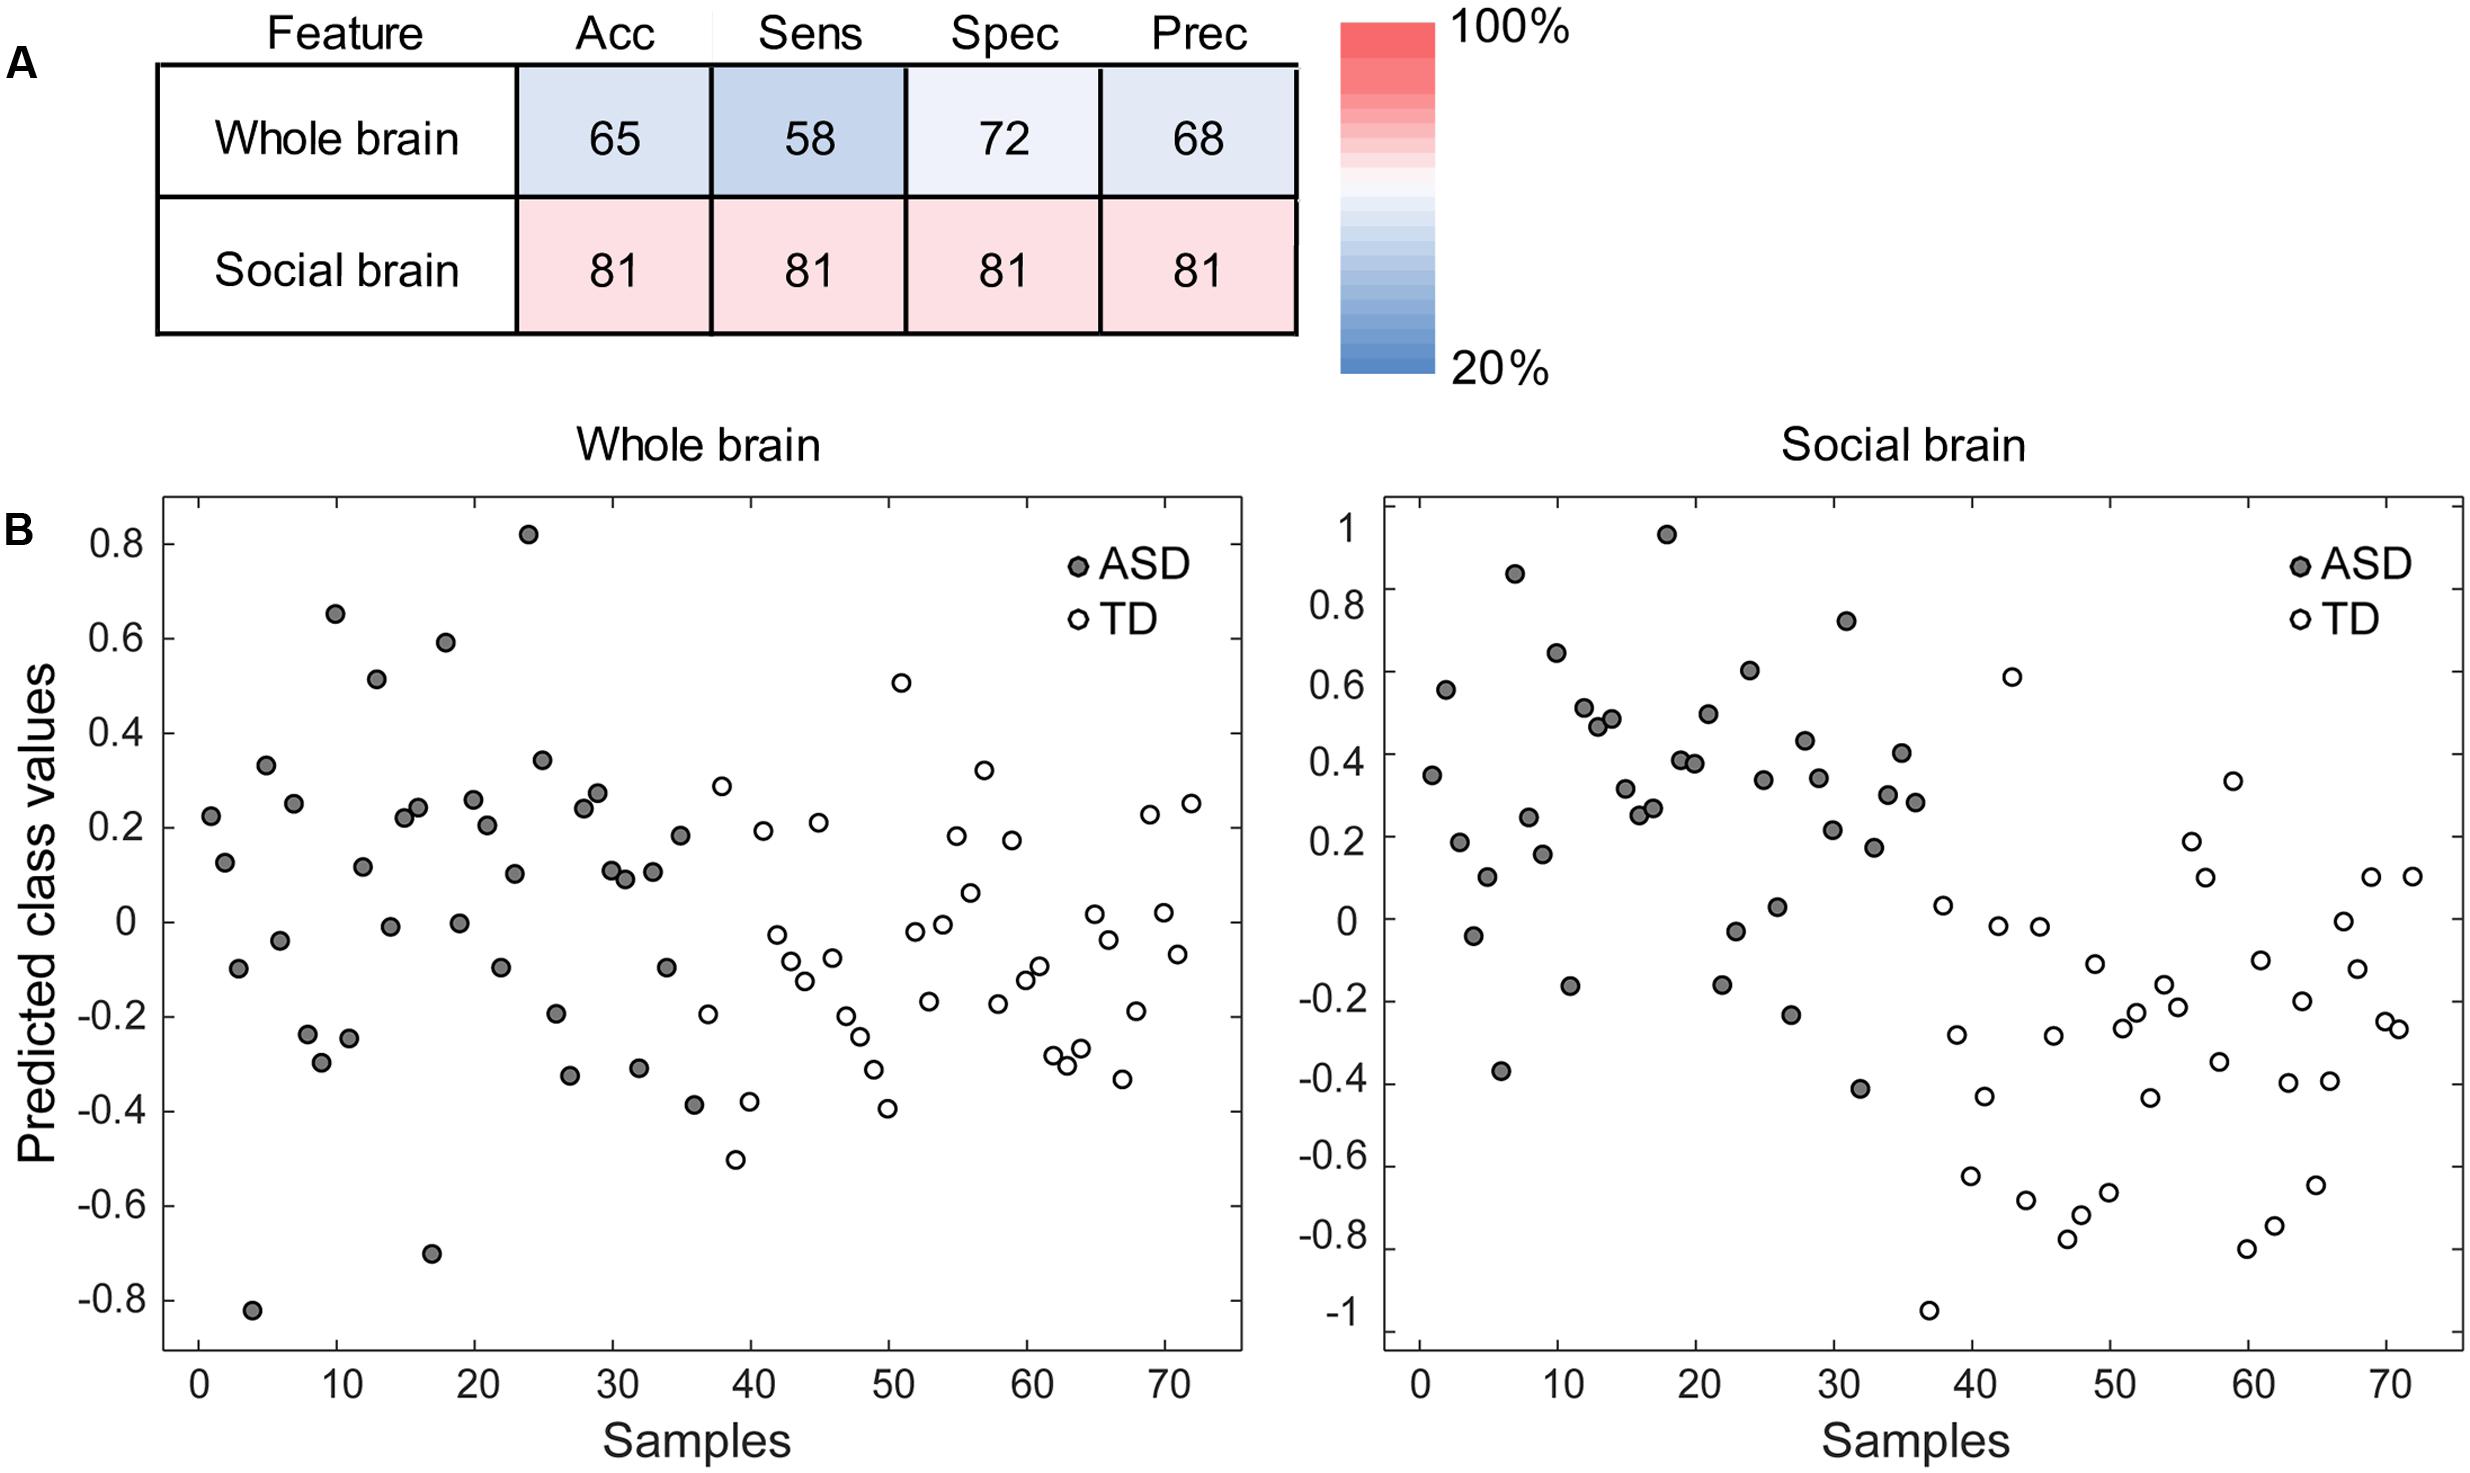
FIGURE 3. Performance of the partial least squares (PLS) discriminant analysis (PLS-DA). (A) The accuracy (Acc), sensitivity (Sens), specificity (Spec), and precision (Prec) of the analysis using the whole brain voxels (the baseline condition; upper) and those of the analysis using the gray matter voxels in the PLS latent variable (i.e., the social brain network; lower) are shown. The red–blue color indicates the percentage. (B) The discrimination plots for each participant in the autism spectrum disorder (ASD) and typically developing (TD) groups in the PLS-DA using the whole brain voxels (left) and social brain network voxels (right). The x-axis represents individual participants, and the y-axis represents the predicted class values that were estimated during the cross-validation. The more positive (or negative) the value on the y-axis, the better the discrimination performance for the ASD (or TD) group.
Relationship between Regional/Network-Level Gray Matter Volume and Symptom Severity
To explore the relationship between ASD symptom severity and the reduction in the regional/network-level gray matter volume identified by the above VBM/PLS analyses, we performed general linear model analyses using the total CARS score or social CARS score as the effect-of-interest independent variable. The effects of age and sex were covariated out. However, VBM analysis did not detect any significant association between the total/social CARS score and regional gray matter volume in the ASD group. The general linear model using the PLS brain score as the dependent variable also did not show a significant association between the total/social CARS score and the reduction in network-level gray matter.
Discussion
Our univariate VBM analysis revealed that gray matter volume in several brain regions was reduced in the ASD adult group compared with the TD adult group. These regions included the IOG, FG, MTG, amygdala, IFG, OFC, and DMPFC. Since these regions are considered to be the social brain regions (Brothers et al., 1990; Adolphs, 2003; Blakemore, 2008), our results are consistent with the theoretical proposal that social brain regions are impaired in ASD (Emery and Perrett, 2000; Johnson et al., 2005; Frith, 2007; Pelphrey and Carter, 2008). The results are also in line with those of several previous functional neuroimaging studies reporting reduced activities in these regions during the processing of social stimuli among individuals with ASD. For example, Sato et al. (2012) reported reduced activity in the IOG, FG, MTG, amygdala, IFG, and DMPFC among ASD compared with TD participants during the observation of dynamic facial expressions. Our results are also consistent with the findings of several previous structural MRI studies that tested adults with ASD and reported reduced gray matter volume in these regions (Abell et al., 1999; Hadjikhani et al., 2006; Craig et al., 2007; Toal et al., 2010; Scheel et al., 2011; Ecker et al., 2012; Mueller et al., 2013). For example, Abell et al. (1999) reported reduced gray matter volume in an ASD compared with a TD group in the DMPFC. However, only a few studies have reported problems in multiple social brain regions, and few of these have applied a correction for multiple comparisons (Duerden et al., 2012; Yang et al., 2016). In the current study, we used a correction for multiple comparisons, thereby providing robust evidence. Although several previous studies have reported null findings, the discrepancy between those studies and the present results may be explained by differences in the ASD group sampled. We evaluated only individuals who were diagnosed with Asperger’s disorder or a milder type of PDD-NOS. Therefore, we controlled for the effect of language impairments, which could strongly affect gray matter structures in widespread brain regions (Lai et al., 2015; Sharda et al., 2017). In addition, we controlled for other confounding factors, such as comorbidities and medications, which have not been controlled for or reported in some previous studies. Furthermore, the size of our ASD group was relatively large compared with those of several previous studies. Although the present exploratory analysis did not find a significant effect of ASD subgroup, the profiles of the adjusted gray matter volume in some social brain regions showed lower values in the Asperger’s disorder group than in the PDD-NOS group. This result is consistent with the clinical conditions, such as the PDD-NOS group exhibiting milder ASD symptoms than the Asperger’s disorder group, and suggests the involvement of these regions in ASD symptoms. Taken together, the present study accounted for several potential confounding factors, including language impairments, and showed that a decrease in gray matter volume in social brain regions is partly responsible for ASD.
Furthermore, our multivariate PLS analysis revealed that the network (i.e., the sets of correlated voxels) showed decreased gray matter volume in the ASD relative to the TD group. The network included all the brain regions related to the processing of social stimuli, suggesting that the network represents the social brain network. The correspondence between the results of the VBM and PLS analyses does not always occur because voxels can show an overall decrease without being correlated across individuals. The PLS-DA confirmed that our approach clearly discriminated between the ASD and TD groups. These results are consistent with the notion that the network of the social brain regions is impaired in ASD (Emery and Perrett, 2000; Johnson et al., 2005; Frith, 2007; Pelphrey and Carter, 2008). These results are also consistent with those of several functional neuroimaging studies that have reported reduced functional connectivity in individuals with ASD while engaging in some social tasks, such as facial expression processing (Welchew et al., 2005; Wicker et al., 2008; Sato et al., 2012), face perception (Kleinhans et al., 2008; Koshino et al., 2008; Hoffmann et al., 2016; Lynn et al., 2016), and mindreading (Castelli et al., 2002). However, structural neuroimaging evidence has been lacking. To our knowledge, this is the first reported structural neuroimaging evidence showing reduced gray matter volume in the social brain network in adults with ASD.
Our result showing that the gray matter volume in the social brain network is reduced in adults with ASD has theoretical and practical implications. Theoretically, the network includes widespread brain regions, which are assumed to serve to different functions, such as perception (the IOG, FG, and MTG; Haxby et al., 2000), emotion (the amygdala and OFC; Calder et al., 2001; Rolls, 2004), motor (the IFG; Rizzolatti et al., 2001), and cognition (the DMPFC; Frith and Frith, 2003). Regarding the behavioral and/or neural mechanisms underlying social malfunctioning in ASD, several theories have been proposed. For example, at a behavioral level, whereas some researchers have pointed out the importance of emotional deficits in individuals with ASD, such as empathic responding (Hobson, 2002), other researchers have proposed impairment in cognitive processing, such as mindreading (Baron-Cohen et al., 1985). At a neural level, researchers proposed that the structural and/or functional abnormalities may be found in the perceptual (Grelotti et al., 2002), emotional (Bachevalier, 1994), motor (Williams et al., 2001), or cognitive (Frith, 2001) processing-related brain regions in individuals with ASD. The present findings suggest that these divergent social processes are related and are collectively impaired in ASD. Given that social stimuli are complex in nature, it is possible that processing them requires coordination of multiple different computations, which may be holistically difficult in individuals with ASD.
Practically, our results suggest that structural MRI can provide neuroimaging-based biomarkers for ASD. It has been pointed out that such biomarkers could be clinically useful in complementing or improving the behavioral diagnosis of ASD (Walsh et al., 2011). Additionally, the idea of social brain network impairment in ASD suggests that behavioral social malfunctioning in individuals with ASD may be modified by neural or behavioral treatments targeting these social brain regions. Consistent with this, previous studies have reported that electrical stimulation of the amygdala (Sturm et al., 2013) and magnetic stimulation of the OFC (Enticott et al., 2014) modified the behavioral social problems in individuals with ASD. Behavioral training in facial expression communication in individuals with ASD reportedly improved their expression recognition performance and increased neural activity in several social brain regions, such as the MTG and amygdala, during their observation of facial expressions (Bölte et al., 2015). Training in facial communication in TD individuals also increased the gray matter volume in the FG (Kreifelts et al., 2013). Promising directions for further investigation include such practical applications based on the impaired social brain network theory of ASD.
Several limitations to this study should be acknowledged. First, inconsistent with our prediction, an association between the total/social CARS score and decrease in the regional/network-level gray matter volume in the ASD group was not observed. This null finding may be explained by the items included in the CARS. Although the CARS is reliable and valid and one of the most commonly used scales used to evaluate the degree and profiles of ASD (Koyama et al., 2007), it was not developed specifically to quantify the severity of social malfunctioning in individuals with ASD. The use of different assessment tools more specific to social functioning in ASD, such as the social responsiveness scale (Constantino et al., 2003), may be more appropriate for future studies.
Second, because we tested only adult participants, the developmental trajectory of the reduced gray matter volume in the social brain network in ASD remains unknown. Some structural MRI studies in children with ASD have reported the atypical development of global and/or local brain volume (for a review, see Sacco et al., 2015). Based on these data, some researchers proposed theoretical models regarding the atypical development of the social brain network in ASD (e.g., Chevallier et al., 2012; Elsabbagh and Johnson, 2016), but there has been little empirical investigation. Future studies are necessary to investigate the structural development of the social brain network in ASD.
In summary, our VBM analysis showed that the regional gray matter volume was lower in several brain regions in the ASD compared with the TD group, including the IOG, FG, MTG, amygdala, IFG, OFC, and DMPFC. Furthermore, our PLS analysis and PLS-DA revealed a widespread network including these regions discriminated the groups. These results suggest that reduced gray matter volume in the social brain network represents the neural underpinnings of behavioral social malfunctioning in adults with ASD.
Author Contributions
WS, TK, SU, and MT designed the research; WS, TK, SU, SY, YK, RS, MS, and MT obtained the data; WS, TK, SU, SY, and MT analyzed the data; and all authors wrote the manuscript. All authors read and approved the final manuscript.
Funding
This study was supported by funds from the Japan Society for the Promotion of Science Funding Program for Next Generation World-Leading Researchers (LZ008) and from the Organization for Promoting Neurodevelopmental Disorder Research.
Conflict of Interest Statement
The authors declare that the research was conducted in the absence of any commercial or financial relationships that could be construed as a potential conflict of interest.
Acknowledgment
The authors thank Emi Yokoyama, Akemi Inoue, and Kazusa Minemoto for their technical support.
Supplementary Material
The Supplementary Material for this article can be found online at: https://www.frontiersin.org/article/10.3389/fnhum.2017.00395/full#supplementary-material
FIGURE S1 | Mean (with SE) adjusted gray matter volume in the Asperger’s disorder (ASP), pervasive developmental disorder not otherwise specified (NOS), and typically developing (TD) groups. Values of the peak voxels showing significantly reduced gray matter volume in the autism spectrum disorder group compared with the TD group are shown. The effects of no interest (sex and age) were cavaried out.
Footnotes
- ^http://www.fil.ion.ucl.ac.uk/spm
- ^http://dbm.neuro.uni-jena.de
- ^http://www.brain-development.org
- ^https://fsl.fmrib.ox.ac.uk/fsl/fslwiki/PALM
- ^http://www.mccauslandcenter.sc.edu/mricro/mricron/
- ^http://www.fz-juelich.de/inm/inm-1/DE/Forschung/_docs/SPMAnatomyToolbox/SPMAnatomyToolbox_node.html
- ^http://www.rotman-baycrest.on.ca/pls/
References
Abell, F., Krams, M., Ashburner, J., Passingham, R., Friston, K., Frackowiak, R., et al. (1999). The neuroanatomy of autism: a voxel-based whole brain analysis of structural scans. Neuroreport 10, 1647–1651. doi: 10.1097/00001756-199906030-00005
Adolphs, R. (2003). Cognitive neuroscience of human social behaviour. Nat. Rev. Neurosci. 4, 165–178. doi: 10.1038/nrn1056
Allison, T., Puce, A., and McCarthy, G. (2000). Social perception from visual cues: role of the STS region. Trends. Cogn. Sci. 4, 267–278. doi: 10.1016/S1364-6613(00)01501-1
American Psychiatric Association (2000). Diagnostic and Statistical Manual of Mental Disorders, 4th Edn. Washington, DC: American Psychiatric Association, 943.
American Psychiatric Association (2013). Diagnostic and Statistical Manual of Mental Disorders, 5th Edn. Arlington, VA: American Psychiatric Publishing, 992. doi: 10.1176/appi.books.9780890425596
Ashburner, J. (2007). A fast diffeomorphic image registration algorithm. Neuroimage 38, 95–113. doi: 10.1016/j.neuroimage.2007.07.007
Ashwin, C., Baron-Cohen, S., Wheelwright, S., O’Riordan, M., and Bullmore, E. T. (2007). Differential activation of the amygdala and the ‘social brain’ during fearful face-processing in Asperger Syndrome. Neuropsychologia 45, 2–14. doi: 10.1016/j.neuropsychologia.2006.04.014
Bachevalier, J. (1994). Medial temporal lobe structures and autism: a review of clinical and experimental findings. Neuropsychologia 32, 627–648. doi: 10.1016/0028-3932(94)90025-6
Bachevalier, J., and Loveland, K. A. (2006). The orbitofrontal–amygdala circuit and self-regulation of social–emotional behavior in autism. Neurosci. Biobehav. Rev. 30, 97–117. doi: 10.1016/j.neubiorev.2005.07.002
Balardin, J. B., Sato, J. R., Vieira, G., Feng, Y., Daly, E., Murphy, C., et al. (2015). Relationship between surface-based brain morphometric measures and intelligence in autism spectrum disorders: influence of history of language delay. Autism Res. 8, 556–566. doi: 10.1002/aur.1470
Ballabio, D., and Consonni, V. (2013). Classification tools in chemistry. Part 1: linear models. PLS-DA. Anal. Methods 5, 3790–3798. doi: 10.1039/C3AY40582F
Barker, M., and Rayens, W. (2003). Partial least squares for discrimination. J. Chemometr. 17, 166–173. doi: 10.1002/cem.785
Baron-Cohen, S., Leslie, A. M., and Frith, U. (1985). Does the autistic child have a “theory of mind”? Cognition 21, 37–46. doi: 10.1016/0010-0277(85)90022-8
Baron-Cohen, S., Ring, H. A., Wheelwright, S., Bullmore, E. T., Brammer, M. J., Simmons, A., et al. (1999). Social intelligence in the normal and autistic brain: an fMRI study. Eur. J. Neurosci. 11, 1891–1898. doi: 10.1046/j.1460-9568.1999.00621.x
Baron-Cohen, S., Wheelwright, S., Hill, J., Raste, Y., and Plumb, I. (2001). The “Reading the Mind in the Eyes” Test revised version: a study with normal adults, and adults with Asperger syndrome or high-functioning autism. J. Child Psychol. Psychiatry 42, 241–251. doi: 10.1111/1469-7610.00715
Bernhardt, B. C., Valk, S. L., Silani, G., Bird, G., Frith, U., and Singer, T. (2014). Selective disruption of sociocognitive structural brain networks in autism and alexithymia. Cereb. Cortex 24, 3258–3267. doi: 10.1093/cercor/bht182
Blakemore, S. J. (2008). The social brain in adolescence. Nat. Rev. Neurosci. 9, 267–277. doi: 10.1038/nrn2353
Bölte, S., Ciaramidaro, A., Schlitt, S., Hainz, D., Kliemann, D., Beyer, A., et al. (2015). Training-induced plasticity of the social brain in autism spectrum disorder. Br. J. Psychiatry 207, 149–157. doi: 10.1192/bjp.bp.113.143784
Boucher, J. (2012). Research review: structural language in autistic spectrum disorder - characteristics and causes. J. Child Psychol. Psychiatry 53, 219–233. doi: 10.1111/j.1469-7610.2011.02508.x
Brothers, L., Ring, B., and Kling, A. (1990). Response of neurons in the macaque amygdala to complex social stimuli. Behav. Brain Res. 41, 199–213. doi: 10.1016/0166-4328(90)90108-Q
Calder, A. J., Lawrence, A. D., and Young, A. W. (2001). Neuropsychology of fear and loathing. Nat. Rev. Neurosci. 2, 352–363. doi: 10.1038/35072584
Castelli, F., Frith, C., Happé, F., and Frith, U. (2002). Autism, Asperger syndrome and brain mechanisms for the attribution of mental states to animated shapes. Brain 125, 1839–1849. doi: 10.1093/brain/awf189
Chevallier, C., Kohls, G., Troiani, V., Brodkin, E. S., and Schultz, R. T. (2012). The social motivation theory of autism. Trends Cogn. Sci. 16, 231–239. doi: 10.1016/j.tics.2012.02.007
Chumbley, J. R., and Friston, K. J. (2009). False discovery rate revisited: FDR and topological inference using Gaussian random fields. Neuroimage 44, 62–70. doi: 10.1016/j.neuroimage.2008.05.021
Constantino, J. N., Davis, S. A., Todd, R. D., Schindler, M. K., Gross, M. M., Brophy, S. L., et al. (2003). Validation of a brief quantitative measure of autistic traits: comparison of the social responsiveness scale with the autism diagnostic interview-revised. J. Autism Dev. Disord. 33, 427–433. doi: 10.1023/A:1025014929212
Craig, M. C., Zaman, S. H., Daly, E. M., Cutter, W. J., Robertson, D. M., Hallahan, B., et al. (2007). Women with autistic-spectrum disorder: magnetic resonance imaging study of brain anatomy. Br. J. Psychiatry 191, 224–228. doi: 10.1192/bjp.bp.106.034603
Critchley, H. D., Daly, E. M., Bullmore, E. T., Williams, S. C., Van Amelsvoort, T., Robertson, D. M., et al. (2000). The functional neuroanatomy of social behaviour: changes in cerebral blood flow when people with autistic disorder process facial expressions. Brain 123, 2203–2212. doi: 10.1093/brain/123.11.2203
Dapretto, M., Davies, M. S., Pfeifer, J. H., Scot, A. A., Sigman, M., Bookheimer, S. Y., et al. (2006). Understanding emotions in others: mirror neuron dysfunction in children with autism spectrum disorders. Nat. Neurosci. 9, 28–30. doi: 10.1038/nn1611
Deeley, Q., Daly, E. M., Surguladze, S., Page, L., Toal, F., Robertson, D., et al. (2007). An event related functional magnetic resonance imaging study of facial emotion processing in Asperger syndrome. Biol. Psychiatry 62, 207–217. doi: 10.1016/j.biopsych.2006.09.037
Duerden, E. G., Mak-Fan, K. M., Taylor, M. J., and Roberts, S. W. (2012). Regional differences in grey and white matter in children and adults with autism spectrum disorders: an activation likelihood estimate (ALE) meta-analysis. Autism Res. 5, 49–66. doi: 10.1002/aur.235
Dziobek, I., Bahnemann, M., Convit, A., and Heekeren, H. R. (2010). The role of the fusiform-amygdala system in the pathophysiology of autism. Arch. Gen. Psychiatry 67, 397–405. doi: 10.1001/archgenpsychiatry.2010.31
Ecker, C., Ginestet, C., Feng, Y., Johnston, P., Lombardo, M. V., Lai, M. C., et al. (2013). Brain surface anatomy in adults with autism: the relationship between surface area, cortical thickness, and autistic symptoms. JAMA Psychiatry 70, 59–70. doi: 10.1001/jamapsychiatry.2013.265
Ecker, C., Suckling, J., Deoni, S. C., Lombardo, M. V., Bullmore, E. T., Baron-Cohen, S., et al. (2012). Brain anatomy and its relationship to behavior in adults with autism spectrum disorder: a multicenter magnetic resonance imaging study. Arch. Gen. Psychiatry 69, 195–209. doi: 10.1001/archgenpsychiatry.2011.1251
Eickhoff, S. B., Stephan, K. E., Mohlberg, H., Grefkes, C., Fink, G. R., Amunts, K., et al. (2005). A new SPM toolbox for combining probabilistic cytoarchitectonic maps and functional imaging data. Neuroimage 25, 1325–1335. doi: 10.1016/j.neuroimage.2004.12.034
Eklund, A., Nichols, T. E., and Knutsson, H. (2016). Cluster failure: why fMRI inferences for spatial extent have inflated false-positive rates. Proc. Natl. Acad. Sci. U.S.A. 113, 7900–7905. doi: 10.1073/pnas.1602413113
Elsabbagh, M., and Johnson, M. H. (2016). Autism and the social brain: the first-year puzzle. Biol. Psychiatry 80, 94–99. doi: 10.1016/j.biopsych.2016.02.019
Emery, N. J., and Perrett, D. I. (2000). “How can studies of the monkey brain help us understand “theory of mind” and autism in humans,” in Understanding Other Minds: Perspectives from Developmental Cognitive Neuroscience, 2nd Edn, eds S. Baron-Cohen, H. Tager-Flusberg, and D. J. Cohen (Oxford: Oxford University Press), 274–305.
Enticott, P. G., Fitzgibbon, B. M., Kennedy, H. A., Arnold, S. L., Elliot, D., Peachey, A., et al. (2014). A double-blind, randomized trial of deep repetitive transcranial magnetic stimulation (rTMS) for autism spectrum disorder. Brain Stimul. 7, 206–211. doi: 10.1016/j.brs.2013.10.004
Frith, C. D. (2007). The social brain? Philos. Trans. R. Soc. Lond. B Biol. Sci. 362, 671–678. doi: 10.1098/rstb.2006.2003
Frith, U. (2001). Mind blindness and the brain in autism. Neuron 32, 969–979. doi: 10.1016/S0896-6273(01)00552-9
Frith, U., and Frith, C. D. (2003). Development and neurophysiology of mentalizing. Philos. Trans. R. Soc. Lond. B Biol. Sci. 358, 459–473. doi: 10.1098/rstb.2002.1218
Gebauer, L., Foster, N. E. V., Vuust, P., and Hyde, K. L. (2015). Is there a bit of autism in all of us? Autism spectrum traits are related to cortical thickness differences in both autism and typical development. Res. Autism Spectr. Disord. 13, 8–14. doi: 10.1016/j.rasd.2014.12.013
Grelotti, D. J., Gauthier, I., and Schultz, R. T. (2002). Social interest and the development of cortical face specialization: what autism teaches us about face processing. Dev. Psychobiol. 40, 213–225. doi: 10.1002/dev.10028
Hadjikhani, N., Joseph, R. M., Snyder, J., and Tager-Flusberg, H. (2006). Anatomical differences in the mirror neuron system and social cognition network in autism. Cereb. Cortex 16, 1276–1282. doi: 10.1093/cercor/bhj069
Hall, G. B., Szechtman, H., and Nahmias, C. (2003). Enhanced salience and emotion recognition in Autism: A PET study. Am. J. Psychiatry 160, 1439–1441. doi: 10.1176/appi.ajp.160.8.1439
Haxby, J. V., Hoffman, E. A., and Gobbini, M. I. (2000). The distributed human neural system for face perception. Trends Cogn. Sci. 4, 223–233. doi: 10.1016/S1364-6613(00)01482-0
Hayasaka, S., Phan, K. L., Liberzon, I., Worsley, K. J., and Nichols, T. E. (2004). Nonstationary cluster-size inference with random field and permutation methods. Neuroimage 22, 676–687. doi: 10.1016/j.neuroimage.2004.01.041
Hoffmann, E., Brük, C., Kreifelts, B., Ethofer, T., and Wildgruber, D. (2016). Reduced functional connectivity to the frontal cortex during processing of social cues in autism spectrum disorder. J. Neural Transm. 123, 937–947. doi: 10.1007/s00702-016-1544-3
Itahashi, T., Yamada, T., Nakamura, M., Watanabe, H., Yamagata, B., Jimbo, D., et al. (2015). Linked alterations in gray and white matter morphology in adults with high-functioning autism spectrum disorder: a multimodal brain imaging study. Neuroimage Clin. 7, 155–169. doi: 10.1016/j.nicl.2014.11.019
Johnson, M. H., Griffin, R., Csibra, G., Halit, H., Farroni, T., de Haan, M., et al. (2005). The emergence of the social brain network: evidence from typical and atypical development. Dev. Psychopathol. 17, 599–619. doi: 10.1017/S0954579405050297
Kaiser, M. D., Hudac, C. M., Shultz, S., Lee, S. M., Cheung, C., Berken, A. M., et al. (2010). Neural signatures of autism. Proc. Natl. Acad. Sci. U.S.A. 107, 21223–21228. doi: 10.1073/pnas.1010412107
Kana, R. K., Keller, T. A., Cherkassky, V. L., Minshew, N. J., and Just, M. A. (2009). Atypical frontal-posterior synchronization of Theory of Mind regions in autism during mental state attribution. Soc. Neurosci. 4, 135–152. doi: 10.1080/17470910802198510
Kleinhans, N. M., Richards, T., Sterling, L., Stegbauer, K. C., Mahurin, R., Johnson, L. C., et al. (2008). Abnormal functional connectivity in autism spectrum disorders during face processing. Brain 131, 1000–1012. doi: 10.1093/brain/awm334
Koshino, H., Kana, R. K., Keller, T. A., Cherkassky, V. L., Minshew, N. J., and Just, M. A. (2008). fMRI investigation of working memory for faces in autism: visual coding and underconnectivity with frontal areas. Cereb. Cortex 18, 289–300. doi: 10.1093/cercor/bhm054
Koyama, T., Tachimori, H., Osada, H., Takeda, T., and Kurita, H. (2007). Cognitive and symptom profiles in Asperger’s syndrome and high-functioning autism. Psychiatry Clin. Neurosci. 61, 99–104. doi: 10.1111/j.1440-1819.2007.01617.x
Kreifelts, B., Jacob, H., Brük, C., Erb, M., Ethofer, T., and Wildgruber, D. (2013). Non-verbal emotion communication training induces specific changes in brain function and structure. Front. Hum. Neurosci. 7:648. doi: 10.3389/fnhum.2013.00648
Krishnan, A., Williams, L. J., McIntosh, A. R., and Abdi, H. (2011). Partial Least Squares (PLS) methods for neuroimaging: a tutorial and review. Neuroimage 56, 455–475. doi: 10.1016/j.neuroimage.2010.07.034
Kwon, H., Ow, A. W., Pedatella, K. E., Lotspeich, L. J., and Reiss, A. L. (2004). Voxel-based morphometry elucidates structural neuroanatomy of high-functioning autism and Asperger syndrome. Dev. Med. Child Neurol. 46, 760–764. doi: 10.1111/j.1469-8749.2004.tb00996.x
Lai, M. C., Lombardo, M. V., Ecker, C., Chakrabarti, B., Suckling, J., Bullmore, E. T., et al. (2015). Neuroanatomy of individual differences in language in adult males with autism. Cereb. Cortex 25, 3613–3628. doi: 10.1093/cercor/bhu211
Lai, M. C., Lombardo, M. V., Suckling, J., Ruigrok, A. N., Chakrabarti, B., Ecker, C., et al. (2013). Biological sex affects the neurobiology of autism. Brain 136, 2799–2815. doi: 10.1093/brain/awt216
Libero, L. E., DeRamus, T. P., Lahti, A. C., Deshpande, G., and Kana, R. K. (2015). Multimodal neuroimaging based classification of autism spectrum disorder using anatomical, neurochemical, and white matter correlates. Cortex 66, 46–59. doi: 10.1016/j.cortex.2015.02.008
Lynn, A. C., Padmanabhan, A., Simmonds, D., Foran, W., Hallquist, M. N., Luna, B., et al. (2016). Functional connectivity differences in autism during face and car recognition: underconnectivity and atypical age-related changes. Dev. Sci. doi: 10.1111/desc.12508 [Epub ahead of print].
Magyar, C. I., and Pandolfi, V. (2007). Factor structure evaluation of the childhood autism rating scale. J. Autism Dev. Disord. 37, 1787–1794. doi: 10.1007/s10803-006-0313-9
Manjón, J. V., Coupé, P., Martí-Bonmatí, L., Collins, D. L., and Robles, M. (2010). Adaptive non-local means denoising of MR images with spatially varying noise levels. J. Magn. Reson. Imaging 31, 192–203. doi: 10.1002/jmri.22003
McAlonan, G. M., Daly, E., Kumari, V., Critchley, H. D., Van Amelsvoort, T., Suckling, J., et al. (2002). Brain anatomy and sensorimotor gating in Asperger’s syndrome. Brain 125, 1594–1606. doi: 10.1093/brain/awf150
McAlonan, G. M., Suckling, J., Wong, N., Cheung, V., Lienenkaemper, N., Cheung, C., et al. (2008). Distinct patterns of grey matter abnormality in high-functioning autism and Asperger’s syndrome. J. Child Psychol. Psychiatry 49, 1287–1295. doi: 10.1111/j.1469-7610.2008.01933.x
McIntosh, A. R., Bookstein, F. L., Haxby, J. V., and Grady, C. L. (1996). Spatial pattern analysis of functional brain images using partial least squares. Neuroimage 3, 143–157. doi: 10.1006/nimg.1996.0016
McIntosh, A. R., and Lobaugh, N. J. (2004). Partial least squares analysis of neuroimaging data: applications and advances. Neuroimage 23, 250–263. doi: 10.1016/j.neuroimage.2004.07.020
Mesibov, G. B., Schopler, E., Schaffer, B., and Michal, N. (1989). Use of the childhood autism rating scale with autistic adolescents and adults. J. Am. Acad. Child Adolesc. Psychiatry 28, 538–541. doi: 10.1097/00004583-198907000-00012
Mody, M., and Belliveau, J. W. (2013). Speech and language impairments in autism: insights from behavior and neuroimaging. N. Am. J. Med. Sci. 5, 157–161. doi: 10.7156/v5i3p157
Mueller, S., Keeser, D., Samson, A. C., Kirsch, V., Blautzik, J., Grothe, M., et al. (2013). Convergent findings of altered functional and structural brain connectivity in individuals with high functioning autism: a multimodal MRI study. PLoS ONE 8:e67329. doi: 10.1371/journal.pone.0067329
Nickl-Jockschat, T., Habel, U., Michel, T. M., Manning, J., Laird, A. R., Fox, P. T., et al. (2012). Brain structure anomalies in autism spectrum disorder–a meta-analysis of VBM studies using anatomic likelihood estimation. Hum. Brain Mapp. 33, 1470–1489. doi: 10.1002/hbm.21299
Nickl-Jockschat, T., Rottschy, C., Thommes, J., Schneider, F., Laird, A. R., Fox, P. T., et al. (2015). Neural networks related to dysfunctional face processing in autism spectrum disorder. Brain Struct. Funct. 220, 2355–2371. doi: 10.1007/s00429-014-0791-z
Pelphrey, K. A., and Carter, E. J. (2008). Charting the typical and atypical development of the social brain. Dev. Psychopathol. 20, 1081–1102. doi: 10.1017/S0954579408000515
Pelphrey, K. A., Morris, J. P., and McCarthy, G. (2005). Neural basis of eye gaze processing deficits in autism. Brain 128, 1038–1048. doi: 10.1093/brain/awh404
Philip, R. C., Dauvermann, M. R., Whalley, H. C., Baynham, K., Lawrie, S. M., and Stanfield, A. C. (2012). A systematic review and meta-analysis of the fMRI investigation of autism spectrum disorders. Neurosci. Biobehav. Rev. 36, 901–942. doi: 10.1016/j.neubiorev.2011.10.008
Pierce, K., Haist, F., Sedaghat, F., and Courchesne, E. (2004). The brain response to personally familiar faces in autism: findings of fusiform activity and beyond. Brain 127, 2703–2716. doi: 10.1093/brain/awh289
Pierce, K., Müller, R. A., Ambrose, J., Allen, G., and Courchesne, E. (2001). Face processing occurs outside the fusiform ‘face area’ in autism: evidence from functional MRI. Brain 124, 2059–2073. doi: 10.1093/brain/124.10.2059
Rajapakse, J. C., Giedd, J. N., and Rapoport, J. L. (1997). Statistical approach to segmentation of single-channel cerebral MR images. IEEE Trans. Med. Imaging 16, 176–186. doi: 10.1109/42.563663
Riedel, A., Maier, S., Ulbrich, M., Biscaldi, M., Ebert, D., Fangmeier, T., et al. (2014). No significant brain volume decreases or increases in adults with high-functioning autism spectrum disorder and above average intelligence: a voxel-based morphometric study. Psychiatry Res. 223, 67–74. doi: 10.1016/j.pscychresns.2014.05.013
Rizzolatti, G., Fogassi, L., and Gallese, V. (2001). Neurophysiological mechanisms underlying the understanding and imitation of action. Nat. Rev. Neurosci. 2, 661–670. doi: 10.1038/35090060
Rolls, E. T. (2004). The functions of the orbitofrontal cortex. Brain Cogn. 55, 11–29. doi: 10.1016/S0278-2626(03)00277-X
Rudebeck, P. H., and Murray, E. A. (2011). Balkanizing the primate orbitofrontal cortex: distinct subregions for comparing and contrasting values. Ann. N. Y. Acad. Sci. 1239, 1–13. doi: 10.1111/j.1749-6632.2011.06267.x
Sacco, R., Gabriele, S., and Persico, A. M. (2015). Head circumference and brain size in autism spectrum disorder: a systematic review and meta-analysis. Psychiatry Res. 234, 239–251. doi: 10.1016/j.pscychresns.2015.08.016
Sato, W., Toichi, M., Uono, S., and Kochiyama, T. (2012). Impaired social brain network for processing dynamic facial expressions in autism spectrum disorders. BMC Neurosci. 13:99. doi: 10.1186/1471-2202-13-99
Scheel, C., Rotarska-Jagiela, A., Schilbach, L., Lehnhardt, F. G., Krug, B., Vogeley, K., et al. (2011). Imaging derived cortical thickness reduction in high-functioning autism: key regions and temporal slope. Neuroimage 58, 391–400. doi: 10.1016/j.neuroimage.2011.06.040
Scherf, K. S., Luna, B., Minshew, N., and Behrmann, M. (2010). Location, location, location: alterations in the functional topography of face- but not object- or place-related cortex in adolescents with autism. Front. Hum. Neurosci. 4:26. doi: 10.3389/fnhum.2010.00026
Schmitz, N., Rubia, K., Daly, E., Smith, A., Williams, S., and Murphy, D. G. (2006). Neural correlates of executive function in autistic spectrum disorders. Biol. Psychiatry 59, 7–16. doi: 10.1016/j.biopsych.2005.06.007
Schmitz, N., Rubia, K., van Amelsvoort, T., Daly, E., Smith, A., and Murphy, D. G. (2008). Neural correlates of reward in autism. Br. J. Psychiatry 192, 19–24. doi: 10.1192/bjp.bp.107.036921
Schopler, E., Reichler, R. J., and Renner, B. R. (1986). The Childhood Autism Rating Scale (CARS): For Diagnostic Screening and Classification of Autism. New York, NY: Irvington, 63.
Schultz, R. T., Gauthier, I., Klin, A., Fulbright, R. K., Anderson, A. W., Volkmar, F., et al. (2000). Abnormal ventral temporal cortical activity during face discrimination among individuals with autism and Asperger syndrome. Arch. Gen. Psychiatry 57, 331–340. doi: 10.1001/archpsyc.57.4.331
Sharda, M., Foster, N. E., Tryfon, A., Doyle-Thomas, K. A., Ouimet, T., Anagnostou, E., et al. (2017). Language ability predicts cortical structure and covariance in boys with autism spectrum disorder. Cereb. Cortex 27, 1849–1862. doi: 10.1093/cercor/bhw024
Sheehan, D. V., Lecrubier, Y., Sheehan, K. H., Amorim, P., Janavs, J., Weiller, E., et al. (1998). The Mini-International Neuropsychiatric Interview (M.I.N.I.): the development and validation of a structured diagnostic psychiatric interview for DSM-IV and ICD-10. J. Clin. Psychiatry 59, 22–33.
Smith, S. M., and Nichols, T. E. (2009). Threshold-free cluster enhancement: addressing problems of smoothing, threshold dependence and localisation in cluster inference. Neuroimage 44, 83–98. doi: 10.1016/j.neuroimage.2008.03.061
Sturm, V., Fricke, O., Bührle, C. P., Lenartz, D., Maarouf, M., Treuer, H., et al. (2013). DBS in the basolateral amygdala improves symptoms of autism and related self-injurious behavior: a case report and hypothesis on the pathogenesis of the disorder. Front. Hum. Neurosci. 6:341. doi: 10.3389/fnhum.2012.00341
Toal, F., Daly, E. M., Page, L., Deeley, Q., Hallahan, B., Bloemen, O., et al. (2010). Clinical and anatomical heterogeneity in autistic spectrum disorder: a structural MRI study. Psychol. Med. 40, 1171–1181. doi: 10.1017/S0033291709991541
Tohka, J., Zijdenbos, A., and Evans, A. (2004). Fast and robust parameter estimation for statistical partial volume models in brain MRI. Neuroimage 23, 84–97. doi: 10.1016/j.neuroimage.2004.05.007
Trepagnier, C., Sebrechts, M. M., and Peterson, R. (2002). Atypical face gaze in autism. Cyberpsychol. Behav. 5, 213–217. doi: 10.1089/109493102760147204
Tzourio-Mazoyer, N., De Schonen, S., Crivello, F., Reutter, B., Aujard, Y., and Mazoyer, B. (2002). Neural correlates of woman face processing by 2-month-old infants. Neuroimage 15, 454–461. doi: 10.1006/nimg.2001.0979
Uono, S., Sato, W., and Toichi, M. (2011). The specific impairment of fearful expression recognition and its atypical development in pervasive developmental disorder. Soc. Neurosci. 6, 452–463. doi: 10.1080/17470919.2011.605593
Walsh, P., Elsabbagh, M., Bolton, P., and Singh, I. (2011). In search of biomarkers for autism: scientific, social and ethical challenges. Nat. Rev. Neurosci. 12, 603–612. doi: 10.1038/nrn3113
Wang, A. T., Lee, S. S., Sigman, M., and Dapretto, M. (2007). Reading affect in the face and voice: neural correlates of interpreting communicative intent in children and adolescents with autism spectrum disorders. Arch. Gen. Psychiatry 64, 698–708. doi: 10.1001/archpsyc.64.6.698
Welchew, D. E., Ashwin, C., Berkouk, K., Salvador, R., Suckling, J., Baron-Cohen, S., et al. (2005). Functional disconnectivity of the medial temporal lobe in Asperger’s syndrome. Biol. Psychiatry 57, 991–998. doi: 10.1016/j.biopsych.2005.01.028
Wicker, B., Fonlupt, P., Hubert, B., Tardif, C., Gepner, B., and Deruelle, C. (2008). Abnormal cerebral effective connectivity during explicit emotional processing in adults with autism spectrum disorder. Soc. Cogn. Affect. Neurosci. 3, 135–143. doi: 10.1093/scan/nsn007
Williams, J. H., Waiter, G. D., Gilchrist, A., Perrett, D. I., Murray, A. D., and Whiten, A. (2006). Neural mechanisms of imitation and ‘mirror neuron’ functioning in autistic spectrum disorder. Neuropsychologia 44, 610–621. doi: 10.1016/j.neuropsychologia.2005.06.010
Williams, J. H., Whiten, A., Suddendorf, T., and Perrett, D. I. (2001). Imitation, mirror neurons and autism. Neurosci. Biobehav. Rev. 25, 287–295. doi: 10.1016/S0149-7634(01)00014-8
Wilson, L. B., Tregellas, J. R., Hagerman, R. J., Rogers, S. J., and Rojas, D. C. (2009). A voxel-based morphometry comparison of regional gray matter between fragile X syndrome and autism. Psychiatry Res. 174, 138–145. doi: 10.1016/j.pscychresns.2009.04.013
Winkler, A. M., Ridgway, G. R., Webster, M. A., Smith, S. M., and Nichols, T. E. (2014). Permutation inference for the general linear model. Neuroimage 92, 381–397. doi: 10.1016/j.neuroimage.2014.01.060
World Health Organization (1992). The ICD 10 Classification of Mental and Behavioural Disorders. Geneva: World Health Organization, 362.
Yang, X., Si, T., Gong, Q., Qiu, L., Jia, Z., Zhou, M., et al. (2016). Brain gray matter alterations and associated demographic profiles in adults with autism spectrum disorder: a meta-analysis of voxel-based morphometry studies. Aust. N. Z. J. Psychiatry 50, 741–753. doi: 10.1177/0004867415623858
Yirmiya, N., Kasari, C., Sigman, M., and Mundy, P. (1989). Facial expressions of affect in autistic, mentally retarded and normal children. J. Child. Psychol. Psychiatry 30, 725–735. doi: 10.1111/j.1469-7610.1989.tb00785.x
Keywords: amygdala, autism spectrum disorder (ASD), fusiform gyrus, dorsomedial prefrontal cortex, middle temporal gyrus, social brain network
Citation: Sato W, Kochiyama T, Uono S, Yoshimura S, Kubota Y, Sawada R, Sakihama M and Toichi M (2017) Reduced Gray Matter Volume in the Social Brain Network in Adults with Autism Spectrum Disorder. Front. Hum. Neurosci. 11:395. doi: 10.3389/fnhum.2017.00395
Received: 31 March 2017; Accepted: 18 July 2017;
Published: 04 August 2017.
Edited by:
Mikhail Lebedev, Duke University, United StatesReviewed by:
Bin Jing, Capital Medical University, ChinaJason Michael Bruggemann, University of New South Wales, Australia
Copyright © 2017 Sato, Kochiyama, Uono, Yoshimura, Kubota, Sawada, Sakihama and Toichi. This is an open-access article distributed under the terms of the Creative Commons Attribution License (CC BY). The use, distribution or reproduction in other forums is permitted, provided the original author(s) or licensor are credited and that the original publication in this journal is cited, in accordance with accepted academic practice. No use, distribution or reproduction is permitted which does not comply with these terms.
*Correspondence: Wataru Sato, sato.wataru.4v@kyoto-u.ac.jp
†These authors have contributed equally to this work.