Desynchronizing electrical and sensory coordinated reset neuromodulation
- 1Research Center Jülich, Institute of Neuroscience and Medicine – Neuromodulation (INM-7), Jülich, Germany
- 2Department of Stereotaxic and Functional Neurosurgery, University of Cologne, Cologne, Germany
Coordinated reset (CR) stimulation is a desynchronizing stimulation technique based on timely coordinated phase resets of sub-populations of a synchronized neuronal ensemble. It has initially been computationally developed for electrical deep brain stimulation (DBS), to enable an effective desynchronization and unlearning of pathological synchrony and connectivity (anti-kindling). Here we computationally show for ensembles of spiking and bursting model neurons interacting via excitatory and inhibitory adaptive synapses that a phase reset of neuronal populations as well as a desynchronization and an anti-kindling can robustly be achieved by direct electrical stimulation or indirect (synaptically-mediated) excitatory and inhibitory stimulation. Our findings are relevant for DBS as well as for sensory stimulation in neurological disorders characterized by pathological neuronal synchrony. Based on the obtained results, we may expect that the local effects in the vicinity of a depth electrode (realized by direct stimulation of the neurons' somata or stimulation of axon terminals) and the non-local CR effects (realized by stimulation of excitatory or inhibitory efferent fibers) of deep brain CR neuromodulation may be similar or even identical. Furthermore, our results indicate that an effective desynchronization and anti-kindling can even be achieved by non-invasive, sensory CR neuromodulation. We discuss the concept of sensory CR neuromodulation in the context of neurological disorders.
1. Introduction
Several brain disorders, such as Parkinson's disease (PD), are characterized by abnormally strong, pathological neuronal synchronization (Lenz et al., 1994; Nini et al., 1995). The standard therapy for medically refractory PD patients is electrical high-frequency (HF) deep brain stimulation (DBS) (Benabid et al., 1991). For this, an electrical HF (>100 Hz) pulse train is delivered to a target brain area through a depth electrode.
The mechanism of action of HF DBS is not yet fully understood. Multiple possible mechanisms may contribute to the therapeutic effects of DBS, depending, e.g., on the neuronal structures being stimulated [for review see (Benabid et al., 2002; Vitek, 2002; McIntyre et al., 2004b)]. Some of these mechanisms take place in the vicinity of the stimulating electrode: for instance, neuronal activity might be blocked because HF DBS changes the activation of voltage-gated currents in the vicinity of the stimulating electrode, in this way inducing a depolarization blockade (Beurrier et al., 2001) or low-amplitude subthreshold oscillations of the membrane potential (Pyragas et al., 2012). Also, neuronal activity near the stimulating electrode might indirectly be inhibited via an excitation of axon terminals connected to neurons by inhibitory synapses (synaptic inhibition) (Dostrovsky et al., 2000). Depolarization blockade, stimulation-induced low-amplitude subthreshold oscillations, and synaptic inhibition are candidate mechanisms underlying the suppression of the somatic firing within the target nucleus. In contrast, independently of the suppression of neuronal activity in the vicinity of the stimulating electrode HF DBS may lead to a HF axonal output via an activation of projection neurons (McIntyre et al., 2004a). Put otherwise, local and non-local effects of HF DBS may differ considerably (McIntyre et al., 2004a).
In a certain number of patients HF DBS may be ineffective or cause side effects (Limousin et al., 1999; Kumar et al., 2003; Volkmann, 2004; Freund, 2005; Rodriguez-Oroz et al., 2005). Accordingly, along the lines of a model-based approach (Tass, 1999) novel stimulation techniques have been developed (Tass, 2001, 2003a,b; Rosenblum and Pikovsky, 2004; Hauptmann et al., 2005; Popovych et al., 2005, 2006; Pyragas et al., 2007; Popovych and Tass, 2010), which do not significantly influence the natural firing of the individual neurons and only selectively counteract the pathological synchronization of a neuronal target population. Coordinated reset (CR) stimulation (Tass, 2003a,b), considered in this paper, is a robust desynchronizing stimulation technique and aims at a therapeutic reshaping of the synaptic connectivity (Tass and Majtanik, 2006). CR stimulation can be applied in a closed-loop as well as in open-loop setup and requires neither extensive calibration nor technically involved real-time measurements and processing of the pathological neuronal activity as compared to other methods. According to its stimulation protocol, CR stimulation counteracts synchronization in the neuronal target population by splitting the entire population into several sub-populations where the phases of the neuronal oscillations are reset by the stimulation sequentially, i.e., in a timely coordinated manner (Tass, 2003a,b). In this way, the collective neuronal oscillations in the sub-populations get phase shifted with respect to each other, and the total synchronization is replaced by, e.g., a cluster state (Tass, 2003a,b; Lysyansky et al., 2011). Due to the pathologically strong synaptic connectivity, the entire target population runs from the cluster state through a transient characterized by pronounced desynchronization. Accordingly, to exploit this quasi-reactive type of desynchronization, CR stimuli are delivered intermittently (Tass, 2003a,b), for instance, by applying CR in an m:n ON-OFF mode, where m cycles with CR are followed by n cycles without any stimulation (Lysyansky et al., 2011).
In computational studies one may take into account a fundamental property of neuronal tissue, where the weights of the adaptive synapses depend on the underlying neuronal firing via a spike timing-dependent plasticity (STDP) (Gerstner et al., 1996; Markram et al., 1997; Feldman, 2000; Wittenberg and Wang, 2006; Caporale and Dan, 2008). For the models with STDP it has been shown that the CR-induced decrease of the rate of coincident firing leads to a reduction of the mean synaptic weight and, in turn, shifts the network to a healthy model attractor state characterized by desynchronized activity and weak connectivity (Tass and Majtanik, 2006; Hauptmann and Tass, 2007). Accordingly, CR causes an unlearning of both pathological synchronization and pathological connectivity (so-called anti-kindling) (Tass and Majtanik, 2006). CR-induced long-lasting desynchronization has experimentally been verified in rat hippocampal slice rendered epileptic by magnesium withdrawal (Tass et al., 2009). In the present study we consider two models of neuronal networks of spiking Hodgkin–Huxley (HH) and bursting FitzHugh–Rinzel (FHR) neurons with excitatory and inhibitory synaptic coupling which is governed by a STDP rule.
In the computational studies so far, only direct electrical stimulation of the neurons' somata has been taken into account [see, e.g., (Hauptmann and Tass, 2007)]. In contrast, we here also consider indirect, synaptically-mediated CR stimulation. Our motivation is twofold.
- Electrical deep brain CR stimulation: we study the differences of direct CR effects (mediated by direct somatic stimulation) in the vicinity of the depth electrode as opposed to indirect CR effects (mediated by stimulation of excitatory or inhibitory fibers). The latter stimulation modality may have local and non-local effects depending on that whether afferent axon terminals or efferent fibers are stimulated.
- Sensory CR stimulation: we study whether it is possible to perform CR stimulation with indirect stimulation only. This is a prerequisite for sensory CR stimulation. The network models with indirect, synaptically-mediated stimulation studied in this paper may be considered as minimal models for sensory stimulation, where in a first step relay stations in the sensory pathway are neglected.
Since the mechanism of action of CR stimulation is based on the phase reset of oscillatory neuronal activity, we may expect that the discussed control technique will be effective for both direct somatic and indirect, synaptically-mediated stimulation. Indeed, the phase reset is a universal phenomenon and can be achieved for a variety of stimulation setups as reported by a great body of modeling and experimental studies, e.g., for hyperpolarizing or depolarizing electrical pulses (Best, 1979; Demir et al., 1997; Tateno and Robinson, 2007; Neiman et al., 2007), excitatory or inhibitory post-synaptic potentials (PSPs) (Perkel et al., 1964; Pinsker, 1977; Lerma and Garcia-Austt, 1985; Jackson et al., 2002; Prinz et al., 2003), sensory stimulation (Givens, 1996; Makeig et al., 2002; Jansen et al., 2003; Ross et al., 2005), and transcranial magnetic stimulation (Van der Werf and Paus, 2006). Below we show that direct electrical (somatic) CR stimulation as well as indirect inhibitory or indirect excitatory CR stimulation can have intriguingly similar effects. The consequences of our results are two-fold. On the one hand the local effects (realized by direct stimulation of the neurons' somata or stimulation of afferent axon terminals) and the non-local effects (realized by stimulation of efferent fibers) of deep brain CR stimulation may be similar or even identical. On the other hand a basic prerequisite for sensory CR stimulation is fulfilled. Hence, the DBS-oriented concept of CR-induced desynchronization (Tass, 2003a,b) and anti-kindling (Tass and Majtanik, 2006) may be extended to a more general CR stimulation concept which can be realized by invasive as well as non-invasive, sensory (e.g., acoustic) stimulation. An effective counteraction of pathological neuronal synchronization by acoustic CR stimulation has recently been reported by Tass et al. (2012).
2. Methods
2.1 Hodgkin–huxley Spiking Neurons
We consider an ensemble of spiking HH neurons (Hodgkin and Huxley, 1952) [see (Hansel et al., 1993) for model equations and parameter values used here],
where the variable Vi, i = 1,…,N, models the membrane potential of neuron i, and αm(V) = (0.1V+4)/[1 − exp (−0.1V − 4)], βm(V) = 4 exp [(− V −65)/18], αh(V) = 0.07 exp [(− V −65)/20], βh(V) = 1/[1+ exp (−0.1 V −3.5)], αn(V) = (0.01V + 0.55)/[1− exp (−0.1V − 5.5)], and βn(V) = 0.125 exp [(−V − 65)/80]. The constant currents Ii are uniformly distributed random numbers: Ii ∈ [I0 − σI, I0 + σI]. Si(t) denotes the internal synaptic coupling within the neuronal population, and Fi(t) defines an external stimulation. The neurons interact via excitatory and inhibitory chemical synapses by means of the PSP si which is triggered by a spike of neuron i (Gerstner and Kistler, 2002; Izhikevich, 2007) and modeled in the standard way by an additional equation for si(t) (Golomb and Rinzel, 1993; Terman et al., 2002). The coupling term reads
and contains a weighted ensemble average of all PSPs received by neuron i from other neurons in the ensemble. Parameter cij defines the coupling strength from neuron j to neuron i, and Vr,j is the reversal potential taken as Vr,j = 20 mV for excitatory coupling and Vr,j = −40 mV for inhibitory coupling. The type and strength of neuronal interactions is defined by the spatial profile of coupling considered in the form of a Mexican hat Mij = (1−d2ij/σ21) exp (−d2ij/2σ22), where σ1 = 3.5, σ2 = 2, dij = d|i − j| is the distance between neurons i and j, and d = 10/(N − 1). To avoid boundary effects, we assume that the neuronal fibers are uniformly distributed within the neuronal population such that the distance |i − j| is replaced by N−|i − j|, if the indices i and j get more than N/2 apart from each other. The positive (negative) values of Mij indicate an excitatory (inhibitory) interaction, which corresponds to closely (distantly) located neurons. Depending on the sign of Mij, the corresponding reversal potential Vr,j is taken in coupling (2). In such a way local excitatory connections and distant inhibitory connections are modeled (Dominguez et al., 2006; de la Rocha et al., 2008).
The normalized sum of the PSPs sj(t) in Equation (2) represents the collective synaptic activity of the neuronal population, which yields the local field potential LFP(t) = N−1 ∑Nj = 1sj(t) (Buzsaki, 2004; Kelly et al., 2010). The LFP will be used to detect synchronization. Low-amplitude LFP oscillations (Figure 1B, red curve) are characteristic for a desynchronized regime, for example, for a coupling- and stimulation-free regime [Si = Fi = 0 in Equation (1)], where neurons independently fire at different times (Figure 1B, black dots). Because of different constant currents Ii, the individual spiking frequencies ωi (average number of spikes per second) are broadly distributed around the mean  ≈ 70.7 Hz with standard deviation σω ≈ 0.6 (Figure 1B, right plot). For sufficiently strong synaptic coupling the neurons synchronize, their frequencies {ωi} get narrowly distributed around the mean ≈ 71.4 Hz with standard deviation σω ≈ 0.002 (Figure 1C, right plot). The neurons fire nearly simultaneously (Figure 1C, black dots), which results in large-amplitude oscillations of the LFP (Figure 1C, red curve).
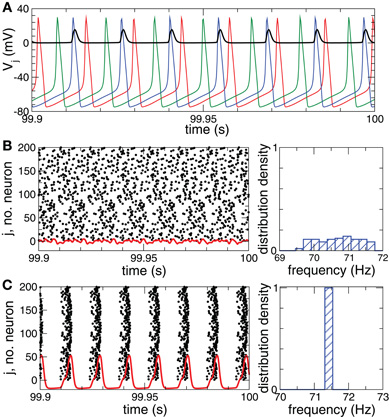
Figure 1. Desynchronized and synchronized collective dynamics of the HH ensemble (1), (2).(A) Time courses of the membrane potentials Vj of three selected neurons of a desynchronized neuronal ensemble and the post-synaptic potential si(t) (multiplied by a factor of 100) (black curve) triggered by the blue action potentials. (B), (C) Raster plots of the neuronal firing (left plots) and the corresponding normalized histograms of the spiking frequencies (number of spikes per second averaged over 100 s, right plots) for (B) the desynchronized regime, and (C) the synchronized regime. The corresponding DC-balanced LFPs (multiplied by a factor of 1000) are depicted by red curves at the bottom of the raster plots. Parameters Ii are randomly and uniformly distributed in the interval [10.55, 11.45], coupling cij = 0 in plots (A) and (B), and cij = 0.5 in plot (C).
The extent of phase synchronization in the neuronal ensemble can also be revealed with the order parameter R(t) defined as (Kuramoto, 1984)
where Φ(t) is the mean phase. The quantity φj(t) approximates the phase of neuron j and linearly increases over 2π from one spike to the next (Pikovsky et al., 2001)
where tj,k, k = 0, 1, 2,…, are the spiking times of neuron j. The synchronization order parameter R(t) is ranging from 1 to 0, which corresponds to perfect in-phase synchronization (all neurons fire at the same time) or its complete absence, respectively. For example, for the desynchronized regime illustrated in Figure 1B, the time-averaged order parameter 〈R(t)〉 ≈ 0.06, whereas 〈R(t)〉 ≈ 0.85 for the synchronized dynamics illustrated in Figure 1C.
2.2 Fitzhugh–rinzel bursting neurons
We consider an ensemble of N interacting bursting neurons, each neuron being modeled by the FHR system (Rinzel, 1987; Izhikevich, 2001),
As before, Vi, i = 1, 2,…, N is the membrane potential of neuron i, Si(t) denotes the internal synaptic coupling considered in the form (2) with the reversal potential Vr,j = 2 (Vr,j = −2) for excitatory (inhibitory) coupling, Fi(t) defines the external stimulation, and si is the PSP triggered by a burst of neuron i. The constant currents Ii are uniformly distributed random numbers: Ii ∈ [I0 − σI, I0 + σI]. Consequently, without synaptic interactions and external stimulation, Si = Fi = 0 in Equation (5), the individual bursting frequencies ωi (average number of bursts per second) of the FHR neurons (5) are broadly distributed around the mean value ≈ 4.87 Hz with standard deviation σω ≈ 0.21 (Figure 2B, right plot). The individual neurons burst independently of each other (Figure 2A and Figure 2B, black dots), which results in low-amplitude fluctuations of the LFP (Figure 2B, red curve). In contrast, strong enough coupling synchronizes the neurons, such that the bursting frequencies get narrowly spread, see Figure 2C (right plot), where {ωi} are distributed around the mean value ≈ 3.74 Hz with standard deviation σω ≈ 0.08. The neurons fire nearly simultaneously (Figure 2C, black dots), which results in large-amplitude oscillations of the LFP (Figure 2C, red curve). The corresponding values of the time-averaged order parameter are 〈R(t)〉 ≈ 0.075 in the desynchronized regime and 〈R(t)〉 ≈ 0.95 in the synchronized regime, respectively.
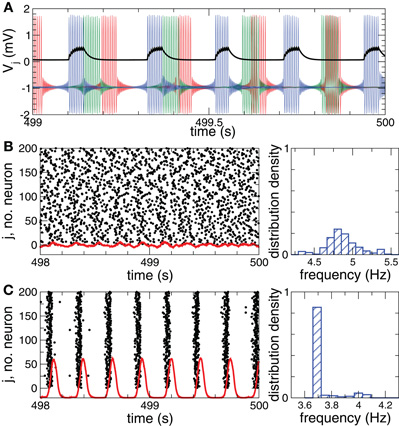
Figure 2. Desynchronized and synchronized collective dynamics of the FHR ensemble (5), (2).(A) Time courses of the membrane potentials Vj of three selected neurons of the desynchronized neuronal ensemble and the post-synaptic potential si(t) (multiplied by a factor of 2) (black curve) triggered by the blue action potentials. (B), (C) Raster plots of the neuronal firing (left plots) and the corresponding normalized histograms of the bursting frequencies (number of bursts per second averaged over 500 s, right plots) for (B) desynchronized regime, and (C) synchronized regime. The corresponding DC-balanced LFPs (multiplied by a factor of 400) are shown by red curves at the bottom of the raster plots. Parameters Ii are randomly and uniformly distributed in the interval [0.347, 0.353], coupling cij = 0 in plots (A) and (B), and cij = 0.2 in plot (C).
2.3 Coordinated Reset Stimulation
The considered neuronal networks (1) and (5) are stimulated with CR stimulation (Tass, 2003a,b). According to the CR stimulation algorithm the stimulation signals are sequentially delivered to M different sub-populations of the neuronal target ensemble via M different stimulation sites (Figure 3A). We choose M = 4 [see (Tass, 2003a,b)]. The stimulation signals are administered via stimulation sites in a time-coordinated manner such that the next stimulation site is activated with a delay of Ts/M after the activation of the preceding stimulation site. The stimulation period Ts is optimally chosen close to the mean period of the synchronized neurons. Within one cycle of length Ts each stimulation site is activated once.
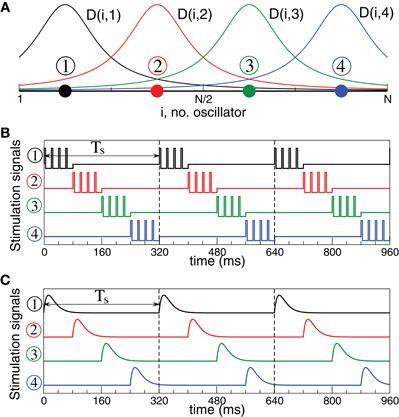
Figure 3. Stimulation setup for electrical and sensory CR stimulation.(A) Schematic localization of four stimulation sites within the neuronal population and the corresponding spatial profiles (7) of current decay in the neuronal tissue with the distance from the stimulation site. (B) Stimulation signals of electrical CR stimulation composed of short pulse trains of charge-balanced pulses (8). (C) Stimulation signals of sensory CR stimulation composed of post-synaptic potentials modeled by α-functions (9).
In this paper we consider two types of CR stimulation, namely, (i) direct electrical stimulation of the neurons' somata and (ii) stimulation of excitatory or inhibitory axons terminals or fibers. The latter indirect stimulation models either synaptically-mediated local or non-local effects of electrical deep brain CR stimulation or the effects of sensory CR stimulation (see Introduction). For direct electrical stimulation brief trains of HF charge-balanced electrical pulses are administered to the neuronal tissue (Figure 3B). Electrical CR stimulation requires an electrode implantation into the neuronal target population, as, for example, in the case of DBS (Benabid et al., 1991). In fact, CR stimulation has initially been developed for the application to electrical DBS (Tass, 2003a,b). To model direct electrical stimulation, we assume that the stimulation signals (Figure 3B) are directly delivered to the somata of the stimulated neurons such that the stimulation term Fi(t) in Equations (1) and (5) reads
K is the stimulation strength, D(i,j) is the spatial profile of the stimulation strength, decaying with distance between the stimulation site j and neuron i (Figure 3A). ρj(t) is an indicator function controlling the activation of the stimulation site j, and P(t) is a HF pulse train (Figure 3B). We also assume that M = 4 stimulation sites are uniformly placed within the neuronal population (Figure 3A). For example, for a population of N = 200 neurons the stimulation sites are located at lattice coordinates xj = 25, 75, 125, 175. We consider a quadratic spatial decay profile of the stimulation current,
which is characteristic for brain tissue (Richardson et al., 2003). Parameters d = 10/(N − 1) and σd = 0.8. The HF pulse train P(t) in Equation (6) comprises charge-balanced pulses, where a short positive pulse of unit amplitude and length Tp is followed by a longer compensatory negative part of length Tn with the inter-pulse interval Tp + Tn,
where tk are times of pulse onsets tk = k(Tp +Tn), k = 0, 1,…. For example, below we use Tp = 1 ms and Tn = 9 ms with inter-pulse interval 10 ms, i.e., the pulse-train frequency is 100 Hz for the electrical stimulation of FHR neurons. For the electrical stimulation of HH neurons we use electrical pulses with parameters Tp = 0.4 ms and Tn = 1.6 ms, where the pulse-train frequency is again of about one order of magnitude larger than the intrinsic frequency of synchronized neurons. The indicator function ρj(t) in Equation (6) equals 1 if the jth stimulation site is active at time t and zero otherwise.
We apply CR stimulation, where the sequence of stimulation site activation is randomly varied between stimulation cycles of length Ts with equal probability. To exploit the transient desynchronization induced by CR stimuli (Tass, 2003a,b), we use a patterned ON-OFF CR stimulation with n = 3 cycles ON and m = 2 cycles OFF protocol (with cycle duration Ts), where the stimulation is delivered only during the ON cycles, and desynchronization is strongest during the OFF cycles, see (Lysyansky et al., 2011).
As a possible alternative to direct electrical CR stimulation, we consider indirect, synaptically-mediated, e.g., sensory CR stimulation. Note, the indirect stimulation also models the stimulation of excitatory or inhibitory axons or fibers induced by electrical deep brain CR stimulation (see above and Introduction). We assume that the stimulation signals arrive at the neuronal target population as PSPs evoked in the dendrites of the stimulated neurons e.g., by external sensory stimulation. We model the stimulation-evoked PSPs by the α-function of the form.

with parameter α = 6M/Ts, which are shown in Figure 3C, compare with PSPs evoked by spikes of HH neurons (1) (Figure 1A, black curve) and bursts of FHR neurons (5) (Figure 2A, black curve). Through the paper we use Ts = 16 ms (α = 3/2) and Ts = 320 ms (α = 3/40) for the sensory stimulation of the HH and FHR neurons, respectively. {tk} are the onset times of the α-stimuli, which correspond to the activation times of the stimulation sites given by the indicator function ρj(t), and the inter-stimulus intervals tk+1 −tk = Ts/M.
For sensory CR stimulation the stimulation term Fi(t) in Equations (1) and (5) reads:
As before, K is the stimulation strength, D(i,j) is the spatial profile of the stimulation strength (7). This type of the spatial stimulation profile is characteristic for electrical stimulation of brain tissue (Richardson et al., 2003) and also fits to the shape of the tuning curves in sensory processing (Patuzzi and Robertson, 1988; Gulick et al., 1989; Robertson and Irvine, 1989). P(t) is a periodic α-train of the form (9), see also (Popovych and Tass, 2011). The indirect stimulation can be excitatory or inhibitory, and we model these two types of stimulation by considering the reverse potential in Equation (10) Vr = 20 mV for HH neurons and Vr = 2 mV for FHR neurons to achieve excitatory stimulation effect, or Vr = −40 mV for HH neurons and Vr = −2 mV for FHR neurons in the case of inhibitory stimulation effect.
2.4 Cross-Trial Phase Resetting Analysis
The effect of CR stimulation is based on the phase reset of the stimulated neurons (Tass, 2003a,b). In order to reveal whether the considered direct (somatic) (6) or indirect (synaptically-mediated) (10) stimulation can effectively reset the neuronal populations (1) and (5), we perform a cross-trial phase resetting analysis, see (Tass, 2003c,d; Krachkovskyi et al., 2006) for further details. For this, a long series of identical brief (single shot) stimuli is delivered to the neuronal population, and we evaluate the impact of the stimuli statistically. For this, all neurons in the ensemble simultaneously receive the stimuli via all four stimulation sites at the same times tk, k = 0, 1, 2,…, i.e., the indicator functions ρj in Equations (6) and (10) are simultaneously set to 1 or 0. As a single direct stimulus we use two pulses of the form (8), with opposite polarity to guarantee charge-balancing. In contrast, a single indirect stimulus is modeled by an α-pulse of the form (9). The stimulus onset times tk are randomized with a relatively long inter-stimulus interval tk+1 − tk = Tr + ξ, so that the neurons can relax to their natural dynamics during the post-stimulus transient. The parameter Tr is fixed Tr = 100 ms for the HH ensemble (1) and Tr = 2000 ms for FHR ensemble (5), and ξ is a random number being uniformly distributed in the interval ξ ∈ [0, 50] ms for the HH ensemble (1) and ξ ∈ [0, 1000] ms for the FHR ensemble (5).
Around each stimulus a time window of length Tr, is considered, W = [−0.25Tr, 0.75Tr], where the stimulus onset time tk is set to zero within this window. The dynamics of the mean phase Φk(t) = Φ(tk + t), t ∈ W, from Equation (3) is analyzed across stimulation trials. To detect stereotyped stimulus responses of the phase dynamics, we calculate the cross-trial (across index k) distribution of the mean phase [Φk(t) (mod 2π)], t ∈ W, and the corresponding resetting index.
where L is the number of administered stimuli. The resetting index E ∈ [0, 1] quantifies the extent of the phase reset such that it is large if the phase distribution has a well-localized structure, e.g., a well-pronounced phase peak. If large values of E(t) are observed during the post-stimulus transient time in contrast to small values of E(t) in the pre-stimulus time interval then this means that the considered stimulation, which is administered at a random phase because of the randomized stimulation times tk, causes a phase reset of the neuronal ensemble to a stereotypical phase. The stimulation thus restarts the neuronal phase dynamics from a well-defined initial phase, which is important for an effective desynchronization by CR stimulation (Tass, 2003a,b). The cross-trial phase resetting analysis detects stereotypical features in an ensemble of stimulus responses. Accordingly, for the phase resetting analysis, STDP is turned off and the synaptic weights are considered cij = 0.5 for the HH neurons (1), (2), and cij = 0.2 for the FHR neurons (5), (2) to avoid any long-term effects of the stimulation and to make sure that the stimuli hit the synchronized network in its natural, pre-stimulus dynamics.
2.5 Spike Timing-Dependent Plasticity
We investigate the neuronal dynamics modeled by the ensembles (1) and (5) and controlled by direct electrical or indirect (synaptically-mediated), e.g., sensory CR stimulation for adaptive synapses, where the synaptic weights cij are considered to be dynamical variables dependent on the timing of the neuronal firing of the pre- and post-synaptic interacting neurons. We equip the considered models with the STDP (Gerstner et al., 1996; Markram et al., 1997; Feldman, 2000; Wittenberg and Wang, 2006; Caporale and Dan, 2008). For STDP the time difference Δ tij = ti − tj, i.e., the time delay between the nearest onsets of the spikes or bursts of the pre-synaptic neuron j and the post-synaptic neuron i is crucial. Depending on Δ tij, the synaptic weight cij is updated in a point process like manner by the increment δ · Δ cij for excitatory connections and −δ · Δ cij for inhibitory connections with δ > 0 according to the rule.
Due to STDP [Equation (12), Figure 4, left plot] the synaptic strength of excitatory synapses is potentiated or depressed depending on whether the post-synaptic firing follows or advances the pre-synaptic firing, respectively (Gerstner et al., 1996; Markram et al., 1997; Debanne et al., 1998; Bi and Poo, 1998). For inhibitory or distant synapses the situation can be opposite (Caporale and Dan, 2008), which we consider in this paper. In order to avoid an unbounded growth, the synaptic weights cij will be confined to the interval cij ∈ [0, cmax], where cmax = 1 for the HH ensemble (1) and cmax = 0.5 for the FHR ensemble (5). The neurons do not have self-connections: cii = 0. For an average “net” effect of STDP on the synaptic weights, one can calculate the integral  which indicates how fast the synaptic strength will on average be potentiated or depressed if the relative firing time Δt is uniformly distributed in the interval Δt ∈ [−ε, ε], see also (Kepecs et al., 2002; Tass and Majtanik, 2006; Hauptmann and Tass, 2007). As follows from the shape of
  (Figure 4, right plot), the synaptic weight of excitatory synapses is up-regulated if pre- and postsynaptic neuron preferentially fire in synchrony (Δt is narrowly distributed, small ε), whereas it is down-regulated if they fire in an uncorrelated manner (Δt is broadly distributed, large ε), e.g., due to desynchronizing stimulation [see (Tass and Majtanik, 2006; Hauptmann and Tass, 2007)].
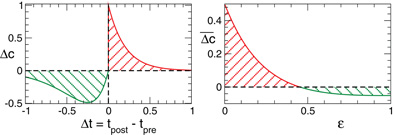
Figure 4. Left plot: normalized plasticity function (12) vs. the difference of the spike/burst timing of post- and pre-synaptic neuron Δt = tpost −tpre. Right plot: The average “net” STPD effect for uniformly distributed Δt ∈ [−ε, ε] (see text for details). Parameters τ = 1, β1 = 1, β2 = 5.3, γ1 = 5, and γ2 = 4.
STDP contributes to a stabilization of synchronized and desynchronized states, which naturally leads to the emergence of a multi-stability of synchronized and desynchronized states in the neuronal populations with STDP. In the considered neuronal model of bursting FHR neurons (5), for example, a strong initial coupling among the neurons leads to an onset of synchronization, where the neurons within the ensembles fire nearly simultaneously. As discussed above, such a dynamics results in a potentiation of the synaptic weights because of STDP, which, in turn, further supports the synchronized dynamics and leads to its stabilization. On the other hand, weak coupling results in a desynchronized dynamics and, due to STDP, in a further depression of the synaptic weights. In such a way a desynchronized state is also expected to be stable in the neuronal ensemble with STDP. This is illustrated for FHR neurons (5) in Figure 5. Depending on the initial coupling strength the neuronal ensemble approaches either a strongly coupled regime (Figure 5A, red and blue curves and Figure 5C, right plot) or a weakly coupled regime (Figure 5A, green and black curves and Figure 5C, left plot). The former regime is characterized by a synchronized dynamics with large-amplitude oscillations of LFP (Figure 5B, red curve), whereas in the latter regime the LFP oscillations are of low-amplitude (Figure 5B, green curve) which is characteristic for a desynchronized dynamics. In such a way two coexisting stable strongly coupled synchronized and weakly coupled desynchronized states can be observed in the FHR neuronal ensemble (5) with STDP (12). We note that some other stable states may also coexist. Four coexisting stable states, for instance, can be observed for the HH ensemble (1) with STDP (12) for different initial coupling matrices, which is illustrated in Figure 6.
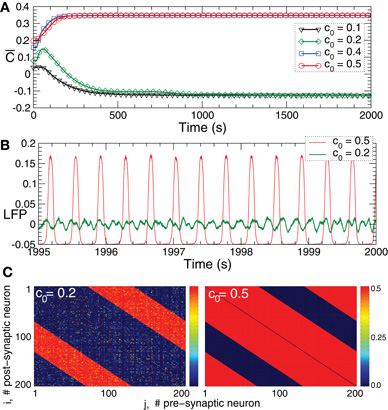
Figure 5. Plasticity-induced multistability of synchronized and desynchronized states in the FHR ensemble (5) with STDP (12).(A) Time courses of the mean synaptic weights  (t) = N−2 ∑i,j sgn(Mij)cij(t) for different initial coupling matrices [cij(0)] whose elements are Gaussian distributed around the mean value c0 (indicated in the legend) with standard deviation 0.005. (B) Time courses of the DC-balanced LFP observed in the stable weakly coupled and desynchronized regime (green curve) and strongly coupled and synchronized regime (red curve). (C) The corresponding coupling matrices, where the excitatory synaptic weights are suppressed and the inhibitory connections are potentiated in desynchronized regime (left plot) and the opposite situation in the synchronized regime (right plot). Parameters N = 200, δ = 0.005, β1 = 1, β2 = 5.3, γ1 = 5, γ2 = 4, τ = 350, and the other parameters as in Figure 2.
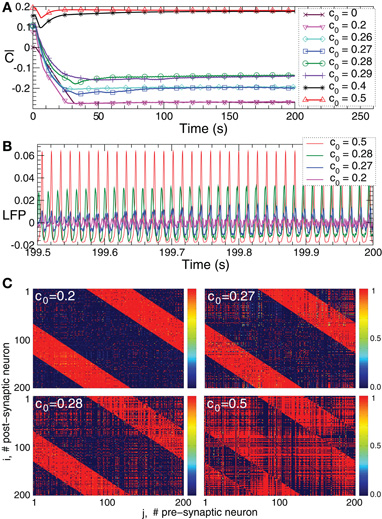
Figure 6. Plasticity-induced multistability of synchronized and desynchronized states in the HH ensemble (1) with STDP (12).(A) Time courses of the mean synaptic weights (t) (see Figure 5 for definition) for different initial coupling matrices [cij(0)] whose elements are Gaussian distributed around the mean value c0 (indicated in the legend) with standard deviation 0.01. (B) Time courses of the DC-balanced LFP of four stable synchronized and desynchronized regimes observed for the initial coupling matrices with mean value c0 indicated in the legend. (C) The corresponding coupling matrices developed in the neuronal ensemble due to STDP for the above four stable states. The initial mean values c0 are indicated in the plots. Parameters N = 200, δ = 0.002, β1 = 1, β2 = 16, γ1 = 1/0.12, γ2 = 1/0.15, τ = 14, and the other parameters as in Figure 1.
3. Results
3.1 Phase Resetting of HH and FHR Ensembles
The phase of the ensembles of spiking HH neurons (1), (2), and bursting FHR neurons (5), (2) can effectively be reset by direct electrical as well as indirect (e.g., sensory) stimulation. To illustrate this, we first consider synchronized bursting FHR neurons (as in Figure 2C) and administer a long series of resetting electrical pulses and sensory stimuli as described in Section. 2.4. For electrical stimulation (Figure 7A) the distribution density of the mean phases Φk(t) averaged across stimulation trials is uniform in the pre-stimulus interval (for t<0). This is due to the randomized stimulation times tk, which also indicates that the stimuli are administered to the neuronal population at random phases. Nevertheless, during the post-stimulus transient (for t > 0) the phase distribution density has a well-pronounced peak which indicates that the stimuli induce a stereotypical response of the collective dynamics of the stimulated ensemble. The direct electrical stimulation can thus induce a phase reset. The same is achieved by indirect excitatory and indirect inhibitory (e.g., sensory) stimulation (Figures 7B,C). The phase resetting index E(t) (Figure 7, left plots, white curves) clearly reflects the stimulation-induced phase reset. It attains small values in the pre-stimulus interval, whereas E(t) increases after the stimulation.
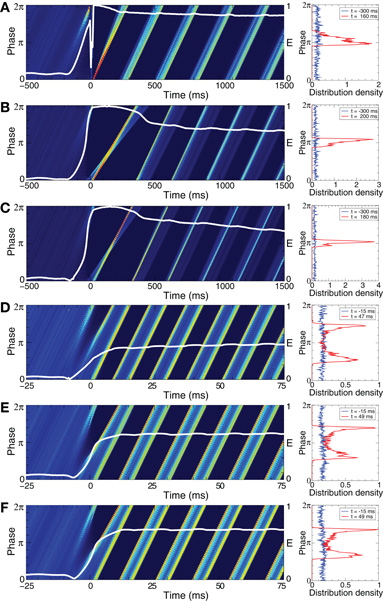
Figure 7. Cross-trial diagrams of the distribution densities of the mean phase Φk(t) averaged across stimulation trials for (A)–(C) synchronized FHR neurons (5), (2), and (D)–(F) synchronized HH neurons (1), (2) without STDP. Note, for the phase resetting analysis, STDP is turned off to avoid any long-term effects of the stimulation and to guarantee that after the post-stimulus transients the network has re-established its natural, pre-stimulus dynamics. In plots (A) and (D) direct electrical stimulation was administered, whereas in plots (B) and (E) indirect (synaptically-mediated) excitatory stimulation and in plots (D) and (F) indirect (synaptically-mediated) inhibitory stimulation was used, see Section 2.4 for details. In color diagrams (left column) the values of the phase distribution densities are encoded in color ranging from 0 (blue) to (A) 2, (B) 3, (C) 4, and (D)–(F) 1 (red). The white curves depict the phase resetting index E(t) with the scale indicated on the right vertical axis. The plots in the right column illustrate the corresponding phase distribution densities which are shown for fixed times in the pre-stimulus interval (blue curves) and in the post-stimulus interval (red curves) as indicated in the legends. Stimulation strength (A)K = 2, (B)K = 0.2, (C)K = 0.8, (D)K = 50, (E)K = 0.4, and (F)K = 2. The other parameters as in Figure 1C for HH neurons and in Figure 2C for FHR neurons.
The considered direct electrical and indirect (synaptically-mediated) inhibitory or excitatory types of stimulation (modeling either sensory stimulation or electrical stimulation of axons terminals or fibers) can also induce a phase reset in the ensemble of HH spiking neurons (1), (2). We again consider a synchronized ensemble (as in Figure 1C) and administer a long series of resetting electrical pulses and sensory stimuli as described in Section 2.4. As shown in Figures 7D–F for the electrical and excitatory and inhibitory sensory stimulations, the cross-trial diagrams show two well-pronounced phase peaks during the post-stimulus transient [note the difference to the single-peak cross-trail phase distribution for the FHR neurons (Figures 7A–C)]. This indicates that two stereotypical responses can be induced by the electrical and sensory stimulation in the HH neuronal ensemble. Nevertheless, the time dynamics of the resetting index E(t) supports the stimulation-induced phase reset (Figures 7D–F, white curves). E(t) is small in the pre-stimulus interval (the cross-trials phase distribution is uniform), whereas E(t) attains large values in the post-stimulus interval.
3.2 Rewiring of Neuronal Ensembles with STDP by CR Stimulation
The direct electrical as well as the indirect (synaptically-mediated, e.g., sensory) CR stimulation can have a well-pronounced desynchronizing effect on the stimulated neuronal population. Due to STDP CR stimulation does not only influence the collective dynamics, but also the pattern of the synaptic couplings among the neurons, i.e., it may induce a rewiring of the stimulated neuronal ensemble: the control of the collective dynamics enables a control of the connectivity. To illustrate the above effects of CR stimulation, we first consider the FHR neurons (5), (2) with STDP (12) in a strongly coupled and synchronized regime, see Figure 5. Weak direct electrical as well as weak indirect (e.g., sensory) stimulation has no noticeable impact on the mean coupling of the stimulated neuronal ensemble, as expected (Figure 8, blue curves). The stimulated neurons remain strongly coupled and, thus, synchronized during as well as after the epoch of CR stimulation. However, for moderate stimulation intensities the time course of the mean coupling (t) in the stimulated neuronal population is different (Figure 8, green curves): it gradually decays during the stimulation and, finally, approaches a small magnitude during the post-stimulation transient. Accordingly, both direct electrical and indirect (e.g., sensory) CR stimulation shifts the neuronal ensemble from a strongly coupled and synchronized regime to a stable weakly coupled and desynchronized state. These qualitatively very different states of the FHR neuronal ensemble have been identified as stable in our analysis above (see Figure 5).
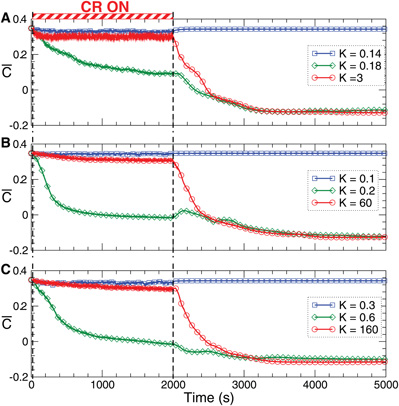
Figure 8. Stimulation-induced rewiring and desynchronization of the FHR ensemble (5), (2) with STDP (12) by CR stimulation. The time courses of the mean synaptic weights (t) (see Figure 5 for definition) are shown for different stimulation intensities K as indicated in the legends. The stimulation time interval is indicated by the red bar in plot (A) and by vertical dashed lines for (A) direct electrical stimulation, (B) indirect (synaptically-mediated), e.g., sensory excitatory stimulation, and (C) indirect (synaptically-mediated), e.g., sensory inhibitory stimulation administered to a strongly coupled and synchronized regime as in Figure 5 for c0 = 0.4. Other parameters as in Figures 2 and 5.
The desynchronizing and rewiring impact of CR stimulation is a robust effect and preserved within a large range of the stimulation strength (Figure 8, red curves). However, for strong stimulation, both direct electrical and indirect (e.g., sensory), the synaptic weights among the stimulated neurons hardly deviate during the stimulation from those of the initially strongly coupled regime. Nevertheless, CR stimulation can still induce a long-lasting desynchronizing and rewiring effect where the coupling weights approach small values during the post-stimulation transient (Figure 8, red curves), and the stimulation-free neuronal ensemble eventually stabilizes in a weakly coupled and desynchronized regime observed in Figure 5.
Analogous arguments are applicable to the network of HH neurons (1), (2) with STDP (12). Indeed, weak direct electrical as well as indirect (e.g., sensory) CR stimulation do not induce any long-lasting change in the coupling (Figure 9, blue curves), whereas a stronger CR stimulation significantly suppresses the mean coupling (t) during the stimulation and leads to a long-lasting rewiring and desynchronization (Figure 9, green curves), see also Figure 6. If the stimulation gets too strong, it can still significantly suppress the synaptic weights during the stimulation, but it does not cause any long-lasting effect (Figure 9, red curves). The neuronal population returns to the strongly coupled and synchronized regime (as in the pre-stimulation epoch) after the stimulation is switched off. The latter effect differs from that of the FHR neurons (Figure 8). However, also for the FHR ensemble, too strong CR stimulation fails to induce a long-lasting rewiring and desynchronization.
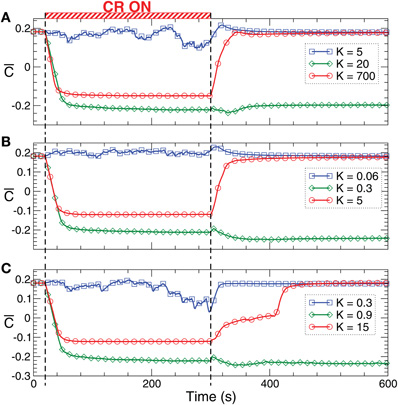
Figure 9. Stimulation-induced rewiring and desynchronization of the HH ensemble (1), (2) with STDP (12) by CR stimulation. The time courses of the mean synaptic weights (t) (see Figure 5 for definition) are plotted for different stimulation intensities K as indicated in the legends. The stimulation time interval is indicated by the red bar in plot (A) and by vertical dashed lines for (A) direct electrical stimulation, (B) indirect (e.g., sensory) excitatory stimulation, and (C) indirect (e.g., sensory) inhibitory stimulation administered to a strongly coupled and synchronized regime as in Figure 6 for c0 = 0.5. Other parameters as in Figures 1 and 6.
For both considered neuronal models with STDP there exists a broad range of the stimulation strength where the corresponding direct electrical or indirect (e.g., sensory) CR stimulation is effective, i.e., where it induces long-lasting rewiring and desynchronization. For illustration, we register the mean coupling (t) in the stimulated ensemble during the stimulation period on, i.e., in the stimulation ON condition, and then at the end of the post-stimulus transient off, i.e., in the stimulation OFF condition. These two quantities are depicted for FHR neurons in Figure 10 versus the stimulation intensity K by green dashed and green solid curves, respectively. As follows, CR stimulation is effective for K ∈ (K1, K2) (Figure 10, vertical dashed lines) where the neuronal ensemble converges during the post-stimulation transient to a weakly coupled and desynchronized regime (Figure 10, solid green and red curves). As CR stimulation gets stronger, it induces a weaker suppression of the coupling during stimulation, i.e., the mean synaptic weight on increases with K (Figure 10, green dashed curve). However, the long-lasting effect of CR stimulation is still preserved until on reaches a critical value and CR stimulation becomes ineffective for K > K2 (Figure 10, solid green and red curves).
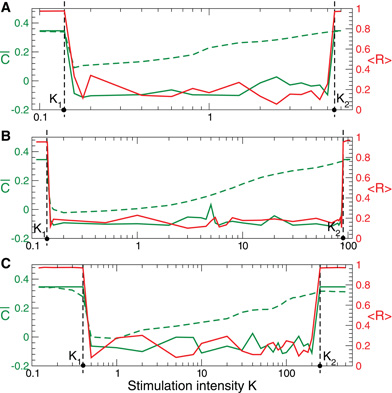
Figure 10. Stimulation-induced rewiring of the FHR ensemble (5), (2) with STDP (12) by CR stimulation versus the stimulation intensity K. Dashed and solid green curves depict the mean synaptic weights on and off registered during (A) direct electrical, (B) indirect (synaptically-mediated, e.g., sensory) excitatory, and (C) indirect (synaptically-mediated, e.g., sensory) inhibitory stimulation and at the end of the post-stimulation transient, respectively. The red solid curves show the order parameter 〈 R(t)〉 time averaged over the last 3 s of the post-stimulation transient, see the scale on the right vertical axis. Vertical dashed lines indicate the parameter interval K ∈ (K1, K2), where the corresponding CR stimulation is effective. Number of neurons N = 100, and the other parameters as in Figures 2, 5, and 8.
For the HH neurons with STDP there also exists an interval of the stimulation intensity K ∈ (K1, K2), where the direct electrical as well as the indirect (e.g., sensory) CR stimulation is effective, i.e., it shifts the neuronal population to a weakly-coupled and desynchronized regime (Figure 11, solid green and red curves). The difference can be observed for large stimulation strength K, where CR stimulation still induces a significant rewiring of the neuronal ensemble only during the stimulation, i.e., on is small (Figure 11, green dashed curves), while it does not lead to long-lasting changes in coupling and collective neuronal dynamics for K > K2.
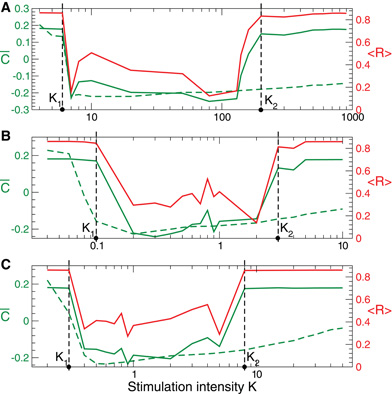
Figure 11. Stimulation-induced rewiring of the HH ensemble (1), (2) with STDP (12) by CR stimulation versus the stimulation intensity K. Dashed and solid green curves depict the mean synaptic weights on and off registered during (A) direct electrical, (B) indirect (e.g., sensory) excitatory, and (C) indirect (e.g., sensory) inhibitory stimulation and at the end of the post-stimulation transient, respectively. The red solid curves show the order parameter 〈 R(t)〉 time averaged over the last 2 s of the post-stimulation transient, see the scale on the right vertical axis. Vertical dashed lines indicate the parameter interval K ∈ (K1, K2), where the corresponding CR stimulation is effective. Number of neurons N = 200, and the other parameters as in Figures 1, 6, and 9.
3.3 Mixed Stimulation Type and Random Network Topology
This section serves to illustrate that the effects of CR stimulation can also be observed for a qualitatively different network topology as well as for mixed excitatory-inhibitory stimulation. To illustrate that the observed long-lasting effects of CR stimulation do not depend on the particular type of the network topology, we deliver CR stimulation to a network comprising FHR model neurons as studied above [Equations (2), (5)], but with random connections, i.e. without any particular underlying topological structure (Figure 12). For this, we randomly and uniformly redistribute the parameters Mij of the coupling profile in the interval [−p, 1 −p], where 0 ≤ p ≤ 1 defines the fraction of the inhibitory coupling (Mij < 0) in the neuronal population. For the sake of illustration, we consider a FHR neuronal network (2), (5) with p = 0.2 which corresponds to 20% of inhibitory connections. Similar results can also be obtained for smaller p, e.g., for purely excitatory coupling where p = 0. Such a network with STDP also exhibits a multistability of synchronized and desynchronized states where, depending on the initial conditions, a stable synchronized state characterized by large-amplitude oscillations of LFP (Figure 12B, red curve) can be observed. Being captured in that dynamical attractor state, the considered STDP rule (12) results in a potentiation of the excitatory connections and a depression of the inhibitory connections (Figure 12C, left plot).
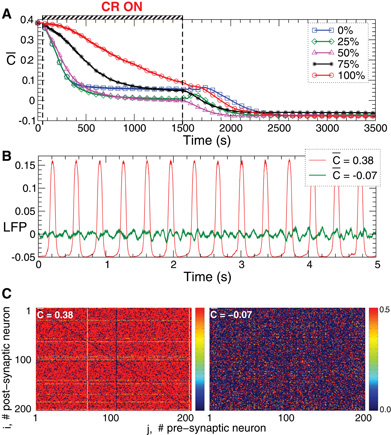
Figure 12. Stimulation-induced rewiring and desynchronization of the FHR ensemble (5), (2) with STDP (12) and with 20% of randomly selected inhibitory connections by indirect (synaptically-mediated) mixed excitatory-inhibitory CR stimulation.(A) The time courses of the mean synaptic weights (t) (see Figure 5 for definition) are shown for different fractions of the neuronal population of randomly selected neurons receiving an inhibitory stimulation as indicated in the legend. The rest of the neuronal ensemble receives an excitatory stimulation. The stimulation time interval is indicated by the red bar and by vertical dashed lines. (B) Time courses of the DC-balanced LFP observed in the stable strongly coupled and synchronized regime (red curve for the mean coupling (t) ≈ 0.38) and weakly coupled and desynchronized regime (green curve for the mean coupling (t) ≈ −0.07). (C) The corresponding coupling matrices, where the excitatory synaptic weights are potentiated and the inhibitory connections are suppressed in the synchronized regime (left plot) and the opposite situation in the desynchronized regime (right plot). Parameters Mij of the spatial profile of coupling (2) are uniformly and randomly distributed in the interval [−0.2, 0.8], initial mean coupling c0 = 0.48, stimulation strength K = 1, and the other parameters as in Figures 2 and 5.
CR stimulation can effectively desynchronize such an ensemble with random topology. We illustrate this for an indirect (synaptically-mediated) stimulation, where a fraction of the population of randomly selected neurons receives an inhibitory stimulation, and the rest of the ensemble is stimulated excitatorily. Put otherwise, the CR stimuli affect a randomly selected portion of the neurons in an inhibitory manner and the rest in an excitatory manner. Irrespectively of the ratio of neurons being stimulated excitatorily vs. inhibitorily, CR stimulation shifts the neuronal ensemble from a strongly coupled and synchronized regime to a weakly coupled and desynchronized regime (Figure 12A). The latter is characterized by low-amplitude oscillations of the LFP (Figure 12B, green curve) and depressed excitatory and potentiated inhibitory connections (Figure 12C, right plot). This state is stable and preserved if the stimulation is switched off, which constitutes a long-lasting desynchronizing and rewiring effect of CR stimulation.
4. Discussion
The mechanism of action of CR stimulation essentially relies on the ability to perform a phase reset of the oscillatory dynamics of neuronal populations (Tass, 2003a,b). To achieve the desynchronizing effect of CR stimulation, phase resetting stimuli are sequentially delivered at different sites, i.e., to different neuronal subpopulations. Since the subpopulations are reset at different times, their phases get shifted with respect to each other (Tass, 2003a,b). In this computational paper we show that a phase reset of neuronal populations can robustly and in an intriguingly similar way be achieved with (i) direct electrical stimulation, (ii) indirect (synaptically-mediated) excitatory stimulation, or (iii) indirect (synaptically-mediated) inhibitory stimulation (Figure 7). Furthermore, we show that the CR-induced desynchronization and anti-kindling (unlearning of pathological synchrony and connectivity) can be achieved no matter which stimulation modality—(i), (ii), or (iii)—we use. For all three stimulation modalities the CR mechanism robustly works within a broad range of the stimulation strength. We illustrate these effects on two very different network models with spiking and bursting neurons, respectively.
We note that the observed long-lasting effects of CR stimulation do not depend on the particular type of the coupling topology. In fact, CR stimulation robustly works also in a network with random topology (Figure 12).
An exclusively excitatory fiber tract was selected as target for standard HF DBS in a case with spinocerebellar ataxia type 2 and severe tremor (Freund et al., 2007). According to a computational study, the beneficial effect of this particular target might be a consequence of the pure excitatory stimulation (Hauptmann and Tass, 2007). However, typically both excitatory and inhibitory structures are affected by stimulation. In general, pure excitatory as well as pure inhibitory stimulation are limiting cases, where in clinical applications mixed excitatory-inhibitory stimulation is more realistic. On the single neuron level the phase reset is a fundamental and robust dynamical mechanism, which can be achieved by hyperpolarizing or depolarizing electrical pulses (Best, 1979; Demir et al., 1997; Neiman et al., 2007; Tateno and Robinson, 2007) as well as by excitatory or inhibitory PSPs (Perkel et al., 1964; Pinsker, 1977; Lerma and Garcia-Austt, 1985; Jackson et al., 2002; Prinz et al., 2003). Accordingly, on a population level a timely coordinated phase reset in different sub-populations can be robustly achieved, no matter which portion of randomly selected neurons undergoes a phase reset via excitatory or inhibitory stimulation (Figure 12). We have chosen a mixed stimulation set-up, where a portion (ranging from 0 − 100%) of randomly selected neurons receives inhibitory stimulation. Remarkably, CR robustly causes an anti-kindling over the entire inhibitory range, i.e. from 0 to 100% (Figure 12).
Our results have four major consequences:
- Local effects of HF DBS (in the vicinity of the stimulation electrode) and non-local effects of HF DBS caused by an activation of fibers may differ considerably (McIntyre et al., 2004b). The local effects may be inhibitory due to direct electrical effects of HF DBS on voltage-gated currents leading to a depolarization blockade (Beurrier et al., 2001) or to low-amplitude subthreshold oscillations of the membrane potential (Pyragas et al., 2012). In addition, inhibitory local effects may arise from an excitation of axon terminals connected to neurons by inhibitory synapses (synaptic inhibition) (Dostrovsky et al., 2000). In contrast, the non-local effects may be excitatory due to a HF axonal output via an activation of excitatory projection neurons (McIntyre et al., 2004a). In contrast, our results indicate that the local effects (mediated by direct stimulation of somata or stimulation of inhibitory axon terminals) and the non-local effects (mediated by stimulation of excitatory fibers) of deep brain CR stimulation may be the same, so that the beneficial effect, the desynchronization, is achieved both locally (in the vicinity of the electrode) and non-locally (via projecting fibers).
- From a theoretical standpoint our results indicate that the initially DBS oriented concept of direct electrical brain CR stimulation may be extended to a more general concept of CR neuromodulation comprising both invasive and non-invasive (e.g., sensory) applications. In fact, acoustic CR neuromodulation has already been applied to counteract chronic subjective tinnitus and the underlying pathological neuronal synchronization (Tass et al., 2012). Subjective tinnitus is a percept of sound without an objectively identifiable sound source, which often emerges as consequence of a hearing loss (Lockwood et al., 2002; Eggermont, 2003; Moller, 2003; Weisz et al., 2005). Pathologically increased delta band activity is observed in cortical regions deprived of afferent input (Steriade, 2006). Correspondingly, pathologically enhanced neuronal synchronization was found, e.g., in auditory brain areas of tinnitus patients (Llinas et al., 1999; Weisz et al., 2005, 2007). To perform an acoustic CR neuromodulation for the treatment of chronic subjective tinnitus, the tonotopic organization of the central auditory system was used, and electrical stimulation bursts applied to different brain sites were replaced by acoustically delivered tones of different pitch (Tass et al., 2012). This type of treatment turned out to significantly counteract both tinnitus symptoms and the underlying pathological neuronal synchronization (Tass et al., 2012). In a prospective, randomized, single blind, placebo-controlled trial in 63 patients with chronic tonal tinnitus it was shown that CR treatment was safe and well-tolerated and resulted in a highly significant decrease of tinnitus loudness and symptoms as measured by VAS and TQ scores (Tass et al., 2012). Furthermore, as shown by means of EEG recordings, acoustic CR stimulation significantly decreased the tinnitus-related abnormal neuronal synchronization processes (Tass et al., 2012).
- For strong stimulation in our models we observed a non-trivial relationship between the effects during CR stimulation and after turning off CR stimulation: in the FHR network direct electrical CR stimulation and indirect (e.g., sensory) CR stimulation can lead to a long-lasting rewiring and desynchronization without any noticeable acute effect (Figures 8 and 10), whereas for the HH network a pronounced desynchronization during CR stimulation may not guarantee any long-lasting desynchronization (Figures 9 and 11). In fact, in our models we found an optimal range of the stimulation intensity, within which CR stimulation effectively induces long-lasting desynchronization and anti-kindling. Previously, we reported on such an optimal parameter range already for simpler models of coupled phase oscillators and FitzHugh-Nagumo spiking neurons both without STDP (Lysyansky et al., 2011). In this paper we generalize our findings to more complicated and more realistic neuronal models and coupling topologies comprising STDP as well as for the three stimulation modalities (being direct electrical, indirect excitatory, and indirect inhibitory). Our findings indicate that in the case of strong stimulation desynchronizing effects achieved during CR stimulation need not be predictive of long-lasting desynchronizing effects, persisting after stimulus offset.
- For our models we may compare the robustness of the direct electrical CR stimulation to that of the indirect (e.g., sensory) excitatory and indirect (e.g., sensory) inhibitory CR stimulation. For this we compare the relative lengths of the parameter K intervals KR = (K2 − K1)/K1 related to effective CR stimulation, see Figures 10 and 11. We found that KR ≈ 32, KR ≈ 29, and KR ≈ 27 for the direct electrical, indirect (e.g., sensory) excitatory, and indirect (e.g., sensory) inhibitory CR stimulation for the HH neurons, respectively (Figure 11). For the FHR neurons the corresponding values read KR ≈ 38, KR ≈ 635, and KR ≈ 624 (Figure 10). We conclude that in our models the indirect (synaptically-mediated, e.g., sensory) CR stimulation is at least as robust as the direct electrical CR stimulation. In some cases, however, it may be even much more robust than the direct electrical CR stimulation concerning an induction of long-lasting desynchronizing effects. These results indicate that it might be a fruitful approach to counteract pathological neuronal synchronization by desynchronizing non-invasive, sensory CR neuromodulation [see (Tass et al., 2012)].
Conflict of Interest Statement
Dr. Peter Tass has a contractual relationship with ANM Adaptive Neuromodulation GmbH. No financial interests exist related to the presented results. Dr. Popovych declares that the research was conducted in the absence of any commercial or financial relationships that could be construed as a potential conflict of interest.
References
Benabid, A. L., Benazzous, A., and Pollak, P. (2002). Mechanisms of deep brain stimulation. Mov. Disord. 17, S73–S74.
Benabid, A. L., Pollak, P., Gervason, C., Hoffmann, D., Gao, D. M., Hommel, M., Perret, J. E., and de Rougemount, J. (1991). Longterm suppression of tremor by chronic stimulation of ventral intermediate thalamic nucleus. Lancet 337, 403–406.
Best, E. N. (1979). Null space in the Hodgkin–Huxley equations: a critical test. Biophys. J. 27, 87–104.
Beurrier, C., Bioulac, B., Audin, J., and Hammond, C. (2001). High-frequency stimulation produces a transient blockade of voltage-gated currents in subthalamic neurons. J. Neurophysiol. 85, 1351–1356.
Bi, G.-Q., and Poo, M.-M. (1998). Synaptic modications in cultured hippocampal neurons: dependence on spike timing, synaptic strength, and postsynaptic cell type. J. Neurosci. 18, 10464–10472.
Caporale, N., and Dan, Y. (2008). Spike timing-dependent plasticity: a hebbian learning rule. Annu. Rev. Neurosci. 31, 25–46.
Debanne, D., Gahweiler, B., and Thompson, S. (1998). Long-term synaptic plasticity between pairs of individual CA3 pyramidal cells in rat hippocampus slice cultures. J. Physiol. 507, 237–247.
de la Rocha, J., Marchetti, C., Schiff, M., and Reyes, A. D. (2008). Linking the response properties of cells in auditory cortex with network architecture: cotuning versus lateral inhibition. J. Neurosci. 28, 9151–9163.
Demir, S. S., Butera, R. J., DeFranceschi, A. A., Clark, J. W., and Byrne, J. H. (1997). Phase sensitivity end entrainment in a modeled bursting neuron. Biophys. J. 72, 579–594.
Dominguez, M., Becker, S., Bruce, I., and Read, H. (2006). A spiking neuron model of cortical correlates of sensorineural hearing loss: spontaneous firing, synchrony, and tinnitus. Neural Comput. 18, 2942–2958.
Dostrovsky, J. O., Levy, R., Wu, J. P., Hutchison, W. D., Tasker, R. R., and Lozano, A. M. (2000). Microstimulation-induced inhibition of neuronal firing in human globus pallidus. J. Neurophysiol. 84, 570–574.
Feldman, D. E. (2000). Timing-based LTP and LTD at vertical inputs to layer II/III pyramidal cells in rat barrel cortex. Neuron 27, 45–56.
Freund, H.-J. (2005). Long-term effects of deep brain stimulation in Parkinson's disease. Brain 128, 2222–2223.
Freund, H. J., Barnikol, U. B., Nolte, D., Treuer, H., Auburger, G., Tass, P. A., Samii, M., and Sturm, V. (2007). Subthalamic-thalamic DBS in a case with spinocerebellar ataxia type 2 and severe tremor - a unusual clinical benefit. Mov. Disord. 22, 732–735.
Gerstner, W., Kempter, R., van Hemmen, J. L., and Wagner, H. (1996). A neuronal learning rule for sub-millisecond temporal coding. Nature 383, 76–78.
Gerstner, W., and Kistler, W. M. (2002). Spiking Neuron Models: Single Neurons, Populations, Plasticity. Cambridge, MA: Cambridge University Press.
Givens, B. (1996). Stimulus-evoked resetting of the dentate 1 theta rhythm: relation to working memory. Neuroreport 8, 159–163.
Golomb, D., and Rinzel, J. (1993). Dynamics of globally coupled inhibitory neurons with heterogeneity. Phys. Rev. E Stat. Phys. Plasmas Fluids Relat. Interdiscip. Topics 48, 4810–4814.
Gulick, W., Gescheider, G., and Frisina, R. (1989). Hearing: Physiological Acoustics, Neural Coding, and Psychoacoustics. Oxford, UK: Oxford University Press.
Hansel, D., Mato, G., and Meunier, C. (1993). Phase dynamics of weakly coupled Hodgkin–Huxley neurons. Europhys. Lett. 23, 367–372.
Hauptmann, C., Popovych, O., and Tass, P. A. (2005). Effectively desynchronizing deep brain stimulation based on a coordinated delayed feedback stimulation via several sites: a computational study. Biol. Cybern. 93, 463–470.
Hauptmann, C., and Tass, P. A. (2007). Therapeutic rewiring by means of desynchronizing brain stimulation. Biosystems 89, 173–181.
Hodgkin, A., and Huxley, A. F. (1952). A quantitative description of membrane current and application to conduction and excitation. J. Physiol. 117, 500–544.
Izhikevich, E. M. (2007). Dynamical Systems in Neuroscience: The Geometry of Excitability and Bursting. Cambridge, MA: MIT Press.
Jackson, A., Spinks, R. L., Freeman, T. C. B., Wolpert, D. M., and Lemon, R. N. (2002). Rhythm generation in monkey motor cortex explored using pyramidal tract stimulation. J. Physiol. 541, 685–699.
Jansen, B. H., Agarwal, G., Hegde, A., and Boutros, N. N. (2003). Phase synchronization of the ongoing EEG and auditory EP generation. Clin. Neurophysiol. 114, 79–85.
Kelly, R. C., Smith, M. A., Kass, R. E., and Lee, T. S. (2010). Local field potentials indicate network state and account for neuronal response variability. J. Comput. Neurosci. 29, 567–579.
Kepecs, A., van Rossum, M., Song, S., and Tagner, J. (2002). Spike-timing dependent plasticity: common themes and divergent vistas. Biol. Cybern. 87, 446–458.
Krachkovskyi, V., Popovych, O. V., and Tass, P. A. (2006). Stimulus-locked responses of two phase oscillators coupled with delayed feedback. Phys. Rev. E Stat. Nonlin. Soft Matter Phys. 73, 066220.
Kumar, R., Lozano, A. M., Sime, E., and Lang, A. E. (2003). Long-term follow up of thalamic deep brain stimulation for essential and parkinsonian tremor. Neurology 61, 1601–1604.
Kuramoto, Y. (1984). Chemical Oscillations, Waves, and Turbulence. Berlin, Heidelberg, New York: Springer.
Lenz, F. A., Kwan, H. C., Martin, R. L., Tasker, R. R., Dostrovsky, J. O., and Lenz, Y. E. (1994). Single-unit analysis of the human ventral thalamic nuclear group - tremor-related activity in functionally identified cells. Brain 117, 531–543.
Lerma, J., and Garcia-Austt, E. (1985). Hippocampal theta rhythm during paradoxical sleep - effects of afferent stimuli and phase-relationships with phasic events. Electroencephalogr. Clin. Neurophysiol. 60, 46–54.
Limousin, P., Speelman, J. D., Gielen, F., and Janssens, M. (1999). Multicentre European study of thalamic stimulation in parkinsonian and essential tremor. J. Neurol. Neurosurg. Psychiatry 66, 289–296.
Llinas, R. R., Ribary, U., Jeanmonod, D., Kronberg, E., and Mitra, P. P. (1999). Thalamocortical dysrhythmia: a neurological and neuropsychiatric syndrome characterized by magnetoencephalography. Proc. Natl. Acad. Sci. U.S.A. 96, 15222–15227.
Lockwood, A. H., Salvi, R. J., and Burkard, R. F. (2002). Current concepts: tinnitus. N. Engl. J. Med. 347, 904–910.
Lysyansky, B., Popovych, O. V., and Tass, P. A. (2011). Desynchronizing antiresonance effect of m: n on-off coordinated reset stimulation. J. Neural Eng. 8, 036019.
Makeig, S., Westerfield, M., Jung, T. P., Enghoff, S., Townsend, J., Courchesne, E., and Sejnowski, T. J. (2002). Dynamic brain sources of visual evoked responses. Science 295, 690–694.
Markram, H., Lübke, J., Frotscher, M., and Sakmann, B. (1997). Regulation of synaptic efficacy by coincidence of postsynaptic APs and EPSPs. Science 275, 213–215.
McIntyre, C. C., Grill, W. M., Sherman, D. L., and Thakor, N. V. (2004a). Cellular effects of deep brain stimulation: model-based analysis of activation and inhibition. J. Neurophysiol. 91, 1457–1469.
McIntyre, C. C., Savasta, M., Goff, L. K.-L., and Vitek, J. L. (2004b). Uncovering the mechanism(s) of action of deep brain stimulation: activation, inhibition, or both. Clin. Neurophysiol. 115, 1239–1248.
Neiman, A., Russell, D., Yakusheva, T., DiLullo, A., and Tass, P. A. (2007). Response clustering in transient stochastic synchronization and desynchronization of coupled neuronal bursters. Phys. Rev. E Stat. Nonlin. Soft Matter Phys. 76, 021908.
Nini, A., Feingold, A., Slovin, H., and Bergmann, H. (1995). Neurons in the globus pallidus do not show correlated activity in the normal monkey, but phase-locked oscillations appear in the MPTP model of parkinsonism. J. Neurophysiol. 74, 1800–1805.
Patuzzi, R., and Robertson, D. (1988). Tuning in the mammalian cochlea. Physiol. Rev. 68, 1009–1082.
Perkel, D. H., Schulman, J. H., Segundo, J. P., Bullock, T. H., and Moore, G. P. (1964). Pacemaker neurons - effects of regularly spaced synaptic input. Science 145, 61–63.
Pikovsky, A., Rosenblum, M., and Kurths, J. (2001). Synchronization, A Universal Concept in Nonlinear Sciences. Cambridge, MA: Cambridge University Press.
Pinsker, H. M. (1977). Aplysia bursting neurons as endogenous oscillators. 1. phase-response curves for pulsed inhibitory synaptic input. J. Neurophysiol. 40, 527–543.
Popovych, O. V., Hauptmann, C., and Tass, P. A. (2005). Effective desynchronization by nonlinear delayed feedback. Phys. Rev. Lett. 94, 164102.
Popovych, O. V., Hauptmann, C., and Tass, P. A. (2006). Control of neuronal synchrony by nonlinear delayed feedback. Biol. Cybern. 95, 69–85.
Popovych, O. V., and Tass, P. A. (2010). Synchronization control of interacting oscillatory ensembles by mixed nonlinear delayed feedback. Phys. Rev. E Stat. Nonlin. Soft Matter Phys. 82, 026204
Popovych, O. V., and Tass, P. A. (2011). Macroscopic entrainment of periodically forced oscillatory ensembles. Prog. Biophys. Mol. Biol. 105, 98–108.
Prinz, A. A., Thirumalai, V., and Marder, E. (2003). The functional consequences of changes in the strength and duration of synaptic inputs to oscillatory neurons. J. Neurosci. 23, 943–954.
Pyragas, K., Novicenko, V., and Tass, P. (2012). Mechanism of suppression of neuronal sustained spiking under high-frequency stimulation. (submitted).
Pyragas, K., Popovych, O. V., and Tass, P. A. (2007). Controlling synchrony in oscillatory networks with a separate stimulation-registration setup. Europhys. Lett. 80, 40002.
Richardson, K. A., Gluckman, B. J., Weinstein, S. L., Glosch, C. E., Moon, J. B., Gwinn, R. P., Gale, K., and Schiff, S. J. (2003). In vivo modulation of hippocampal epileptiform activity with radial electric fields. Epilepsia 44, 768–777.
Rinzel, J. A. (1987). “A formal classification of bursting mechanisms in excitable systems,” in Mathematical Topics in Population Biology, Morphogenesis and Neurosciences, Lecture Notes in Biomathematics, Vol. 71, eds E. Teramoto and M. Yamaguti (New York NY: Springer-Verlag), 267–281.
Robertson, D., and Irvine, D. R. F. (1989). Plasticity of frequency organization in auditory-cortex of guinea-pigs with partial unilateral deafness. J. Comp. Neurol. 282, 456–471.
Rodriguez-Oroz, M. C., Obeso, J. A., Lang, A. E., Houeto, J. L., Pollak, P., Rehncrona, S., Kulisevsky, J., Albanese, A., Volkmann, J., Hariz, M. I., Quinn, N. P., Speelman, J. D., Guridi, J., Zamarbide, I., Gironell, A., Molet, J., Pascual-Sedano, B., Pidoux, B., Bonnet, A. M., Agid, Y., Xie, J., Benabid, A. L., Lozano, A. M., Saint-Cyr, J., Romito, L., Contarino, M. F., Scerrati, M., Fraix, V., and van Blercom, N. (2005). Bilateral deep brain stimulation in Parkinson's disease: a multicentre study with 4 years follow-up. Brain 128, 2240–2249.
Rosenblum, M. G., and Pikovsky, A. S. (2004). Controlling synchronization in an ensemble of globally coupled oscillators. Phys. Rev. Lett. 92, 114102.
Ross, B., Herdman, A. T., and Pantev, C. (2005). Stimulus induced desynchronization of human auditory 40-hz steady-state responses. J. Neurophysiol. 94, 4082–4093.
Steriade, M. (2006). Grouping of brain rhythms in corticothalamic systems. Neuroscience 137, 1087–1106.
Tass, P., Adamchic, I., Freund, H.-J., von Stackelberg, T., and Hauptmann, C. (2012). Counteracting tinnitus by acoustic coordinated reset neuromodulation. Restor. Neurol. Neurosci. 30, 367–374.
Tass, P. A. (1999). Phase Resetting in Medicine and Biology: Stochastic Modelling and Data Analysis. Berlin: Springer.
Tass, P. A. (2001). Effective desynchronization by means of double-pulse phase resetting. Europhys. Lett. 53, 15–21.
Tass, P. A. (2003a). Desynchronization by means of a coordinated reset of neural sub-populations - a novel technique for demand-controlled deep brain stimulation. Prog. Theor. Phys. Suppl. 150, 281–296.
Tass, P. A. (2003b). A model of desynchronizing deep brain stimulation with a demand-controlled coordinated reset of neural subpopulations. Biol. Cybern. 89, 81–88.
Tass, P. A. (2003c). Stochastic phase resetting of stimulus-locked responses of two coupled oscillators: transient response clustering, synchronization, and desynchronization. Chaos 13, 364–376.
Tass, P. A. (2003d). Stochastic phase resetting of two coupled phase oscillators stimulated at different times. Phys. Rev. E Stat. Nonlin. Soft Matter Phys. 67, 051902.
Tass, P. A., and Majtanik, M. (2006). Long-term anti-kindling effects of desynchronizing brain stimulation: a theoretical study. Biol. Cybern. 94, 58–66.
Tass, P. A., Silchenko, A. N., Hauptmann, C., Barnikol, U. B., and Speckmann, E. J. (2009). Long-lasting desynchronization in rat hippocampal slice induced by coordinated reset stimulation. Phys. Rev. E Stat. Nonlin. Soft Matter Phys. 80, 011902.
Tateno, T., and Robinson, H. P. C. (2007). Phase resetting curves and oscillatory stability in interneurons of rat somatosensory cortex. Biophys. J. 92, 683–695.
Terman, D., Rubin, J. E., Yew, A. C., and Wilson, C. J. (2002). Activity patterns in a model for the subthalamopallidal network of the basal ganglia. J. Neurosci. 22, 2963–2976.
Vitek, J. L. (2002). Mechanisms of deep brain stimulation: excitation or inhibition. Mov. Disord. 17, S69–S72.
Volkmann, J. (2004). Deep brain stimulation for the treatment of Parkinson's disease. J. Clin. Neurophysiol. 21, 6–17.
Weisz, N., Moratti, S., Meinzer, M., Dohrmann, K., and Elbert, T. (2005). Tinnitus perception and distress is related to abnormal spontaneous brain activity as measured by magnetoencephalography. PLoS Med. 2:e153. doi: 10.1371/journal.pmed.0020153
Weisz, N., Muller, S., Schlee, W., Dohrmann, K., Hartmann, T., and Elbert, T. (2007). The neural code of auditory phantom perception. J. Neurosci. 27, 1479–1484.
Van der Werf, Y. D., and Paus, T. (2006). The neural response to transcranial magnetic stimulation of the human motor cortex. I. Intracortical and cortico-cortical contributions. Exp. Brain Res. 175, 231–245.
Keywords: coordinated reset neuromodulation, neuronal synchronization, electrical stimulation, sensory stimulation, spike timing-dependent plasticity, anti-kindling
Citation: Popovych OV and Tass PA (2012) Desynchronizing electrical and sensory coordinated reset neuromodulation. Front. Hum. Neurosci. 6:58. doi: 10.3389/fnhum.2012.00058
Received: 07 October 2011; Accepted: 03 March 2012;
Published online: 20 March 2012.
Edited by:
Hubert R. Dinse, Ruhr-Universität Bochum, GermanyReviewed by:
Hubert R. Dinse, Ruhr-Universität Bochum, GermanyRolf P. Würtz, Ruhr-University of Bochum, Germany
Copyright: © 2012 Popovych and Tass. This is an open-access article distributed under the terms of the Creative Commons Attribution Non Commercial License, which permits non-commercial use, distribution, and reproduction in other forums, provided the original authors and source are credited.
*Correspondence: Oleksandr V. Popovych, Research Center Jülich, Institute of Neuroscience and Medicine – Neuromodulation (INM-7), D-52425 Jülich, Germany. e-mail: o.popovych@fz-juelich.de