Neural correlates of visual–spatial attention in electrocorticographic signals in humans
- 1 Division of Translational Medicine, BCI R&D Programme, Wadsworth Center, New York State Department of Health, Albany, NY, USA
- 2 Department of Neurology, Albany Medical College, Albany, NY, USA
- 3 Institute for Computer Graphics and Vision, Graz University of Tech, Graz, Austria
- 4 Department of Biomedical Engineering, Washington University, St. Louis, MO, USA
- 5 Department of Neurosurgery, Washington University, St. Louis, MO, USA
- 6 Center for Neural Science, New York University, New York, NY, USA
- 7 School of Public Health, State University of New York, Albany, NY, USA
Attention is a cognitive selection mechanism that allocates the limited processing resources of the brain to the sensory streams most relevant to our immediate goals, thereby enhancing responsiveness and behavioral performance. The underlying neural mechanisms of orienting attention are distributed across a widespread cortical network. While aspects of this network have been extensively studied, details about the electrophysiological dynamics of this network are scarce. In this study, we investigated attentional networks using electrocorticographic (ECoG) recordings from the surface of the brain, which combine broad spatial coverage with high temporal resolution, in five human subjects. ECoG was recorded when subjects covertly attended to a spatial location and responded to contrast changes in the presence of distractors in a modified Posner cueing task. ECoG amplitudes in the alpha, beta, and gamma bands identified neural changes associated with covert attention and motor preparation/execution in the different stages of the task. The results show that attentional engagement was primarily associated with ECoG activity in the visual, prefrontal, premotor, and parietal cortices. Motor preparation/execution was associated with ECoG activity in premotor/sensorimotor cortices. In summary, our results illustrate rich and distributed cortical dynamics that are associated with orienting attention and the subsequent motor preparation and execution. These findings are largely consistent with and expand on primate studies using intracortical recordings and human functional neuroimaging studies.
1 Introduction
Our senses constantly provide the brain with far more information from the surrounding environment than can be processed. Thus, the limited cortical resources need to be selectively allocated to sensory streams that are most relevant to our immediate goals. This cognitive selection mechanism is referred to as attention. It improves the processing efficiency of the received information, which in turn allows us to detect changes in a sensory input and guide behavior faster and more accurately (Posner, 1980).
The neural mechanisms supporting orienting of visual attention are distributed across a widespread dynamic network. The rich literature of single-unit recordings in non-human primates has provided substantive insight to the attentional mechanisms of stimulus selection in the visual cortex (Moran and Desimone, 1985; Motter, 1993; Luck et al., 1997; Ghose and Maunsell, 2008; Lee and Maunsell, 2010) and top-down control of visual processing (Awh et al., 2006; Buschman and Miller, 2007; Gregoriou et al., 2009) in the frontal (Moran and Desimone, 1985; Motter, 1993; Luck et al., 1997; Ghose and Maunsell, 2008) and parietal cortices (Colby et al., 1996; Gottlieb et al., 1998; Goldberg et al., 2002; Bisley and Goldberg, 2003). Lesions in only one component of this fronto-parietal network lead to partial unilateral neglect syndromes (Gainotti et al., 1974; Sperry, 1974; Mesulam, 1981). Functional magnetic resonance imaging (fMRI) studies in humans have repeatedly confirmed the roles of the visual, posterior parietal (PP), and prefrontal cortices in orienting of attention (Corbetta et al., 1998; Kastner et al., 1999; Hopfinger et al., 2000; Corbetta and Shulman, 2002; Yantis et al., 2002; Strotzer, 2009; Mantini et al., 2010; Szczepanski et al., 2010). Neural correlates of visual attention were also studied in humans using electroencephalography (EEG; Ray and Cole, 1985; Worden et al., 2000; Fan et al., 2007).
Despite this body of work, the relative contributions of these areas to guiding spatial selection and visuomotor behavior are still poorly understood. This is due mainly to the limitations of traditional imaging methods. In particular, while microelectrode recordings shed light on the specialized functions of highly localized cortical regions, they typically do not capture activity across spatially distributed networks simultaneously. Thus, they cannot characterize activity in distributed networks or their interactions. fMRI, on the other hand, cannot capture the dynamics of attentional mechanisms with high temporal resolution. This limitation is due in part to technical factors (e.g., scanning durations), but more fundamentally to the temporal characteristics of the hemodynamic response, which limits the temporal resolution of fMRI to several seconds (Aine, 1995; Shibasaki, 2008). In addition, the hemodynamic response is a metabolic, and thus indirect, measurement, which is influenced not only by local cortical processing (Logothetis et al., 2001), but also by larger-scale brain dynamics (Hermes et al., 2011). Finally, scalp-recorded EEG has high temporal resolution, but also has low signal-to-noise ratio (SNR) and low spatial resolution (Nunez and Srinivasan, 2005), which limits the degree to which activity from specific brain regions can be resolved.
In contrast to these signal modalities, recordings from electrodes placed subdurally on the surface of the brain (electrocorticography, ECoG) offer a unique opportunity to study electrophysiological mechanisms of orienting attention in humans with broad spatial coverage, high temporal resolution, and high signal fidelity. In this paper, we report on the spatial distribution of goal-directed visual processing and motor planning/execution in a modified Posner cueing task (Posner et al., 1980) in five subjects and show examples of its temporal evolution. This is the first comprehensive human ECoG study that provides a detailed spatiotemporal characterization of distributed cortical areas engaged across different phases of the task (i.e., sensory selection/detection, motor preparation/execution). These task-related ECoG modulations are studied and compared across alpha (8–12 Hz), beta (18–26 Hz), and high gamma bands (70–170 Hz). The spatiotemporal evolution of the attentional networks at a temporal resolution of 100 ms yields the order of engaged cortical regions and suggests different functional mechanisms across the spectral bands of interest.
2 Materials and Methods
2.1 Human Subjects
Four subjects at Albany Medical Center (AMC) and one subject at Washington University at St. Louis (WashU) participated in this study. The study was approved by the Institutional Review Boards of both hospitals, as well as by the Human Research Protections Office of the U.S. Army Medical Research and Materiel Command. All subjects gave informed consent. Subjects were patients with intractable epilepsy who underwent temporary placement of subdural electrode arrays to localize seizure foci prior to surgical resection. Neuropsychological evaluations revealed low average to superior motor performance (25th–99th percentile, Wechsler, 1997) as well as average to superior visuomotor scanning performance and visual search capacity (37th–91st percentile, Reitan, 1958) across patients.
A summary of the subjects’ clinical profiles is given in Table 1. Subjects A, B, D, E had grids implanted over the left hemisphere, whereas Subject C’s grid was placed on the right hemisphere. We established three-dimensional cortical models of individual subjects using pre-operative structural magnetic resonance imaging (MRI). We then co-registered these MRI images with post-operative computer tomography (CT) images using Curry software (Compumedics, Charlotte, NC, USA), transformed the result into the Talairach coordinate system (Talairach and Tournoux, 1988), and identified electrode locations from the CT images (see Figure 1). We also assigned these electrode locations to Brodmann areas using the Talairach Daemon1 (Lancaster et al., 2000). We generated cortical activation maps using custom Matlab software. To generate these activation maps for individual subjects, we used the cortical model derived from the respective subject. For activation maps that were computed across subjects, we used the three-dimensional cortical template provided by the Montreal Neurological Institute2 (MNI). Note that for visualization purposes, we projected the grid implants of Subject C (whose electrodes were implanted on the right hemisphere) to the left hemisphere.
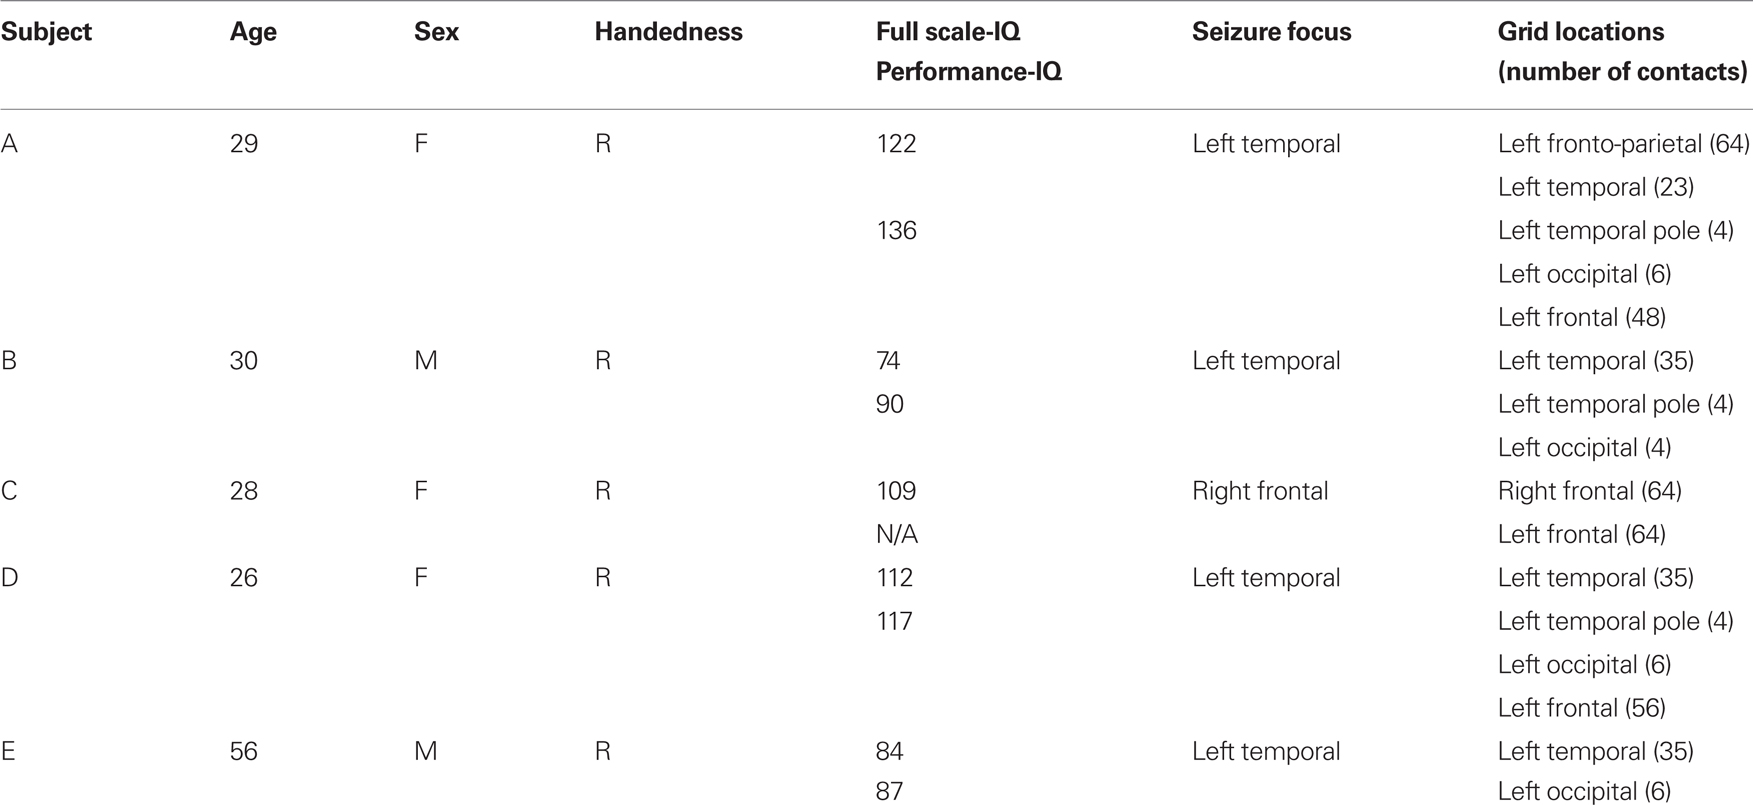
Table 1. Clinical profiles of participants.
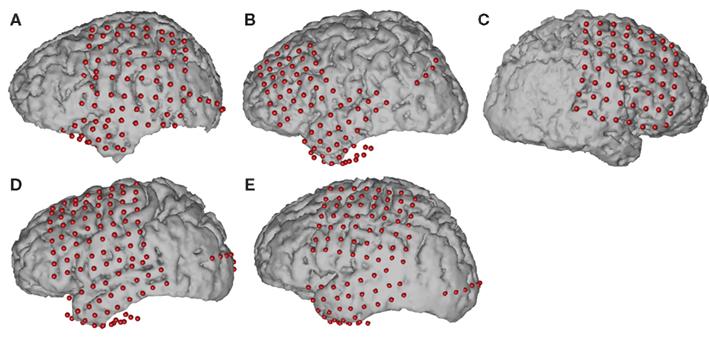
Figure 1. Projected locations of implanted grids on individual subject cortical models reconstructed by pre-op MRI and post-op CT co-registration.
2.2 Data Collection
The experimental setup is depicted in Figure 2. We recorded ECoG signals at the bedside using eight 16-channel g.USBamp biosignal acquisition devices (g.tec, Graz, Austria) at a sampling rate of 1200 Hz. The implanted electrode grids (Ad-Tech Medical Corp., Racine, WI, USA) consisted of platinum-iridium electrodes that were 4 mm in diameter (2.3 mm exposed), spaced at an inter-electrode distance of 1 cm, and were embedded in silicone. Electrode contacts distant from epileptic foci and areas of interest were used for reference and ground. The number of implanted electrodes varied between 64 and 109 contacts across subjects (Table 1).
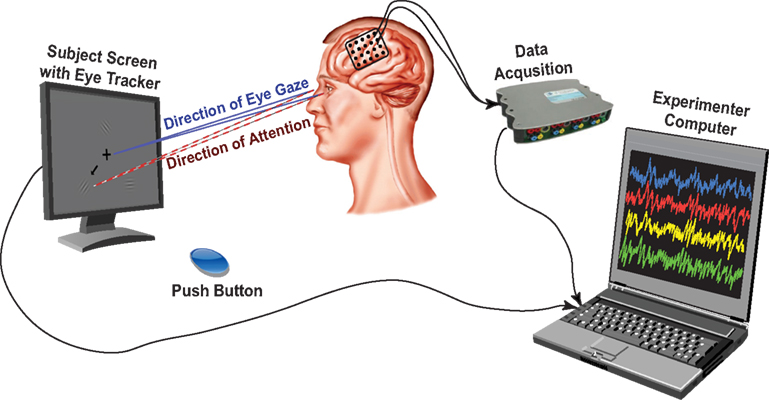
Figure 2. Experimental setup. The subject was presented with visual cues and stimuli on a computer screen with built-in eye tracker, which verified ocular fixation on the central cross during data acquisition. The eye tracker, push button and data acquisition devices were interfaced with a computer running BCI2000, on which the experimenter could observe recordings and subject performance.
In addition to recording brain activity, we also recorded the subjects’ eye gaze using a monitor with a built-in eye tracking system (Tobii Tech., Stockholm, Sweden) positioned 54–60 cm in front of the subjects, and the activity from a push button. The built-in sampling rate of the eye tracker was 60 Hz and it was upsampled to 1200 Hz by sample-and-hold (i.e., no interpolations between two samples from the eye tracker). The eye tracker was calibrated to each subject at the beginning of the experimental session using custom software. Data collection from the biosignal acquisition devices, stimulus presentation, and behavioral variables (i.e., eye tracker, push button), as well as control of the experimental paradigm, were accomplished simultaneously using BCI2000 software (Schalk et al., 2004; Schalk and Mellinger, 2010).
2.3 Experimental Paradigm
The behavioral paradigm used in this study was a modified Posner cueing task (Posner et al., 1980; Posner and Petersen, 1990). Throughout the session, subjects maintained fixation on a cross presented at the center of the screen. A trial aborted if the subjects directed gaze away from the fixation cross beyond a defined radius (20% of the screen height) for more than 500 ms. The experimental stages are summarized in Figure 3. A trial started with the presentation of a cue arrow that pointed away from the center to one of three possible directions (up, down left, or down right). The subjects’ task was to orient covert attention to the cued portion of the screen. Two seconds later, three cosine gratings (i.e., the visual stimuli) appeared around the fixation cross. On valid cue trials, the cue arrow pointed to one of the three stimuli that would subsequently change. After a random short interval (uniformly distributed between 1.5 and 2.5 s), the cued grating changed contrast. Once the subject detected this contrast change, he/she responded by pressing the push button with the hand contralateral to the implant (regardless of their handedness), which ended the trial. The level of contrast change was adaptively estimated for each subject through a parameter estimation through sequential testing (PEST) procedure (Taylor and Creelman, 1967; Hammett and Snowden, 1995) that was run at the beginning of the session. The PEST procedure selected the amount of contrast change such that the performance in detecting the contrast change was approximately 75%.
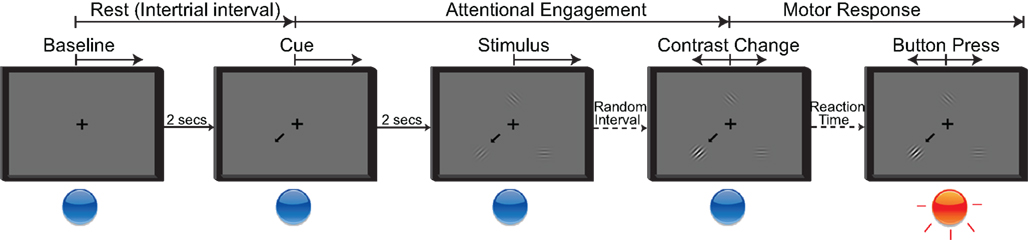
Figure 3. Five stages of the attention task. Rest period: Subjects fixate on the cross; Cue period: Directional cue arrow appears instructing subjects where to orient their attention; Stimulus period: All three stimuli appear; Contrast change: Cued stimulus changes contrast; Button press: Subjects acknowledge the contrast change by pressing the button as quickly as possible.
To ensure that subjects were attending to the stimulus change before responding, we interleaved trials in which the cued stimulus did not change (i.e., a “no change” trial); the subjects were instructed not to respond in such trials. We also incorporated “neutral” cue trials in which three arrows appeared on the screen. This discouraged subjects from attending to any particular location on the screen. In neutral cue trials, when one of the stimuli changed contrast, the subjects again had to respond by pressing the button. Consistent with the literature (Posner, 1980; LaBerge, 1995), the subjects’ reaction time was longer for “neutral” trials compared to valid cue trials.
Each session consisted of one PEST run with 25 trials to estimate the subject-specific level of contrast change. This PEST run was followed by 10 runs of 30 trials each. Twenty percentage of the trials were “no change” trials and 20% were “neutral” cue trials. The remaining trials were valid cue trials. We recorded one experimental session in Subjects A, C, D, and E, and two sessions on two different days in Subject B.
2.4 Feature Extraction and Significance Analysis
Our data analyses began by first high-pass filtering all raw ECoG signals at 0.01 Hz and re-referencing signals from each electrode to a common average reference (CAR; Schalk et al., 2007). The CAR was computed separately for each 16-channel amplifier by spatially averaging its input channels. For each 300 ms time period (66% overlap) and each location, we computed the power spectral density using an autoregressive model (Stoica and Moses, 2005) of order 25 between 0.01 and 170 Hz in 1 Hz bins. We then averaged the spectral amplitudes in alpha, beta, and gamma ranges (i.e., 8–12, 18–26, and 70–170 Hz, respectively).
To study the ECoG correlates of visual–spatial attention, we divided the task into rest (inter-trial interval), attentional engagement, and motor response periods. Figure 3 highlights these time periods and the reference time points for feature extraction. We first labeled the baseline period as “−1” and the attention period as “+1,” and computed the correlation (Pearson’s r) between a particular spectral feature (e.g., high gamma amplitudes at a particular location) with these behavioral labels [i.e., baseline (−1) or attention (+1)]. Thus, a high positive r-value suggests that the amplitude of the examined spectral band (e.g., high gamma) at the location of interest increases relative to rest when the subject attends to a spatial location. Conversely, a high negative value suggests decreased amplitude compared to rest. We repeated this analysis for baseline versus motor response. In addition, we determined the significance (i.e., p-value) that corresponded to a particular r-value. In summary, this analysis, for a particular subject, location, and ECoG feature, yielded the statistical difference between the ECoG features during behavioral engagement and rest. We then projected, for all locations with significant statistical differences (p < 0.05), the negative natural logarithm of the p-values (i.e., activations or significance indices) onto the template brain (see Figure 5).
3 Results
In this study, we set out to identify the distributed brain network that is recruited during attention and the subsequent visuomotor task using human ECoG at high temporal and spectral resolution. For this, we examined the spatiotemporal dynamics of cortical regions during the four stages of the task. The main results of the study are given in Figure 5 which samples the temporally evolving topographical distribution of significant ECoG activity across all patients. Figures 7 and 8 provide a quantitative comparison of the significant activations across different subjects, different spectral bands (i.e., alpha, beta, gamma), and different stages of the task. We describe these results in more detail below.
3.1 Spatiotemporal Correlates of Attention and Motor Response
Figure 4 shows time–frequency plots of four exemplary locations for Subject A. The four electrodes were selected based on primate electrophysiology and human imaging literature, and were over premotor (PM; shown in red), primary motor (M1; orange), PP (yellow), and visual (V2; teal) cortices, respectively. These areas cover areas of sensory, attentional, and intentional processing. Electrode locations were identified using MRI–CT co-registration and Talairach Daemon mapping (see Section 2); motor areas were verified by clinical electrocortical stimulation. Each row in Figure 4B, color coded for its corresponding electrode, shows the time-varying correlation coefficients calculated between ECoG spectral amplitudes (1–200 Hz) and the task, 500 ms before and after the onsets of the four stages of the task. This figure captures the temporal evolution of the task-related activations: After onset of the visual cue (first column), responses are first present over V2 (top row) in the gamma band indicating visual processing. These activations are followed by responses in PM, and then PP, respectively. Over PM and PP, alpha and beta amplitudes show negative correlations, which is consistent with event-related desynchronizations that are often detected in those areas. These transient activations (which disappear ∼600 ms after cue onset) are reinforced after stimulus presentation (see second column). As a button press does not follow, there are no activations over M1 (second row). This dorsal stream extending from visual cortex toward premotor and PP cortices (illustrated in Figure 4C; green arrow), has been implicated in spatial attention studies in primates (Desimone and Duncan, 1995; Rao et al., 1997).
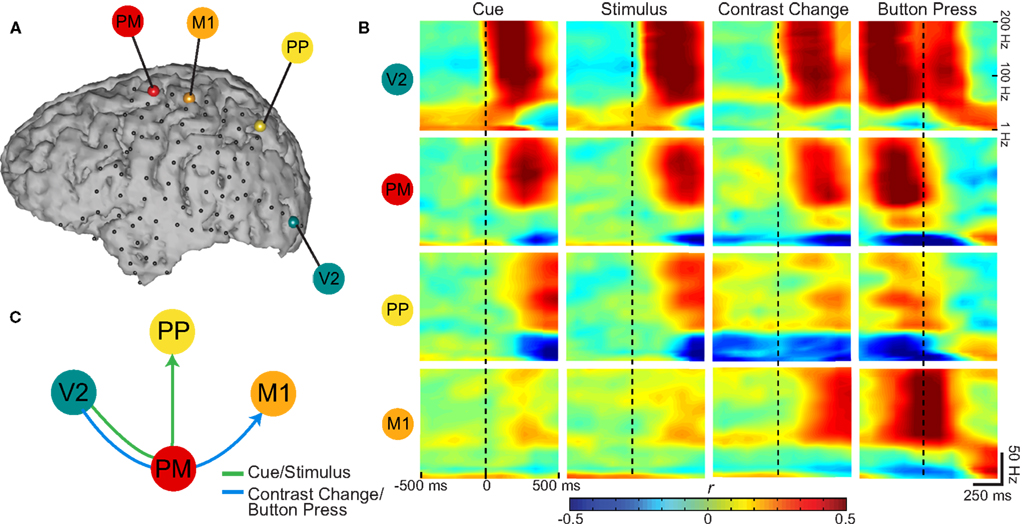
Figure 4. (A) Exemplary channels selected over premotor (PM), primary motor (M1), posterior parietal (PP), and visual (V2) cortices in Subject A for time–frequency analysis. (B) Correlation coefficients (Pearson’s r) between task states and spectral power as a function of time: Rows group the statistics in the color-coded electrodes across different experimental states (grouped in columns). Vertical dashed lines indicate Figure 4. (A) Exemplary channels selected over premotor (PM), primary motor (M1), posterior parietal (PP), and visual (V2) cortices in Subject A for time–frequency analysis. (B) Correlation coefficients (Pearson’s r) between task states and spectral power as a function of time: Rows group the statistics in the color-coded electrodes across different experimental states (grouped in columns). Vertical dashed lines indicate alignment with onsets of the four experimental states. The time axes span ± 500 ms around these onsets. (C) The order of task-correlated gamma activations across selected cortical areas. Cue and stimulus presentation activates a dorsal stream extending from V2 toward PM and PP cortices. Contrast change drives a visuomotor network from V2 toward PM, activating M1 with the button press.
In a similar fashion to the presentation of the cue or the stimulus, the contrast change in the stimulus (third column) first elicits activations in visual areas. In marked contrast to cue or stimulus presentation, this visual activation is followed by not only PM but also M1 activations as button press soon follows (Figure 4C; blue arrow). In fact, activations over the M1 contact are time aligned with the button press (rightmost column). The gamma activations over PP are reduced (Figure 4; third and fourth columns) as motor preparation and execution (i.e., output-oriented processes) take precedence over attentional (i.e., sensory-oriented) processes. The final visual activations are in response to the visual feedback on the screen prompting the end of the trial.
Since it is not practical to present these time–frequency activations on the cortical models for all electrodes, we restricted subsequent spectral analyses to the gamma, beta, and alpha bands. We topographically distributed the behavioral significance of activations across the channels for each spectral band at every 100 ms time shift for each subject. We then accumulated the electrode locations across all subjects and superimposed these findings on the template cortical model. Figure 5 shows the topographic distribution of the superimposed significance indices at the indicated times during the four stages of the task (i.e., 400 ms after cue and stimulus presentation, and at the onset of contrast change and button press). Activations at these representative time points capture the involvement of all cortical areas significant for that stage of the task. The temporal evolution of these activations are not presented here, but follow a similar trend to the example in Figure 4 (i.e., visual activations followed by prefrontal and parietal activations, which lead to primary motor activation).
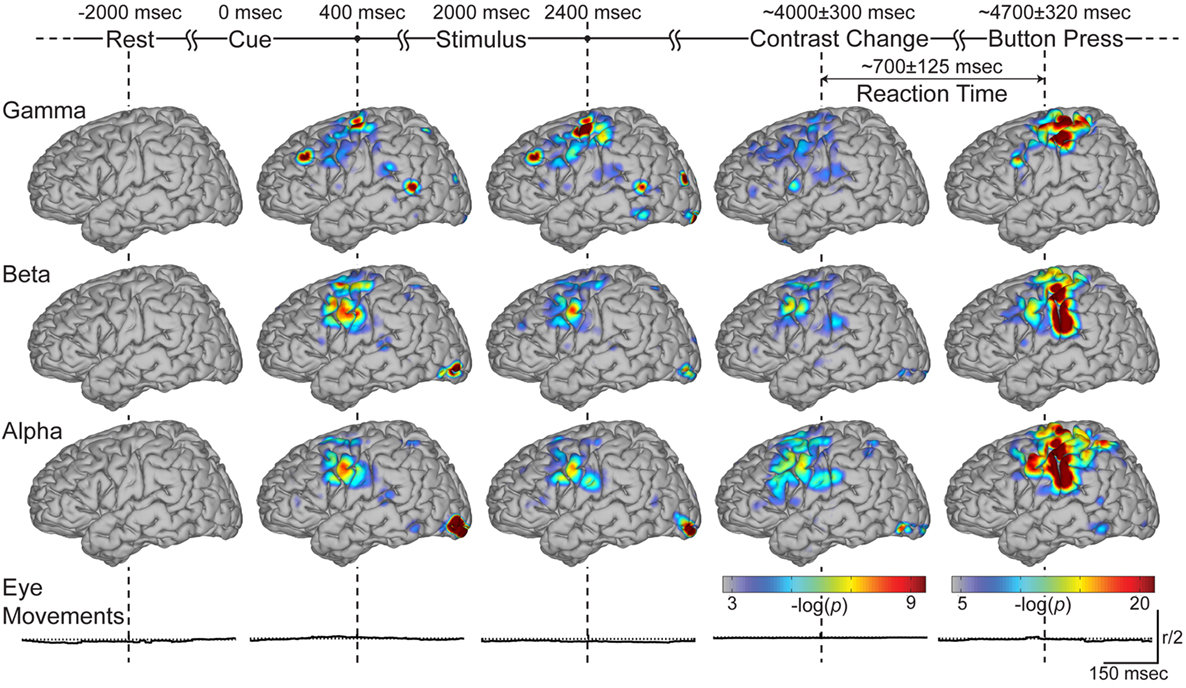
Figure 5. Accumulated brain activations across experimental stages. This figure shows the color-coded spatial distribution of the significance index (negative log of p-values) for gamma, beta, and alpha bands (top three rows respectively) at time stamps significant to the task (indicated with vertical dashed lines). Note that the rightmost column, corresponding to the time around the button press, has a separate color. Bottom row depicts the radial deviation of eye gaze from the fixation cross around the significant time stamps. The vertical scale represents half the magnitude of the allowed radius.
Significant activations are present over visual areas following the presentation of the cue, stimulus, and contrast change. Activations over premotor areas are common in these experimental stages across all frequency bands, with more localized activity in the gamma features. During the periods of covert attention (Figure 5; columns two and three), isolated activations are observed in PP cortex in all three bands. Gamma activations are also present in dorsolateral prefrontal cortex (on the border of Brodmann areas 8 and 9), superior temporal cortex (Brodmann area 39) and around the temporo-parietal junction. We see that these gamma activations are more transient compared to the lower frequency bands (Figure 5; column four). Finally, primary sensorimotor cortex is activated during the button press (Figure 5; column five). Once again, gamma activations over sensorimotor cortex during the button press are more localized. It is of note that significance indices during the button press are larger in magnitude than those during the preceding periods (of covert attention) and thus use a different amplitude scale.
In summary, Figure 5 shows the cortical networks involved in the different stages of the behavioral task, as well as the distribution of activations across different spectral bands. It demonstrates that ECoG activity can capture neural responses not only during sensorimotor tasks, but it can also characterize the distributed neural networks during covert visual attention.
3.2 Control for Eye Movements
We performed additional analyses to verify the potentially confounding influence of eye movements. Although we controlled for eye movements online using an eye tracker, it was still possible that the subjects made small and/or brief eye movements that were related to the cued direction. To determine whether such small or brief eye movements existed, and how they related to the cued direction, we computed, at each point in time and for each trial, the inner product of the eye gaze vector (calculated between the fixation cross and the current eye position) and the cue vector (calculated between the fixation cross and the cue arrow), and normalized the result to the allowed radius. We then averaged the results across trials and subjects. A high value of the resulting “gaze amplitude” would imply that the subjects tended to shift their gaze consistently toward the cued stimulus at a given time. The results are shown in the bottom row of Figure 5. The vertical scale (shown on the right) represents half the magnitude of the allowed radius. These figures demonstrate that, on average, eye movements had only a very negligible relationship with the cued direction. In sum, this offline analysis demonstrates that our results are not related to consistent shifts of gaze toward the attended stimulus.
3.3 Comparison of cortical activations across behavioral stages and spectral bands
Figure 5 demonstrated the spatial distribution of significant ECoG activations. To quantify different aspects of these results, we tabulated the number of electrodes with significant activations, separately for different subjects, frequency bands, and task periods. These results are shown in Figure 6. Because one electrode, on average, covers an area of one square centimeter, the results allow for an estimate of the size of the cortical area involved in a particular task. We observe the largest number of significant activations during motor execution across all subjects and frequency bands. Their significance values were also higher than during the covert stages of the task (Figure 5).
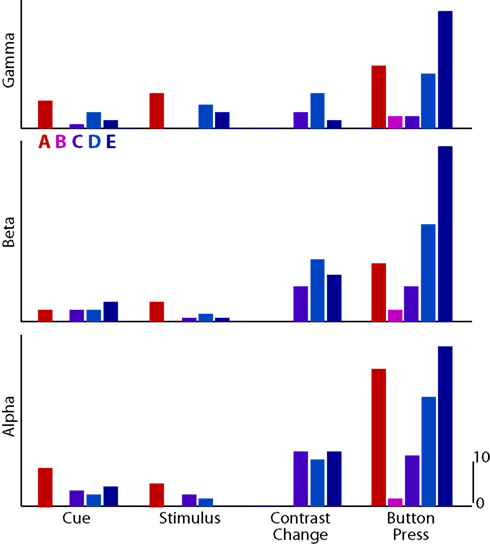
Figure 6. Number of significant electrodes for each subject (color-coded columns; Subjects A–E) and experimental state (grouped columns), for gamma, beta, and alpha bands (rows).
We also quantified the percentage of overlapping activations shown in Figure 5 across the different frequency bands and for each experimental stage. The color coded results are shown in Figure 7. They demonstrate that the spatial pattern of gamma activations is quite different compared to that of alpha and beta activations during cue presentation, stimulus presentation, and contrast change. They also show that alpha and beta activations are much more co-localized with gamma activations during the button press. This is consistent with a recent study (Miller et al., 2010) that also found co-localization during motor performance.
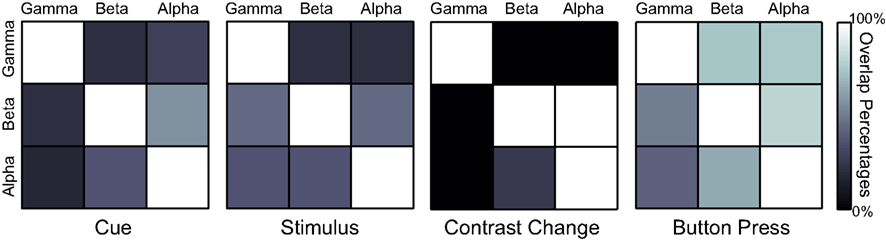
Figure 7. Overlap percentages of accumulated activations across three spectral bands at four task stages. A color-coded element at row i and column j represents the percentage of the activations in band i that are present in activations of band j at a particular stage of the task.
Finally, we quantified the percentage of overlap within each band, but across the four experiment stages (see Figure 8). The results show that the activations during the button press are significantly different in their spatial distribution from those of the three previous experimental stages for all three frequency bands. The activations for the cue and stimulus periods overlap significantly in the gamma and alpha bands, whereas cue presentation and contrast change have higher overlap in the beta band.
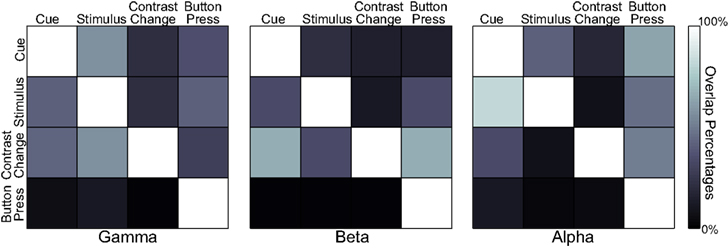
Figure 8. Overlap percentages of accumulated activations across four task states in each spectral band. A color-coded element at row i and column j represents the percentage of the activations at state i that are present in activations at state j for a particular spectral band.
In summary, these analyses provide a quantitative assessment of the qualitative results shown in Figure 5 across attentional and motor preparation/execution networks, and across the gamma, beta, and alpha bands.
4 Discussion
In the first comprehensive study of its kind, we investigated attentional networks using ECoG recordings from human subjects. The experimental paradigm used in our study specifically taxes goal-directed attention, which is engaged following the display of the instructional cue and goal-relevant stimuli. Our results illustrate rich and distributed cortical dynamics that are associated with visual attention, visuomotor preparation, and execution.
These findings are largely consistent with and expand on animal electrophysiology studies using intracortical recordings and human studies using fMRI that have identified cortical areas involved in visual attention. For instance, activations over the PP cortex shown in our study (Figure 5; columns one and two) have been related to orienting attention in a previous study (Fan et al., 2007), and are also in line with primate and human studies on attentional networks that pinpoint dorsal PP cortex along the intraparietal sulcus (Posner and Dehaene, 1994; Corbetta and Shulman, 2002; Simon et al., 2002; Bisley and Goldberg, 2003; Ganguli et al., 2008; Posner, 2008; Sestieri et al., 2010). Activations in premotor cortex may be attributable to both executive attention (i.e., the anticipation of the contrast change and movement initiation) and orienting attention (Lebedev and Wise, 2001; Simon et al., 2002; Brovelli et al., 2005; Fan et al., 2007). Gamma activations over the dorsolateral prefrontal cortex (superior frontal sulcus) have been associated with sustaining attention (Dias et al., 1996; Lloyd, 2007), executive attention (Posner, 2008), and higher cognitive processing (Strotzer, 2009) in previous studies. These gamma activations are also close to frontal eye fields, which have been linked to orienting attention (Rizzolatti et al., 1983; Sheliga et al., 1994; Corbetta and Shulman, 2002; Monosov et al., 2008; Capotosto et al., 2009). In addition, gamma activations are present also over superior temporal cortex (Brodmann area 39) and close to the temporo-parietal junction. The former region is involved in spatial orientation, imagery (Strotzer, 2009) and attention (Lloyd, 2007), whereas the latter has been associated with stimulus-driven (i.e., alerting) attention (Corbetta and Shulman, 2002; Shulman et al., 2009; Doricchi et al., 2010).
Our results are also in line with previous studies that used scalp-recorded EEG. For instance, Ray and Cole (1985) showed that attention involves a fronto-parietal network. Fan et al. (2007) demonstrated that the orienting network shows increased gamma-band activity at approximately 200 ms after a spatial cue over superior and inferior frontal gyri. A more recent study Capotosto et al. (2009) showed that spatial attention is controlled by desynchronization of alpha rhythms in frontal and parietal regions prior to the onset of visual stimulation. This effect is similar to the suppression of power we observe in lower frequencies during visual stimulation (Figure 4; columns one and two), and is most pronounced in PP and premotor cortices.
Neural modulations during the course of a goal-directed attentional task may not be attributed to attention alone, in particular when the task requires a motor response. Increases in neural activity can indicate a role for motor preparation in the premotor cortex (Riehle and Requin, 1989; Boussaoud and Wise, 1993a; Wise et al., 1997) and directional intention in the PP cortex (Assad and Maunsell, 1995; Mazzoni et al., 1996; Quiroga et al., 2006). Still, non-motor attentional involvement of the premotor cortex has been suggested by results from primate neurophysiology and human neuroimaging (Boussaoud and Wise, 1993b; Boussaoud, 2001; Lebedev and Wise, 2001; Simon et al., 2002). The premotor theory of attention (Rizzolatti et al., 1982) also suggests that spatial attention derives from a weaker activation of the same frontal–parietal circuits that determine motor behavior toward specific spatial locations. In addition, the alpha and beta activations over premotor cortical regions are consistent with reports that human beta-band local field potential (LFP) modulations can reflect goal-directed attentional processing prior to motor planning and execution (Saleh et al., 2010). Moreover, using high gamma ECoG activity in a single patient, Brovelli et al. (2005) showed attentional involvement in the premotor cortex that could be dissociated from motor planning. Thus, the premotor and parietal activations during the cue and stimulus presentation epochs can be associated to attentional processing and differentiated from a preparation network. Still, our results point to clear differences between attentional processing and movement execution. Around the button press, activations across all three frequency bands overlapped significantly in the classic sensory–motor cortex comprising the precentral and postcentral gyri (Donoghue et al., 1998; Baker et al., 1999), consistent with recent findings (Miller et al., 2010). These results mirror an overall increase of activation with motor initiation compared to stimulus processing.
We demonstrate that cue and stimulus responses are segregated across different frequency bands into largely non-overlapping areas (typical percentages of overlap ∼30%). During these epochs, the gamma band reveals more focal and distributed activations, while alpha and beta bands are more broadly activated, overlaying premotor cortices (Figure 5). These results indicate that different frequency bands in ECoG represent different physiological phenomena with differential, although not yet fully defined, functional significance. Studies comparing gamma LFP activity with hemodynamic responses have repeatedly found that fMRI BOLD activations correlate with high gamma activations as opposed to slower rhythms Logothetis et al. (2001), Brovelli et al. (2005), Mukamel et al. (2005), Niessing et al. (2005), and Lachaux et al. (2007). The gamma activations we observe over lateral frontal, premotor, and PP cortices following the presentation of the cue and stimulus (Figure 5) in fact highly co-localize with fMRI findings that implicate a dorsal attention network during orienting cues (Gitelman et al., 1999; Corbetta and Shulman, 2002). Gamma activations over the sensorimotor cortex during the button press are also more localized compared to the lower frequency bands, which is consistent with previous motor mapping studies in ECoG Crone et al. (1998), Miller et al. (2007) and fMRI Hermes et al. (2011). Taken together, our findings suggest that it is possible to decompose ECoG signals into different constituent physiological processes.
While our study adds to the understanding of the neural mechanisms of visual attention, there are some noteworthy limitations that mainly relate to difficulties and complexities of ECoG recordings in patient populations. First, the coverage of the grids is based on clinical needs and thus is variable and/or incomplete across subjects. In fact, the highly localized activity in the parietal region during attentional states in Figure 5 is mainly due to signals from Subject A, as the other subjects had no or minimal coverage of this area. Also, the difference between activations across behavioral states of the individual subjects (Figure 6) may in part be attributable to non-uniform electrode coverage. Moreover, the lateralized electrode coverage does not allow for differential analysis across the two hemispheres within subjects. This is unfortunate, as spatial attention has been considered to be right hemisphere dominant based on lesional studies (Gainotti et al., 1974; Sperry, 1974; Mesulam, 1981). On the other hand, recent neuroimaging studies suggest a larger population with bilateral attentional fronto-parietal networks than previously thought (de Schotten et al., 2011), and report symmetrical activations over the dorsal fronto-parietal network during attentional control (i.e., suggest that asymmetrical activations that are distinct from this network; Shulman et al., 2010). Furthermore, current methods to study ECoG limit analyses and interpretation to activations on the surface of the cortex, and thereby ignore the likely involvement of subcortical structures in attentional control, such as the superior colliculus and lateral pulvinar (Desimone et al., 1990; Robinson and Kertzman, 1995; Kustov and Robinson, 1996). Recordings with electrode grids with higher density may eventually allow for functional interpretation of subcortical structures using source localization techniques, similar to the techniques currently applied to scalp-recorded EEG. Finally, conduction of relatively complex experimental paradigms (such as the one used here) in the hospital faces many practical difficulties. These difficulties limit the amount of data that can be acquired and increase its variability. Nevertheless, ECoG provides an exciting opportunity for recording brain activity in humans that allows for detailed spatiotemporal characterization of electrophysiological phenomena.
Overall, in this paper we focused on identifying the neural correlates of visual attention in ECoG signals. Such attentional correlates may eventually prove useful for brain-based augmentation systems that allow people to respond to and control their surroundings more rapidly and accurately (van Gerven and Jensen, 2009; Bahramisharif et al., 2010; Treder et al., 2011). For instance, detection of the locus of visual attention may assist in alerting during vehicle operation, or targeting during a tactical scenario. As a clinical application, it could allow people with motor impairments to select items or characters on a screen simply by paying attention to them. This would be of most immediate benefit to people who are completely paralyzed and cannot fixate gaze. Ongoing work is therefore aimed at determining the general level of attention, as well as decoding the spatial locus of attention from ECoG signals, in single trials.
Conflict of Interest Statement
The authors declare that the research was conducted in the absence of any commercial or financial relationships that could be construed as a potential conflict of interest.
Acknowledgments
This work was supported in part by grants from the US Army Research Office [W911NF-08-1-0216 (GS) and W911NF-07-1-0415 (GS)] and the NIH [EB006356 (GS) and EB000856 (GS)]. The authors would like to thank the staff of AMC Epilepsy Monitoring Unit for their assistance, as well as Griffin Milsap and Boris Revechkis for technical support.
Footnotes
References
Aine, C. J. (1995). A conceptual overview and critique of functional neuroimaging techniques in humans: I. MRI/fMRI and PET. Crit. Rev. Neurobiol. 9, 229–309.
Assad, J. A., and Maunsell, J. H. (1995). Neuronal correlates of inferred motion in primate posterior parietal cortex. Nature 373, 518–521.
Awh, E., Armstrong, K. M., and Moore, T. (2006). Visual and oculomotor selection: links, causes and implications for spatial attention. Trends Cogn. Sci. (Regul. Ed.) 10, 124–130.
Bahramisharif, A., van Gerven, M., Heskes, T., and Jensen, O. (2010). Covert attention allows for continuous control of brain-computer interfaces. Eur. J. Neurosci. 31, 1501–1508.
Baker, S. N., Kilner, J. M., Pinches, E. M., and Lemon, R. N. (1999). The role of synchrony and oscillations in the motor output. Exp. Brain Res. 128, 109–117.
Bisley, J. W., and Goldberg, M. E. (2003). Neuronal activity in the lateral intraparietal area and spatial attention. Science 299, 81–86.
Boussaoud, D. (2001). Attention versus intention in the primate premotor cortex. Neuroimage 87, 76–87.
Boussaoud, D., and Wise, S. P. (1993a). Primate frontal cortex: effects of stimulus and movement. Exp. Brain Res. 95, 28–40.
Boussaoud, D., and Wise, S. P. (1993b). Primate frontal cortex: neuronal activity following attentional versus intentional cues. Exp. Brain Res. 95, 15–27.
Brovelli, A., Lachaux, J.-P., Kahane, P., and Boussaoud, D. (2005). High gamma frequency oscillatory activity dissociates attention from intention in the human premotor cortex. Neuroimage 28, 154–164.
Buschman, T., and Miller, E. (2007). Top-down versus bottom-up control of attention in the prefrontal and posterior parietal cortices. Science 315, 1860–1862.
Capotosto, P., Babiloni, C., Romani, G. L., and Corbetta, M. (2009). Frontoparietal cortex controls spatial attention through modulation of anticipatory alpha rhythms. J. Neurosci. 29, 5863–5872.
Colby, C. L., Duhamel, J. R., and Goldberg, M. E. (1996). Visual, presaccadic, and cognitive activation of single neurons in monkey lateral intraparietal area. J. Neurophysiol. 76, 2841–2852.
Corbetta, M., Akbudak, E., Conturo, T. E., Snyder, A. Z., Ollinger, J. M., Drury, H. A., Linenweber, M. R., Petersen, S. E., Raichle, M. E., Essen, D. C. V., and Shulman, G. L. (1998). A common network of functional areas for attention and eye movements. Neuron 21, 761–773.
Corbetta, M., and Shulman, G. L. (2002). Control of goal-directed and stimulus-driven attention in the brain. Nat. Rev. Neurosci. 3, 201–215.
Crone, N. E., Miglioretti, D. L., Gordon, B., and Lesser, R. P. (1998). Functional mapping of human sensorimotor cortex with electrocorticographic spectral analysis. II. Event-related synchronization in the gamma band. Brain 121, 2301–2315.
de Schotten, M. T., Dell’Acqua, F., Forkel, S., Simmons, A., Vergani, F., Murphy, D. G. M., and Catani, M. (2011). A lateralized brain network for visuo-spatial attention. Nat. Neurosci. [Epub ahead of print].
Desimone, R., and Duncan, J. (1995). Neural mechanisms of selective visual attention. Annu. Rev. Neurosci. 18, 193–222.
Desimone, R., Wessinger, M., Thomas, L., and Schneider, W. (1990). Attentional control of visual perception: cortical and subcortical mechanisms. Cold Spring Harb. Symp. Quant. Biol. 55, 963–971.
Dias, R., Robbins, T. W., and Roberts, A. C. (1996). Dissociation in prefrontal cortex of affective and attentional shift. Nature 380, 69–72.
Donoghue, J. P., Sanes, J. N., Hatsopoulos, N. G., and Gaal, G. (1998). Neural discharge and local field potential oscillations in primate motor cortex during voluntary movements. J. Neurophysiol. 79, 159–173.
Doricchi, F., Macci, E., Silvetti, M., and Macaluso, E. (2010). Neural correlates of the spatial and expectancy components of endogenous and stimulus-driven orienting of attention in the posner task. Cereb. Cortex 20, 1574–1585.
Fan, J., Byrne, J., Worden, M. S., Guise, K. G., McCandliss, B. D., Fossela, J., and Posner, M. I. (2007). The relation of brain oscillations to attentional networks. J. Neurosci. 27, 6197–6206.
Gainotti, G., Messerli, P., and Tissot, R. (1974). Qualitative analysis of unilateral spatial neglect in relation to laterality of cerebral lesions. J. Neurol. Neurosurg. Psychiatr. 35, 545–550.
Ganguli, S., Bisley, J. W., Roitman, J. D., Shadlen, M. N., Goldberg, M. E., and Miller, K. D. (2008). One-dimensional dynamics of attention and decision making in LIP. Neuron 58, 15–25.
Ghose, G. M., and Maunsell, J. H. R. (2008). Spatial summation can explain the attentional modulation of neuronal responses to multiple stimuli in area V4. J. Neurosci. 28, 5115–5126.
Gitelman, D. R., Nobre, A. C., Parrish, T. B., LaBar, K. S., Kim, Y. H., Meyer, J. R., and Mesulam, M. (1999). A large-scale distributed network for covert spatial attention: further anatomical delineation based on stringent behavioural and cognitive controls. Brain 122(Pt 6), 1093–1106.
Goldberg, M. E., Bisley, J., Powell, K. D., Gottlieb, J., and Kusunoki, M. (2002). The role of the lateral intraparietal area of the monkey in generation of saccades and visuospatial attention. Ann. N. Y. Acad. Sci. 956, 205–215.
Gottlieb, J. P., Kusunoki, M., and Goldberg, M. E. (1998). The representation of visual salience in monkey parietal cortex. Nature 391, 481–484.
Gregoriou, G. G., Gotts, S. J., Zhou, H., and Desimone, R. (2009). High-frequency, long-range coupling between prefrontal and visual cortex during attention. Science 324, 1207–1210.
Hammett, S. T., and Snowden, R. J. (1995). The effect of contrast adaptation on briefly presented stimuli. Vision Res. 35, 1721–1725.
Hermes, D., Miller, K. J., Vansteensel, M. J., Aarnoutse, E. J., Leijten, F. S. S., and Ramsey, N. F. (2011). Neurophysiologic correlates of fMRI in human motor cortex. Hum. Brain Mapp. [Epub ahead of print].
Hopfinger, J. B., Buonocore, M. H., and Mangun, G. R. (2000). The neural mechanisms of top-down attentional control. Nat. Neurosci. 3, 284–291.
Kastner, S., Pinsk, M. A., Weerd, P. D., Desimone, R., and Ungerleider, L. G. (1999). Increased activity in human visual cortex during directed attention in the absence of visual stimulation. Neuron 22, 751–761.
Kustov, A., and Robinson, D. (1996). Shared nerual control of attentional shifts and eye movements. Nature 384, 74–77.
LaBerge, D. (1995). Attentional Processing: The Brain’s Art of Mindfulness Cambridge, MA: Harvard University Press.
Lachaux, J. P., Fonlupt, P., Kahane, P., Minotti, L., Hoffmann, D., Bertrand, O., and Baciu, M. (2007). Relationship between task-related gamma oscillations and BOLD signal: new insights from combined fmri and intracranial EEG. Hum. Brain Mapp. 28, 1368–1375.
Lancaster, J. L., Woldorff, M. G., Parsons, L. M., Liotti, M., Freitas, C. S., Rainey, L., Kochunov, P. V., Nickerson, D., Mikiten, S. A., and Fox, P. T. (2000). Automated Talairach atlas labels for functional brain mapping. Hum. Brain Mapp. 10, 120–131.
Lebedev, M. A., and Wise, S. P. (2001). Tuning for the orientation of spatial attention in dorsal premotor cortex. Eur. J. Neurosci. 13, 1002–1008.
Lee, J., and Maunsell, J. H. R. (2010). Attentional modulation of MT neurons with single or multiple stimuli in their receptive fields. J. Neurosci. 30, 3058–3066.
Lloyd, D. (2007). “What do Brodmann areas do?,” Or: Scanning the Neurocracy Hartford, CT: Program in Neuroscience.
Logothetis, N. K., Pauls, J., Augath, M., Trinath, T., and Oeltermann, A. (2001). Neurophysiological investigation of the basis of the fMRI signal. Nature 412, 150–157.
Luck, S. J., Chelazzi, L., Hillyard, S. A., and Desimone, R. (1997). Neural mechanisms of spatial selective attention in areas V1, V2, and V4 of macaque visual cortex. J. Neurophysiol. 77, 24–42.
Mantini, D., Marzetti, L., Corbetta, M., Romani, G. L., and Gratta, C. D. (2010). Multimodal integration of fMRI and EEG data for high spatial and temporal resolution analysis of brain networks. Brain Topogr. 23, 150–158.
Mazzoni, P., Bracewell, R. M., Barash, S., and Andersen, R. A. (1996). Motor intention activity in the macaque’s lateral intraparietal area. I. Dissociation of motor plan from sensory memory. J. Neurophysiol. 76, 1439–1456.
Mesulam, M. (1981). A cortical network for directed attention and unilateral neglect. Ann. Neurol. 10, 309–325.
Miller, K. J., Leuthardt, E. C., Schalk, G., Rao, R. P., Anderson, N. R., Moran, D. W., Miller, J. W., and Ojemann, J. G. (2007). Spectral changes in cortical surface potentials during motor movement. J. Neurosci. 27, 2424–2432.
Miller, K. J., Schalk, G., Fetz, E. E., den Nijs, M., Ojemann, J. G., and Rao, R. P. N. (2010). Cortical activity during motor execution, motor imagery, and imagery-based online feedback. Proc. Natl. Acad. Sci. U.S.A. 107, 4430–4435.
Monosov, I. E., Trageser, J. C., and Thompson, K. G. (2008). Measurements of simultaneously recorded spiking activity and local field potentials suggest that spatial selection emerges in the frontal eye field. Neuron 57, 614–625.
Moran, J., and Desimone, R. (1985). Selective attention gates visual processing in the extrastriate cortex. Science 229, 782–784.
Motter, B. C. (1993). Focal attention produces spatially selective processing in visual cortical areas V1, V2, and V4 in the presence of competing stimuli. J. Neurophysiol. 70, 909–919.
Mukamel, R., Gelbard, H., Arieli, A., Hasson, U., Fried, I., and Malach, R. (2005). Coupling between neuronal firing, field potentials, and fMRI in human auditory cortex. Science 309, 951–954.
Niessing, J., Ebisch, B., Schmidt, K. E., Niessing, M., Singer, W., and Galuske, R. A. W. (2005). Hemodynamic signals correlate tightly with synchronized gamma oscillations. Science 309, 948–951.
Nunez, P. L., and Srinivasan, R. (2005). Electric Fields of the Brain: The Neurophysics of EEG New York, NY: Oxford University Press.
Posner, M., and Petersen, S. (1990). The attention system of the human brain. Annu. Rev. Neurosci. 13, 25–42.
Posner, M., Snyder, C., and Davidson, B. (1980). Attention and the detection of signals. J. Exp. Psychol. 109, 160–174.
Quiroga, R. Q., Snyder, L. H., Batista, A. P., Cui, H., and Andersen, R. A. (2006). Movement intention is better predicted than attention in the posterior parietal cortex. J. Neurosci. 26, 3615–3620.
Rao, S. C., Rainer, G., and Miller, E. K. (1997). Integration of what and where in the primate prefrontal cortex. Science 276, 821–824.
Ray, W. J., and Cole, H. W. (1985). EEG activity during cognitive processing: influence of attentional factors. Int. J. Psychophysiol. 3, 43–48.
Reitan, R. M. (1958). Validity of the Trail Making Test as an indication of organic brain damage. Percept. Mot. Skills 8, 271–276.
Riehle, A., and Requin, J. (1989). Monkey primary motor and premotor cortex: single-cell activity related to prior information about direction and extent of an intended movement. J. Neurophysiol. 61, 534–549.
Rizzolatti, G., Bertoloni, G., and DeBastiani, P. L. (1982). Interference of concomitant tasks on simple reaction time: attentional and motor factors. Neuropsychologia 20, 447–455.
Rizzolatti, G., Matelli, M., and Pavesi, G. (1983). Deficits in attention and movement following the removal of postarcuate (area 6) and prearcuate (area 8) cortex in macaque monkeys. Brain 106(Pt 3), 655–673.
Robinson, D., and Kertzman, C. (1995). Covert orienting of attention in macaques: III. Contributions of the superior colliculus. J. Neurophysiol. 74, 713–721.
Saleh, M., Reimer, J., Penn, R., Ojakangas, C. L., and Hatsopoulos, N. G. (2010). Fast and slow oscillations in human primary motor cortex predict oncoming behaviorally relevant cues. Neuron 65, 461–471.
Schalk, G., Kubanek, J., Miller, K. J., Anderson, N. R., Leuthardt, E. C., Ojemann, J. G., Limbrick, D., Moran, D., Gerhardt, L. A., and Wolpaw, J. R. (2007). Decoding two-dimensional movement trajectories using electrocorticographic signals in humans. J. Neural Eng. 4, 264.
Schalk, G., McFarland, D. J., Hinterberger, T., Birbaumer, N., and Wolpaw, J. R. (2004). BCI2000: a general-purpose brain-computer interface (BCI) system. IEEE Trans. Biomed. Eng. 51, 1034–1043.
Schalk, G., and Mellinger, J. (2010). A Practical Guide to Brain-Computer Interfacing with BCI2000 London: Springer.
Sestieri, C., Shulman, G. L., and Corbetta, M. (2010). Attention to memory and the environment: functional specialization and dynamic competition in human posterior parietal cortex. J. Neurosci. 30, 8445–8456.
Sheliga, B. M., Riggio, L., and Rizzolatti, G. (1994). Orienting of attention and eye movements. Exp. Brain Res. 98, 507–522.
Shibasaki, H. (2008). Human brain mapping: hemodynamic response and electrophysiology. Clin. Neurophysiol. 119, 731–743.
Shulman, G. L., Astafiev, S. V., Franke, D., Pope, D. L. W., Snyder, A. Z., McAvoy, M. P., and Corbetta, M. (2009). Interaction of stimulus-driven reorienting and expectation in ventral and dorsal frontoparietal and basal ganglia-cortical networks. J. Neurosci. 29, 4392–4407.
Shulman, G. L., Pope, D. L. W., Astafiev, S. V., McAvoy, M. P., Snyder, A. Z., and Corbetta, M. (2010). Right hemisphere dominance during spatial selective attention and target detection occurs outside the dorsal frontoparietal network. J. Neurosci. 30, 3640–3651.
Simon, S., Meunier, M., Piettre, L., Berardi, A., Segebarth, C., and Boussaoud, D. (2002). Spatial attention and memory versus motor preparation: premotor cortex involvement as revealed by fMRI. J. Neurophysiol. 88, 2047–2057.
Sperry, R. (1974). Lateral Specialization in the Surgically Separated Hemispheres New York, NY: Rockefeller University Press.
Stoica, P., and Moses, R. (2005). Spectral Analysis of Signals Upper Saddle River, NJ: Prentice-Hall.
Strotzer, M. (2009). One century of brain mapping using Brodmann areas. Clin. Neuroradiol. 19, 179–186.
Szczepanski, S. M., Konen, C. S., and Kastner, S. (2010). Mechanisms of spatial attention control in frontal and parietal cortex. J. Neurosci. 30, 148–160.
Talairach, J., and Tournoux, P. (1988). Co-Planar Sterotaxic Atlas of the Human Brain New York: Thieme Medical Publishers, Inc.
Taylor, M. M., and Creelman, C. D. (1967). PEST: efficient estimates on probability functions. J. Acoust. Soc. Am. 41, 782–787.
Treder, M. S., Bahramisharif, A., Schmidt, N. M., van Gerven, M. A., and Blankertz, B. (2011). Brain-computer interfacing using modulations of alpha activity induced by covert shifts of attention. J. Neuroeng. Rehabil. 8, 24.
van Gerven, M., and Jensen, O. (2009). Attention modulations of posterior alpha as a control signal for two-dimensional brain-computer interfaces. J. Neurosci. Methods 179, 78–84.
Wechsler, D. (1997). Wechsler Adult Intelligence Scale-Revised San Antonio, TX: The Psychological Corporation.
Wise, S. P., Boussaoud, D., Johnson, P. B., and Caminiti, R. (1997). Premotor and parietal cortex: corticocortical connectivity and combinatorial computations. Annu. Rev. Neurosci. 20, 25–42.
Worden, M. S., Foxe, J. J., Wang, N., and Simpson, G. V. (2000). Anticipatory biasing of visuospatial attention indexed by retinotopically specific alpha-band electroencephalography increases over occipital cortex. J. Neurosci. 20, RC63.
Keywords: visual–spatial attention, covert attention, electrocorticography, intention, motor response
Citation: Gunduz A, Brunner P, Daitch A, Leuthardt EC, Ritaccio AL, Pesaran B and Schalk G (2011) Neural correlates of visual–spatial attention in electrocorticographic signals in humans. Front. Hum. Neurosci. 5:89. doi: 10.3389/fnhum.2011.00089
Received: 06 April 2011; Accepted: 10 August 2011;
Published online: 24 September 2011.
Edited by:
Shuhei Yamaguchi, Shimane University, JapanReviewed by:
Shozo Tobimatsu, Kyushu University, Japan; Bradley Voytek, University of California Berkeley, USACopyright: © 2011 Gunduz, Brunner, Daitch, Leuthardt, Ritaccio, Pesaran and Schalk. This is an open-access article subject to a non-exclusive license between the authors and Frontiers Media SA, which permits use, distribution and reproduction in other forums, provided the original authors and source are credited and other Frontiers conditions are complied with.
*Correspondence: Gerwin Schalk, Wadsworth Centre, New York State Department of Health, Empire State Plaza C652, Albany, NY 12201, USA. e-mail: schalk@wadsworth.org