 Yi-Dan Liu1†Meng-Yu Ma1†Xi-Bin Hu2Huan Yan3Yan-Ke Zhang3Hao-Xiang Yang4Jing-Hui Feng4Lin Wang3Hao Zhang5Bin Zhang5Qiu-Bo Li6*Jun-Chen Zhang5*
 Qing-Xia Kong3,7*
- 1Cheeloo College of Medicine, Shandong University, Jinan, China
- 2Department of Imaging, Affiliated Hospital of Jining Medical University, Jining, China
- 3Department of Neurology, Affiliated Hospital of Jining Medical University, Jining, China
- 4Clinical Medical College, Jining Medical University, Jining, China
- 5Department of Neurosurgery, Affiliated Hospital of Jining Medical University, Jining, China
- 6Department of Pediatrics, Affiliated Hospital of Jining Medical University, Jining, China
- 7Institute of Epilepsy, Jining Medical University, Jining, China
Tuberous sclerosis complex (TSC) is a genetic disease characterized by seizures, mental deficiency, and abnormalities of the skin, brain, kidney, heart, and lungs. TSC is inherited in an autosomal dominant manner and is caused by variations in either the TSC1 or TSC2 gene. TSC-related epilepsy (TRE) is the most prevalent and challenging clinical feature of TSC, and more than half of the patients have refractory epilepsy. In clinical practice, we found several patients of intractable epilepsy caused by TSC1 truncating mutations. To study the changes of protein expression in the brain, three cases of diseased brain tissue with TSC1 truncating mutation resected in intractable epilepsy operations and three cases of control brain tissue resected in craniocerebral trauma operations were collected to perform protein spectrum detection, and then the data-independent acquisition (DIA) workflow was used to analyze differentially expressed proteins. As a result, there were 55 up- and 55 down-regulated proteins found in the damaged brain tissue with TSC1 mutation compared to the control. Further bioinformatics analysis revealed that the differentially expressed proteins were mainly concentrated in the synaptic membrane between the patients with TSC and the control. Additionally, TSC1 truncating mutations may affect the pathway of amino acid metabolism. Our study provides a new idea to explore the brain damage mechanism caused by TSC1 mutations.
Introduction
Epilepsy is one of the most common neurological diseases in the clinic. It is a clinical syndrome caused by abnormal discharge of highly synchronized neurons in the brain caused by a variety of reasons, accompanying psychiatric and neurological comorbidities (1). The etiological mechanism of epilepsy is very complex, and genetic, metabolic, and structural factors are important causes of epilepsy (2). Tuberous sclerosis complex (TSC) is a typical neurocutaneous syndrome characterized by cerebral and dermatological lesions, with hamartoma formation in multiple organ systems (3). TSC is typically characterized by severe neurodevelopmental disorders, which generally include mental disabilities, autism, and other behavioral and psychiatric symptoms. Therefore, these neurodevelopmental impairments were named TSC-associated neuropsychiatric disorders (TAND) (4). TSC-related epilepsy (TRE) is the most prevalent and challenging clinical manifestation of TSC (5). More than 70–80% of individuals with TSC have a history of seizures, which are often refractory to treatment, even with multiple antiepileptic drugs (6).
TSC is an autosomal dominant inherited disease. Most TSC patients are caused by mutations in the TSC1 or TSC2 genes that encode two proteins, hamartin (TSC1) and tuberin (TSC2). Under normal circumstances, these two proteins bind together to form a protein dimer complex that can inhibit the mammalian target rapamycin (mTOR) protein complex. The mTOR pathway is a crucial cellular signaling hub that integrates cell growth, proliferation, metabolism, and protein synthesis (7). TSC1 or TSC2 mutations cause excessive activation of mTOR pathway, leading to the promotion of cell growth and proliferation that caused a wide variety of tumor cell growth in TSC, including renal angiomyolipoma (RAML), pulmonary lymphangioleiomyomatosis (PLAM), subependymal giant cell astrocytoma (SEGA) and facial angiofibroma (8). The mTOR inhibitors, such as everolimus and rapamycin, are effective to treat tumors of TSC, however, their effect on the neurological symptoms is limited. Although everolimus therapy is likely to be effective for focal-onset seizures in TSC, most patients still have seizures, and many benefit little from the treatment (9).
Typical pathological of brain damage in TSC is cortical tubers, which are focal malformations of the cerebral cortex, marked by localized cortical destruction and varied abnormal cells, including deformed neurons, astrocyte proliferation, and giant cells (10). A few studies showed that autism may be associated with tubers in the temporal lobes (11), but the correlation between TAND and tubers is controversial (12). A growing body of evidences suggested that autism and cognitive deficit are more closely related to factors independent of tubers, like underconnectivity across multiple white matter fiber bundles (13). It is a remarkable fact that the brain damage caused by cortical tubers has generally been thought to contribute to epileptic seizures in TSC, for surgical removal of epileptogenic tubers can eliminate seizures to a great extent in some TSC patients (14). Additionally, when the treatment of the first two antiepileptic drugs (AEDs) are failed, adding new anti-epileptic drugs is generally not effective. Therefore, surgery is a good choice for patients who can undergo focal resection, and it may improve the outcome in future cohorts (15).
There are still many puzzles in the linkage from genetic mutations to cortical tubers, to infantile seizures, and late childhood mental retardation in TSC. Some studies have shown that the existence of TSC2 inactivation variants may affect the severity of TSC-related brain damage, and children with TSC2 protein truncation mutations are more likely to develop progressive cognitive deterioration and severe intellectual disability (16). The truncating mutation is the commonest mutation type in the TSC1 (80%) and the TSC2 (65%) genes. However, the clinical studies about brain damage related to TSC1 truncating mutations are rarer, due to TSC1 mutations account for the minority of all TSC patients as compared to TSC2 mutations, with the ratio of 1:5 (TSC1/TSC2) (17). In clinical practice, we found several patients of intractable epilepsy caused by TSC1 truncating mutations. To study the changes of protein expression in the damaged brain tissue with TSC1 truncating mutation, the protein spectrum detection was performed.
In this study, we reported clinical features, mutation analyses and brain proteomic profiling of three surgical cases of intractable epilepsy caused by truncating mutations in TSC1.
Materials and Methods
We analyzed the clinical data and genetic testing of patients with TSC treated in the Multidisciplinary Center for Epilepsy of Affiliated Hospital of Jining Medical University from August 2018 to August 2019 and found three surgical cases of intractable epilepsy with truncating mutations in TSC1. To explore the difference in the expression of proteins between brain tissues with TSC1 truncating mutations and control brain tissues, proteomic profiling was performed.
Clinical Data Collection
Basic information and medical history including age, gender, age of onset, seizure form and medication history were collected. Inclusion criteria: meeting the latest revised diagnostic criteria for TSC in 2012 (18). Exclusion criteria: brain lesions and seizures caused by other diseases; TSC complicated with other brain injuries, such as cerebrovascular disease, brain trauma, and encephalitis.
Video-electroencephalogram (VEEG): Scalp electrodes were placed, and VEEG monitoring was conducted. Then EEG signals were recorded by the Nicolet One VEEG analysis system (Nicolet, inc., USA). Magnetic resonance imaging (MRI): The 3.0 T magnetic resonance system (Siemens, Germany) was used to scan the transverse, coronal and sagittal images at 1 mm per layer. MRI morphological analysis program (MAP) and PET-MR image fusion was used to assist in locating epileptogenic lesions. Surgery and pathology: Electrophysiological monitoring was performed in surgery. Epileptogenic tubers and related cortex were completely removed under the premise of no disruption in brain function. After surgery, HE staining was performed to observe the morphological structure of brain tissues in a light microscope. IQ test: The intelligence of patients aged 6 to 16 was measured by the Wechsler Intelligence Scale for Children (5th ed.).
Gene Detection and Bioinformatic Analysis
Peripheral blood samples were collected from patients and their families for gene detection. Next-generation sequencing (NGS) and multiplex ligation-dependent probe amplification (MLPA) were used to detect the variations in the TSC1 and TSC2 genes. The candidate mutation sites were then verified by Sanger sequencing.
Next-Generation Sequencing (NGS)
The genomic DNA was extracted from the blood samples by the FlexiGene DNA kit (Qiagen, Duesseldorf, Germany). The PrimeStar HS DNA Polymerase (New England BioLabs, Inc.) was used to amplify the DNA library. The SureSelect Target Enrichment System (Agilent Technologies, Inc.) was used to capture the target DNA fragments. Single-read sequencing was performed using NextSeq500 (Illumina, San Diego, USA). Sequences were aligned to UCSC hg19 by Burrow-Wheeler Aligner Version 0.7.15. Then single-nucleotide and deletion/insertion polymorphisms analyses were implemented to get mutation information in the targeted regions by GATK Version 3.6. According to the American College of Medical Genetics and Genomics (ACMG) criteria and guidelines, mutations were classified into five levels: “pathogenic,” “likely pathogenic,” “benign,” “likely benign,” and “uncertain significance” (19).
Multiplex Ligation-Dependent Probe Amplification (MLPA)
Microdeletions or microduplications in the TSC1 and TSC2 genes were detected by MLPA, using the SALSA® MLPA® Probemix P124-C3 TSC1 and P337-B1 TSC2 (MRC, Holland) as per the manufacturer's protocol. Capillary electrophoresis was implemented using ABI3130 DNA Sequencer (Applied Biosystems, USA). The software Coffalyser was subsequently applied to analyze the data.
Sanger Sequencing
The candidate mutated regions were selected for further validation to exclude false-positive sites. The primers were designed by PrimerZ1. The candidate variants were amplified by PCR using an EasyTaq PCR SuperMix (TransGen Biotech, China) (20). PCR products were then sequenced by Sanger sequencing.
Bioinformatic Analysis
To investigate the effects of the detected mutations on protein structure, we used the online tool PSIPRED V4.02 to predict the secondary structures of the mutated and wild-type TSC1 proteins (21).
Proteomic Profiling in Human Brain Tissue
To study the proteomic changes in the brain, the above three cases of diseased brain tissue with TSC1 truncating mutations resected in intractable epilepsy operations and the other three cases of control brain tissue resected in craniocerebral trauma operations were collected (the information of the control group shown in the Supplementary Table 1). Before the protein spectrum detection, genomic DNA was extracted from the six brain tissues and whole exome sequencing (WES) was performed. In the three patients with TSC, the results of WES in the brain were consistent with those of gene detection in peripheral blood. And there was no pathogenic mutation detected in the three control brain tissues. Then, the six brain samples were divided into the TSC1 truncating group and the control group for protein spectrum detection.
Experimental Design and Statistical Rationale
Two group samples were selected, and the group is represented by 3 biological replicates. For library generation by DDA, all 6 samples were pooled as a mixture and fractionated by high pH separation with 10 fractions. And all 6 samples were processed by data-independent acquisition (DIA) individually to assess the proteome differences. MS1 and MS2 data were all acquired, and samples acquisition by random order. The statistical analysis of the DIA dataset was performed by Spectronaut 13 (Biognosys AG, Switzerland) including data normalization and relative protein quantification. After Welch's ANOVA Test, differently expressed proteins were filtered with a P < 0.05 and fold change of more than 1.5.
Sample Pretreatment for Mass Spectrometric Analysis
The brain samples were treated by lysis buffer, which contains 1% SDS, 8 M urea, and Protease Inhibitor Cocktail (Roche Ltd. Basel, Switzerland), and then were put on ice for 30 min. The samples were centrifuged at 15,000 rpm for another 15 min at 4°C, and the supernatant was collected. After quantifying total protein concentration, a total protein of 100 μg per sample was transferred to a new tube with the final volume adjusted to 100 μL by the addition of 8M urea. The tris (2-carboxyethyl) phosphine (TCEP) was added to reduce the extracted proteins and then incubated at 37°C for 1 h. Alkylation of the samples was carried out as the manufacturer's protocol. After that, the proteins were digested by trypsin (Promega, Madison, WI) at 37°C overnight. The C18 ZipTip was used to desalt the digested peptides. Then, the Pierce™ Quantitative Colorimetric Peptide Assay (23275) and the SpeedVac were used in quantification and lyophilization, respectively (22).
Data-Independent Acquisition (DIA)
The peptide mixture was re-dissolved in the buffer A, which containing 20 mM ammonium formate in water adjusted to pH 10.0 with ammonium hydroxide, and then fractionated by high pH fractions using an Ultimate 3000 system (ThermoFisher Scientific, MA, USA) connected to a reverse-phase column (XBridge C18 column, Waters Corporation, MA, USA). Ten fractions were collected and each fraction was dried in a vacuum concentrator. The samples were re-dissolved in the solvent A containing 0.1% formic acid and then LC-MS/MS was acquired on an Orbitrap Lumos coupled to EASY-nLC 1200 system (Thermo Fisher Scientific, MA, USA). 3 μL of each peptide samples were loaded onto an analytical column (Acclaim PepMap C18, Thermo Fisher Scientific, MA, USA) and separated with a 130-min gradient from 4 to 50% B (0.1% formic acid in ACN). The mass spectrometer was worked under data-dependent acquisition (DDA) mode, and could automatically switch between MS and MS/MS mode. The parameters were set as (1) MS: scan range (m/z) of 350–1500; resolution of 60,000; automatic gain control (AGC) target value of 4e5; maximum injection time of 50 ms; dynamic exclusion of 30 s; (2) HCD-MS/MS: the resolution of 30,000; AGC target value of 5e4; maximum injection time of 86 ms; collision energy of 30.
Data Analysis
We use the Spectronaut 13 (Biognosys AG, Switzerland) to process and analyze the raw data of DIA with default settings to obtain the initial target list, which contained 136,450 precursors, 109,674 peptides, 8,399 proteins, and 8,316 protein groups. Spectronaut was installed to search the database of homo_sapiens_sp_201907.fasta assuming trypsin as the digestion enzyme. Carbamidomethyl (C) and Oxidation (M) were employed as the fixed modification and the variable modification, respectively. The false discovery rate (FDR) reflected by Q value on precursor and protein level was applied at 1%. The major group quantities were calculated by the average top 3 filtered peptides which passed the 1% Q value cutoff. After Welch's ANOVA Test, differently expressed proteins were filtered with a P < 0.05 and fold change of more than 1.5.
Bioinformatics Analysis
The volcano plot, a type of scatter-plot that is used to quickly identify changes in large data sets composed of replicate data, is drawn using the ggplot2 package3 Blast2GO version 5 and GOATOOLS were used for functional annotation and GO enrichment analysis, respectively.
Results
Clinical Data
All three cases were male and had their first seizure at the age of 3, 5, and 20, respectively, presenting as complex partial seizures (Table 1). Taking two or more AEDs, seizures were not well-controlled. All three had typical skin manifestations and subependymal nodules (Figure 1). Besides, case 2 had cardiac rhabdomyoma and multiple renal cysts.
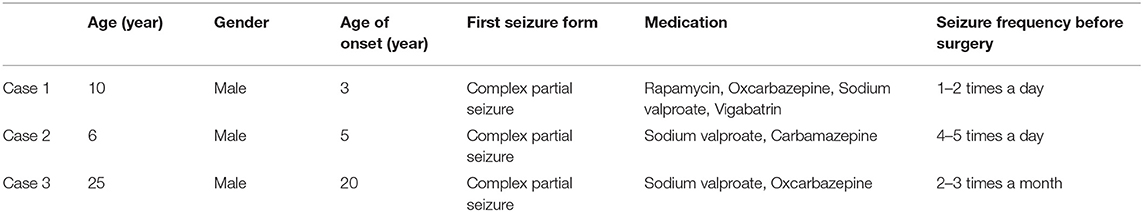
Table 1. Epilepsy history of the three patients.
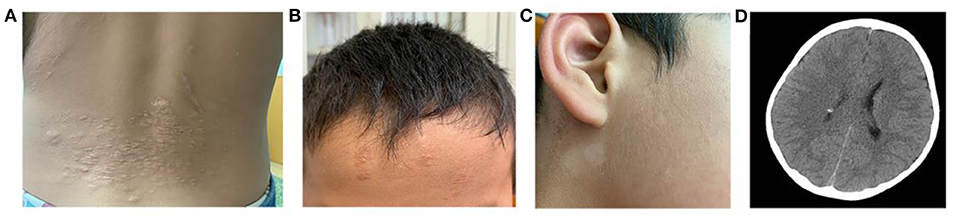
Figure 1. Clinical manifestations of TSC. (A) Shagreen patch at the waist of case 1. (B) Ffibrous cephalic plaque of case 2. (C) Hypomelanotic macule in the face of case 2. (D) A nodular dense shadow in the lateral wall of the right lateral ventricle in cranial CT of case 2, considered as a subependymal nodule.
All three patients had undergone epilepsy surgery. Take case 1 for example, VEEG showed that there were medium-high amplitude sharp waves and spike-and-wave complexes in the left frontal, middle, and temporal regions (Supplementary Figure 1). Cranial MRI showed abnormal signals in left frontal and temporal lobes, and PET-MR image fusion indicated that metabolism decreased in epileptogenic lesions (Figure 2). Combined with VEEG and imaging results, epileptogenic lesions were considered to be located in the left frontotemporal lobe. Epileptogenic tubers and related cortex were completely removed under the premise of no disruption in brain function. We also used the MRI morphological analysis program (MAP) to locate epileptogenic lesions, and the lesions of case 2 and case 3 were both located in the right frontal lobe (Figure 3). After surgery, HE staining was performed and the morphological structure of brain tissues was observed under the light microscope. The result indicated cortical dysplasias (Figure 4).
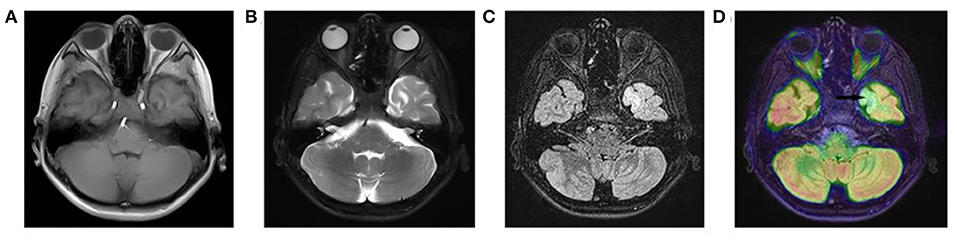
Figure 2. The Cranial MRI and PET-MR image fusion of case 1. There are (A) mixed T1WI signals, (B) long T2WI signals and (C) long T2-FLAIR signals in the left temporal lobe. (D) PET-MR image fusion shows decreased metabolism (arrow) in the corresponding positions.
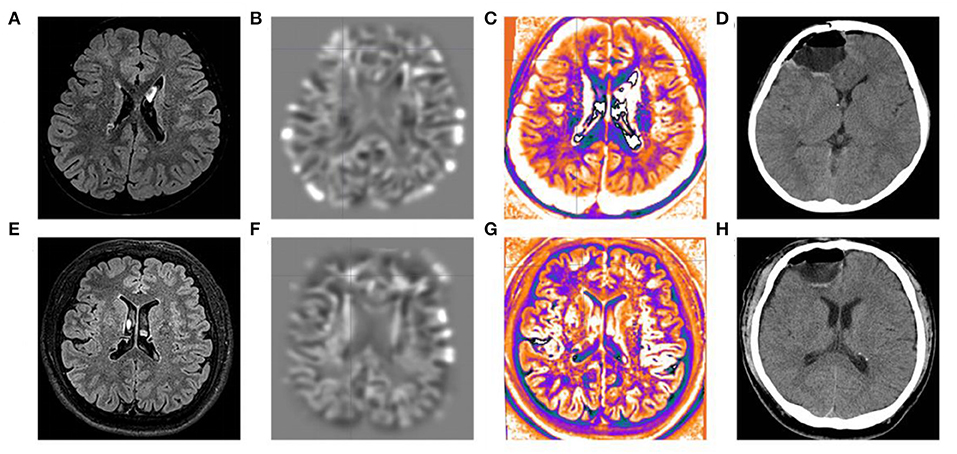
Figure 3. MRI morphological analysis and postoperative CT of case 2 and case 3. The (A) FLAIR, (B) junction imaging, (C) normalized FLAIR signal intensity (NFSI), and (D) postoperative CT of case 2. The (E) FLAIR, (F) junction imaging, (G) NFSI, and (H) postoperative CT of case 3.
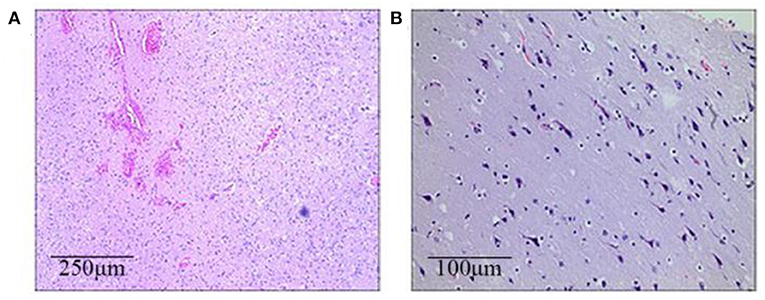
Figure 4. The brain histopathological results (HE staining). (A) Case 1 (the left frontotemporal lobe): Immature neurons, proliferated glial cells, and proliferated vessels with dilation and hyperemia can be seen in a light microscope. (B) Case 2 (the right frontal lobe): Neuronal shrinkage and degeneration can be seen, with the appearance of immature neurons and mild proliferation of glial cells.
The patients were followed up for more than 8 months. The complete seizure freedom (Engel I) was achieved in case 1 and case 2. Case 3 had twice epileptic episodes within 1 month after surgery for the consecutive night shift, and then there was no seizure for 10 months (Engel II). Additionally, cases 1 and 2 assessed intelligence on the Wechsler Intelligence Scale for Children (5th ed.). The IQ of case 1 (10 years old) was 60, and he dropped out of school because of his frequent seizures and returned to school after the surgery. The IQ of case 2 (6 years old) was 80, and he was introverted and slow to study new things. Also, case 3 did not come to the hospital for an IQ test, and through telephone follow-up, we learned that he went to work normally after the operation.
Genetic Findings
NGS found that all three cases had heterozygous mutations in the TSC1 gene, and Sanger sequencing was used to verify the authenticity and origin of the variation (Table 2, Supplementary Figure 2). Case 1 had the heterozygous mutation c.1524C>A, which was de novo. Case 2 had the heterozygous mutation c.1525C>T inherited from the mother. Case 3 had the heterozygous mutation c.1004delC inherited from the father. No TSC2 mutation was found in all three patients.
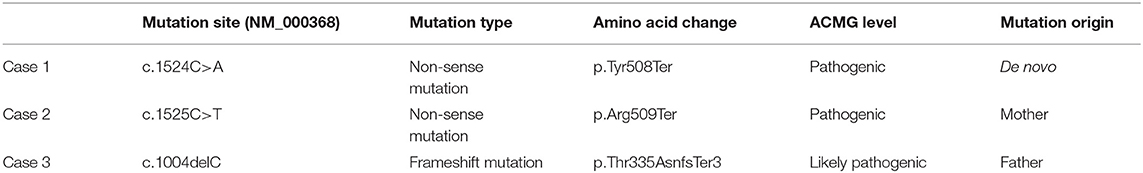
Table 2. Mutations in the TSC1 gene.
To observe the effects of the detected variants on protein structure, we used PSIPRED V4.0 to forecast the mutated and wild-type TSC1 protein structures (Figure 5). The wild-type TSC1 protein has 1164 amino acids, and the mutation c.1524C>A and the mutation c.1525C>T are nonsense mutations, resulting in the absence of 657 amino acids and 656 amino acids, respectively. The mutation c.1004delC is a frameshift mutation that causes the amino acid changes starting at position 335, while the amino acid at position 337 is converted to a stop codon. This mutation resulted in the premature termination of protein synthesis, resulting in a protein deletion of 828 amino acids. All three mutations can result in premature termination of protein synthesis, called truncating mutations.
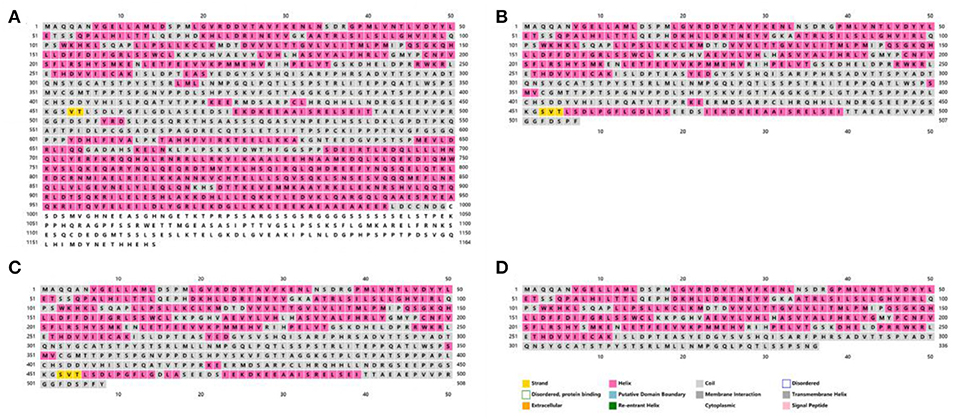
Figure 5. The secondary structures of the mutated and wild-type TSC1 proteins predicted by PSIPRED V4.0. The amino acid sequences and secondary structures of (A) wild-type, (B) case 1 (c.1524C>A, p.Tyr508Ter), (C) case 2 (c.1525C>T, p.Arg509Ter) and (D) case 3 (c.1004delC, p.Thr335AsnfsTer3).
There were no microdeletions or microduplications in the TSC1 and TSC2 genes of the three cases detected by MLPA (data not shown).
Proteomic Profiling
We analyzed the differentially expressed protein expression between the TSC1 truncating mutation group and the control group based on DIA and further studied the interaction between the detected differentially expressed proteins and their biological signal pathways by bioinformatics techniques, to explore whether there are other potential pathways in patients with TSC1 mutations. A total of 110 differentially expressed proteins were identified by proteomic analysis, and the fold change of these proteins was >1.5 (fold change> 1.5), and the differences were significant (p < 0.05). Among them, 55 proteins were up-regulated and 55 proteins were down-regulated (Table 3, Figure 6). The minimum fold change, of 1.506 was observed for ubiquitin-like modifier-activating enzyme 5 (UBA5), ranging up to >43.20-fold change for Complement component C8 alpha chain (C8A). Specifically, the folding changes of these proteins ranged from 1.5 to 43.2. Among them, 97 (88.18%) proteins fold varied between 1.5 and 5, 10 (9.09%) proteins fold varied between 5 and 10 times, and 3 (2.73%) proteins fold varied between 10 and 50 times.
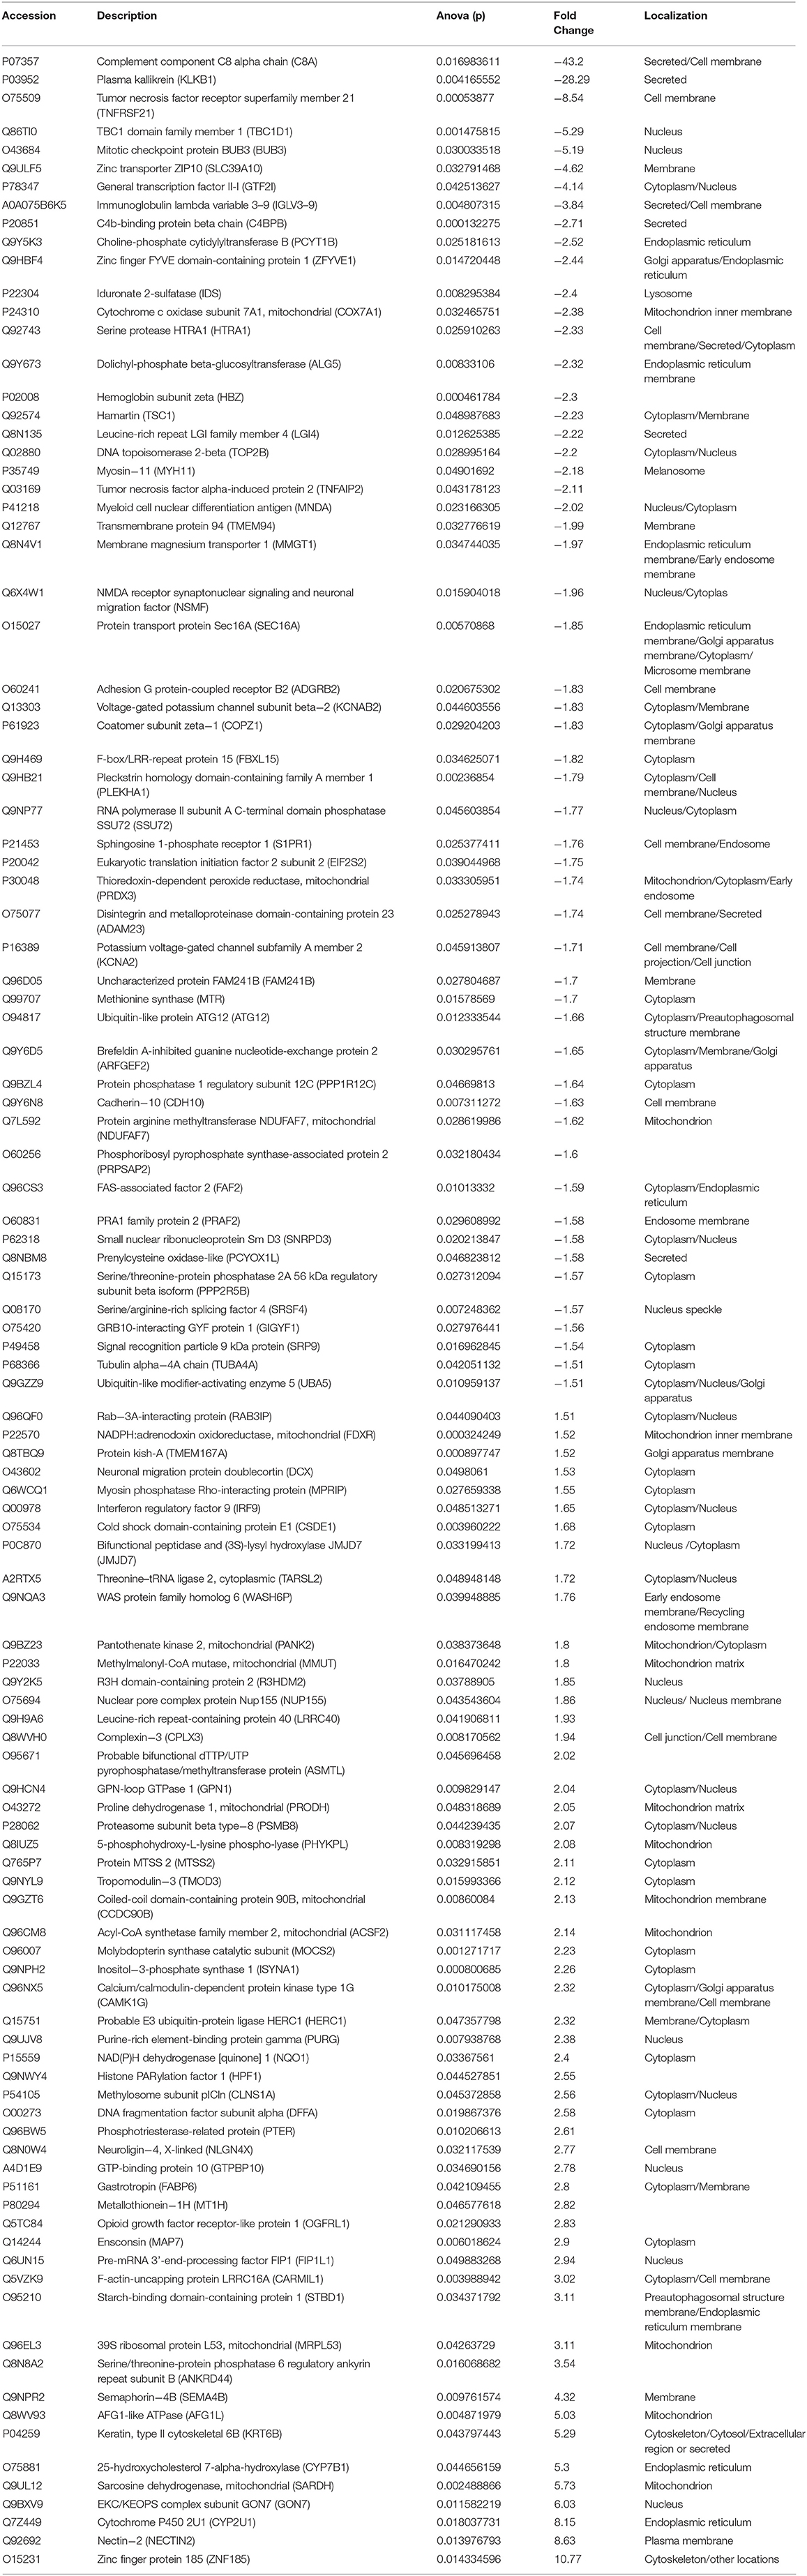
Table 3. Differentially expressed proteins in the TSC1 truncating mutation group and the control group.
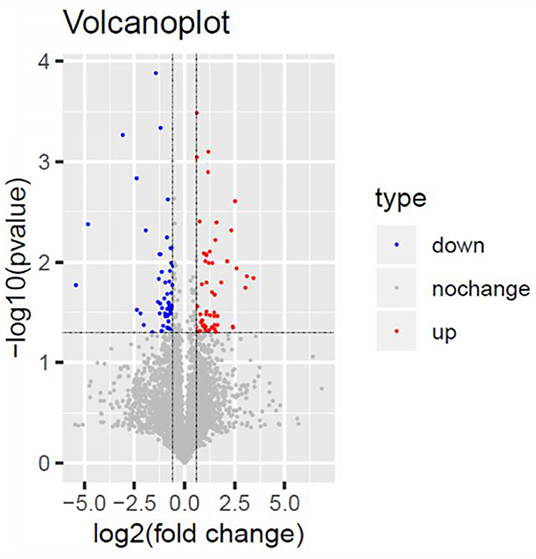
Figure 6. Volcano Plot. Volcano Plot of the 110 significantly dysregulated proteins between the TSC1 truncating mutation group and the control group. Blue represents the downregulated protein expression and red indicates the upregulated protein.
The GO CC enrichment analysis of the differentially expressed proteins in the TSC1 truncating mutation group and the control group can provide a reference for the analysis of the enrichment location of the differentially expressed proteins in the cells. According to the analysis results, the differentially expressed proteins were mainly enriched in the mRNA cleavage and polyadenylation specificity factor complex, the phagophore assembly site membrane, the intrinsic component of the synaptic membrane, the symmetric synapse, the methylosome, the juxtaparanode region of axon, the presynaptic membrane, the phagophore assembly site, the integral component of the presynaptic membrane, the intrinsic component of the presynaptic membrane and so on (Figure 7A). It is worth noting that there is a considerable amount of differentially expressed protein enrichment in the intrinsic component of the synaptic membrane and the presynaptic membrane, indicating that the normal function of the synapse has undergone substantial changes.
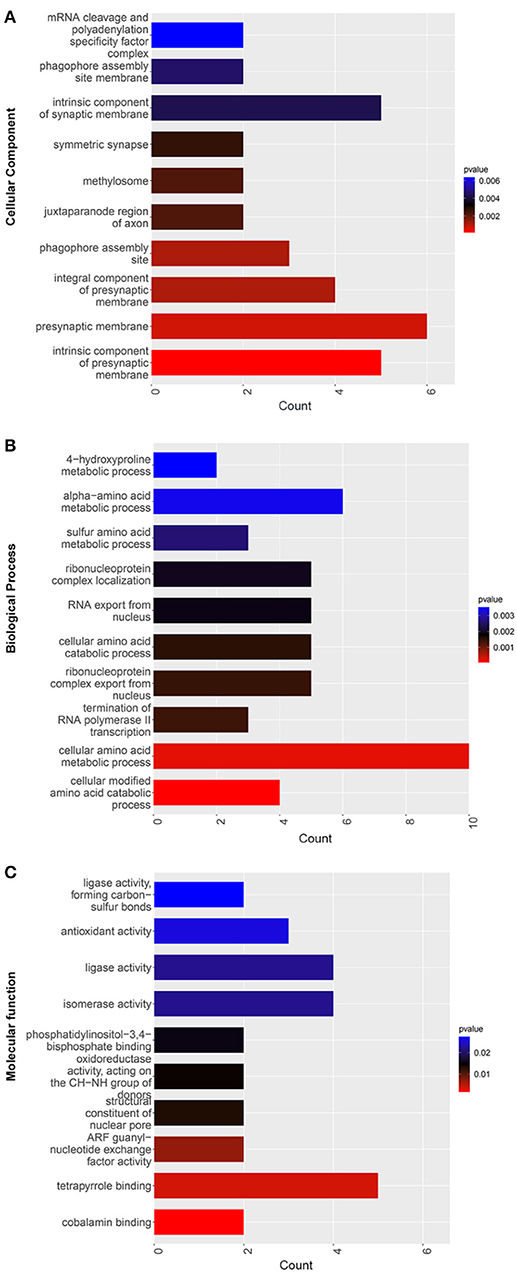
Figure 7. GO enrichment map of differentially expressed proteins between the TSC1 truncating mutation group and the control group. The y-axis represents the classification of differentially expressed proteins according to (A) Gene Ontology Cellular Component (GO CC), (B) Gene Ontology Biological Process (GO BP), and (C) Gene Ontology Molecular function (GO MF). The x-axis is the count of differentially expressed proteins.
The GO BP enrichment analysis of the differentially expressed proteins in the TSC1 truncating mutation group and the control group can provide a reference for analyzing the biological processes involved in the differentially expressed proteins. According to the results of the analysis, differentially expressed proteins are mainly involved in sulfur amino acid metabolic process, alpha-amino acid metabolic process, 4-hydroxyproline metabolic process, termination of RNA polymerase II transcription, RNA export from the nucleus, ribonucleoprotein complex localization, ribonucleoprotein complex export from the nucleus, cellular amino acid catabolic process, cellular modified amino acid catabolic process, etc. (Figure 7B). Among them, the number of differentially expressed proteins involved in cellular amino acid metabolic process is the most, so it may affect cells through the pathway of amino acid metabolism.
The GO MF enrichment analysis of the differentially expressed proteins in the TSC1 truncating mutation group and the control group can be used to summarize and analyze the molecular functions of the differentially expressed proteins in cellular biological activities. According to the results of the analysis, the differentially expressed proteins mainly exert ligase activity, forming carbon-sulfur bonds, antioxidant activity, ligase activity, isomerase activity, phosphatidylinositol-3,4-bisphosphate binding, oxidoreductase activity, acting on the CH-NH group of donors, structural constituent of nuclear pore, ARF guanyl-nucleotide exchange factor activity, tetrapyrrole binding, cobalamin binding, etc. (Figure 7C).
Discussion
TSC is a genetic heterogeneous disorder caused by mutations in the TSC1 and TSC2 genes. It can lead to intellectual disability, seizures, and autism (23). In this study, the phenotype of three TSC patients was found to be related to their truncating mutations in TSC1. At present, more than 450 disease-causing mutations of TSC1 have been reported (24). The nonsense mutation c.1525C>T (p.Arg509Ter) has been reported in 1997 in Science (25). Notably, the nonsense mutation c.1524C>A (p.Tyr508Ter) and the frameshift mutation c.1004delC (p.Thr335AsnfsTer3) have not been previously reported in the PubMed and the Human Gene Mutation Database.
Epilepsy is the most common reason for patients with TSC to seek medical advice (15). Treatment of TRE remains a major challenge, with 72–85% of TSC patients having a history of epilepsy, and ~60% of patients suffering from persistent seizures (3). If the use of two or more AEDs is not effective, surgery for patients with epilepsy should be evaluated as early as possible. In the present study, the three cases of intractable epilepsy with TSC1 truncating mutations benefited from surgery. After the accurate positioning of epileptogenic lesions by VEEG and imaging, they underwent total resection of tubers and related cortex. Two cases had complete seizure freedom (Engel I) in an 8-month follow-up.
In the TSC1 truncating mutation group and the control group, we find that some of the differentially expressed proteins have been reported to be associated with epilepsy, including NQO1 (26), MOCS2 (27), PRODH (28), DCX (29), UBA5 (30), SRP9 (31), ARFGEF2 (32), ATG12 (33), MTR (34), KCNA2 (35), ADAM23 (36), KCNAB2 (37), TSC1 (10), IDS (38), GTF2I (39), and so on. Above all, the expression of TSC1 protein is lower in brain tissues with TSC1 truncating mutation, which may be caused by mutations that shorten the protein. The mutation of TSC1 protein affects the mTOR pathway, and the over-activation of the mTOR pathway will produce deformable neurons, which is called “epileptic generator” in TSC (40).
It is worth noting that the expression levels of K+ channel proteins, KCNA2 and KCNAB2, were down-regulated in the TSC1 truncating mutation group compared with the control group, which may be related to the effect of seizures on ion channels in patients with TSC. In the context of epilepsy, the K+ channel has special significance and is the main determinant of membrane excitability. Native K+ currents are produced by the voltage-dependent channel, a tetramer of alfa- and beta-subunits (41). The KCNAB2 gene encodes voltage-gated K+ channel beta-subunit, and the decrease of its expression will reduce membrane repolarization, leading to a reduction of the threshold of epilepsy (37). The KCNA2 gene encodes the voltage-gated K+ channel Kv1.2, and the mutations in it can cause progressive myoclonus epilepsy and epileptic encephalopathy (35). Additionally, the voltage-gated potassium channel Kv1.1/1.2-subunit is related to cell adhesion molecules (CAM), which includes Caspr2 and LGI1 (42). The interaction of LGI1 with ADAM22 and ADAM23 makes an important impact on the molecular mechanism of autosomal dominant lateral temporal lobe epilepsy (ADLTE). We found that the expression level of ADAM23 decreased in the TSC1 truncating mutation group. Some studies have shown that ADAM23 gene is associated with epilepsy in mice and dogs. However, the potential value of ADAM23 in the clinical is still unclear, so clinical studies are needed to explore whether ADAM23 protein is related to the incidence of epilepsy patients (36).
In addition to the genes related to epilepsy, there are also some genes related to nerve migration. Among the differentially expressed proteins, we detected a decrease in the expression level of ARFGEF2. Some studies have shown that ARFGEF2 mutations can lead to severe intellectual disability and are closely related to neuronal migration disorders. However, the molecular mechanism of the neuronal migration regulated by BIG2 (encoded by the ARFGEF2 gene) is not clear, and further study is needed (32). Tubers are epileptogenic cortical malformations in TSC. Allana et al. showed that both mRNA and protein levels of the DCX protein were higher in TSC nodules than in the control group (43). This result is consistent with our expression of differentially expressed proteins. DCX is related to neuron migration, and the expression of DCX in the lesion area of patients with tuberous sclerosis is higher than the normal control, which may be related to abnormal neuronal localization (heterotopia), intellectual disability and epilepsy caused by DCX (29).
Additionally, the expression of ATG12, a kind of autophagy-related protein, is reduced in the TSC1 truncating mutation group. Some studies have pointed out that autophagy of hippocampal neurons after induced seizures may be a new idea for the treatment of epilepsy. As far as we know, autophagy is strictly regulated by autophagy-related molecules (collectively referred to as ATGs). Therefore, it may be a new therapeutic idea by regulating the expression of ATG12 protein to reduce seizures (33).
We also compared the results of differentially expressed proteins with previous studies about gene expression profiles in TSC mice or patients. Compared to transcriptomic data (DEG) and proteomic data (DEP) of forebrains from 3 Tsc1/Emx1-Cre mice and 3 wild-type mice, transcriptomic data of cortical tubers from 4 TSC patients and 4 autopsy control tissues (GSE16969), and transcriptomic data of brain tissues from 3 TSC patients and 3 normal brain tissues (GSE62019) (44), there are 6 up- and 8 down-regulated proteins in our present study that overlap with these four databases (Table 4). The trends of differentially expressed proteins including TSC1, PRODH, CSDE1, BUB3, and PRPSAP2 in our study are consistent with those in mice databases (DEG and DEP). Also, the trends of differentially expressed proteins including RAB3IP, ACSF2, CYP2U1, TNFRSF21, KCNAB2, COPZ1, PRDX3, FDXR, and KLKB1 in our study are consistent with those in human databases (GSE16969 and GSE62019).
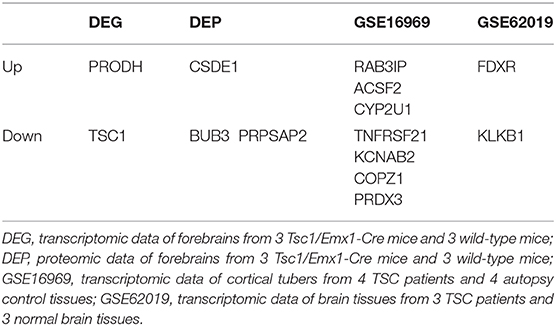
Table 4. Differentially expressed proteins that overlap with the databases.
Through the GO enrichment analysis of TCS mutation and control differentially expressed protein, we found something interesting. Firstly, in the classification of cell structure, the differentially expressed proteins are mainly concentrated in the intrinsic component of synaptic membrane, presynaptic membrane and so on. This suggests that the TSC1 truncating mutation may cause changes in the normal function of synapses, thus affecting the transmission of information between cells. Secondly, in the classification of biological processes, differentially expressed proteins are mainly enriched in the process of amino acid metabolism. There may be two main reasons for abnormal amino acid metabolism, one is the enzyme defect, which blocks the amino acid catabolism, and the other is the defect of amino acid absorption and transport system. Additionally, in the classification of molecular function, the differentially expressed proteins are mainly enriched in antioxidant activity, ligase activity, isomerase activity, tetrapyrrole binding. It is worth noting that tetrapyrrole binding has a large number of differentially expressed protein enrichment.
Our study provides a new idea to explore the brain injury mechanism caused by TSC1 mutations. Unfortunately, due to the difficulty of clinical sample collection, the sample size of this study is not large enough. The results of differentially expressed proteins need to be further verified in a large sample study. Moreover, if the difference of protein expressions in the brain between patients with TRE and patients with non-TSC epilepsy can be analyzed, it may be helpful to explore the unique pathogenesis of TRE.
Conclusion
To sum up, the study investigated clinical features, mutation analyses and brain proteomic profiling of three surgical cases of intractable epilepsy caused by truncating mutations in the TSC1 gene. In this study, we reported two new mutations in the TSC1 gene, expanding the mutation spectrum of the TSC1 gene related to clinical phenotype. Proteomic profiling suggested that the differentially expressed proteins were mostly concentrated in the synaptic membrane between the patients with TSC1 truncating mutation and the control group, indicating that the changes of synaptic membrane in patients with TSC may affect the information transmission between cells. Amino acid metabolism is also significant among differentially expressed proteins, highlighting the probable key role of abnormal amino acid metabolism in the mechanism of brain damage caused by TSC1 mutations.
Data Availability Statement
The datasets presented in this article are not readily available because of legal restrictions. Requests to access the datasets should be directed to the corresponding author Qing-Xia Kong.
Ethics Statement
Written informed consent was obtained from the individual(s), and minor(s)' legal guardian/next of kin, for the publication of any potentially identifiable images or data included in this article.
Author Contributions
Q-XK, J-CZ, and Q-BL designed the present study. X-BH, HY, H-XY, J-HF, LW, HZ, and BZ collected the clinical data. Y-DL and M-YM analyzed the data and wrote the paper. Y-KZ revised the paper. All authors read and approved the final version of the manuscript.
Funding
This study was supported by the Research Fund for Academician Lin He New Medicine (grant no. JYHL2018FMS10), the Key Research and Development Plan of Jining City (grant no. 2019SMNS019), the Natural Science Foundation of Shandong Province (grant no. ZR2019MH060), and the National Natural Science Foundation of China (grant no. 81901324).
Conflict of Interest
The authors declare that the research was conducted in the absence of any commercial or financial relationships that could be construed as a potential conflict of interest.
Acknowledgments
The authors would like to thank the Beijing Kangso Medical Inspection and the Institutes for Shanghai Pudong Decoding Life for technical support.
Supplementary Material
The Supplementary Material for this article can be found online at: https://www.frontiersin.org/articles/10.3389/fneur.2020.00475/full#supplementary-material
Supplementary Figure 1. The VEEG of case 1. (A) There are medium-high amplitude sharp waves and spike-and-wave complexes in the left frontal, middle and temporal regions. (B) Spike-and-wave complexes of high amplitude and extremely high amplitude occur in all regions.
Supplementary Figure 2. Sanger sequencing of candidate sites in the TSC1 gene of the three patients and their families. The heterozygous mutation c.1524C>A in (A) case 1, and wild-type sequence in (B) the father and in (C) the mother. The heterozygous mutation c.1525C>T in (D) case 2 and in (E) the mother, and (F) wild-type sequence in the brother. The heterozygous mutation c.1004delC in (G) case 3 and in (H) the father, and (I) wild-type sequence in the mother.
Supplementary Table 1. The information of the control group.
Footnotes
1. ^http://ncbi36.genepipe.ncgm.sinica.edu.tw/primerz/beginDesign.do
References
1. Kanner AM. Management of psychiatric and neurological comorbidities in epilepsy. Nat Rev Neurol. (2016) 12:106–16. doi: 10.1038/nrneurol.2015.243
2. Oyrer J, Maljevic S, Scheffer IE, Berkovic SF, Petrou S, Reid CA. Ion channels in genetic epilepsy: from genes and mechanisms to disease-targeted therapies. Pharmacol Rev. (2018) 70:142–73. doi: 10.1124/pr.117.014456
3. Curatolo P, Moavero R, de Vries PJ. Neurological and neuropsychiatric aspects of tuberous sclerosis complex. Lancet Neurol. (2015) 14:733–45. doi: 10.1016/S1474-4422(15)00069-1
4. de Vries PJ, Belousova E, Benedik MP, Carter T, Cottin V, Curatolo P, et al. TSC-associated neuropsychiatric disorders (TAND): findings from the TOSCA natural history study. Orphanet J Rare Dis. (2018) 13:157. doi: 10.1186/s13023-018-0901-8
5. Cusmai R, Moavero R, Bombardieri R, Vigevano F, Curatolo P. Long-term neurological outcome in children with early-onset epilepsy associated with tuberous sclerosis. Epilepsy Behav. (2011) 22:735–9. doi: 10.1016/j.yebeh.2011.08.037
6. Crino PB, Nathanson KL. The tuberous sclerosis complex. N Engl J Med. (2006) 355:1345–56. doi: 10.1056/NEJMra055323
7. Saxton RA, Sabatini DM. mTOR signaling in growth, metabolism, and disease. Cell. (2017) 168:960–76. doi: 10.1016/j.cell.2017.02.004
8. Volpi A, Sala G, Lesma E, Labriola F, Righetti M, Alfano RM, et al. Tuberous sclerosis complex: new insights into clinical and therapeutic approach. J Nephrol. (2019) 32:355–63. doi: 10.1007/s40620-018-0547-6
9. French JA, Lawson JA, Yapici Z, Ikeda H, Polster T, Nabbout R, et al. Adjunctive everolimus therapy for treatment-resistant focal-onset seizures associated with tuberous sclerosis (EXIST-3): a phase 3, randomised, double-blind, placebo-controlled study. Lancet. (2016) 388:2153–63. doi: 10.1016/S0140-6736(16)31419-2
10. Wong M. The role of glia in epilepsy, intellectual disability, and other neurodevelopmental disorders in tuberous sclerosis complex. J Neurodev Disord. (2019) 11:30. doi: 10.1186/s11689-019-9289-6
11. Bolton PF, Griffiths PD. Association of tuberous sclerosis of temporal lobes with autism and atypical autism. Lancet. (1997) 349:392–5. doi: 10.1016/S0140-6736(97)80012-8
12. Kaczorowska M, Jurkiewicz E, Domanska-Pakiela D, Syczewska M, Lojszczyk B, Chmielewski D, et al. Cerebral tuber count and its impact on mental outcome of patients with tuberous sclerosis complex. Epilepsia. (2011) 52:22–7. doi: 10.1111/j.1528-1167.2010.02892.x
13. Prohl AK, Scherrer B, Tomas-Fernandez X, Davis PE, Filip-Dhima R, Prabhu SP, et al. Early white matter development is abnormal in tuberous sclerosis complex patients who develop autism spectrum disorder. J Neurodev Disord. (2019) 11:36. doi: 10.1186/s11689-019-9293-x
14. Liu S, Yu T, Guan Y, Zhang K, Ding P, Chen L, et al. Resective epilepsy surgery in tuberous sclerosis complex: a nationwide multicentre retrospective study from China. Brain. (2020) 143:570–81. doi: 10.1093/brain/awz411
15. Overwater IE, Bindels-de Heus K, Rietman AB, Ten Hoopen LW, Vergouwe Y, Moll HA, et al. Epilepsy in children with tuberous sclerosis complex: chance of remission and response to antiepileptic drugs. Epilepsia. (2015) 56:1239–45. doi: 10.1111/epi.13050
16. van Eeghen AM, Black ME, Pulsifer MB, Kwiatkowski DJ, Thiele EA. Genotype and cognitive phenotype of patients with tuberous sclerosis complex. Eur J Hum Genet. (2012) 20:510–5. doi: 10.1038/ejhg.2011.241
17. Yang G, Shi ZN, Meng Y, Shi XY, Pang LY, Ma SF, et al. Phenotypic and genotypic characterization of Chinese children diagnosed with tuberous sclerosis complex. Clin Genet. (2017) 91:764–8. doi: 10.1111/cge.12920
18. Northrup H, Krueger DA. Tuberous sclerosis complex diagnostic criteria update: recommendations of the 2012 International tuberous sclerosis complex consensus conference. Pediatr Neurol. (2013) 49:243–54. doi: 10.1016/j.pediatrneurol.2013.08.001
19. Richards S, Aziz N, Bale S, Bick D, Das S, Gastier-Foster J, et al. Standards and guidelines for the interpretation of sequence variants: a joint consensus recommendation of the American college of medical genetics and genomics and the association for molecular pathology. Genet Med. (2015) 17:405–24. doi: 10.1038/gim.2015.30
20. Liu Y-D, Chu X, Liu R-H, Sun Y, Kong Q-X, Li Q-B. Paroxysmal spasticity of lower extremities as the initial symptom in two siblings with maple syrup urine disease. Mol Med Rep. (2019) 19:4872–80. doi: 10.3892/mmr.2019.10133
21. D'Angelo R, Donato L, Venza I, Scimone C, Aragona P, Sidoti A. Possible protective role of the ABCA4 gene c.1268A>G missense variant in stargardt disease and syndromic retinitis pigmentosa in a sicilian family: preliminary data. Int J Mol Med. (2017) 39:1011–20. doi: 10.3892/ijmm.2017.2917
22. Li L, Dong L, Xiao Z, He W, Zhao J, Pan H, et al. Integrated analysis of the proteome and transcriptome in a MCAO mouse model revealed the molecular landscape during stroke progression. J Adv Res. (2020) 24:13–27. doi: 10.1016/j.jare.2020.01.005
23. Caban C, Khan N, Hasbani DM, Crino PB. Genetics of tuberous sclerosis complex: implications for clinical practice. Appl Clin Genet. (2017) 10:1–8. doi: 10.2147/TACG.S90262
24. Mayer K, Fonatsch C, Wimmer K, van den Ouweland AM, Maat-Kievit AJ. Clinical utility gene card for: tuberous sclerosis complex (TSC1, TSC2). Eur J Hum Genet. (2014) 22. doi: 10.1038/ejhg.2013.129
25. van Slegtenhorst M, de Hoogt R, Hermans C, Nellist M, Janssen B, Verhoef S, et al. Identification of the tuberous sclerosis gene TSC1 on chromosome 9q34. Science. (1997) 277:805–8. doi: 10.1126/science.277.5327.805
26. Wang W, Wu Y, Zhang G, Fang H, Wang H, Zang H, et al. Activation of Nrf2-ARE signal pathway protects the brain from damage induced by epileptic seizure. Brain Res. (2014) 1544:54–61. doi: 10.1016/j.brainres.2013.12.004
27. Struys EA, Nota B, Bakkali A, Al Shahwan S, Salomons GS, Tabarki B. Pyridoxine-dependent epilepsy with elevated urinary alpha-amino adipic semialdehyde in molybdenum cofactor deficiency. Pediatrics. (2012) 130:e1716–9. doi: 10.1542/peds.2012-1094
28. Di Rosa G, Pustorino G, Spano M, Campion D, Calabrò M, Aguennouz M, et al. Type I hyperprolinemia and proline dehydrogenase (PRODH) mutations in four Italian children with epilepsy and mental retardation. Psychiatr Genet. (2008) 18:40–2. doi: 10.1097/YPG.0b013e3282f08a3d
29. des PV, Francis F, Pinard J, Desguerre I, Moutard M, Snoeck I, et al. doublecortin is the major gene causing X-linked subcortical laminar heterotopia (SCLH). Hum Mol Genet. (1998) 7:1063–70. doi: 10.1093/hmg/7.7.1063
30. Colin E, Daniel J, Ziegler A, Wakim J, Scrivo A, Haack TB, et al. Biallelic variants in UBA5 reveal that disruption of the UFM1 cascade can result in early-onset encephalopathy. Am J Hum Genet. (2016) 99:695–703. doi: 10.1016/j.ajhg.2016.06.030
31. Hessel EV, de Wit M, Wolterink-Donselaar IG, Karst H, de Graaff E, van Lith HA, et al. Identification of Srp9 as a febrile seizure susceptibility gene. Ann Clin Transl Neurol. (2014) 1:239–50. doi: 10.1002/acn3.48
32. Hong E-H, Kim J-Y, Kim J-H, Lim D-S, Kim M, Kim J-Y. BIG2-ARF1-RhoA-mDia1 signaling regulates dendritic golgi polarization in hippocampal neurons. Mol Neurobiol. (2018) 55:7701–16. doi: 10.1007/s12035-018-0954-7
33. Wang L, Song L-F, Chen X-Y, Ma Y-L, Suo J-F, Shi J-H, et al. MiR-181b inhibits P38/JNK signaling pathway to attenuate autophagy and apoptosis in juvenile rats with kainic acid-induced epilepsy via targeting TLR4. CNS Neurosci Ther. (2019) 25:112–22. doi: 10.1111/cns.12991
34. Komulainen-Ebrahim J, Saastamoinen E, Rahikkala E, Helander H, Hinttala R, Risteli L, et al. Intractable epilepsy due to MTR deficiency: importance of homocysteine analysis. Neuropediatrics. (2017) 48:467–72. doi: 10.1055/s-0037-1603976
35. Canafoglia L, Castellotti B, Ragona F, Freri E, Granata T, Chiapparini L, et al. Progressive myoclonus epilepsy caused by a gain-of-function KCNA2 mutation. Seizure. (2019) 65:106–8. doi: 10.1016/j.seizure.2019.01.005
36. Dazzo E, Leonardi E, Belluzzi E, Malacrida S, Vitiello L, Greggio E, et al. Secretion-positive LGI1 mutations linked to lateral temporal epilepsy impair binding to ADAM22 and ADAM23 receptors. PLoS Genet. (2016) 12:e1006376. doi: 10.1371/journal.pgen.1006376
37. Heilstedt HA, Burgess DL, Anderson AE, Chedrawi A, Tharp B, Lee O, et al. Loss of the potassium channel beta-subunit gene, KCNAB2, is associated with epilepsy in patients with 1p36 deletion syndrome. Epilepsia. (2001) 42:1103–11. doi: 10.1046/j.1528-1157.2001.08801.x
38. Manara R, Priante E, Grimaldi M, Santoro L, Polonara G, Parini R, et al. Closed meningo(encephalo)cele: a new feature in hunter syndrome. AJNR Am J Neuroradiol. (2012) 33:873–7. doi: 10.3174/ajnr.A2867
39. Poletaeva I I, Surina NM, Ashapkin VV, Fedotova IB, Merzalov IB, et al. Maternal methyl-enriched diet in rat reduced the audiogenic seizure proneness in progeny. Pharmacol Biochem Behav. (2014) 127:21–6. doi: 10.1016/j.pbb.2014.09.018
40. Kannan L, Vogrin S, Bailey C, Maixner W, Harvey AS. Centre of epileptogenic tubers generate and propagate seizures in tuberous sclerosis. Brain. (2016) 139:2653–67. doi: 10.1093/brain/aww192
41. Jan L, Jan Y. Cloned potassium channels from eukaryotes and prokaryotes. Annu Rev Neurosci. (1997) 20:91–123. doi: 10.1146/annurev.neuro.20.1.91
42. Hivert B, Marien L, Agbam KN, Faivre-Sarrailh C. ADAM22 and ADAM23 modulate the targeting of the Kv1 channel-associated protein LGI1 to the axon initial segment. J Cell Sci. (2018) 132:jcs219774. doi: 10.1101/311365
43. Lee A, Maldonado M, Baybis M, Walsh C, Scheithauer B, Yeung R, et al. Markers of cellular proliferation are expressed in cortical tubers. Ann Neurol. (2003) 53:668–73. doi: 10.1002/ana.10579
Keywords: tuberous sclerosis complex, TSC1 gene, epilepsy, proteomic profiling, mutation
Citation: Liu Y-D, Ma M-Y, Hu X-B, Yan H, Zhang Y-K, Yang H-X, Feng J-H, Wang L, Zhang H, Zhang B, Li Q-B, Zhang J-C and Kong Q-X (2020) Brain Proteomic Profiling in Intractable Epilepsy Caused by TSC1 Truncating Mutations: A Small Sample Study. Front. Neurol. 11:475. doi: 10.3389/fneur.2020.00475
Received: 05 March 2020; Accepted: 30 April 2020;
Published: 29 May 2020.
Edited by:
Fushun Wang, Nanjing University of Chinese Medicine, ChinaReviewed by:
Jing Chen, University of Warwick, United KingdomYu-Feng Xie, University of Toronto, Canada
Copyright © 2020 Liu, Ma, Hu, Yan, Zhang, Yang, Feng, Wang, Zhang, Zhang, Li, Zhang and Kong. This is an open-access article distributed under the terms of the Creative Commons Attribution License (CC BY). The use, distribution or reproduction in other forums is permitted, provided the original author(s) and the copyright owner(s) are credited and that the original publication in this journal is cited, in accordance with accepted academic practice. No use, distribution or reproduction is permitted which does not comply with these terms.
*Correspondence: Qiu-Bo Li, lqb0072@126.com; Jun-Chen Zhang, 11junchzh@163.com; Qing-Xia Kong, kxdqy8@sohu.com
†These authors have contributed equally to this work