A method to assess linear self-predictability of physiologic processes in the frequency domain: application to beat-to-beat variability of arterial compliance
 Laura Sparacino
 Yuri Antonacci
 Chiara Barà1
  Michal Javorka
 Luca Faes
- 1Department of Engineering, University of Palermo, Palermo, Italy
- 2Department of Physiology, Jessenius Faculty of Medicine in Martin, Comenius University in Bratislava, Martin, Slovakia
The concept of self-predictability plays a key role for the analysis of the self-driven dynamics of physiological processes displaying richness of oscillatory rhythms. While time domain measures of self-predictability, as well as time-varying and local extensions, have already been proposed and largely applied in different contexts, they still lack a clear spectral description, which would be significantly useful for the interpretation of the frequency-specific content of the investigated processes. Herein, we propose a novel approach to characterize the linear self-predictability (LSP) of Gaussian processes in the frequency domain. The LSP spectral functions are related to the peaks of the power spectral density (PSD) of the investigated process, which is represented as the sum of different oscillatory components with specific frequency through the method of spectral decomposition. Remarkably, each of the LSP profiles is linked to a specific oscillation of the process, and it returns frequency-specific measures when integrated along spectral bands of physiological interest, as well as a time domain self-predictability measure with a clear meaning in the field of information theory, corresponding to the well-known information storage, when integrated along the whole frequency axis. The proposed measure is first illustrated in a theoretical simulation, showing that it clearly reflects the degree and frequency-specific location of predictability patterns of the analyzed process in both time and frequency domains. Then, it is applied to beat-to-beat time series of arterial compliance obtained in young healthy subjects. The results evidence that the spectral decomposition strategy applied to both the PSD and the spectral LSP of compliance identifies physiological responses to postural stress of low and high frequency oscillations of the process which cannot be traced in the time domain only, highlighting the importance of computing frequency-specific measures of self-predictability in any oscillatory physiologic process.
1 Introduction
In the past decades, zealous interdisciplinary research studies have been focused on the spontaneous oscillations exhibited by variables describing the temporal dynamic activity of several physiologic systems. These oscillatory patterns can arise from the combined action of multiple regulatory mechanisms, including mechanical coupling effects and autonomic nervous system control, often arranged in closed-loop interactions among interconnected subsystems reacting to internal and external stimuli (Glass, 2001). Since these interactions occur across a wide range of time scales, e.g., spanning from 0.02 to 0.5 Hz in the case of cardiovascular and respiratory systems, the time course of the investigated physiologic variables is characterized by different degrees of regularity (i.e., recurrence of specific patterns with different dominant frequencies and shapes). A variety of techniques has been proposed to quantify the richness of a dynamic process, as well as to characterize the system state in various physiological and pathological conditions (Pincus 1994; Porta et al., 1998; Richman and Moorman 2000; Goldberger et al., 2002; Porta et al., 2007; Porta et al., 2012; Faes et al., 2015b; Valente et al., 2018). A commonly used approach is the quantification of the degree of regularity, or self-predictability, of patterns extracted from short-term recordings intended as realizations of dynamic processes. To this aim, different univariate measures have been proposed throughout the years, either derived from nonlinear prediction (Porta et al., 2006; Erla et al., 2011) or based on the concepts of conditional entropy and information storage (Porta et al., 1998; Richman and Moorman, 2000; Lizier et al., 2012; Faes et al., 2013; Wibral et al., 2014). Conditional entropy has been referred to as a measure of complexity quantifying the rate of entropy generation of an individual system, while the notion of information storage, representing information from the past of a stochastic process to predict its future (Lizier et al., 2012; Wibral et al., 2014), has allowed quantification of self-dynamics. This has been achieved through the well-established measure of self-entropy (Barnett et al., 2009; Faes et al. (2015b; 2016), serving as a gauge of self-predictability by quantifying the information shared between the current and the past states of the process.
A drawback of information-theoretic measures quantifying self-predictability is that they represent global indexes which address the entire temporal evolution of the analysed process, without obtaining time-resolved information about its dynamics nor focusing on specific frequency rhythms (Faes et al., 2015a). On the other hand, physiological time series display a rich oscillatory content, which is typically manifested within the low frequency (LF, 0.04 − 0.15 Hz) and high frequency (HF, 0.15 − 0.4 Hz) bands of the spectrum in the case of cardiovascular and respiratory variables (Cohen and Taylor, 2002; Shaffer et al., 2014). This limitation has already been addressed through the definition of time-varying (Valenza et al., 2017) and local (Faes et al., 2016; Barà et al., 2023) measures of information storage, the latter defining how information is stored at each moment in time in a stochastic process (Lizier et al. (2008; 2012); Lizier (2014)). A different approach has been proposed in (Donoghue et al., 2020), where the periodic and aperiodic oscillations of a process have been identified in the power spectrum, e.g., by exploiting the power spectral density obtained via parametric or non parametric methods. Despite this methodology owns a great potential in accurately quantifying the frequency-specific content of physiological variables, it does not take into account measures from the field of information theory.
In this work, we aim to fill the gap by introducing a novel methodology that combines the two frameworks, i.e., information-theoretic and frequency domain approaches. We propose a new approach for the linear spectral analysis of self-predictability in physiological processes, which allows to obtain frequency-resolved information about their dynamics (Sect. 2). A novel spectral measure of linear self-predictability (LSP) is derived intuitively from the transfer function (TF) of the autoregressive (AR) linear model describing the relationship between the current and past states of the process, and is defined in such a way to match the time domain information storage if integrated alongside the whole frequency axis (Geweke, 1982; Chicharro, 2011). The proposed measure is first illustrated in a theoretical example, where its behaviour at varying the radii of the poles of the AR TF is shown (Sect. 3). Moreover, we demonstrate that the dominant peaks in the spectrum of the simulated Gaussian process, which reflect regular (thus self-predictable) oscillations in the same process, can be easily detected by our method that indeed constitutes a bridge between the information-theoretic and the frequency domain frameworks. Furthermore, in order to display the physiological significance and potentiality of our approach, the LSP measure is computed over short-term beat-to-beat time series of arterial compliance (AC) measured in young healthy subjects using a recently developed noninvasive methodology (Švec et al., 2021) (Sect. 4). Being a cardiovascular variable characterizing mechanical and structural properties of the arteries (Švec and Javorka, 2021), very little is known about the short-term-variability nature of AC. Arterial compliance variability is expected to be affected by the sympathetic and vagal activities, whose interaction reflects the typical balance between fight-or-flight and rest-or-digest responses (McCorry, 2007; Ondicova and Mravec, 2010; Gibbons, 2019). Investigating the spectral content of AC, as well as understanding how this parameter behaves in response to external perturbations, is important to characterize its beat-to-beat dynamics for physiological research and clinical purposes (Mackenzie et al., 2002; Sugawara et al., 2012; Tan et al., 2016). Moreover, assessing the presence and extent of LF oscillations in the beat-to-beat variability of arterial compliance may be highly relevant for the exploration of sympathetic activity changes, assumed as the dominant LF-driven responsible for the dynamics of this parameter, except of mechanical effects (e.g., effects of intrathoracic pressure or arterial blood pressure). Therefore, since we are not aware of past studies performing a systematic spectral characterization of this physiological variable, here we aimed to assess, separately for LF and HF oscillations, its degree of self-predictability in the resting state and in response to the alterations in the sympatho-vagal balance induced by postural stress. We exploited the well-known method of spectral decomposition (Baselli et al., 1997; Pernice et al., 2021) to retrieve pole-specific LSP profiles, as well as the power content associated to specific oscillations with central frequency in LF and HF bands of the spectrum.
Overall, in spite of the complex mathematical framework mixing together concepts from the fields of information theory and spectral analysis of linear Gaussian processes, our results evidence (i) the feasibility of our approach and its worthwhile generalization to a variety of physiological processes displaying oscillatory activity, as well as (ii) the need of computing spectral measures of self-predictability focusing on specific frequency bands with physiological meaning, to reveal mechanisms which remain otherwise hidden in a whole-band time domain analysis.
2 Linear autoregressive models of physiologic processes
Let us consider the stochastic process Y, with Yn denoting the random variable sampling the process at time n, where n is the temporal counter, and
Assuming Y as a stationary Markov process, the following linear AR model can be used to study the dynamic interactions between its present and past states (Lütkepohl, 2005):
where p is the model order, describing the maximum lag used to quantify interactions, Un is the present state of a scalar zero-mean white process with variance
2.1 Spectral decomposition of oscillatory content
The AR model in Eq. (1) can be represented in the Z-domain through its Z-transform yielding Y(z) = H(z)U(z), where
where pk, k = 1, …, p, are the p poles of the AR process, i.e., the roots of
where
Importantly, in comparison to classical approaches based on integrating the PSD profile within the spectral bands of interest to get band-specific time domain powers (Krohova et al., 2020), the proposed method of spectral decomposition allows to focus only on the spectral components with frequencies within those bands, thus avoiding spurious contributions due to broadband oscillations. This peculiarity is exploited in the next subsection to define a pole-specific measure of self-predictability in the frequency domain.
2.2 Spectral decomposition of self-predictability
In the previous section we have seen how analysing the spectrum of a physiologic process provides noteworthy information on the frequency-specific location of the oscillations of that process, thus allowing to identify and separate its different spectral components. Here, we show how the characterization of the spectral dynamics of a process can be also carried on by looking at its degree of linear self-predictability, drawing a connection with information theory.
The most popular information-theoretic measure of self-predictability is the information storage (IS), which quantifies, for a random process Y, the amount of information contained in the present state Yn that can be predicted by the knowledge of its past states,
where
The spectral in Eq. (5) can be written also as
Note that Eq. (6) is satisfied because the full-frequency integral of the term
The spectral decomposition of the pole-specific LSP into terms related to the Q oscillations of the AR process, depicted in Eq. (5), allows to locate the self-dynamics of Y in specific spectral bands with given frequency, as well as to compute their strength as the integral of these profiles within the investigated bands. Remarkably, the spectral LSP profiles display peaks as the PSD does, since both are derived from adaptations of the TF of the AR model describing the data. The difference between the two resides in the logarithmic formulation of the LSP in the well-known framework of information theory. Indeed, being a measure of information shared between the present and past states of the investigated processes according to its mathematical definition, it can be quantified in natural units (nats) in the time domain, and in nats/Hz in the spectral domain, thus acquiring a clear meaning in the context of information theory.
2.3 Statistical validation
This section presents the use of surrogate and bootstrap data analyses to assess the statistical significance of the proposed measures of time domain and spectral LSP.
As far as we know, the task of validating the presence of a significant non-flat component within the spectrum of a process is not straightforward. In the spirit of surrogate data analysis, one should destroy the oscillation under scrutiny without altering the remaining spectral patterns of the process. However, this is undoubtedly challenging and requires in-depth analyses. Therefore, in this work we propose an empirical approach based on bootstrap data analysis (Politis, 2003) to assess the statistical significance of pole-specific measures of self-predictability, while time domain measures are validated through the well-known method of surrogate data analysis (Theiler et al., 1992). Validation is performed at the level of individual realizations of the observed process Y, obtained in the form of the time series y = {y(1), …, y(M)}, where M is the length of the time series. Specifically, a linear model as in Eq. (1) is first identified on the time series y through the vector least square approach; then, estimates of the spectral and the time domain LSP measures, denoted respectively as
2.3.1 Surrogate data analysis
The method of surrogate data (Theiler et al., 1992) is employed to obtain a threshold for zero self-predictability setting a significance level for the time domain LSP measure. Specifically, randomly shuffled surrogates (Palus, 1997), which are realizations of independent and identically distributed (i.i.d.) stochastic processes with the same mean, variance and probability distribution as the original series, are generated by randomly permuting in temporal order the samples of the original series, according to the null hypothesis of absence of autonomous dynamics within the investigated process. This procedure is repeated Ns times to obtain the surrogate series ys, s = 1, …, Ns. The time domain LSP is then estimated on each surrogate, yielding the distribution
2.3.2 Bootstrap data analysis
The block bootstrap data generation procedure (Politis, 2003) is followed to generate, starting from the time series y, Nb bootstrap pseudo-series yb = {yb(1), …, yb(M)}, b = 1, …, Nb, which maintain all the individual properties of the original time series, i.e., mean, variance and probability distribution. The bootstrap pseudo-series are generated by feeding the AR model identified on the original time series y with bootstrap pseudo-residuals. The procedure creates the bootstrap pseudo-residuals ub = {ub(1), …, ub(M)} by joining together
3 Validation on simulations
In this section, we study the behavior of the proposed self-predictability measure using a simulated AR process, where the exact profiles of the spectral LSP are computed (with sampling frequency fs = 1 Hz) from the true values imposed for the AR parameters. The process Y, exhibiting autonomous oscillations at different frequencies, is defined as:
where U is a Gaussian white noise process with zero mean and unit variance. The autonomous oscillations of Y are obtained placing pairs of complex-conjugate poles, with modulus ρ and phase 2πf, in the complex plane representation of the process; the AR coefficients resulting from this setting are a1 = 2ρ cos(2πf) and a2 = −ρ2 (Faes et al., 2015b). Here, we imposed autonomous oscillations for the process Y in the LF and HF bands of the spectrum, setting ρHF = 0.9, fHF = 0.3 Hz, so that the dynamics of Y in the HF band are determined by the fixed coefficients a1 = −0.556, a2 = −− 0.81, and ρLF = b ⋅ 0.8, fLF = 0.1 Hz, so that the strength of the dynamics of Y in the LF band, which are determined by the coefficients a3, a4, depends on the parameter b varying in the range
Furthermore, Nb = 100 bootstrap realizations of the process Y, each of length N = 1000 points, are then generated ∀b by feeding (7) with Nb block bootstrap versions of a single realization of the white noise process U, using the theoretical coefficients ak, k = 1, …, 4. The time domain and spectral LSP measures are then estimated after identifying the AR model fitting the bootstrap time series of Y; the model order was set using the Akaike Information Criterion (AIC). Statistical significance of the spectral LSP measures in a given frequency band is then assessed exploiting the method described in Sect. 2.3.2.
The spectral decompositions of the PSD and the TF of the simulated AR process are reported in Figure 1. Figure 1A shows the theoretical PSD profile (orange continuous line) of the process Y when b = 1, decomposed into its two spectral components, LF (green dashed line) and HF (purple dashed line). Figure 1B shows the theoretical profiles of the TF of the AR process, H(f), at varying the parameter b from 0 (blue) to 1 (red). The TF shows only a positive peak in the HF band in absence of LF dynamics, i.e., when b = 0, and a positive peak in LF with amplitude increasing with the parameter b. This demonstrates that the TF is sensitive to the oscillatory content of the AR process, and it peaks wherever its self-dynamics are located in the frequency domain. Indeed, the two TF contributions in HF (Figure 1C, above) and LF (Figure 1C, below) display frequency-specific peaks with constant or varying amplitude depending on how the corresponding dynamics are modulated.
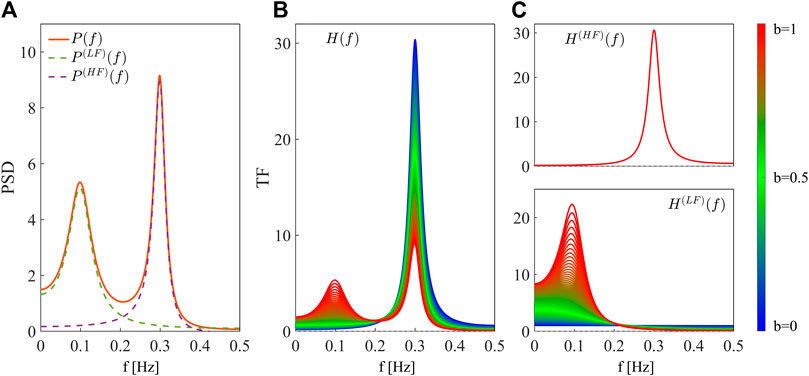
Figure 1. Spectral decomposition of the power spectral density and the transfer function of the simulated AR process. (A) Linear spectral decomposition of the process Y with b = 1. The PSD, P(f) (orange continuous line), is decomposed into components P(LF)(f) (green dashed line) and P(HF)(f) (purple dashed line) with associated frequency fLF, fHF and power
The theoretical spectral profiles of the LSP measures resulting from the simulation are reported in Figure 2. The time domain LSP SY exhibits a non-monotonic behavior at varying this parameter from 0 to 1 (blue to red dots, Figure 2A). Specifically, the increase of the parameter b determines an initial decrease of LSP, followed by a slight increase when b = 1. Thus, high regularity is found whenever the process has only one oscillation, while the presence of two oscillations makes the process less predictable. Only when b approaches 1 (Figure 2B, left, reddish profiles), the emergence of a clear LF oscillation determines a decrease of
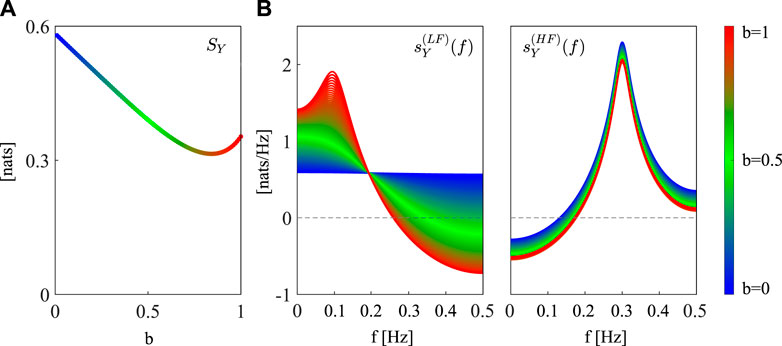
Figure 2. Spectral decomposition of the linear self-predictability of the simulated AR process. (A) Profile of SY at varying the parameter b from 0 (blue dots) to 1 (red dots). (B) Spectral profiles of the frequency-specific terms in Eq. (5) computed for the poles with frequency inside the LF ([0.04 − 0.15]Hz,
To sum up, in the proposed simulated example we showed that the spectral LSP is able to quantify and localize the self-dynamics of Y in the frequency domain, thus reflecting their presence and strength and showing positive peaks at the frequencies where they are located. Its time domain counterpart rather provides an overall description of these dynamics without focusing on specific oscillatory rhythms. Remarkably, the utilization of surrogate and bootstrap data analyses allows to assess the statistical significance of the proposed measures in the time and frequency domain, thus enabling to get more confidence in the significance of the findings and draw meaningful conclusions.
4 Application to arterial compliance short-term variability analysis
4.1 Study protocol, data acquisition and time series extraction
This section reports the application of the described methods on arterial compliance time series taken from a larger database recently collected (Švec et al., 2021). The original study, approved by the ethical committee of the Jessenius Faculty of Medicine, Comenius University, included a total of 81 young and healthy Caucasians, aged 18.56 ± 2.88 years.
Arterial blood pressure (ABP) signal from finger, obtained by the photoplethysmographic volume-clamp method followed by brachial ABP reconstruction (Finometer Pro, FMS Netherlands), and electrocardiogram (ECG, CardioFax ECG-9620, NihonKohden Japan) were recorded during two phases of the experimental protocol: (i) the resting supine position (REST), started 8 min after the beginning of the measurement, and (ii) the upright position reached after passive head-up tilt (TILT), started 3 min after the position change from supine to tilt. Heart period (HP) intervals were extracted as the time distance between consecutive R peaks of the ECG. Hemodynamics parameters including cardiac output (CO) were derived on a beat-to-beat basis exploiting the impedance cardiography (ICG, CardioScreen 2000; Medis, Germany) and exerted a main role in the subsequent determination of the AC time series. The value of AC was quantified through a recently developed method, based on a reliable estimation of the time constant τ, i.e., the rate of the peripheral ABP decay during the diastolic phase, for each heart beat separately, as well as on the exploitation of the relationship between τ, AC and the total peripheral resistance (TPR) based on the two-element Windkessel model (Švec and Javorka, 2021). Since the measurement of hemodynamic parameters using ICG is very sensitive to movement artifacts, skin condition and distribution of fat, in some cases these parameters were then not determined for each heart beat, and then only 39 subjects were selected for further analysis. All the acquired signals were digitized at a sampling rate of 1 kHz. Transient changes in cardiovascular parameters between consecutive phases of the study protocol were excluded from analysis. Then, stationary segments of 300 consecutive beats were extracted from the original recordings in the two phases of the protocol. We refer the reader to (Švec et al., 2021) for further details about data acquisition and time series extraction.
4.2 Data analysis and statistical validation
The time series extracted for each subject in the two experimental conditions were regarded as realizations of the AC discrete-time process (in the following, referred to as C), assumed as uniformly sampled with a sampling frequency equal to the inverse of the mean HP. First, classical time domain markers, i.e., the mean and variance of AC (
To test the statistical significance of the time and frequency domain LSP measures, surrogate and bootstrap data analyses were implemented as described in Sect. 2.3.1 and 2.3.2, respectively.
As regards statistical analysis, the distributions of the computed measures were tested for normality using the Anderson-Darling test. Since the hypothesis of normality was rejected for most of the distributions, and given the small sample size, non-parametric tests were employed. Specifically, the statistical significance of the difference between REST and TILT conditions, as well as between integrated PSD values in LF and HF bands in a given experimental condition, was assessed using the Wilcoxon signed-rank test for paired data. In this work, a significance level α = 0.05 was used to compute confidence intervals of the surrogate and bootstrap distributions as well as to conduct statistical tests.
4.3 Results and discussion
The results of the time domain analysis are reported in Table 1, revealing that both the mean μC and the variance
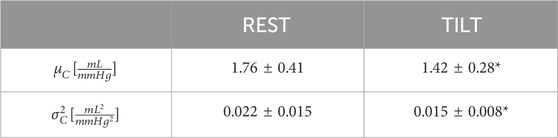
Table 1. Time domain indexes (mean μC and variance
Figure 3 shows the boxplot distributions of the spectral power of AC in the REST (Figure 3A) and TILT (Figure 3B) conditions computed within the LF (
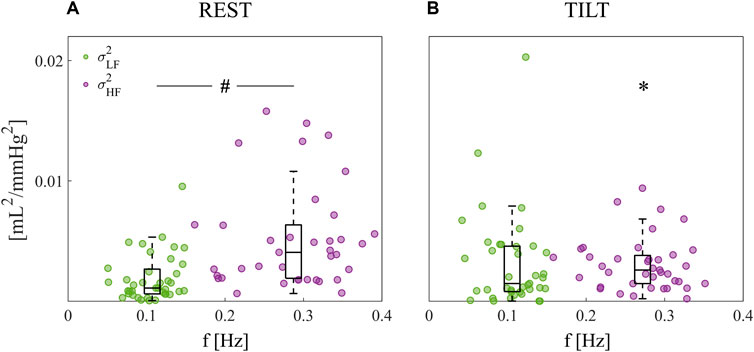
Figure 3. Spectral decomposition of the beat-to-beat arterial compliance time series. Power of AC computed at rest (A) and during tilt (B); powers are depicted as boxplot distributions and individual values with coordinates
In Figure 4, the spectral representation of the LSP is shown in terms of boxplot distributions of the integrated measure over all frequencies (SC, Figure 4A), as well as in the LF (
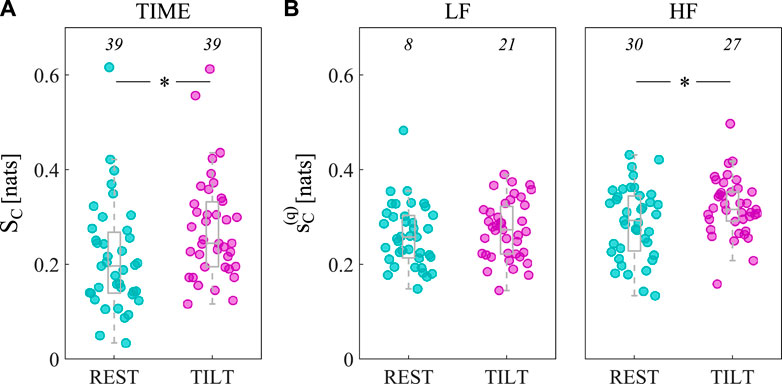
Figure 4. Assessment of arterial compliance self-predictability in the time and frequency domain. Measures of LSP integrated in time (SC, (A), LF (
One of them is related to the mathematical nature of the LSP measure
From a physiological point of view, the degree of complexity of arterial compliance could be a result of the combined effects of external influences modulating its dynamic activity and operating over different temporal scales, such as direct mechanical or neural influences arising from central oscillators (respiratory and vasomotor oscillators), feedback loops (e.g., baroreceptive closed-loop circuit), and complex physiologic mechanisms adjusting TPR, ABP and heart rate.
At first sight, the unaltered regularity of AC in the LF band can be attributed to a hidden tilt-induced sympathetic activation, due to the high degree of co-ordination and synchronicity of several simultaneous control mechanisms regulating AC in both the resting state and tilt conditions (e.g., heart rate, blood pressure and TPR). However, bootstrap data analysis yielded opposite results, since we found that the significance of AC self-predictability in the LF band increased with tilt (from 8/39, i.e., 20.51%, in the supine rest to 21/39, i.e., 53.85%, in tilt), as depicted in Figure 4B (left). This finding is of great importance and confirms the slight activation of sympathetic vasomotor control observed for the power spectral density of compliance (Cooper and Hainsworth, 2001; Nardone et al., 2018; Czippelova et al., 2019), besides possibly reflecting an increased amplitude of LF oscillations in external modulators such as ABP or TPR (Cooke et al., 1999; Elstad et al., 2011). Noteworthy, the augmented number of significant spectral measures in this band can be explained by considering the subject-specific frequency profiles of
The tilt-induced physiologic responses resulting in decreased respiratory rates and increased tidal volumes (Brown et al., 1993; Porta et al., 2000; Javorka et al., 2018), as well as in a slight diminished complexity of the respiration signal (Valente et al., 2017), may be responsible for the increase of regularity of AC in the HF band. Indeed, the increased mechanical influences on arterial vessels due to an augmented tidal volume are likely to produce an augmented coupling between arterial stiffness and respiration, reflected by an increase of AC self-predictability in the HF band. Moreover, an increased HF-related regularity in AC could be attributed also to the effect of increased magnitude of ABP variability in this band (Cooke et al., 1999), probably resulting from the tilt-induced suppression of buffering effect of RSA on ABP variability at the respiratory frequency (Cooke et al., 1999; Elstad et al., 2001). Noteworthy, the latter findings highlight one important limitation of the LSP measure, which is its formulation in absence of a multivariate context taking into account potential oscillatory external drivers of AC variability, such as ABP and respiration. A spectral measure of autonomous dynamics defined as Granger Autonomy has been proposed recently, which is an extension of the LSP to the bivariate case and takes into account potential confounding mechanisms deriving from external sources (Sparacino et al., 2023). It is worth noting that the significance of HF self-predictability decreases from 30/39 (76.92%) in the supine rest to 27/39 (69.23%) during tilt, as depicted in Figure 4B (right). One more time, this result could be interpreted by looking at the spectral profiles of
The application of the proposed approach to arterial compliance data has demonstrated the significance of computing frequency-specific self-predictability measures in the case of physiological variables rich of oscillatory components with different frequencies and shape, suggesting that the overall changes of self-predictability in the time domain may be confined to specific bands of the spectrum. Moreover, investigating the spectral self dynamics of physiological processes may have a great impact in understanding their role in multivariate contexts.
5 Conclusion
In this study, we proposed a novel spectral measure to characterize the self-predictability of linear Gaussian physiologic processes in the frequency domain. The spectral function was defined in such a way to be related to the peaks of the PSD, which here was represented as the sum of different spectral components with specific power and frequency through the well-established method of spectral decomposition (Baselli et al., 1997; Pernice et al., 2021). Yet, in spite of being a simple mathematical tool derived from the TF of the process and reflecting its spectral dynamics, the proposed spectral LSP has a clear meaning in the field of information theory as it is related to the well-known concept of information storage. Moreover, due to the logarithmic transformation of the TF, the effect of outliers is minimized and changes in the auto-dependencies are amplified vertically, thus allowing to differentiate their behavior in practical computations with respect to other non-logarithmic measures (e.g., the variance of the poles of the power spectrum). Noteworthy, being particularly useful for the analysis of dynamic processes which are rich of oscillatory content, the proposed method has the potential to infer physiological mechanisms which can be hidden in time domain due to the mixing with other spectral effects, as well as to more precisely quantify the spectral information content associated to specific oscillations of the process. These capabilities are demonstrated first in a theoretical example of a simulated AR process, and then in the application to short-term beat-to-beat variability of noninvasive estimates of arterial compliance acquired in young healthy subjects in the supine resting position and during head-up tilt (Švec et al., 2021; Švec and Javorka, 2021). The observed shift of oscillatory content of compliance towards low frequencies is associated to an increase of the significance of linear self-predictability in LF, as confirmed by the spectral decomposition of the LSP, and probably due to the tilt-induced augmented sympathetic control and vagal withdrawal.
Remarkably, the proposed framework can be generalized to any physiologic variable exhibiting oscillatory activity, e.g., to cardiovascular, respiratory, cerebrovascular and neural data. We remark indeed the generality of the linear parametric representation of information-based measures such as the LSP, that naturally lends itself to the frequency-specific analysis of oscillatory processes.
The present study has two significant methodological limitations. First, being based on univariate metrics, it does not take into account that linear predictability of the investigated process may change when the system is part of a network of physiological interactions. Hence, the interpretation of SY as a measure of self-predictability may be confounded by the fact that it also includes dynamical influences which stem not only from the investigated target system, but also from other potentially interconnected source systems (Wibral et al., 2014). Therefore, future studies should be focused on the use of bivariate or even multivariate parametric models, analyzed in the time and/or spectral domains, to investigate the role of other systemic variables in the potential generation of the target oscillations. As regards our application to arterial compliance, the influence of putative drivers controlled by autonomic nervous system (blood pressure, heart rate), together with the mechanical effects of intrathoracic pressure changes during respiration and the role of other factors that contribute to compliance beat-to-beat variability (e.g., the time constant τ or TPR), should be investigated to clarify their effects on AC variability. A secondary but still considerable weakness of this study is related to the methodology. Indeed, it is worth noting that the proposed spectral LSP measure could probably be affected by the broadband aperiodic
Data availability statement
The raw data supporting the conclusion of this article will be made available by the authors, without undue reservation.
Ethics statement
The studies involving humans were approved by the Ethics Committee of Jessenius Faculty of Medicine in Martin, Comenius University in Bratislava, Slovak Republic. The studies were conducted in accordance with the local legislation and institutional requirements. Written informed consent for participation in this study was provided by the participants’ legal guardians/next of kin.
Author contributions
LS: Conceptualization, Formal Analysis, Investigation, Methodology, Software, Validation, Visualization, Writing–original draft. YA: Conceptualization, Methodology, Writing–review and editing. CB: Writing–review and editing. DŠ: Data curation, Resources, Writing–review and editing. MJ: Conceptualization, Project administration, Supervision, Writing–review and editing. LF: Conceptualization, Formal Analysis, Methodology, Project administration, Supervision, Writing–review and editing.
Funding
The author(s) declare that financial support was received for the research, authorship, and/or publication of this article. MJ is supported by Grant VEGA 1/0283/21. This work was supported by SiciliAn MicronanOTecH Research And Innovation CEnter “SAMOTHRACE” project (MUR, PNRR-M4C2, ECS\_00000022), spoke 3 - Università degli Studi di Palermo “S2-COMMs - Micro and Nanotechnologies for Smart \& Sustainable Communities”.
Conflict of interest
The authors declare that the research was conducted in the absence of any commercial or financial relationships that could be construed as a potential conflict of interest.
The author(s) declared that they were an editorial board member of Frontiers, at the time of submission. This had no impact on the peer review process and the final decision.
Publisher’s note
All claims expressed in this article are solely those of the authors and do not necessarily represent those of their affiliated organizations, or those of the publisher, the editors and the reviewers. Any product that may be evaluated in this article, or claim that may be made by its manufacturer, is not guaranteed or endorsed by the publisher.
References
Barà, C., Zaccaro, A., Antonacci, Y., Dalla Riva, M., Busacca, A., Ferri, F., et al. (2023). Local and global measures of information storage for the assessment of heartbeat-evoked cortical responses. Biomed. Signal Process. Control 86, 105315. doi:10.1016/j.bspc.2023.105315
Barnett, L., Barrett, A. B., and Seth, A. K. (2009). Granger causality and transfer entropy are equivalent for Gaussian variables. Phys. Rev. Lett. 103, 238701. doi:10.1103/PhysRevLett.103.238701
Baselli, G., Porta, A., Rimoldi, O., Pagani, M., and Cerutti, S. (1997). Spectral decomposition in multichannel recordings based on multivariate parametric identification. IEEE Trans. Biomed. Eng. 44, 1092–1101. doi:10.1109/10.641336
Berntson, G. G., Cacioppo, J. T., Binkley, P. F., Uchino, B. N., Quigley, K. S., and Fieldstone, A. (1994). Autonomic cardiac control. iii. psychological stress and cardiac response in autonomic space as revealed by pharmacological blockades. Psychophysiology 31, 599–608. doi:10.1111/j.1469-8986.1994.tb02352.x
Brown, T. E., Beightol, L. A., Koh, J., and Eckberg, D. L. (1993). Important influence of respiration on human rr interval power spectra is largely ignored. J. Appl. physiology 75, 2310–2317. doi:10.1152/jappl.1993.75.5.2310
Chicharro, D. (2011). On the spectral formulation of granger causality. Biol. Cybern. 105, 331–347. doi:10.1007/s00422-011-0469-z
Cohen, M. A., and Taylor, J. A. (2002). Short-term cardiovascular oscillations in man: measuring and modelling the physiologies. J. physiology 542, 669–683. doi:10.1113/jphysiol.2002.017483
Cooke, W. H., Hoag, J. B., Crossman, A. A., Kuusela, T. A., Tahvanainen, K. U., and Eckberg, D. L. (1999). Human responses to upright tilt: a window on central autonomic integration. J. physiology 517, 617–628. doi:10.1111/j.1469-7793.1999.0617t.x
Cooper, V. L., and Hainsworth, R. (2001). Carotid baroreceptor reflexes in humans during orthostatic stress. Exp. Physiol. 86, 677–681. doi:10.1113/eph8602213
Czippelova, B., Turianikova, Z., Krohova, J., Wiszt, R., Lazarova, Z., Pozorciakova, K., et al. (2019). Arterial stiffness and endothelial function in young obese patients-vascular resistance matters. J. Atheroscler. Thrombosis, 47530. doi:10.5551/jat.47530
Donoghue, T., Haller, M., Peterson, E. J., Varma, P., Sebastian, P., Gao, R., et al. (2020). Parameterizing neural power spectra into periodic and aperiodic components. Nat. Neurosci. 23, 1655–1665. doi:10.1038/s41593-020-00744-x
Elstad, M., Toska, K., Chon, K. H., Raeder, E. A., and Cohen, R. J. (2001). Respiratory sinus arrhythmia: opposite effects on systolic and mean arterial pressure in supine humans. J. physiology 536, 251–259. doi:10.1111/j.1469-7793.2001.t01-1-00251.x
Elstad, M., and Walløe, L. (2015). Heart rate variability and stroke volume variability to detect central hypovolemia during spontaneous breathing and supported ventilation in young, healthy volunteers. Physiol. Meas. 36, 671–681. doi:10.1088/0967-3334/36/4/671
Elstad, M., Walløe, L., Chon, K. H., and Toska, K. (2011). Low-frequency fluctuations in heart rate, cardiac output and mean arterial pressure in humans: what are the physiological relationships? J. Hypertens. 29, 1327–1336. doi:10.1097/HJH.0b013e328347a17a
Erla, S., Faes, L., Tranquillini, E., Orrico, D., and Nollo, G. (2011). k-nearest neighbour local linear prediction of scalp eeg activity during intermittent photic stimulation. Med. Eng. Phys. 33, 504–512. doi:10.1016/j.medengphy.2010.12.003
Faes, L., Kugiumtzis, D., Nollo, G., Jurysta, F., and Marinazzo, D. (2015a). Estimating the decomposition of predictive information in multivariate systems. Phys. Rev. E 91, 032904. doi:10.1103/PhysRevE.91.032904
Faes, L., Porta, A., and Nollo, G. (2015b). Information decomposition in bivariate systems: theory and application to cardiorespiratory dynamics. Entropy 17, 277–303. doi:10.3390/e17010277
Faes, L., Porta, A., Nollo, G., and Javorka, M. (2016). Information decomposition in multivariate systems: definitions, implementation and application to cardiovascular networks. Entropy 19 (5), 5. doi:10.3390/e19010005
Faes, L., Porta, A., Rossato, G., Adami, A., Tonon, D., Corica, A., et al. (2013). Investigating the mechanisms of cardiovascular and cerebrovascular regulation in orthostatic syncope through an information decomposition strategy. Aut. Neurosci. 178, 76–82. doi:10.1016/j.autneu.2013.02.013
Geweke, J. (1982). Measurement of linear dependence and feedback between multiple time series. J. Am. Stat. Assoc. 77, 304–313. doi:10.2307/2287238
Gibbons, C. H. (2019). Basics of autonomic nervous system function. Handb. Clin. neurology 160, 407–418. doi:10.1016/B978-0-444-64032-1.00027-8
Glass, L. (2001). Synchronization and rhythmic processes in physiology. Nature 410, 277–284. doi:10.1038/35065745
Goldberger, A. L., Peng, C.-K., and Lipsitz, L. A. (2002). What is physiologic complexity and how does it change with aging and disease? Neurobiol. aging 23, 23–26. doi:10.1016/s0197-4580(01)00266-4
Hasegawa, M., and Rodbard, S. (1979). Effect of posture on arterial pressures, timing of the arterial sounds and pulse wave velocities in the extremities. Cardiology 64, 122–132. doi:10.1159/000170585
Huijben, A. M., Mattace-Raso, F. U., Deinum, J., Lenders, J., and van den Meiracker, A. H. (2012). Aortic augmentation index and pulse wave velocity in response to head-up tilting: effect of autonomic failure. J. Hypertens. 30, 307–314. doi:10.1097/HJH.0b013e32834f09ee
Javorka, M., El-Hamad, F., Czippelova, B., Turianikova, Z., Krohova, J., Lazarova, Z., et al. (2018). Role of respiration in the cardiovascular response to orthostatic and mental stress. Am. J. Physiology-Regulatory, Integr. Comp. Physiology 314, R761–R769. doi:10.1152/ajpregu.00430.2017
Krohova, J., Faes, L., Czippelova, B., Pernice, R., Turianikova, Z., Wiszt, R., et al. (2020). Vascular resistance arm of the baroreflex: methodology and comparison with the cardiac chronotropic arm. J. Appl. Physiology 128, 1310–1320. doi:10.1152/japplphysiol.00512.2019
Lizier, J. T. (2014). “Measuring the dynamics of information processing on a local scale in time and space,” in Directed information measures in neuroscience (Berlin, Heidelberg: Springer), 161–193.
Lizier, J. T., Prokopenko, M., and Zomaya, A. Y. (2008). Local information transfer as a spatiotemporal filter for complex systems. Phys. Rev. E 77, 026110. doi:10.1103/PhysRevE.77.026110
Lizier, J. T., Prokopenko, M., and Zomaya, A. Y. (2012). Local measures of information storage in complex distributed computation. Inf. Sci. 208, 39–54. doi:10.1016/j.ins.2012.04.016
Lütkepohl, H. (2005). New introduction to multiple time series analysis. Berlin, Heidelberg: Springer Science & Business Media.
Mackenzie, I., Wilkinson, I., and Cockcroft, J. (2002). Assessment of arterial stiffness in clinical practice. Qjm 95, 67–74. doi:10.1093/qjmed/95.2.67
McCorry, L. K. (2007). Physiology of the autonomic nervous system. Am. J. Pharm. Educ. 71, 78. doi:10.5688/aj710478
Nardone, M., Incognito, A. V., and Millar, P. J. (2018). Evidence for pressure-independent sympathetic modulation of central pulse wave velocity. J. Am. Heart Assoc. 7, e007971. doi:10.1161/JAHA.117.007971
Ondicova, K., and Mravec, B. (2010). Multilevel interactions between the sympathetic and parasympathetic nervous systems: a minireview. Endocr. Regul. 44, 69–75. doi:10.4149/endo_2010_02_69
Palus, M. (1997). Detecting phase synchronization in noisy systems. Phys. Lett. A 235, 341–351. doi:10.1016/s0375-9601(97)00635-x
Pernice, R., Sparacino, L., Nollo, G., Stivala, S., Busacca, A., and Faes, L. (2021). Comparison of frequency domain measures based on spectral decomposition for spontaneous baroreflex sensitivity assessment after acute myocardial infarction. Biomed. Signal Process. Control 68, 102680. doi:10.1016/j.bspc.2021.102680
Pincus, S. M. (1994). Greater signal regularity may indicate increased system isolation. Math. Biosci. 122, 161–181. doi:10.1016/0025-5564(94)90056-6
Politis, D. N. (2003). The impact of bootstrap methods on time series analysis. Stat. Sci. 18, 219–230. doi:10.1214/ss/1063994977
Porta, A., Baselli, G., Liberati, D., Montano, N., Cogliati, C., Gnecchi-Ruscone, T., et al. (1998). Measuring regularity by means of a corrected conditional entropy in sympathetic outflow. Biol. Cybern. 78, 71–78. doi:10.1007/s004220050414
Porta, A., Castiglioni, P., Rienzo, M. D., Bari, V., Bassani, T., Marchi, A., et al. (2012). Short-term complexity indexes of heart period and systolic arterial pressure variabilities provide complementary information. J. Appl. Physiology 113, 1810–1820. doi:10.1152/japplphysiol.00755.2012
Porta, A., Gnecchi-Ruscone, T., Tobaldini, E., Guzzetti, S., Furlan, R., and Montano, N. (2007). Progressive decrease of heart period variability entropy-based complexity during graded head-up tilt. J. Appl. physiology 103, 1143–1149. doi:10.1152/japplphysiol.00293.2007
Porta, A., Guzzetti, S., Furlan, R., Gnecchi-Ruscone, T., Montano, N., and Malliani, A. (2006). Complexity and nonlinearity in short-term heart period variability: comparison of methods based on local nonlinear prediction. IEEE Trans. Biomed. Eng. 54, 94–106. doi:10.1109/TBME.2006.883789
Porta, A., Guzzetti, S., Montano, N., Pagani, M., Somers, V., Malliani, A., et al. (2000). Information domain analysis of cardiovascular variability signals: evaluation of regularity, synchronisation and co-ordination. Med. Biol. Eng. Comput. 38, 180–188. doi:10.1007/BF02344774
Richman, J. S., and Moorman, J. R. (2000). Physiological time-series analysis using approximate entropy and sample entropy. Am. J. physiology-heart circulatory physiology 278, H2039–H2049. doi:10.1152/ajpheart.2000.278.6.H2039
Shaffer, F., McCraty, R., and Zerr, C. L. (2014). A healthy heart is not a metronome: an integrative review of the heart’s anatomy and heart rate variability. Front. Psychol. 5, 1040. doi:10.3389/fpsyg.2014.01040
Sparacino, L., Antonacci, Y., Barà, C., Valenti, A., Porta, A., and Faes, L. (2023). A method to assess granger causality, isolation and autonomy in the time and frequency domains: theory and application to cerebrovascular variability. IEEE Trans. Biomed. Eng. doi:10.1109/TBME.2023.3340011
Sugawara, J., Willie, C. K., Miyazawa, T., Komine, H., Ainsle, P. N., and Ogoh, S. (2012). Effects of transient change in carotid arterial stiffness on arterial baroreflex during mild orthostatic stimulation. Artery Res. 6, 130–135. doi:10.1016/j.artres.2012.05.002
Švec, D., Czippelova, B., Krohova, J. C., Mazgutova, N., Wiszt, R., Turianikova, Z., et al. (2021). Short-term arterial compliance changes in the context of systolic blood pressure influence. Physiological Res. 70, S339–S348. doi:10.33549/physiolres.934838
Švec, D., and Javorka, M. (2021). Noninvasive arterial compliance estimation. Physiological Res. 70, S483–S494. doi:10.33549/physiolres.934798
Tan, I., Spronck, B., Kiat, H., Barin, E., Reesink, K. D., Delhaas, T., et al. (2016). Heart rate dependency of large artery stiffness. Hypertension 68, 236–242. doi:10.1161/HYPERTENSIONAHA.116.07462
Theiler, J., Eubank, S., Longtin, A., Galdrikian, B., and Farmer, J. D. (1992). Testing for nonlinearity in time series: the method of surrogate data. Phys. D. Nonlinear Phenom. 58, 77–94. doi:10.1016/0167-2789(92)90102-s
Valente, M., Javorka, M., Porta, A., Bari, V., Krohova, J., Czippelova, B., et al. (2018). Univariate and multivariate conditional entropy measures for the characterization of short-term cardiovascular complexity under physiological stress. Physiol. Meas. 39, 014002. doi:10.1088/1361-6579/aa9a91
Valente, M., Javorka, M., Turianikova, Z., Czippelova, B., Krohova, J., Nollo, G., et al. (2017). “Cardiovascular and respiratory variability during orthostatic and mental stress: a comparison of entropy estimators,” in 2017 39th Annual International Conference of the IEEE Engineering in Medicine and Biology Society (EMBC) (IEEE), Jeju Island, South Korea, July 11-15, 2017, 3481–3484.
Valenza, G., Faes, L., Citi, L., Orini, M., and Barbieri, R. (2017). Instantaneous transfer entropy for the study of cardiovascular and cardiorespiratory nonstationary dynamics. IEEE Trans. Biomed. Eng. 65, 1077–1085. doi:10.1109/TBME.2017.2740259
Wen, H., and Liu, Z. (2016). Separating fractal and oscillatory components in the power spectrum of neurophysiological signal. Brain Topogr. 29, 13–26. doi:10.1007/s10548-015-0448-0
Wibral, M., Lizier, J. T., Vögler, S., Priesemann, V., and Galuske, R. (2014). Local active information storage as a tool to understand distributed neural information processing. Front. neuroinformatics 8 (1), 1. doi:10.3389/fninf.2014.00001
Wiszt, C. B. K. J. M. N. T. Z. L. Z. R., Javorka, M., Cernanova Krohova, J., Mazgutova, N., Turianikova, Z., Lazarova, Z., et al. (2022). Stroke volume variation as an index of fluid responsiveness can be impaired by mental stress. J. Physiology Pharmacol. 73 (2), 277–285. doi:10.26402/jpp.2022.2.11
Keywords: linear autoregressive process, self-predictability, spectral decomposition, information theory, arterial compliance
Citation: Sparacino L, Antonacci Y, Barà C, Švec D, Javorka M and Faes L (2024) A method to assess linear self-predictability of physiologic processes in the frequency domain: application to beat-to-beat variability of arterial compliance. Front. Netw. Physiol. 4:1346424. doi: 10.3389/fnetp.2024.1346424
Received: 29 November 2023; Accepted: 19 March 2024;
Published: 04 April 2024.
Edited by:
Steffen Schulz, Charité University Medicine Berlin, GermanyReviewed by:
Federico Aletti, Universidade Federal de São Paulo, BrazilFrigyes Samuel Racz, The University of Texas at Austin, United States
Giovanna Zimatore, eCampus University, Italy
Copyright © 2024 Sparacino, Antonacci, Barà, Švec, Javorka and Faes. This is an open-access article distributed under the terms of the Creative Commons Attribution License (CC BY). The use, distribution or reproduction in other forums is permitted, provided the original author(s) and the copyright owner(s) are credited and that the original publication in this journal is cited, in accordance with accepted academic practice. No use, distribution or reproduction is permitted which does not comply with these terms.
*Correspondence: Michal Javorka, michal.javorka@uniba.sk