High-pass filtering and dynamic gain regulation enhance vertical bursts transmission along the mossy fiber pathway of cerebellum
- 1 Department of Physiology, University of Pavia, Pavia, Italy
- 2 Consorzio Interuniversitario per le Scienze Fisiche della Materia, Pavia, Italy
- 3 Brain Connectivity Center, Istituto Neurologico IRCCS fondazione C. Mondino, Pavia, Italy
Signal elaboration in the cerebellum mossy fiber input pathway presents controversial aspects, especially concerning gain regulation and the spot-like (rather than beam-like) appearance of granular to molecular layer transmission. By using voltage-sensitive dye imaging in rat cerebellar slices (Mapelli et al., 2010 ), we found that mossy fiber bursts optimally excited the granular layer above ∼50 Hz and the overlaying molecular layer above ∼100 Hz, thus generating a cascade of high-pass filters. NMDA receptors enhanced transmission in the granular, while GABA-A receptors depressed transmission in both the granular and molecular layer. Burst transmission gain was controlled through a dynamic frequency-dependent involvement of these receptors. Moreover, while high-frequency transmission was enhanced along vertical lines connecting the granular to molecular layer, no high-frequency enhancement was observed along the parallel fiber axis in the molecular layer. This was probably due to the stronger effect of Purkinje cell GABA-A receptor-mediated inhibition occurring along the parallel fibers than along the granule cell axon ascending branch. The consequent amplification of burst responses along vertical transmission lines could explain the spot-like activation of Purkinje cells observed following punctuate stimulation in vivo.
Introduction
In the cerebellar cortex, mossy fiber signals are first processed in the granular layer before being conveyed toward the Purkinje cells and other molecular layer interneurons. Theories have predicted that the cerebellar cortex controls transmission gain and behaves as an adaptable filter (Marr, 1969 ; Albus, 1971 ; Fujita, 1982 ; recently considered by D’Angelo and De Zeeuw, 2009 and carefully reviewed by Dean et al., 2010 ), but the existence and functional mechanisms of these operations are still object of debate.
Since brain circuits elaborate spike sequences, understanding signal processing requires a careful analysis of the consequences of specific spike patterns on neuronal responses. The mossy fibers generate spike bursts following punctuate sensory stimulation (Chadderton et al., 2004 ; Jörntell and Eckerot, 2006 ; Rancz et al., 2007 ). Given the presence of numerous synaptic mechanisms with differentiated kinetics, it may be expected that burst transmission along the mossy fiber pathway of cerebellum is sensitive to spike frequency. However, the mechanism proposed to regulate the gain at the mossy fiber – granule cell relay is based on tonic inhibition (Mitchell and Silver, 2003 ; Arenz et al., 2008 ), which may not be sensitive to rapid frequency changes during bursts. A related issue is how granular layer bursts are retransmitted to the molecular layer. Punctuate stimulation causes a prominent vertical activation of Purkinje cells overlaying the active granular layer areas (Bower and Woolstone, 1983 ; Cohen and Yarom, 1998 ; Rokni et al., 2008 ). However, the “beam theory” (Eccles et al., 1967 ) predicted that mossy fiber activity would generate parallel fiber beams, which are indeed observed using parallel fiber stimulation (e.g. see Vranesic et al., 1994 ; Baginskas et al., 2009 ). A possible explanation was that vertical activation could reflect differential synaptic density or strength along the ascending granule cell axon compared to parallel fiber synapses (Sims and Hartell, 2005 , 2006 ), but the demonstration of the functional equivalence of the two inputs has reopened the dispute (Walter et al., 2009 ). Alternatively, differential properties of synaptic inhibition could be critical, as indicated by experimental (Cohen and Yarom, 1998 ) and computational analysis (Santamaria et al., 2007 ).
Here, by using voltage-sensitive dye (VSD) imaging in sagittal and coronal slices (Mapelli et al., 2010 ), we have investigated granular to molecular layer transmission using mossy fiber bursts at different frequencies. We found that optimal responses occurred in the granular layer over ∼50 Hz and in the overlaying Purkinje cells over ∼100 Hz, while Purkinje cell excitation along the parallel fibers was not frequency-dependent. The gain of burst transmission was dynamically regulated by GABA-A and NMDA receptor-dependent mechanisms without requiring tonic inhibition. The efficacy of GABA-A receptor-dependent inhibition with respect to excitation increased passing from the granular to molecular layer and explained the frequency-dependent behaviors in these subcircuits. These results suggest that high-pass filtering and dynamic gain regulation could enhance vertical transmission of high-frequency bursts along the mossy fiber pathway of cerebellum.
Materials and Methods
Experimental Techniques
Acute cerebellar slices were obtained from 18- to 25-day-old Wistar rats as previously reported (D’Angelo et al., 1995 , 1999 ). Briefly, rats were anesthetized with halotane (SIGMA; 0.5 ml in 2 dm3 for 1–2 min) before being killed by decapitation. The cerebellum was gently removed, the vermis was isolated, fixed on a plastic support with cyano-acrilic glue, and immersed in cold (2–3°C) cutting solution. Slices (220-μm thick) were cut either in the sagittal or coronal plane. The cutting solution contained (Dugué et al., 2005 ; in mM): K-Gluconate 130, KCl 15, EGTA 0.2, Hepes 20, Glucose 10 (pH 7.4 with NaOH). Slices were incubated for about 1 h before recordings at 31°C in oxygenated Krebs solution containing (mM): NaCl 120, KCl 2, MgSO4 1.2, NaHCO3 26, KH2PO4 1.2, CaCl2 2, glucose 11 (pH 7.4 when equilibrated with 95% O2–5% CO2). When needed, the extracellular solution was added with the GABA-A receptor blocker, 10 μM gabazine (SR-95531, Tocris Cookson), or the NMDA and AMPA receptor blockers, 50 μM D-APV (Tocris Cookson) and 10 μM NBQX (Tocris Cookson). The dye (Di-4-ANEPPS, Molecular Probes) was dissolved and stocked in Krebs with 50% ethanol (SIGMA) and 5% Cremophor EL (a Castor oil derivative, SIGMA). Slices for optical recordings were incubated for 30 min in oxygenated Krebs solution added with 3% Di-4-ANEPPS stock solution mixed with 50% fetal Bovine Serum (Molecular Probes).
Slices were gently positioned in the recording chamber and immobilized with a nylon mesh attached to a platinum Ω-wire. Perfusion of standard extracellular solution (2–3 ml/min) maintained at 32oC with a feed-back temperature controller (Thermostat HC2, Multi Channel Systems, Reutlingen, Germany) was performed during the recording session. The mossy fibers were stimulated with square voltage pulses (±4–8 V; 100 μs) delivered either individually or in trains (five pulses at 10, 20, 50, 100, 200 or 500 Hz). Voltage pulses were usually applied through couples of MEA electrodes (MEA 60 MultiChannel Systems, see Mapelli and D’Angelo, 2007 for further details) or through a bipolar tungsten electrode connected to a commercial stimulator (STG 1008, Multi channel systems).
VSD Recordings
The recording chamber was installed on an upright epifluorescence microscope (BX51WI, Olympus, Europa Gmbh, Hamburg, Germany), equipped with a 10X (UM Plan FL 0.3 NA) or 40X (XLUM Plan FL, 0.95 NA) objective (see Tominaga et al., 2000 ). The light generated by a halogen lamp (150W, MHF-G150LR, MORITEX Corp., Tokyo, Japan) was controlled by an electronic shutter (model0, Copal, Co., Tokyo, Japan) and then passed through an excitation filter (λ = 530 ± 10 nm), projected onto a dichroic mirror (λ = 565 nm) and reflected toward the objective lens to illuminate the specimen. Fluorescence generated by the tissue was transmitted through an absorption filter (λ > 590 nm) to the CCD camera (MICAM Ultima, Scimedia, Brainvision, Tokyo, Japan). The whole imaging system was connected through an I/O interface (Brainvision) to a PC controlling illumination, stimulation and data acquisition. The final pixel size was 10 μm with 10X and 2.5 μm with 40X objectives. Full-frame image acquisition was performed at 1 kHz. Data were acquired and displayed by Brainvision software and signals were analyzed using routines written in MATLAB (Mathworks, Natick, USA).
At the beginning of recordings, a calibration procedure was adopted to ensure homogeneity across experiments. The dynamic range of the CCD camera was calibrated by measuring background fluorescence and setting the average light intensity in the absence of stimulation to 50% of the saturation level. The background fluorescence was sampled for 50 ms before triggering electrical stimulation and was used to measure the initial fluorescence intensity (F0). The relative fluorescence change (ΔF/F0) was then calculated for each time frame. With standard stimulation intensities (4–8 V; see Mapelli and D’Angelo, 2007 ) the maximum granular layer response measured 0.5–1% ΔF/F0.
A potential draw-back of linear optical methods is that each focal plane contains also out-of-focus light causing blurring. In order to estimate the optical distortion occurring in our preparations, empirical point spread functions (PSF) were generated by collecting light at different depths (in 0.8 μm steps) from fluorescent beads (0.04-μm diameter) injected into the granular and molecular layer in sagittal and coronal cerebellar slices (Yae et al., 1992 ) and processing signals off-line (Image-J). In the granular layer, which is almost isotropic, PSF analysis showed that light signals vanished in ∼10 μm both vertically and horizontally. In the molecular layer, the orientation of parallel fibers generated anisotropic light scattering so that signals vanished in ∼25 μm along the parallel fiber axis and in ∼15 μm on the orthogonal axis (data not shown). This effect was therefore negligible on the scale of our analysis.
The signal-to-noise ratio was improved by averaging 16 consecutive sweeps at the stimulus repetition frequency of 0.2 Hz. Given maximal ΔF/F0 ≈ 1% and noise SEM ≈ ± 0.1% (n = 12 slices), the signal-to-noise (S/N) ratio was about 10 times ensuring a reliable measurement of peak response amplitude.
On the Origin of VSD Signals
The VSD fluorescence depends on the relative surface and density of the electrogenic elements of the granular layer (Eccles et al., 1967 ; Palkovits et al., 1971 ; Palay and Chan-Palay, 1974 ; Ito, 1984 ; Harvey and Napper, 1991 ; Sultan, 2001 ). The granule cell-Golgi cell ratio is 500:1 for cell number and 3:50 for cell surface, so that the estimated total membrane area of granule cells is about 30 times larger than that of Golgi cells. Since the amplitude of optical signal is correlated with the membrane surface, the major contribution to the optical signal in the granular layer should be generated by granule cells. In the molecular layer, stellate cells are sixteen times and basket cells are six times more abundant than Purkinje cells, while on average Purkinje cells are about 85 times larger than stellate and basket interneurons. The estimated total membrane area of Purkinje cells is about four times larger than that of stellate and basket cells. The optical signal in the molecular layer should therefore to arise mainly from Purkinje cells.
EPSPs and EPSP-spike complexes correlated with granule cells and Purkinje cell activity were recorded using patch-clamp recordings. In both cases, VSD imaging detected more effectively EPSPs than spikes. This was probably due to a series of factors, including the limited sampling frequency (1 kHz) and the time scattering of spikes in different acquisitions. Given the di-synaptic activation of Purkinje cells by mossy fiber stimulation, time scattering was probably even more influential than in granule cells (cf. Figure 2B Mapelli et al., 2010 ). It should also be noted that, while VSD responses from the somatic and dendritic areas of Purkinje cells were quite similar at low stimulus intensity, the somatic became ∼30% larger than the dendritic response at high intensity (see Figure 2 B). This probably reflected the fact that PC spikes, which do not back-propagate significantly, do not even contribute much to dendritic depolarization.
It should be noted that the VSD signal was collected from numerous granule cells, was averaged over several acquisitions and was sampled at 1 frame/ms. Therefore, although sensitive to the presence of spikes (Mapelli et al., 2010 ), the VSD signal could not reveal the precise shape of the action potential. The VSD signal was modulated by the contribution of the excitatory glutamate NMDA and AMPA receptors and by the inhibitory GABAA receptor (see Figure 3 A for details), revealing its sensitivity to subthreshold integration of synaptic inputs.
Patch-Clamp Recordings
Whole-cell patch-clamp recordings were performed from Purkinje cells using pipettes containing the following intracellular solution (mM); K-gluconate 135, KCl 5, Hepes 10, EGTA 0.2, MGCl2 4.6, ATP-Na2 4, GTP-Na 0.4 (pH 7.35). With this solution, the pipette resistance was 3–4 MΩ. Signals were sampled at 20 kHz and low-pass filtered at 2 kHz. Recordings were obtained by using a Multiclamp 700B amplifier (Molecular Devices) and signals were digitally converted with a Digidata 1440A (Molecular Devices). All Purkinje cells showed spontaneous firing in cell attached (13.1 ± 4.9 Hz, n = 4) as well as after passing into the whole-cell recording configuration in current clamp mode (14.8 ± 3.0 Hz, n = 4). The stimulation of the white matter in the granular layer generated EPSP, IPSPs as well as simple and complex spikes depending on the stimulation intensity and on the position of the stimulating electrode (data not shown). Data used for correlating intracellular membrane depolarization with the VSD signal were taken after moving the cell out of the spontaneous firing region (−39.6 ± 1.4 mV, n = 4) by negative current injection (≤−200 pA).
Data Analysis
A quantitative analysis of the VSD signal was performed in regions of interest (ROIs), which showed a clear response in the granular layer and molecular layer. In each ROI, the peak intensity of signals was normalized to the response to a single control pulse taken at the beginning of the recordings session in the granular layer. The ROIs usually had a size of 20 × 20 μm2 (2 × 2 pixels), thus ideally collecting the fluorescence variations generated by a layer containing ∼15 granule cells or one Purkinje cell. Because of light scattering (see above), these numbers represent a lower limit.
For coronal slice recordings, an automatic procedure was written in MATLAB allowing to identify two separate stripes (80-μm large) of activation running in parallel through the granular and the molecular layer. All responses were normalized to the maximum granular layer response. Data obtained from different slices were averaged by aligning the corresponding stripes with their origin located in correspondence of the orthogonal projection of the electrode tip into the molecular layer.
In order to quantify the size of activated areas, a threshold was set at 70% of the maximum normalized response (see Mapelli et al., 2010 ). An automatic analysis allowed to isolate active pixels so that the extension of activated areas could be compared in different experimental conditions. The EPSP delay was detected at a threshold set at 0.2% ΔF/F0 (given noise SEM ≈ ± 0.1%).
Gain curves g(f) were fitted with a sigmoidal-shaped function of input frequency (f) of the form:

where A1 and A2 are the initial and final amplitude, fc is the cut-off frequency and p is the order of the function (ORIGIN, Microcal Software Inc.).
Statistics are reported as mean ± standard error of the mean (SEM).
Results
VSD Responses of the Granular and Molecular Layer following White Matter Stimulation
In sagittal slices of the cerebellar vermis, stimulation of the white matter generated VSD signals involving the mossy fiber – granule cell – PC pathway and the climbing fiber – PC pathway (Figure 1 ). Activation in the two pathways could be distinguished considering three properties (Eccles et al., 1967 ; Llinas and Sugymori, 1980a ,b ; Ito, 1984 ): (i) the latency of PC responses should be longer for the mossy fiber pathway, which is di-synaptic, (ii) the PC responses should follow granular layer responses with mossy fiber but not with climbing fiber stimulation, and (iii) the time course of PC responses should be EPSP-like for mossy fiber stimulation, while resembling a complex spike with climbing fiber stimulation.
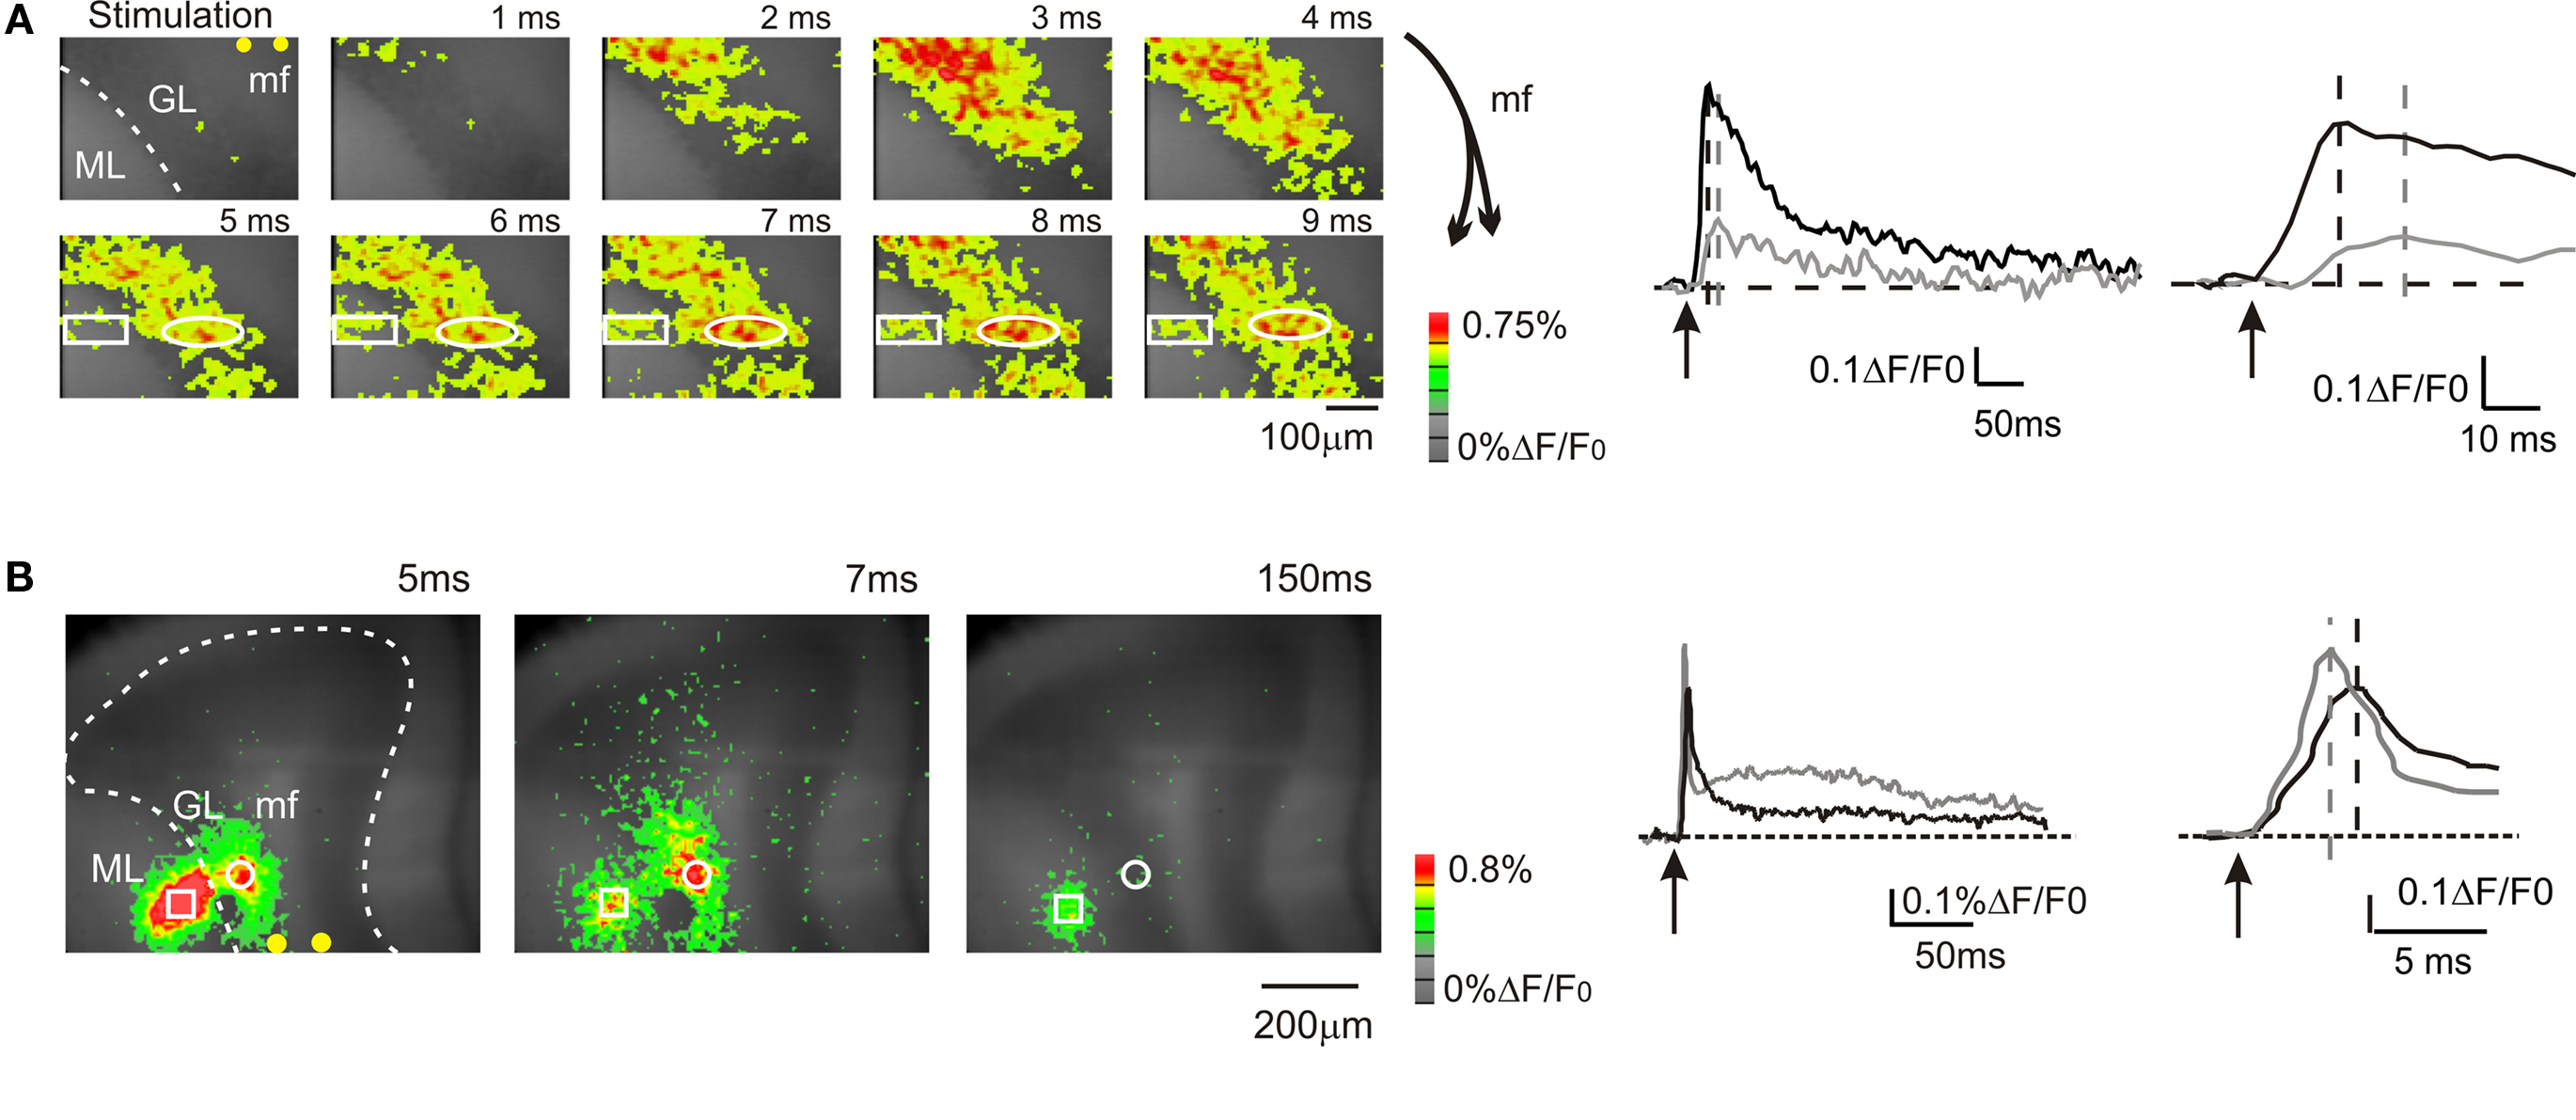
Figure 1. Mossy fiber and climbing fiber responses to white matter stimulation. VSD imaging in parasagittal slices of the cerebellar vermis. In this and in the following figures: mf, mossy fiber; GL, granular layer; PC, Purkinje cell layer, ML, molecular layer, pf, parallel fiber. In this and the following figures, yellow dots indicate stimulation electrodes. (A) Optical maps of responses evoked by a single stimulus delivered to the white matter (arrowhead), illustrating the sequence of granular to molecular layer activation through the mossy fibers. Maps show the temporal evolution of granular and molecular layer activation with a time resolution of 1 ms. In the granular layer, the optical signal rapidly propagates from the stimulation site with short delay (2–3 ms) and peaks in 5–6 ms. The activity propagates in a restricted region of the molecular layer (rectangle) with a further delay of 3 ms compared to the corresponding granular layer activation (circle). The traces illustrate the time course of granular layer (black trace) and molecular layer (grey trace) activation following white matter stimulation in the same ROIs indicated on the left. Molecular layer activation is slower and smaller than granular layer activation (magnified in the inset). The schematics on the right illustrate the orientation of mossy fibers branching. (B) Optical maps of responses evoked by a single stimulus delivered to the white matter, illustrating direct Purkinje cell activation through the climbing fibers. An intense molecular layer response peaks in 3–5 ms anticipating a slower granular layer response peaking in 7–8 ms. The traces illustrate the time course of granular layer (black trace) and molecular layer (grey trace) activation following white matter stimulation in the same ROIs indicated on the left. Molecular layer activation is faster and larger than granular layer activation (magnified in the inset). The response time relative to stimulation is are indicated for each map.
In the majority of recordings (17 of 23 slices, 74%), mossy fiber were activated exciting the granular layer and causing a depolarization peaking in 5.2 ± 0.2 ms (n = 17 slices; Figure 1 A). Then, in some of these recordings activation propagated into the adjacent molecular layer causing a depolarization peaking in 12.4 ± 1.7 ms (n = 5; Figure 1 A). The additional delay was probably determined by the time required for synaptic transmission at the mossy fiber – granule cell and parallel fiber – Purkinje cell synapses and by the time needed for the Purkinje cells to respond (activation of granule cells ascending axons and transmission along the parallel fibers were probably negligible; Diwakar et al., 2009 ). In a minor number of recordings (6 of 23 slices; 26%), climbing fibers were also activated causing a fast molecular layer response peaking in 2.9 ± 0.2 ms (Figure 1 B; n = 6 slices), which thus anticipated the granular layer response. The molecular layer response was composed of a peak followed by a repolarization and by a long lasting depolarizing hump (lasting more than 100 ms; Figure 1 B), which were presumably related to generation of complex spikes in the Purkinje cells. The continuation of the present paper considers only results obtained by analyzing molecular layer signals generated through mossy fibers activation.
Combined VSD and Patch-Clamp Recordings From Purkinje Cells
It has been shown that VSD signals generated in the granular layer are correlated to the average depolarization of granule cells (see Figure 2 Mapelli et al., 2010 ). In order to assess the activity state of neurons contributing to generate the molecular layer VSD signals, whole-cell recordings were performed from Purkinje cells. These are the largest neurons of the molecular layer and extend their dendritic arborization in the sagittal plane. WCR were performed from Purkinje cells generating simple spikes (but not complex spikes; cf. Sacconi et al., 2008 ; Rokni et al., 2009 ) in response to white matter stimulation in the granular layer. In these neurons, EPSPs arose in 7.1 ± 0.2 ms and peaked in 12.1 ± 0.3 ms (n = 4), compatible with a di-synaptic pathway. When the cells were depolarized above about −50 mV, the EPSPs were usually followed by a hyperpolarization probably reflecting intrinsic repolarizing currents and IPSPs caused by molecular layer interneurons (not shown in the figure).
The intracellular electrical activity was compared with VSD responses taken from ROIs corresponding to the soma and to the dendritic tree of recorded Purkinje cells (Figure 2 A). In response to a single impulse, Purkinje cells showed EPSPs and EPSP-spike complexes in variable proportions depending on the stimulation intensity (Llinas and Sugymori, 1980a ,b ). At low intensity, both somatic and dendritic VSD signals were a close scaled version of the EPSPs recorded intracellularly (Figure 2 B). At higher intensity, the VSD response increased along with the number of EPSP-spike complexes but remained slower and proportionately smaller than the average electrical response. Thus both in the somatic and dendritic region, the VSD signal reflected the intracellular electrical activity of Purkinje cells.
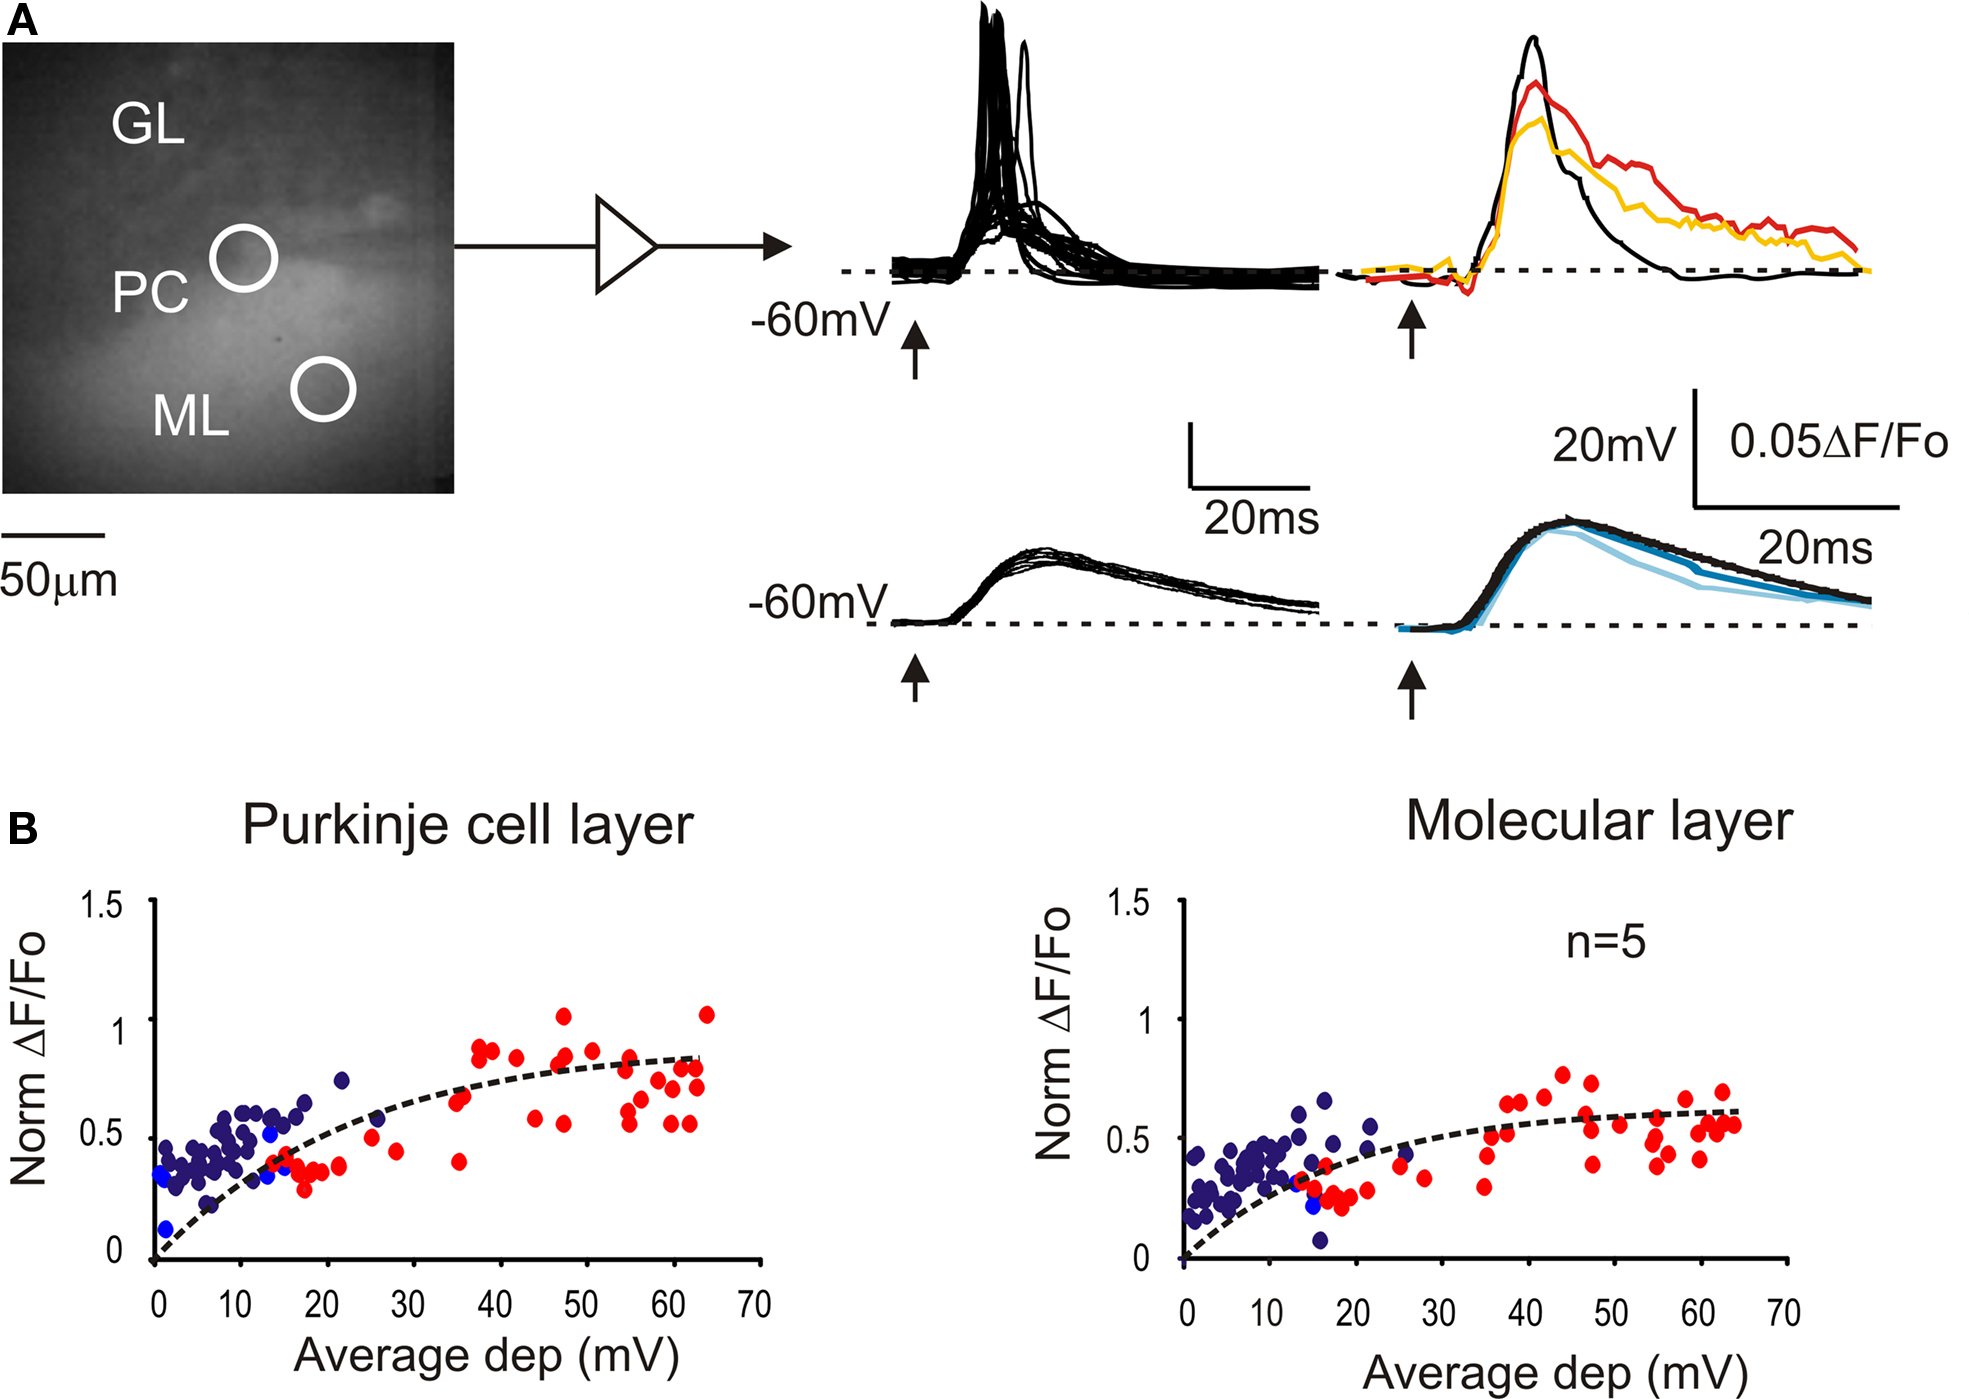
Figure 2. The relationship between VSD signals and Purkinje cell activity. (A) Image of a stained cerebellar slice obtained by collecting background epifluorescence showing Granular layer, Purkinje cell layer and Molecular layer during a whole-cell recording from a Purkinje cell. The patch pipette appears as a shadow (since is not filled with dye molecules). Red and orange circles indicate the ROIs corresponding to the recorded PC and its dendritic arborization, from which the VSD signals were measured. Excitatory postsynaptic potential (EPSPs) and EPSP-spike complexes were obtained at low and high stimulation intensity, respectively (arrows indicate the stimulus time). Average electrical signals (black traces) are compared with average fluorescence changes from the PC layer (red and dark blue) and from molecular layer (orange and light blue). (B) Correlation between average membrane depolarization and average fluorescence change from ROIs in the Purkinje cell layer and in the molecular layer. The intensity of fluorescence changes is normalized to the corresponding granular layer response. The dotted lines correspond to fittings performed with an exponential function, y = y0 + A1[1-exp(−x/τ)] (y0 = 0, A1 = 0.9, τ = 22.6 for Purkinje cell layer; y0 = 0, A1 = 0.6, τ = 18.7 for molecular layer). Red and orange circles indicate Purkinje cells responding with spikes to at least half of the stimuli. Data points are taken from five different cells.
Pharmacological Properties of the Inhibitory and Excitatory Circuits
Granular layer responses are regulated by the inhibitory circuit (Mapelli and D’Angelo, 2007 ; Mapelli et al., 2009 ). VSD signals were increased by 10-μM gabazine, which could act both by blocking GABAergic synapses between Golgi cells and granule cells as well as those between molecular layer interneurons and their targets, the Golgi cells and the Purkinje cells. During gabazine application, in the granular layer, both peak amplitude and the late phase of the response increased (at peak, +51.9 ± 11.6%; n = 4, p < 10−5, paired t-test; at 50 ms, +110.4 ± 28.8%, n = 4; p < 0.01, paired t-test). Also in the molecular layer the VSD signal was enhanced by the application of 10-μM gabazine (at peak, +40.9 ± 12.2%; n = 4, p < 0.05, paired t-test; at 50 ms, + 243.8 ± 53.2%; n = 4, p < 10−4, paired t-test) (Figure 3 A). Furthermore, blocking the GABAergic synapses increased the extension of the granular (+157.8 ± 35.7%; n = 4, p < 0.03, paired t-test) and molecular layer responses (+187.5 ± 40.6%; n = 4, p < 0.05, paired t-test).
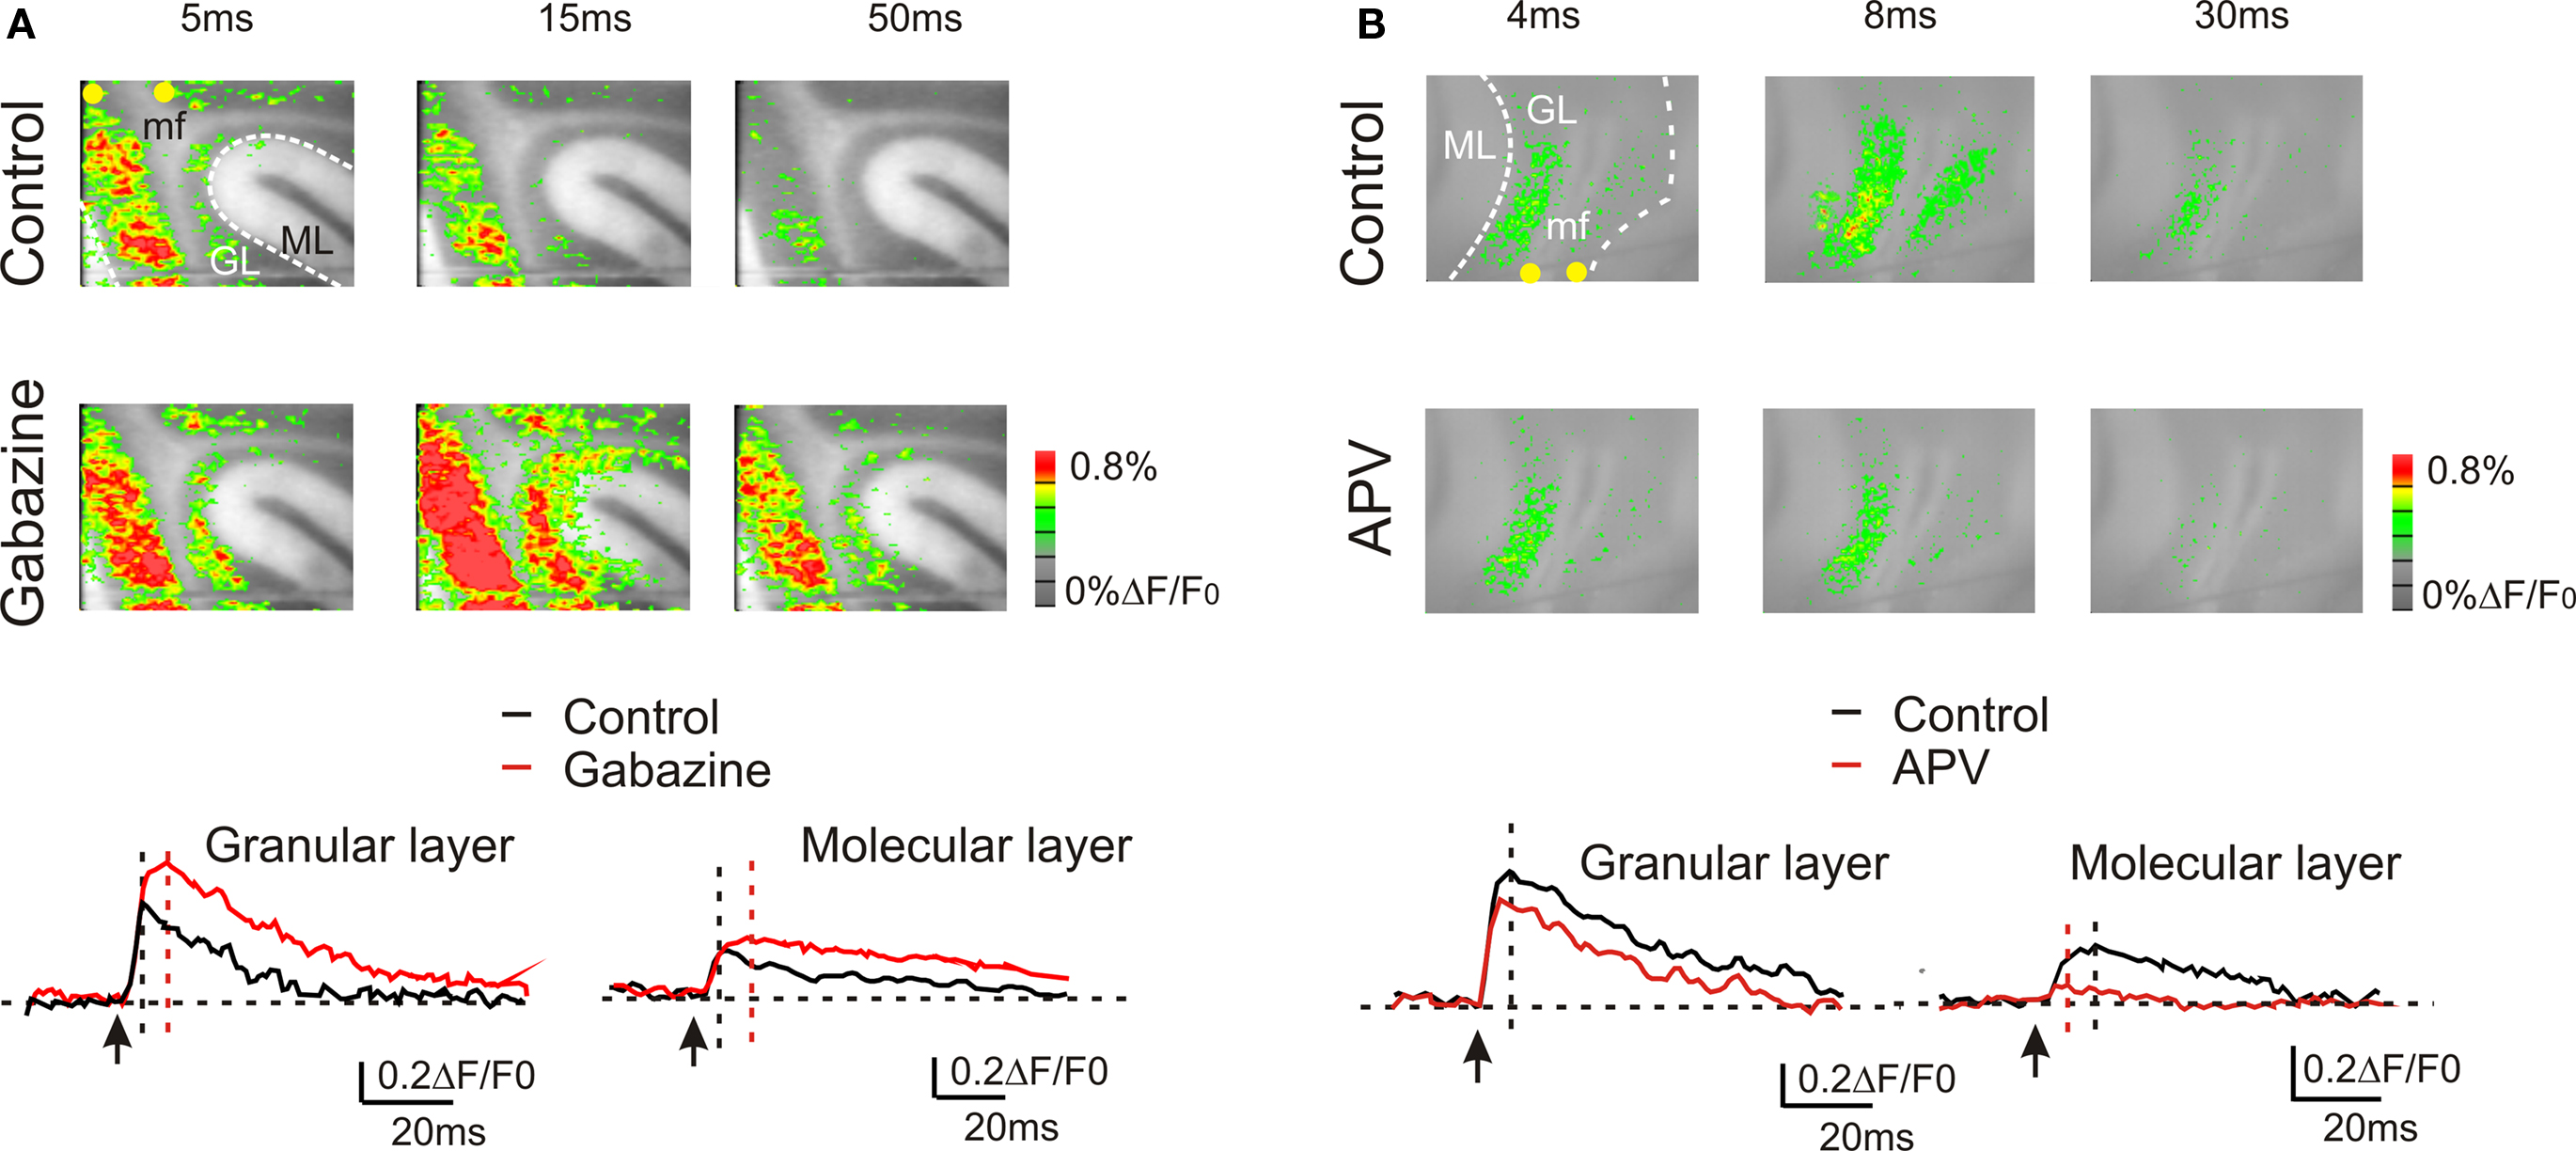
Figure 3. GABA-A and NMDA receptor-dependent regulation of transmission along the mossy fiber pathway. (A) The effect of the GABA-A receptor blocker 10-μM gabazine in response to a single pulse in the white matter. Gabazine enhanced the granular layer response and facilitated transmission toward the molecular layer. The traces show the time course of the effect both in the granular and molecular layer. (B) The effect of the NMDA receptor blocker 50-μM APV in response to a single pulse in the white matter. APV reduced the granular layer response and markedly depressed transmission toward the molecular layer. The traces show the time course of the effect both in the granular and molecular layer.
The other major synaptic mechanism regulating granular layer excitation and transmission toward the molecular layer is based on the NMDA receptors (Kinney and Slater, 1993 ; D’Angelo et al., 1995 ), which are primarily expressed at the mossy fiber – granule cell synapse (Garthwaite and Brodbelt, 1989 ; Cull-Candy et al., 1998 ). The block of NMDA currents decreased peak response amplitude in the granular layer (−28.8 ± 12%; n = 4, p = < 0.01, paired t-test) as well the late phase of the response (at 50 ms −59.7 ± 10.7%; n = 4, p < 0.005, paired t-test). Furthermore, blocking NMDA receptors reduced the extension of the granular layer (−34.1 ± 7.3%; n = 4, p < 0.05, paired t-test) and of the molecular layer response (−53.3 ± 7.5%; n = 4, p < 10−3, paired t-test). Finally, blocking the NMDA receptors almost completely blocked the transmission toward the molecular layer (−85.3 ± 4.8%; n = 4, p < 10−11, paired t-test) (Figure 3 B).
These experiments show that the VSD signal was sensitive to the major regulatory systems of the cerebellar circuit potentially able to control signal transmission along the mossy fiber pathway.
Frequency-Dependence of Granular Layer – Molecular Layer Transmission
Mossy fibers usually convey bursts of frequency-modulated discharges to the granular layer (Kase et al., 1980 ; Chadderton et al., 2004 ; Jörntell and Ekerot, 2006 ; Rancz et al., 2007 ; Arenz et al., 2008 ). To address the impact of these patterns we have investigated granular layer activation in response to trains of stimuli delivered to the mossy fiber bundle at different frequencies.
The stimulation of the mossy fiber bundle with a train of five impulses at different frequencies induced characteristic activation patterns in the granular layer (Figure 4 ). The stimulation at 10 Hz induced similar responses at each pulse. However, increasing the stimulation frequency revealed a considerable temporal summation. As a whole, granular layer responses became more extended (e.g. +6.9 ± 4.3% at 10 Hz vs +127.3 ± 20.8% at 500 Hz) and intense as the input train frequency was increased (Figures 4 A,B). In the granular layer, temporal summation became remarkable over 50 Hz, while in the molecular layer the frequency sensitivity was shifted, so that only inputs at frequencies higher than 100 Hz could be reliably transmitted (Figure 4 C). At the highest frequencies (200–500 Hz), no further improvement in maximal transmission was observed but the maximal response occurred earlier during the train (e.g. on the 4th pulse at 100 Hz and on the 3rd pulse at 500 Hz). Finally, it should be noted that a post-burst response (measured 50 ms after the train) became also more evident as the frequency was increased.
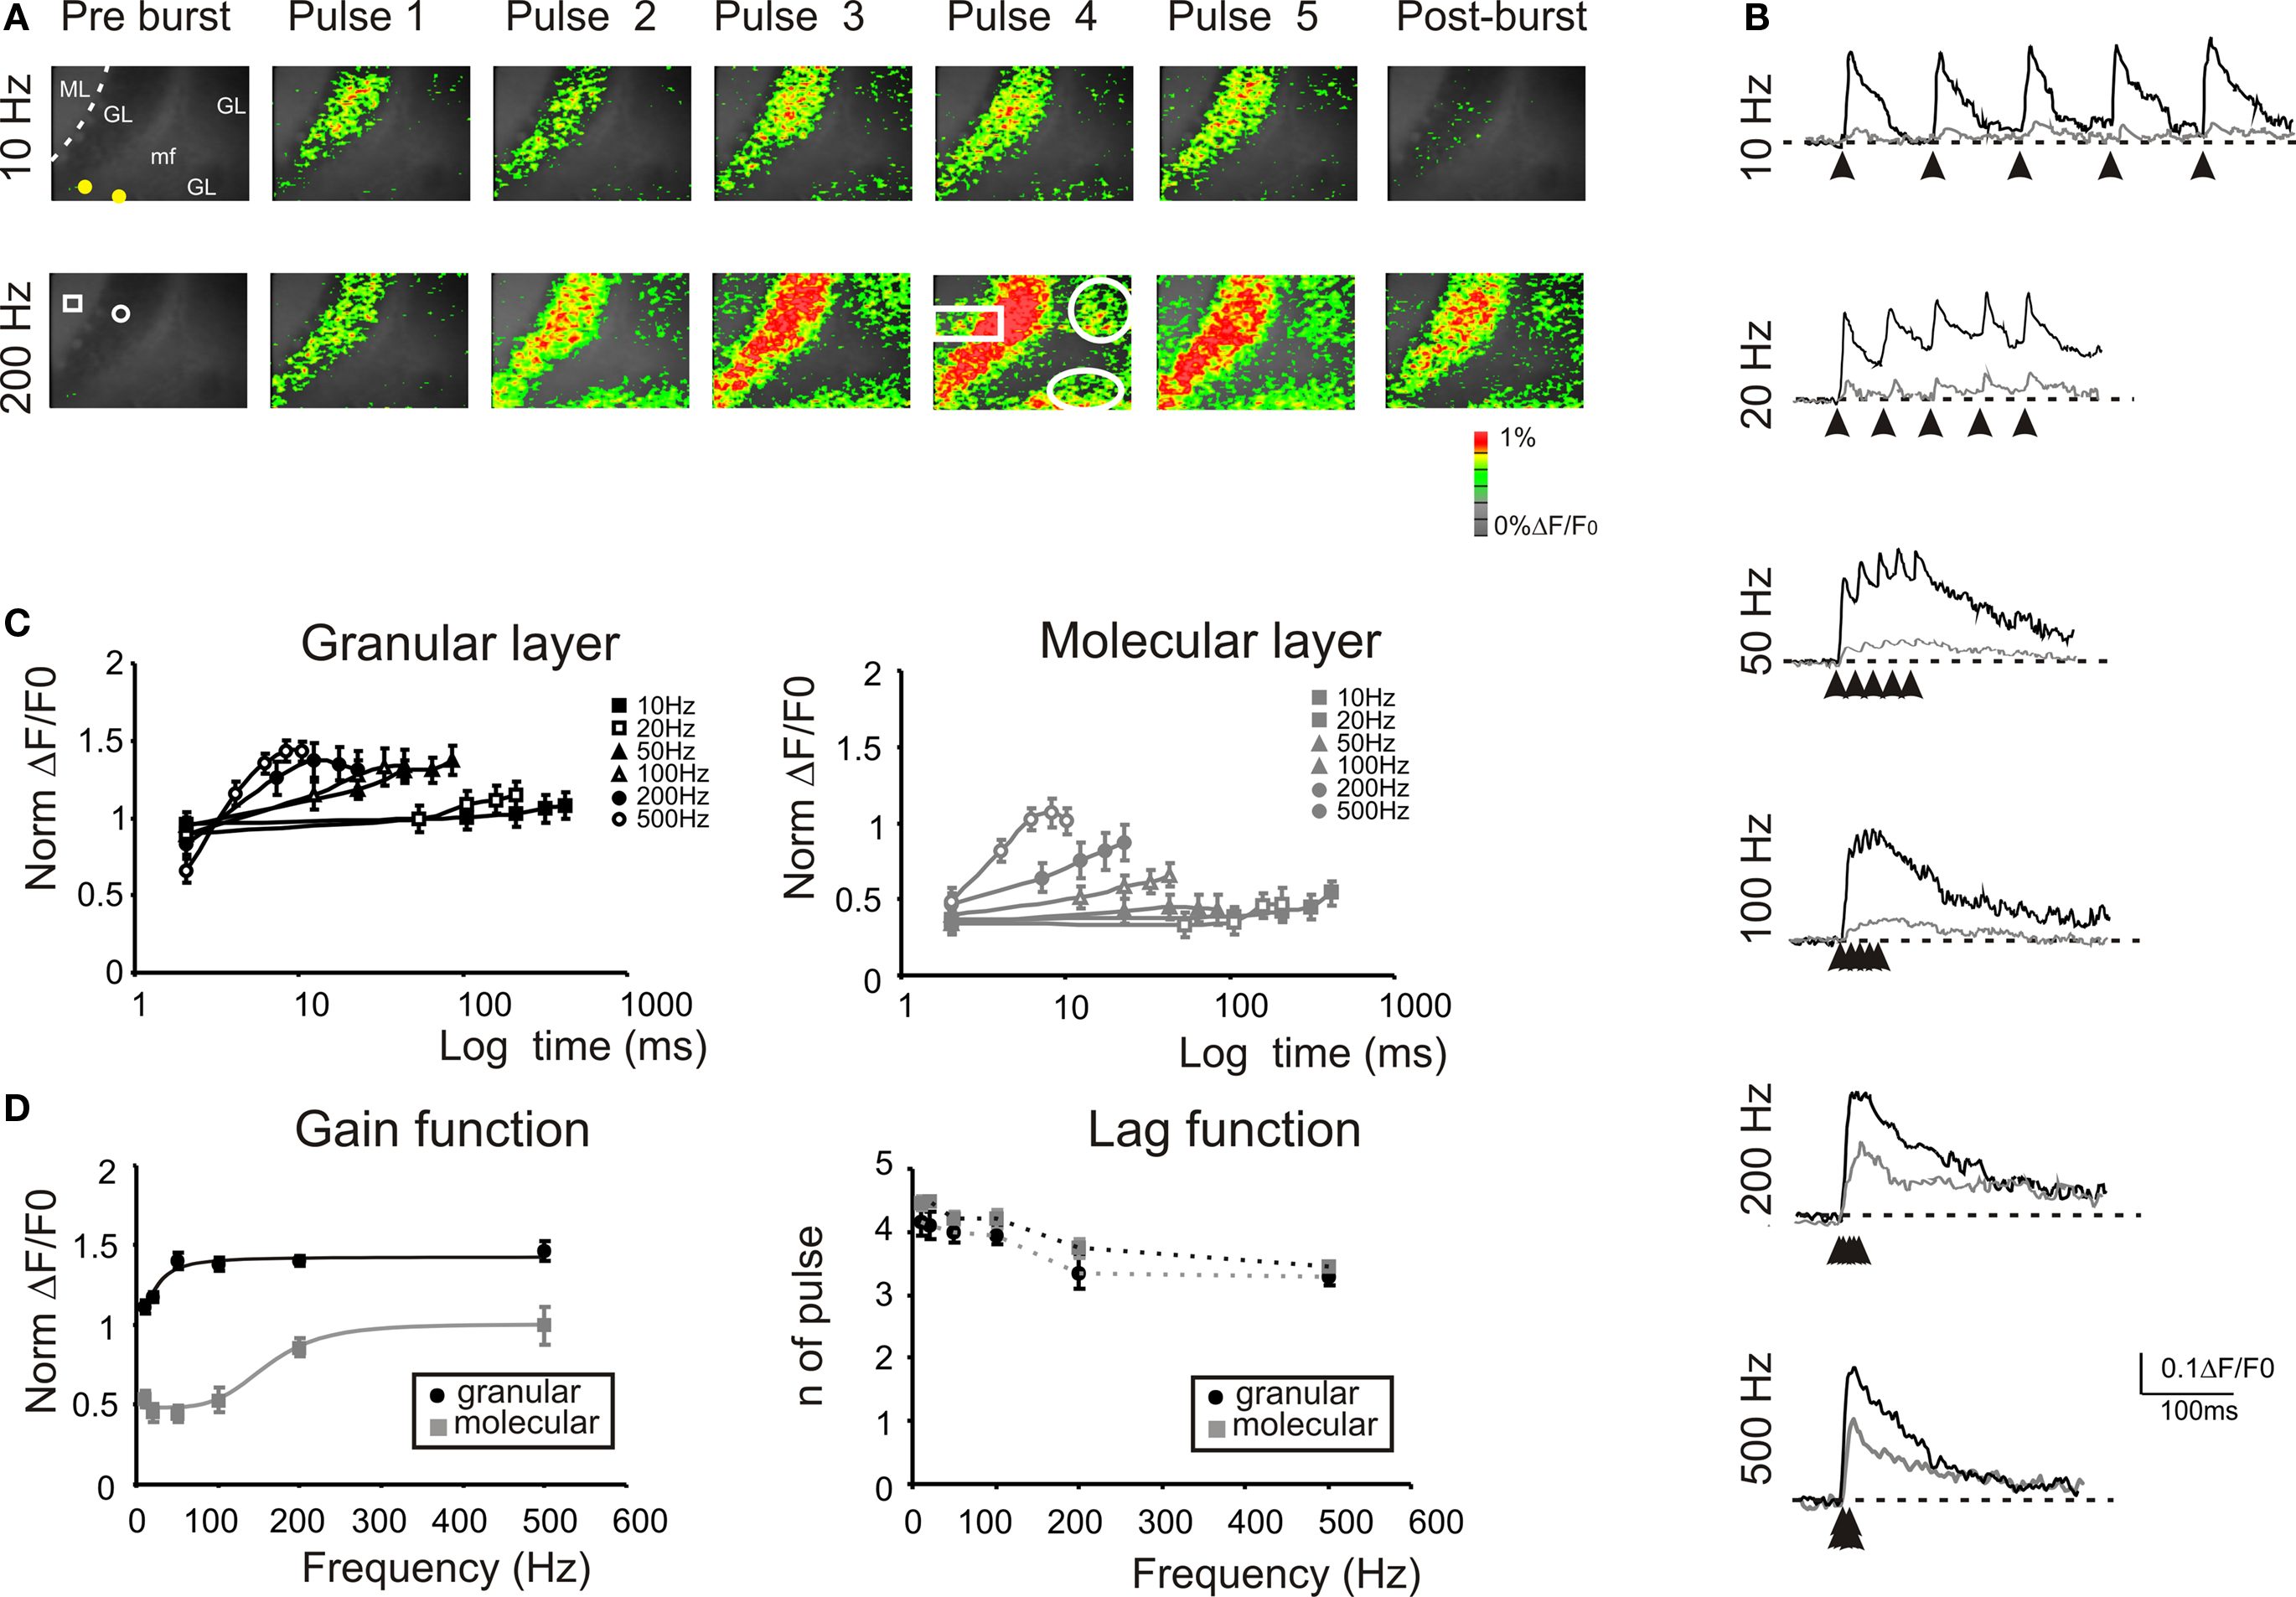
Figure 4. Frequency-dependence of responses to repetitive stimulation. (A) Optical maps were obtained at the peak of responses in 5-pulse bursts delivered to the white matter for two significant frequencies (10 and 200 Hz). Passing from 10 Hz to 200 Hz, there is a progressive intensification of temporal summation in the granular layer which lead to a progressive activation of new recruited areas (white circles). Moreover, the increased stimulation frequency progressively activated the molecular layer (white rectangle) at each pulse of the burst. The post-burst maps were taken 50 ms after the end of the burst where with low-frequency stimulation the activity is almost abolished while, with high frequency there is a persistent signals throughout the granular layer. (B) Traces on the right illustrate the time course of the response in ROIs located in adjacent responding regions of the granular (black) and molecular layer (gray). Note the much stronger molecular layer response at higher frequencies and the consistent temporal summation of all signals. (C) Maximum response amplitudes were measured for each of the five pulses of bursts delivered at different frequencies in the granular (black; n = 8 slices, n = 32 ROIs for each frequency) and in the molecular layer (gray; n = 8 slices, n = 28 ROIs for each frequency). Points are reported as mean ± SEM. (D) Gain and lag curves for granular (black; n = 8 slices, n = 32 ROIs for each frequency) and molecular layer (gray; n = 8 slices, n = 28 ROIs for each frequency) responses. Gain is the maximum response obtained at a certain frequency and lag is the number of pulses needed to achieve the maximal response. The gain curves were fitted a sigmoidal function (Eq.1). Points are reported as mean ± SEM.
The frequency-dependence of transmission from mossy fiber to granular and to molecular layer was represented as the change in maximal response amplitude (gain) and delay (lag) compared to low-frequency stimulation (Figure 4 D). The gain curves showed a sigmoidal increase while the lag showed a decrease with frequency (Figure 4 D), reflecting enhanced temporal summation and instantiating two high-pass filters. As expected, granular layer excitation occurred with shorter delay and at lower frequencies than molecular layer excitation, so that the two filters appeared to work in cascade. The gain curves were fitted with a sigmoidal-shaped function relative to low-frequency responses (Eq. 1) yielding the following values of cut-off frequency (fc), initial amplitude (A1) and final amplitude (A2): in the granular layer, best fitting required a 2nd order function with fc = 20.9 Hz, A1 = 1.11, A2 = 1.46, and (A2−A1)/A1 = 31.5%; in the molecular layer, best fitting required a 5th order function with fc = 170 Hz, initial amplitude A1 = 0.44, final amplitude A2 = 0.99, and (A2−A1)/A1 = +125%. Thus, the gain function of the molecular layer was right-shifted compared to that of the granular layer. These data suggest that the information conveyed through the mossy fibers is optimally transmitted with high-frequency bursts while low-frequency bursts may not pass the threshold for effective molecular and Purkinje cell activation.
Regulation of Granular and Molecular Layer Filtering by GABA-A and NMDA Receptors
The frequency-dependence of granular – molecular layer transmission has to reside into the specific properties of their receptors, channels and circuits. Among these, two systems have the potential of regulating transmission in a frequency-dependent manner, the GABAergic inhibitory system and the excitatory mechanism involving NMDA receptors.
The application of 10-μM gabazine had major effects on granular – molecular layer communication during repetitive neurotransmission (Figure 5 A). The extension of activated areas increased at all frequencies: for instance, with a 500-Hz train, the increase was +182.6 ± 30.9% (n = 4, p < 0.006, paired t-test) in the granular layer and +216.5 ± 57.8% (n = 4, p < 0.004, paired t-test) in the molecular layer. Moreover, temporal summation, gain and lag varied compared to control conditions. (i) Temporal summation did not saturate even at the highest tested frequencies either in the granular or in the molecular layer (Figure 5 B), revealing the absence of feed-forward and feed-back inhibition (D’Angelo and De Zeeuw, 2009 ). Likewise, the post-burst response was markedly enhanced. (ii) The frequency-dependence of the gain function in the molecular layer became similar to that in the granular layer (Figure 5 B). In the granular layer, best fitting required 2nd order with fc = 32.0 Hz, A1 = 1.3, A2 = 2.2, and (A2−A1)/A1 = + 69.2%; in the molecular layer, best fitting required 2nd order with fc = 23.9 Hz, initial amplitude A1 = 0.56, final amplitude A2 = 1.29, and (A2−A1)/A1 = + 130.3%. (iii) After blocking synaptic inhibition, the lag to maximal response was between the 4th and 5th pulse at all frequencies both in the granular and in the molecular layer remaining higher that in control and indicating a continued temporal summation no longer limited by inhibition.
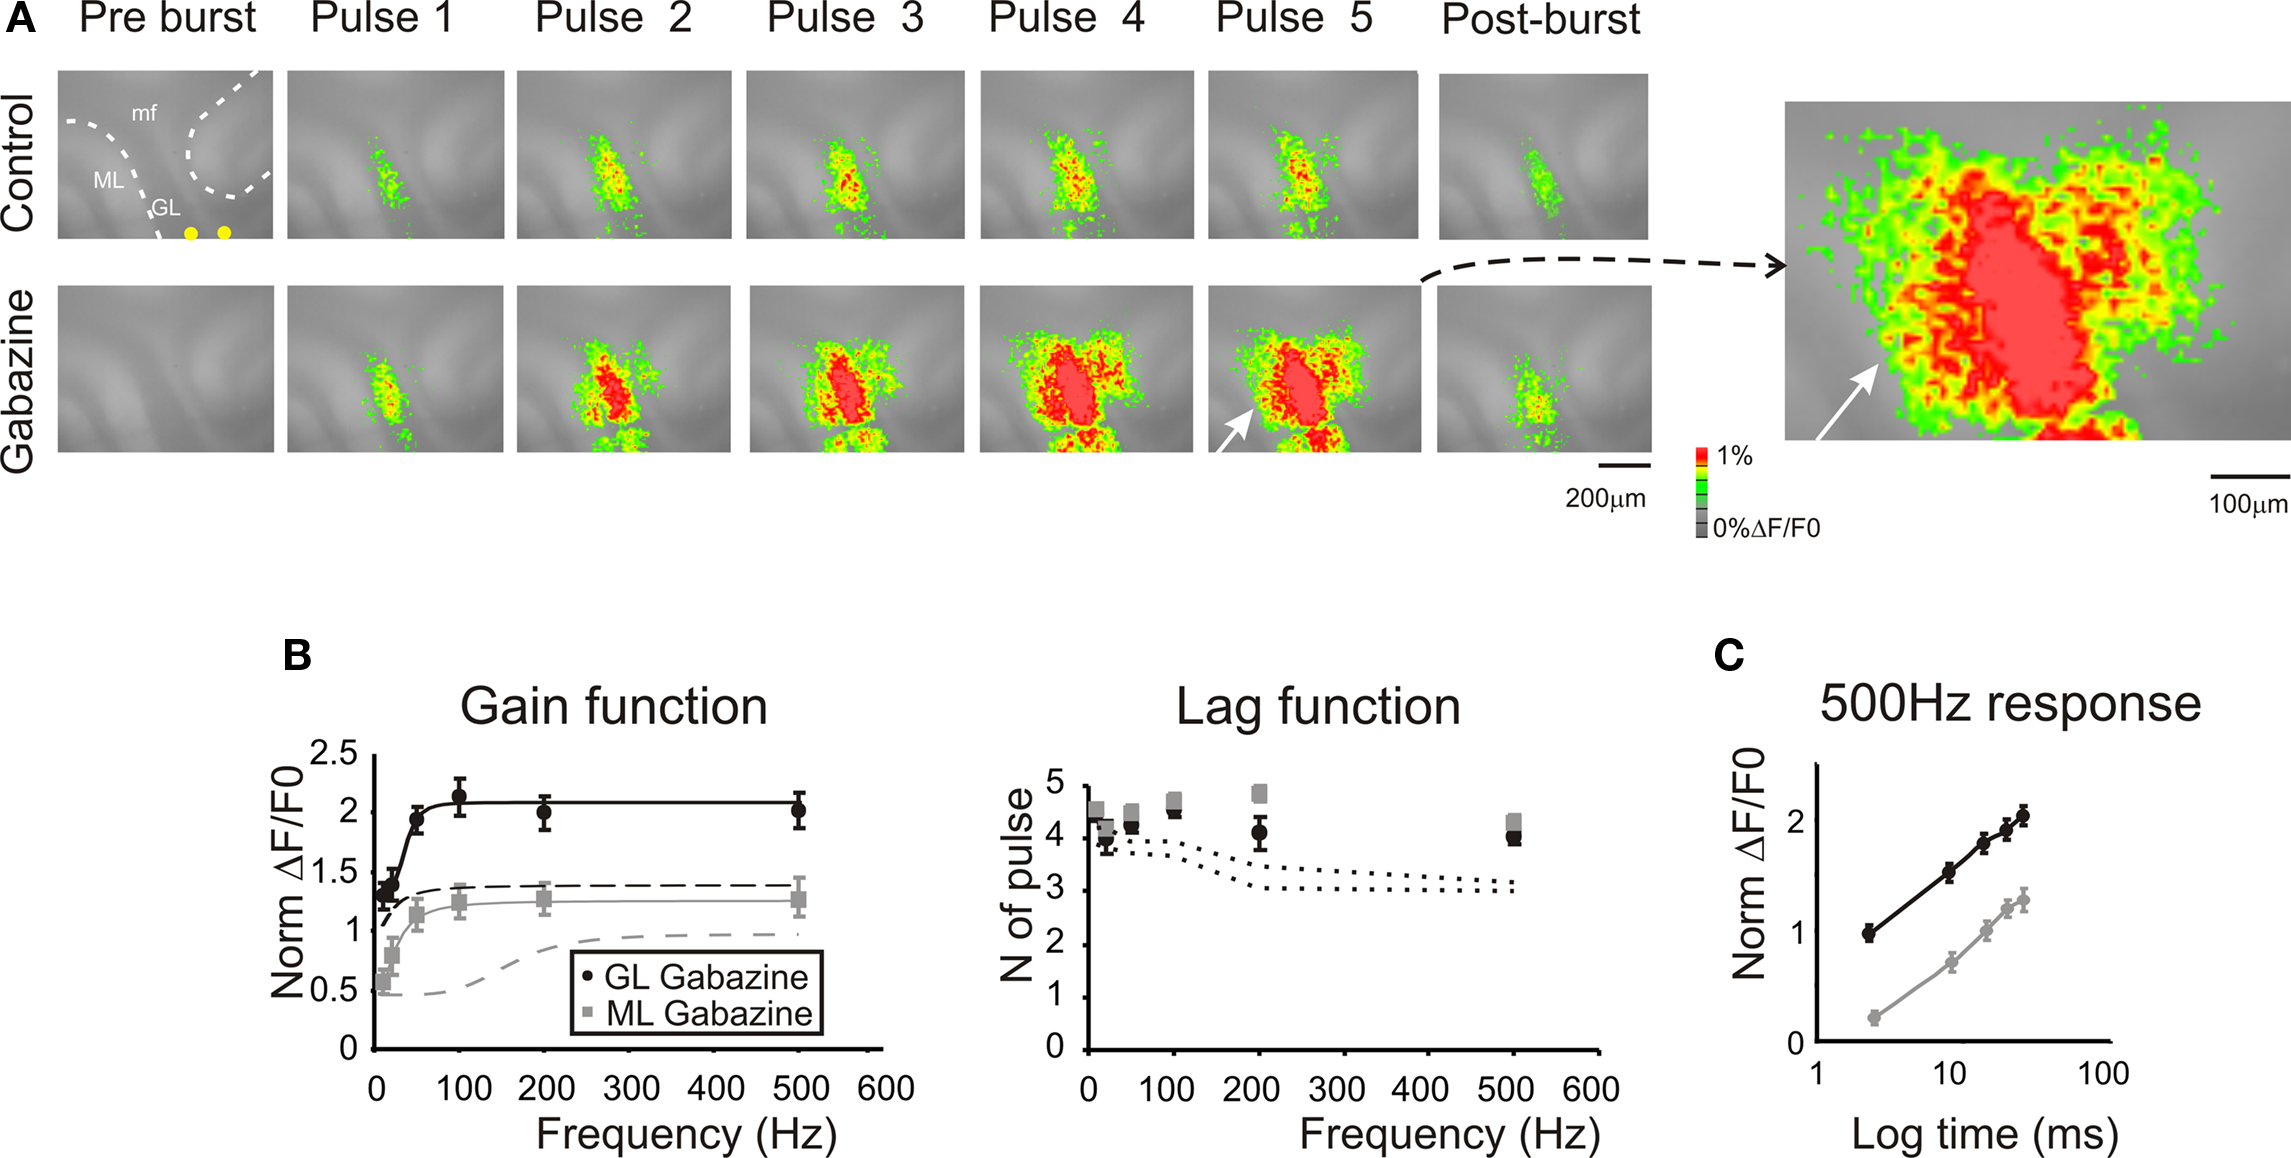
Figure 5. Regulation of frequency-dependence by GABA-A receptors. (A) Optical maps were obtained at the peak of responses in 5-pulse 100 Hz bursts delivered to the white matter. Application of 10-μM gabazine markedly enhanced amplitude and extension of responses in the granular and molecular layer, and the effect increased during and after the burst (50 ms after the end of the burst). It should be noted the marked response summation in the presence of gabazine. The enlarged map evidences the activation of the molecular layer (white arrow) following the application of 10-μM gabazine. (B) Maximum response amplitudes were measured for each of the five pulses of bursts delivered at different frequencies both in the granular and molecular layer (n = 4 slices, n = 16 ROIs for each frequency). Gain and lag curves for granular (black) and molecular layer (gray) responses show that gain increased and the shape of curves changed compared to control (dashed lines). The gain curves were fitted with a sigmoidal function (Eq.1). Lag remained over control values (dashed lines) at all frequencies. (C) The time course peak amplitude increase at 500 Hz, was taken to demonstrate for a representative frequency (the maximum tested) the non-saturating nature of the response in the presence of 10-μM gabazine (cfr Figure 4 C). Points are reported as mean ± SEM.
The application of 50-μM APV had also major effects on granular – molecular layer communication during repetitive neurotransmission (Figure 6 ), which appeared nearly opposite to those of gabazine. The extension of activated areas decreased at all frequencies: for instance, with a 500-Hz train, the variation was −37.4 ± 7.7% (n = 4, p < 0.01, paired t-test) in the granular layer and −45.5 ± 4.5% (n = 4, p < 0.05, paired t-test) in the molecular layer. Moreover, temporal summation, gain and lag varied compared to control conditions. (i) Temporal summation tended to saturate at all frequencies (except for the 500-Hz burst; Figure 6 B) revealing the absence of NMDA receptor-dependent temporal summation during the train (D’Angelo et al., 1995 ). Likewise, the post-burst response was markedly depressed. (ii) The frequency-dependence of the gain function in the granular layer (but not in the molecular layer) varied significantly. The gain curve of the granular layer did not show increase below 200 Hz due to lack of NMDA receptor-dependent integration, but then increased steeply at 500 Hz exploiting residual AMPA receptor-dependent summation (Figure 6 B). Fittings used to reveal the impact of NMDA receptors were performed assuming the presence of a plateau after 500 Hz: in the granular layer, best fitting required 2nd order with fc = 257 Hz, A1 = 0.87, A2 = 1.1, and (A2−A1)/A1 = + 26.4%; in the molecular layer, best fitting required 2nd order with fc = 264 Hz, initial amplitude A1 = 0.45, final amplitude A2 = 0.7, and (A2−A1)/A1 = + 55.5%. (iii) The lag to maximal response tended to increase slightly, according to the facilitating effect of NMDA receptors on temporal summation.
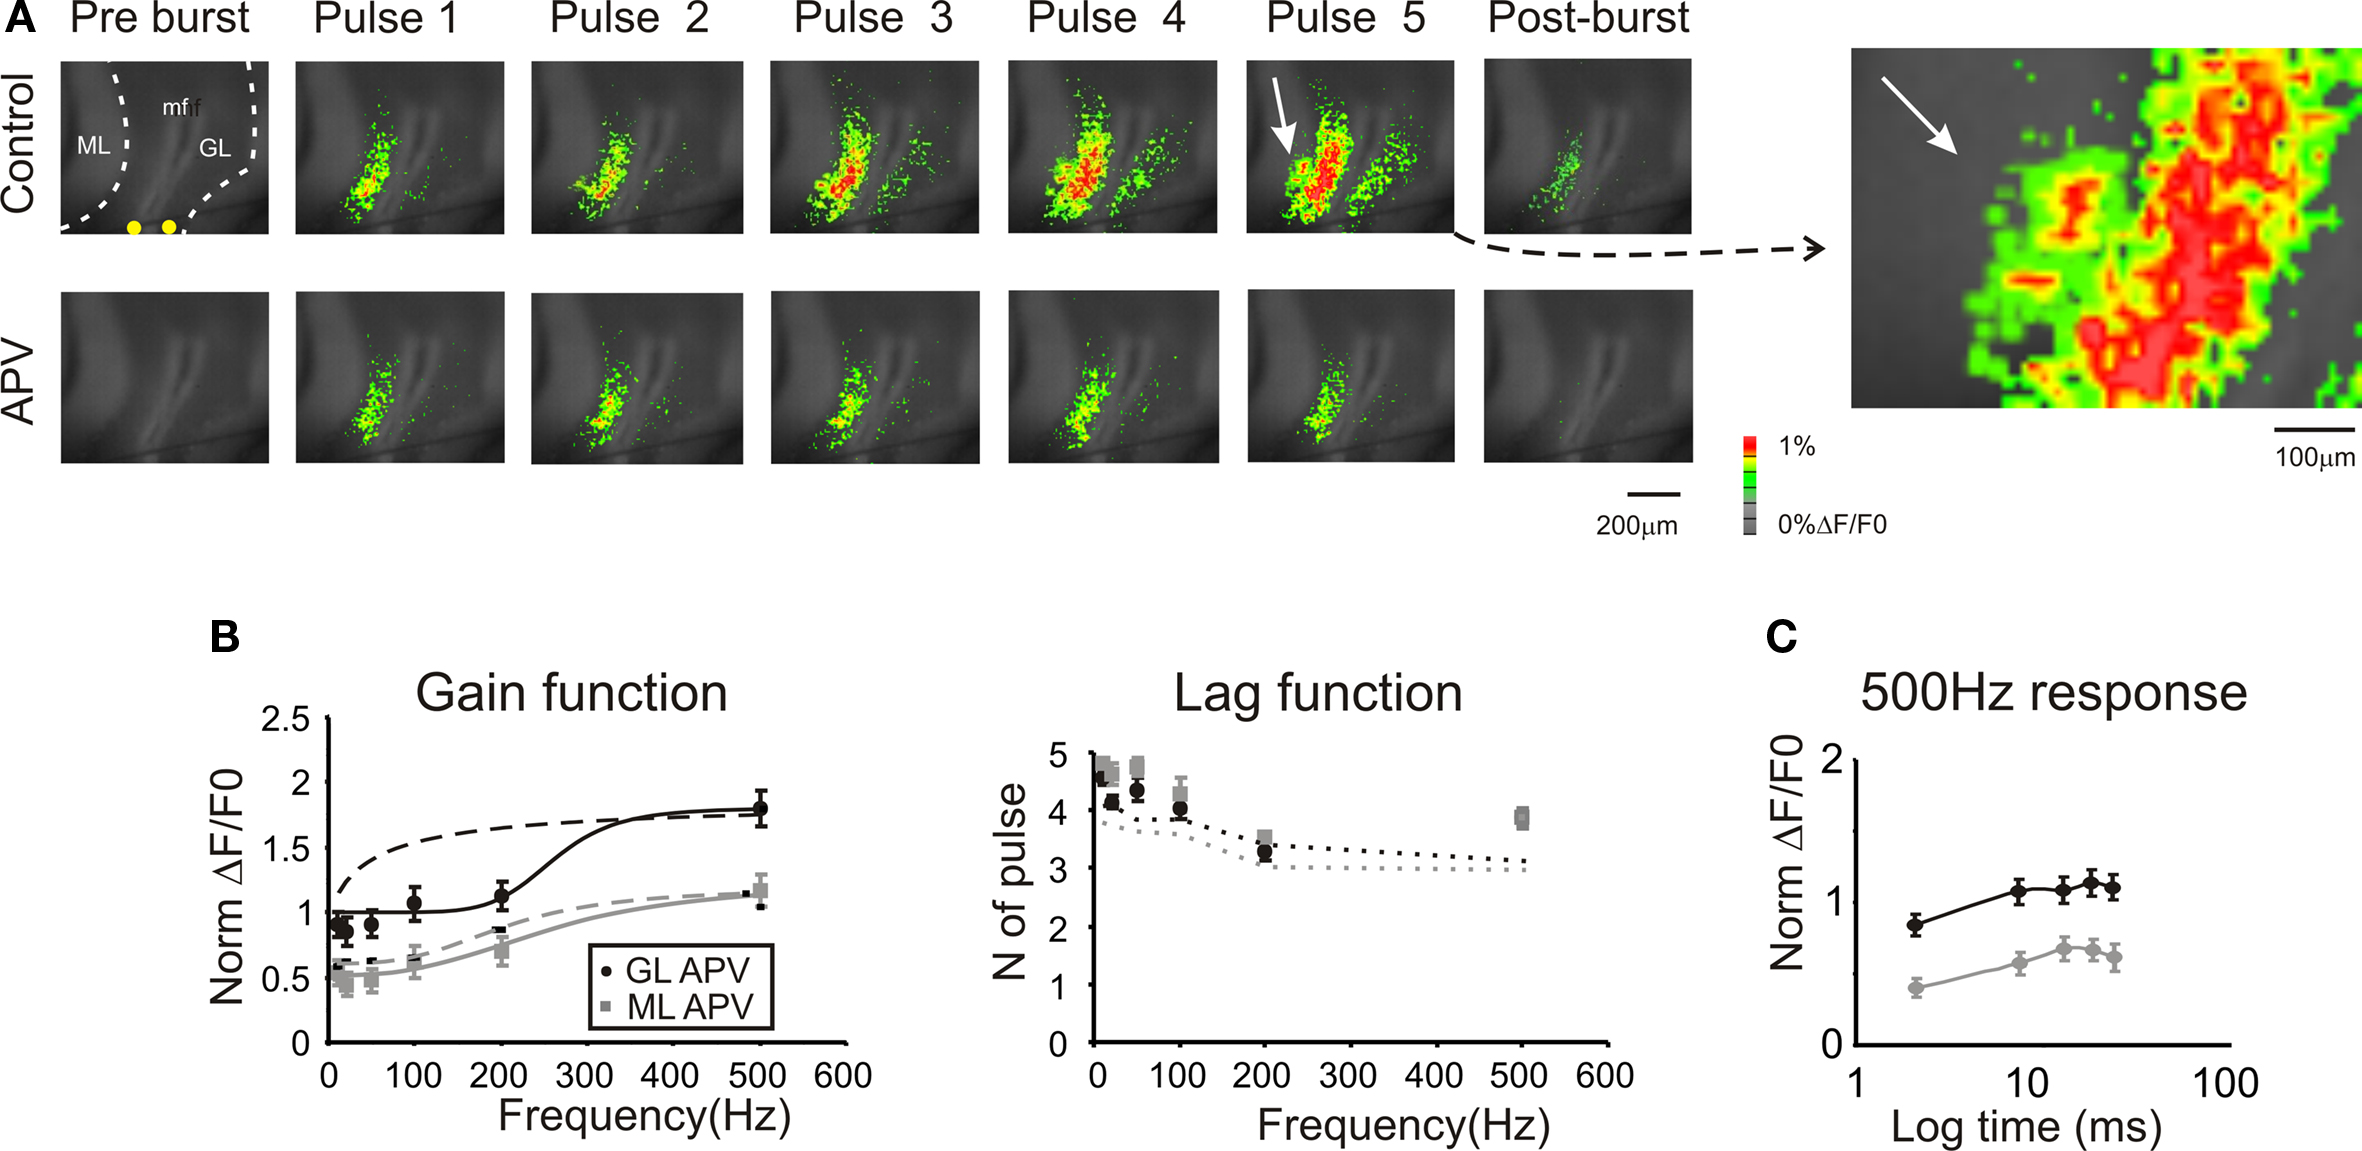
Figure 6. Regulation of frequency-dependence by NMDA receptors. (A) Optical maps were obtained at the peak of responses in five-pulse 200 Hz bursts delivered to the white matter. Application of 50-μM APV markedly reduced amplitude and extension of responses in the granular and molecular layer, and the response remained stationary during the bursts. After the end of the burst (50 ms) APV reduced the remaining part of the response which was probably generated by the summation of NMDA dependent currents. The enlarged map evidences the molecular layer region (white arrow) which was activated in control condition. (B) Maximum response amplitudes were measured for each of the five pulses of bursts delivered at different frequencies both in the granular and molecular layer (n = 4 slices, n = 16 ROIs for each frequency). Gain and lag curves for granular (black) and molecular layer (gray) responses show that gain decreased and the shape of the curve changed compared to control (dashed lines). The gain curves were fitted with a sigmoidal function (Eq.1). Lag remained around control values (dashed lines) at all frequencies. (C) The time course peak amplitude increase at 500 Hz, was taken to demonstrate for a representative frequency the saturating nature of the response in the presence of 50-μM APV (cfr Figure 4 C). Points are reported as mean ± SEM.
Therefore, the GABAergic inhibitory system and the excitatory NMDA receptor-dependent systems had opposite effects on the filtering properties of the granular and molecular layer.
Signal Transmission along the Parallel Fibers
The ascending branch of the granule cell axon contacts the overlaying Purkinje cells and then bifurcates to form the parallel fibers traveling on the longitudinal plane. In order to understand how the frequency-dependence of signal transmission from granular to molecular layer reverberates into the parallel fibers, we used repetitive mossy fiber stimulation in coronal slices (Figure 7 A). The application of 10–500 Hz bursts activated the granular layer and, as in the case of sagittal slices, signals reached the overlaying molecular layer. Interestingly, the molecular layer showed activation also in areas distant from the stimulation site, where no evident responses in the granular layer could be observed suggesting longitudinal transmission along the parallel fiber bundle.
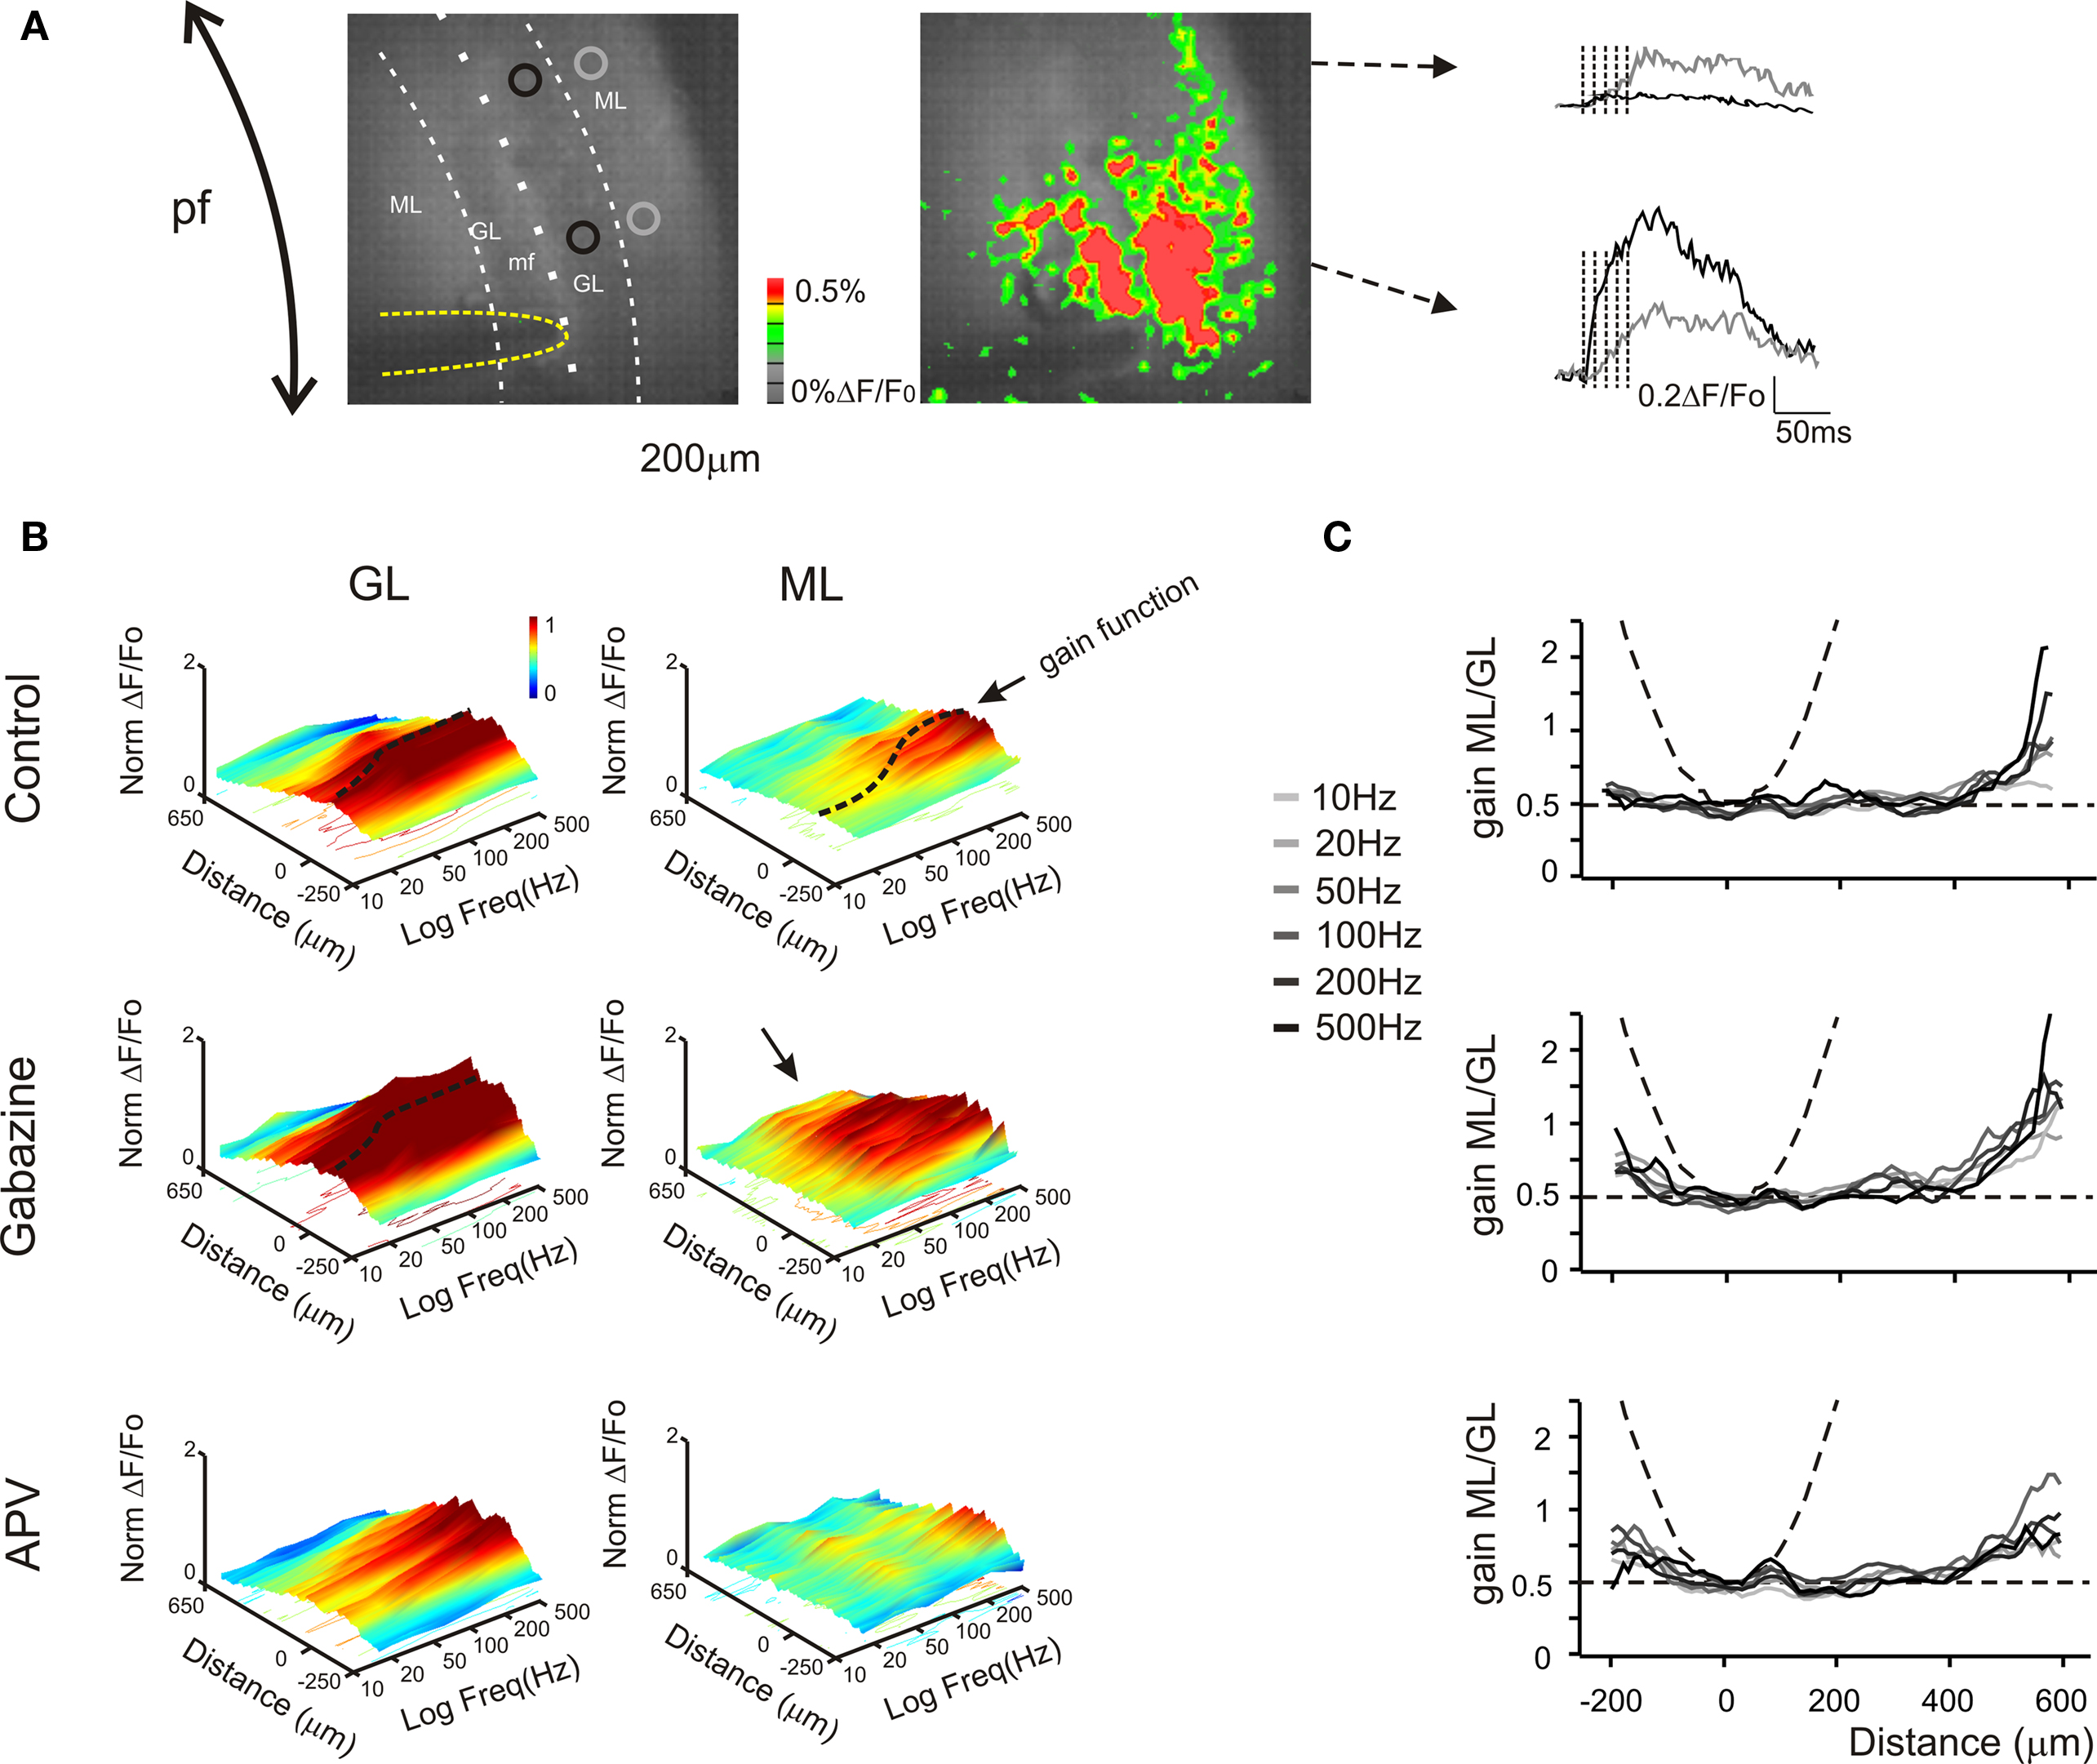
Figure 7. Granular and molecular layer activation in coronal slices. (A) Optical maps obtained at the peak of responses in five pulses 100 Hz burst delivered to the white matter (yellow line surrounds the stimulation electrode), in coronal slices. The molecular layer signal propagates beyond the corresponding granular layer activated area, activating distal areas of the molecular layer The traces illustrate the time course of different regions (black and gray circles) of the granular (black trace) and molecular layer (grey trace). Note that the molecular layer response proximal to the core of the granular layer activation is slower and smaller than the corresponding granular layer response, while in distal regions the molecular layer signal overcomes the almost absent granular layer response (as evidenced from the optical map). (B) The spatial profile of gain was measured for different frequencies burst both in the granular and in the molecular layer (n = 4 slices, for each frequency). 3D maps show the spatial distribution of gain functions in different experimental conditions (Control, Gabazine and APV), evidencing the space (x) and frequency (y) dependence of granular and molecular layer activation (z). Dashed lines indicate gain functions in the core of the granular and molecular layer activation (cfr Figures 4 –6 ). The spatial profile (x-axis) of the granular layer activation is narrow around the stimulating electrode (0 reference) and decays in distal regions, maintaining this profile even increasing the stimulation frequency. Conversely the excitation profile of the molecular layer shows the activation of the periphery for all tested frequency, while the core of excitation shows a strong dependence on the stimulation frequency. The application of Gabazine enhances the granular layer excitation without significantly affecting its spatial profile and gain curve. Differently, the molecular layer excitation shows a homogeneous increase of the activation above 50 Hz. Moreover the most evident effect of the block of GABAergic synapses was to enlarge the spatial profile so that there is a massive spread of activation in distal regions (black arrow) most probably generated by to the block of the molecular layer interneurons inhibition. The application of APV decreases the excitation of both granular and molecular layer without significantly affecting its spatial profile. Nevertheless the granular layer response increases above 100–200 Hz, thus disabling the signal transmission to the molecular layer. 3D Maps were generated by using average spatial profiles with SEM values ranging from 0.0001 to 0.001 ΔF/F0. (C) The contribution of parallel fibers activation to molecular layer responses could be isolated by evaluating the spatial profile of the ratio between the molecular and granular layer gain values for different frequencies and in different experimental conditions. In control condition the gain ratio in the core of activation is similar to the case of sagittal slices (∼ 0.5). In the periphery the molecular layer overcomes the granular layer gain suggesting the signal propagation through the parallel fibers (cfr B). Dashed lines indicate the limit cases of maximum (parable) and no contribution (straight line) of parallel fiber to the molecular layer activity. The application of 10-μM gabazine increases the gain ratio spatial profiles for all frequencies. Conversely the block of NMDA receptor by the application of 50-μM APV poorly modulates the gain ratio profiles.
The delay between the focus of excitation along the vertical axis and the distal part of the parallel fibers (at 500 μm distance) was 11.3 ± 1.8 ms (n = 4) in control and 5.6 ± 1.1 ms (n = 4) in the presence of gabazine. The time at which signals became detectable (20% over noise) was therefore protracted by molecular layer circuit inhibition, consistent with the observation that molecular layer signals are largely generated by Purkinje cell responses. These delays, by including postsynaptic signal processes, yield a lower limit of ∼50 μm/ms for the conduction velocity along the parallel fibers.
The spatial profile of excitation was reconstructed at different frequencies (Figure 7 B). Not unexpectedly, excitation of the granular layer and transmission toward the molecular layer were much more evident at high frequency (typically above 50–100 Hz, as observed in sagittal sections). The granular layer responded in a limited area without remarkable lateral propagation. This most probably reflects the fact that mossy fibers ramify in the sagittal plane and cannot therefore contribute to lateral signal diffusion in coronal sections. The granular layer signals were transmitted forward to the overlaying molecular layer and then propagated along the parallel fibers. The application of 10-μM gabazine enhanced while that of 50-μM APV reduced the overall pathway response.
To determine the effectiveness of parallel fiber–mediated excitation, the ratio between molecular and granular layer activity was computed along the transverse axis (Figure 7 C). This ratio (Gainmolecular/Gaingranular) takes a parabolic shape around the maximum activity point if there is transversal transmission, while it becomes flat if there is pure vertical transmission. The upward concavity of the plots confirms that transmission takes place along the parallel fibers independent from direct signal transmission from the granular layer. Moreover, the plots indicate that transversal transmission occurs in control, is maintained in the presence of APV, and is enhanced in the presence of bicuculline.
The Sequence of Frequency-Dependent Effects
The results reported above indicate that there are specific mechanisms of frequency-dependent transmission of the maximum response to mossy fiber bursts in the granular and in the overlaying molecular layer. To complete the investigation of transmission, the retransmission of mossy fiber burst along the parallel fibers was analyzed at different stimulation frequencies (Figure 8 ). Surprisingly, activation along the parallel fiber beams (∼500 μm from the vertical transmission point) was not frequency-dependent, neither changes were observed after application of APV. However, after applying gabazine, a frequency-dependence similar to that of the molecular layer in the vertical transmission point was observed. Thus, improved transmission of high-frequency bursts occurred along the vertical axis but not along the parallel fiber beams.
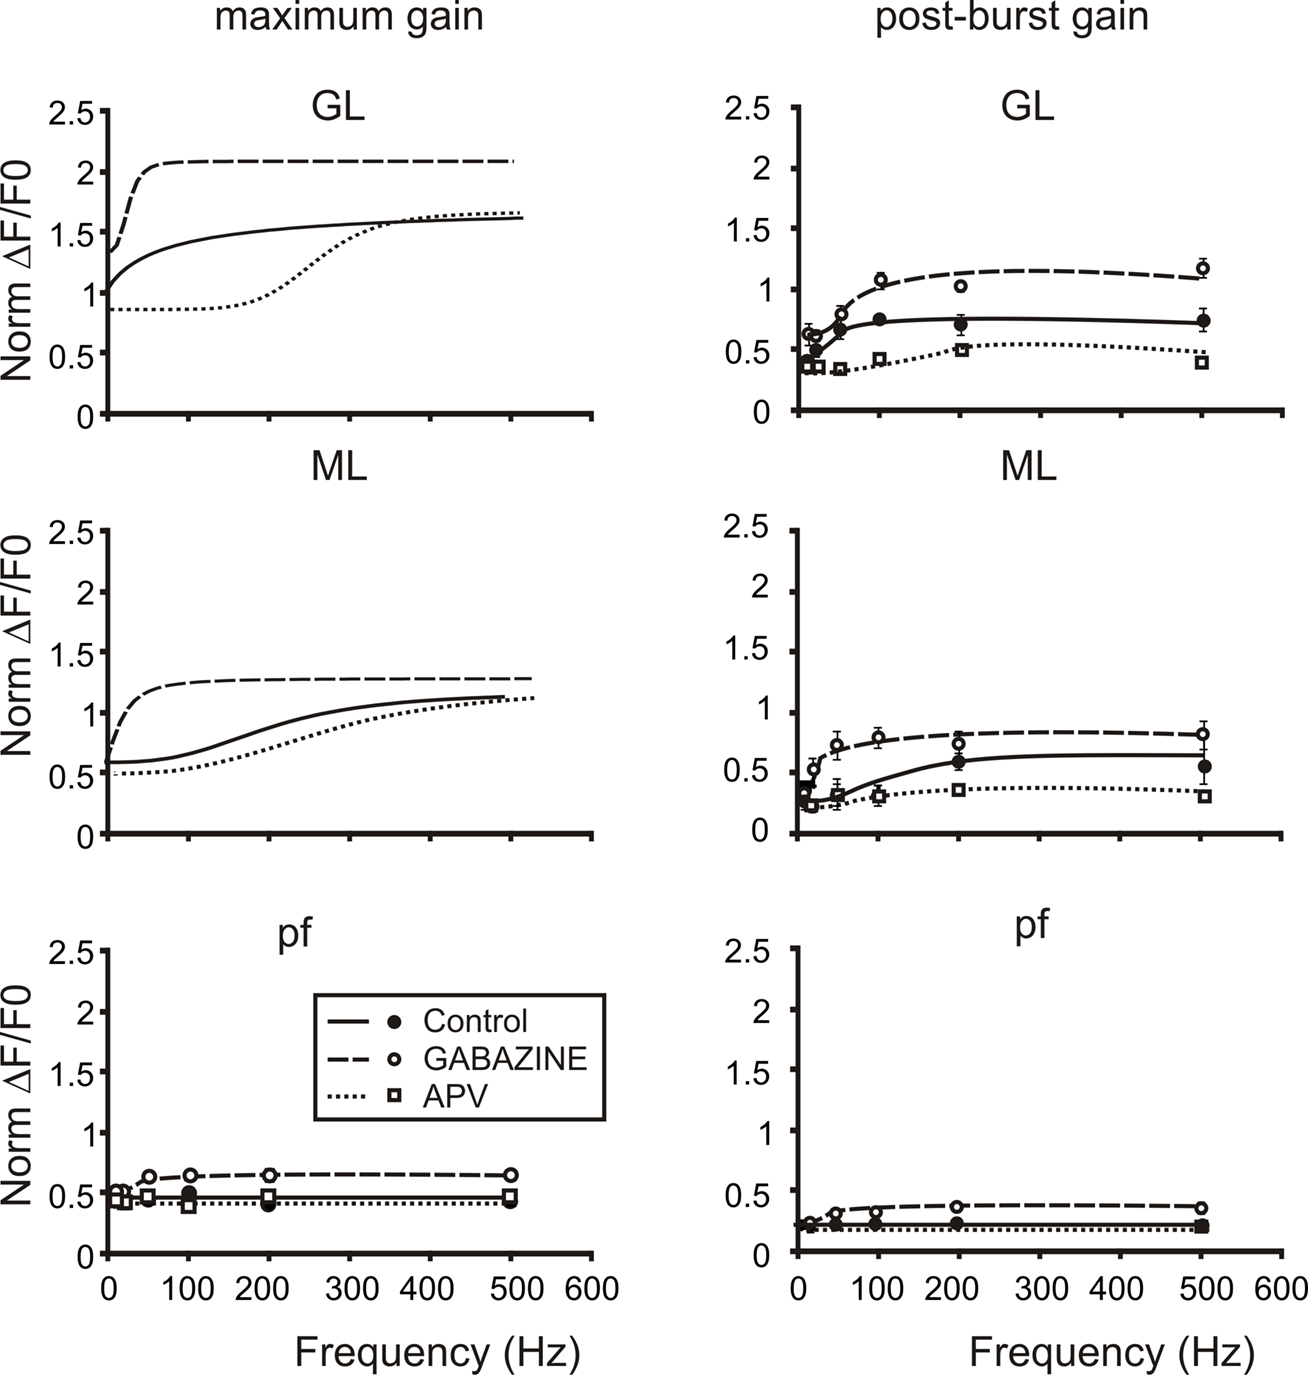
Figure 8. The cascade of filters from mossy to parallel fibers. Plots summarize the cascade filters generated from the mossy fiber to the parallel fibers. Signals conveyed through mossy fibers are primarily high-pass filtered by the granular layer. This first high-pass filter cuts signals below 50 Hz mainly through the activation of NMDA currents, in fact the application of APV (empty squares and dotted lines) shifts the cut-off frequencies of both gain and post-burst curves above 100 Hz. Moreover granule cell axons convey signals at the first Purkinje cells synaptic stage. Here a second filter cuts very high-frequency signals (100–200 Hz) mainly through the action of the inhibitory system. Note that gain and post-burst curves are poorly modified by the application of APV while the application of Gabazine (empty circles and dashed lines) significantly enhances gain and post-burst values decreasing the cut-off frequencies (20–50 Hz). Traveling throughout granule cell axons, signals could be conveyed to parallel fibers and then reach the second Purkinje cell synaptic stage. Here signals appear to be linearly modulated by the incoming frequency. Only the block of the inhibitory system unmasks the same frequency-dependence encountered in the other stages. This could be due to the strong action of interneurons on Purkinje cells preventing them to depolarize. Post-burst gain values were calculated 50 ms after the end of bursts both for sagittal and coronal slices (n = 4). Maximum gain and post-burst gain for parallel fibers were calculated by taking the average of 10 pixels (100 μ) in the distal part of coronal slices.
Finally, the frequency-dependence of transmission of the post-burst response was considered. In control, the post-burst response increased markedly above 50–100 Hz in the granular and in the molecular layer along the vertical transmission line, but showed no frequency-dependence along the parallel fibers. Moreover, the post-burst response was nearly doubled by GABA-A receptor blockage, which also reconstituted frequency-dependence along the parallel fiber beams. In these aspects the post-burst response was similar to the maximum burst response. However, the post-burst response was almost completely suppressed by NMDA receptor blockage at all frequencies, indicating that the NMDA receptor system was able to protract the effect of high-frequency bursts for tens of ms after their termination.
Discussion
This paper shows that excitation generated by mossy fibers, after invading the granular layer, propagates vertically into the molecular layer and then transversally along the parallel fibers. The central finding is that transmission of mossy fiber bursts through the granular and molecular layer is markedly frequency-dependent implementing a cascade of two high-pass filters regulated by NMDA and GABA-A receptors. Eventually, retransmission of bursts above ∼100 Hz is amplified along vertical transmission lines but not along the parallel fibers. This difference in frequency-dependent gain in the two subcircuits could cause the spot-like activation patterns of the molecular layer observed in response to punctuate stimulation in vivo (Bower and Woolston, 1983 ) and substantiate the adaptable spatio-temporal filter hypothesis predicted on theoretical grounds (Dean et al., 2010 ).
VSD Signals and the Spread of Excitation along the Mossy Fiber – Parallel Fiber Pathway
VSD signal generation was correlated with the activity of granule and Purkinje cells (cf. Mapelli et al., 2010 and see Materials and Methods and Figure 2 ), which are by far the major excitable elements of the granular and molecular layer (see also Cohen and Yarom, 1998 ; Jacobson et al., 2008 ). The activation delays from granular to molecular layer were consistent with those observed using either VSD imaging or field potential recordings in other papers (e.g. see Vranesic et al., 1994 ; Baginskas et al., 2009 ; Walter et al., 2009 ). Moreover, the impact of GABA-A and NMDA receptor blockers on the spatio-temporal kinetics of the response was similar to that observed with MEA and patch-clamp recordings (D’Angelo et al., 1995 ; Mapelli and D’Angelo, 2007 ). Therefore, although Di-4-ANEPPS has been shown to enhance GABAergic responses in some cases (Mennerick et al., 2010 ), it did not substantially alter critical parameters of granular and molecular layer activation in cerebellar slice recordings. It should also be noted that Purkinje cells showed similar basal frequency with and without the dye (data not shown), further suggesting the maintenance of a correct excitatory-inhibitory balance.
The propagation of signals followed the anatomical organization of cerebellar fibers (Sultan, 2001 ). In the granular layer, mossy fibers and Golgi cell axons generate multiple ramifications in the sagittal plane and granule cells project their axons vertically toward the molecular layer. Accordingly, in sagittal slices, activation spread beside the mossy fiber bundle and then ascended vertically into the molecular layer. In coronal slices, the molecular layer showed strong activation just over the responding granular layer area, and then activation propagated longitudinally along the parallel fibers.
At low frequency, the response along the parallel fibers was comparable to that along vertical transmission lines, in keeping with the functional equivalence of the two inputs to Purkinje cells recently reported by Walter et al. (2009) . However, at high frequency, vertical was much stronger than parallel fiber transmission. This may explain why, in vivo, when high-frequency burst are generated by mossy fibers in response to punctuate stimulation, Purkinje cell activation occurs in spots with a prevalent vertical organization (Bower and Woolston, 1983 ; Cohen and Yarom, 1998 ; Jacobson et al., 2008 ; Lu et al., 2009 ).
Phasic Synaptic Mechanisms Determine Frequency-Dependent Gain Regulation in the Granular Layer
In the granular layer, the normalized gain increase observed after GABA-A receptor blockage was 86% at high- frequency but just 14% at low-frequency [cf. (A2−A1)/A1 to A1 values in Figures 4 –5 ]. Since GABA-A receptor-dependent effect at high frequency reflected the response to 3–5 impulses in short-sequence, while at low frequency it reflected the steady-state background inhibition, the gain considered here depended on dynamic inhibitory loops rather than on tonic inhibition (Mitchell and Silver, 2003 ). Therefore, gain control of burst transmission in the granular layer depends on the dynamical activation of inhibitory circuits, as originally envisaged by Marr (1969) , Albus (1971) and Fujita (1982) .
In the granular layer, GABA-A receptor activation through the Golgi cell loops reduces EPSP temporal summation in granule cells (Armano et al., 2000 ; Kanichay and Silver, 2008 ; for review see D’Angelo, 2008 ; D’Angelo and De Zeeuw, 2009 ). The GABAergic system caused both a global transmission decrease over the whole-frequency range and a specific transmission decrease at frequencies lower than 50 Hz, possibly involving the differential kinetic properties of α6-and α1-receptor-mediated mechanisms (Mapelli et al., 2009 ).
In the granular layer, gain was also regulated by NMDA receptors but in the opposite direction: after blocking NMDA receptors, the normalized gain change at intermediate input frequencies was −25% after. NMDA receptors, by exploiting their slow kinetic time constants, boosted EPSP temporal summation and sustained a protracted post-burst responses (cf. D’Angelo et al., 1995 ) in the 10–200 Hz range. AMPA receptors, which have kinetic time constants in the 1–2 ms range, allowed temporal summation at very high frequencies (500 Hz). Thus, the combination of the two receptor-dependent mechanisms allowed to amplifying transmission over a broad frequency range covering the natural range of mossy fiber discharge ( Chadderton et al., 2004 ; Eckerot and Jorntell, 2006). It should also be noted that NMDA receptors tuned the persistence of granule cell responses after mossy fiber burst termination.
Differential Gain Control in the Granular and Molecular Layer
In the molecular layer, gain was regulated by GABAergic mechanisms but not by NMDA receptor-dependent mechanisms, in agreement with the prominent localization of NMDA receptors in the granular layer. In the molecular layer, the impact of GABA-A receptors became progressively stronger: GABA-A receptors depressed transmission below ∼100 Hz along vertical transmission lines and over the whole-frequency range along the parallel fibers. Among factors explaining the progressive shift of inhibitory control toward higher frequencies along the mossy fiber – parallel fiber pathway, one could be that GABAergic inhibition is especially effective in controlling NMDA receptor-dependent depolarization in the granular layer (Mapelli and D’Angelo, 2007 ). Another factor could be that, in the cerebellar glomerulus, inhibition is specifically depressed at high frequency due to presynaptic crosstalk and activation of metabotropic glutamate receptors (Mitchell and Silver, 2000a ,b ). A third aspect is that the center-surround structures formed by the granular layer following activation of a mossy fiber bundle, have complex transmission properties: compared to the surround, the center detects burst on a broader band and emits bursts with shorter lag, higher frequency and longer duration (Solinas et al., 2010 ). This could favor activation of overlaying Purkinje cells and, at the same time, enhance inhibition around them. Thus, preprocessing and spatial organization of signal in the granular layer could play a relevant role for generating the spot-like organization of molecular layer responses in vivo. In addition, the inhibitory circuits of the molecular layer could have themselves specific organization and transmission properties favoring spot-like responses rather than beam formation (Cohen and Yarom, 1998 ; Santamaria et al., 2007 ).
Conclusions
In conclusion, in cerebellar slices, mossy fibers signals can reach the molecular layer and then travel along the parallel fibers. However, signal transmission is regulated by synaptic mechanisms implementing a cascade of high-pass filters. Only activity over 50 Hz is retransmitted to the molecular layer. Then, the Purkinje cells placed over the excited granular layer area respond maximally when mossy fiber bursts have a frequency higher than 100 Hz. This high-frequency enhancement is lost along the parallel fibers. Thus, a high-frequency burst in a mossy fiber bundle excites quite strongly the overlying Purkinje cells but much more poorly those aligned along the parallel fibers. This same spatial organization was also evident for the post-burst, which prolonged the duration of granular and molecular layer responses. These effects would favor the emergence of spots while preventing efficient beam formation, as indeed observed following punctuate stimulation in vivo when mossy fibers generate bursts with frequencies over 100 Hz (Bower and Woolston, 1983 ). As a corollary, parallel fibers may be specialized to determine a low-gain frequency-independent background excitation along the beam.
Conflict of Interest Statement
The authors declare that the research was conducted in the absence of any commercial or financial relationships that could be construed as a potential conflict of interest.
Acknowledgments
This work was supported by grants SENSOPAC (FP6-IST028056) of the European Commission and by NEUROIMAGE of CNISM (Consorzio Interuniversitario per le Scienze Fisiche della Materia) to Egidio D’Angelo.
References
Arenz, A., Silver, R. A., Schaefer, A. T., and Margrie, T. W. (2008). The contribution of single synapses to sensory representation in vivo. Science 321, 977–980.
Armano, S., Rossi, P., Taglietti, V., and D’Angelo, E. (2000). Long-term potentiation of intrinsic excitability at the mossy fiber – granule cell synapse of rat cerebellum. J. Neurosci. 20, 5208–5216.
Baginskas, A., Palani, D., Chiu, K., and Raastad, M. (2009). The H-current secures action potential transmission at high frequencies in rat cerebellar parallel fibers. Eur. J. Neurosci. 29, 87–96.
Bower, J. M., and Woolston, D. C. (1983). Congruence of spatial organization of tactile projections to granule cell and Purkinje cell layers of cerebellar hemispheres of the albino rat: vertical organization of cerebellar cortex. J. Neurophysiol. 49, 745–766.
Chadderton, P., Margrie, T. W., and Hausser, M. (2004). Integration of quanta in cerebellar granule cells during sensory processing. Nature 428, 856–860.
Cohen, D., and Yarom, Y. (1998). Patches of synchronized activity in the cerebellar cortex evoked by mossy-fiber stimulation: questioning the role of parallel fibers. Proc. Natl. Acad. Sci. U.S.A. 95, 15032–15036.
Cull-Candy, S. G., Brickley, S. G., Misra, C., Feldmeyer, D., Momiyama, A., and Farrant, M. (1998). NMDA receptor diversity in the cerebellum: identification of subunits contributing to functional receptors. Neuropharmacology 37, 1369–1380.
D’Angelo, E. (2008). The critical role of Golgi cells in regulating spatio-temporal integration and plasticity at the cerebellum input stage. Front. Neurosci. 2, 35–46.
D’Angelo, E., De Filippi, G., Rossi, P., and Taglietti, V. (1995). Synaptic excitation of individual rat cerebellar granule cells in situ: evidence for the role of NMDA receptors. J. Physiol. (Lond.) 484, 397–413.
D’Angelo, E., and De Zeeuw, C. I. (2009). Timing and plasticity in the cerebellum: focus on the granular layer. Trends Neurosci. 32, 30–40.
D’Angelo, E., Rossi, P., Armano, S., and Taglietti, V. (1999). Evidence for NMDA and mGlu receptor-dependent long-term potentiation of mossy fibre – granule cell transmission in rat cerebellum. J. Neurophysiol. 81, 277–287.
Dean, P., Porrill, J., Ekerot, C. F., and Jörntell, H. (2010). The cerebellar circuit as an adaptive filter: experimental and computational evidence. Nat. Rev. Neurosci. 11, 30–43.
Diwakar, S., Magistretti, J., Goldfarb, M., Naldi, G., and D’Angelo, E. (2009). Axonal Na+ channels ensure fast spike activation and back-propagation in cerebellar granule cells. J. Neurophysiology 101, 519–532.
Dugué, G. P., Dumoulin, A., Triller, A., and Dieudonné, S. (2005). Target-dependent use of co-released inhibitory transmitters at central synapses. J. Neurosci. 23, 6490–6498.
Eccles, J. C., Ito, M., and Szentagothai, J. (1967). The Cerebellum as a Neuronal Machine. Berlin: Springer Verlag.
Garthwaite, J., and Brodbelt, A. R. (1989). Synaptic activation of N-methyl-D-aspartate and non-N-methyl-D-aspartate receptors in the mossy fibre pathway in adult and immature rat cerebellar slices. Neuroscience 29, 401–412.
Harvey, R. J., and Napper, R. M. (1991). Quantitative studies on mammalian cerebellum. Prog. Neurobiol. 36, 437–463.
Jacobson, G. A., Rokni, D., and Yarom, Y. (2008). A model of the olivo-cerebellar system as a temporal pattern generator. Trends Neurosci. 31, 617–625.
Jörntell, H., and Ekerot, C. F. (2006). Properties of somatosensory synaptic integration in cerebellar granule cells in vivo. J. Neurosci. 26;11786–11797.
Kanichay, R. T., and Silver, R. A. (2008). Synaptic and cellular properties of the feedforward inhibitory circuit within the input layer of the cerebellar cortex. J. Neurosci. 28, 8955–8967.
Kase, M., Miller, D. C., and Noda, H. (1980). Discharges of Purkinje cells and mossy fibres in the cerebellar vermis of the monkey during saccadic eye movements and fixation. J. Physiol. (Lond.) 300, 445–453.
Kinney, G. A., and Slater, N. T. (1993). Potentiation of NMDA receptor-mediated transmission in turtle cerebellar granule cells by activation of metabotropic glutamate receptors. J. Neurophysiol. 69, 585–594.
Llinas, R., and Sugimori, M. (1980a). Electrophysiological properties of in vitro Purkinje cell dendrites in mammalian cerebellar slices. J. Physiol. (Lond.) 305, 197–213.
Llinas, R., and Sugimori, M. (1980b). Electrophysiological properties of in vitro Purkinje cell somata in mammalian cerebellar slices. J. Physiol. (Lond.) 305, 171–195.
Lu, H., Esquivel, A. V., and Bower, J. M. (2009). 3D electron microscopic reconstruction of segments of rat cerebellar Purkinje cell dendrites receiving ascending and parallel fiber granule cell synaptic inputs. J. Comp. Neurol. 514, 583–594.
Mapelli, J., and D’Angelo, E. (2007). The spatial organization of long-term synaptic plasticity at the input stage of the cerebellum. J. Neurosci. 27, 1285–1296.
Mapelli, J., Gandolfi, D., and D’Angelo, E. (2010). Combinatorial responses controlled by synaptic inhibition in the cerebellum granular layer. J. Neurophys. 103, 250–261.
Mapelli, L., Rossi, P., Nieus, T., and D’Angelo, E. (2009). Tonic activation of GABA-B receptors reduces release probability at inhibitory connections in the cerebellar glomerulus. J. Neurophysiol. 101, 3089–3099.
Mennerick, S., Chisari, M., Shu, H. J., Taylor, A., Vasek, M., Eisenman, L. N., and Zorumski, C. F. (2010). Diverse voltage-sensitive dyes modulate GABAA receptor function. J. Neurosci. 30, 2871–2879.
Mitchell, S. J., and Silver, R. A. (2000a). Glutamate spillover suppresses inhibition by activating presynaptic mGluRs. Nature 404, 498–502.
Mitchell, S. J., and Silver, R. A. (2000b). GABA spillover from single inhibitory axons suppresses low-frequency excitatory transmission at the cerebellar glomerulus. J. Neurosci. 20, 8651–8658.
Mitchell, S. J., and Silver, R. A. (2003). Shunting inhibition modulates neuronal gain during synaptic excitation. Neuron 38; 433–445.
Palkovits, M., Magyar, P., and Szentàgothai, J. (1971). Quantitative histological analysis of the cerebellar cortex in the cat. II. Cell numbers and densities in the granular layer. Brain Res. 32, 15–30.
Rancz, E. A., Ishikawa, T., Duguid, I., Chadderton, P., Mahon, S., and Hausser, M. (2007). High-fidelity transmission of sensory information by single cerebellar mossy fibre boutons. Nature 450, 1245–1249.
Rokni, D., Llinas, R., and Yarom, Y. (2008). The morpho/functional discrepancy in the cerebellar cortex: looks alone are deceptive. Front Neurosci. 2, 192–198.
Rokni, D., Tal, Z., Byk, H., and Yarom, Y. (2009). Regularity, variability and bi-stability in the activity of cerebellar purkinje cells. Front. Cell. Neurosci. 3:12. doi:10.3389/neuro.03.012.2009.
Sacconi, L., Mapelli, J., Gandolfi, D., Lotti, J., O’Connor, R. P., D’Angelo, E., and Pavone, F. S. (2008). Optical recording of electrical activity in intact neuronal networks with random access second-harmonic generation microscopy. Opt. Express 16, 14910–14921.
Santamaria, F., Tripp, P. G., and Bower, J. M. (2007). Feedforward inhibition controls the spread of granule cell-induced Purkinje cell activity in the cerebellar cortex. J. Neurophysiol. 97, 248–263.
Sims, R. E., and Hartell, N. A. (2005). Differences in transmission properties and susceptibility to long-term depression reveal functional specialization of ascending axon and parallel fiber synapses to Purkinje cells. J. Neurosci. 23, 3246–3257.
Sims, R. E., and Hartell, N. A. (2006). Differential susceptibility to synaptic plasticity reveals a functional specialization of ascending axon and parallel fiber synapses to cerebellar Purkinje cells. J. Neurosci. 26, 5153–5159.
Solinas, S., Nieus, T., and D’Angelo, E. (2010). A realistic large-scale model of the cerebellum granular layer predicts circuit spatio-temporal filtering properties. Front. cell. Neurosci. 4:12. doi: 10.3389/fncel.2010.00012.
Sultan, F. (2001). Distribution of mossy fiber rosettes in the cerebellum of cat and mice: evidence for a parasagittal organization at the single fiber level. Eur. J. Neurosci. 13, 2123–2130.
Tominaga, T., Tominaga, Y., Yamada, H., Matsumoto, G., and Ichikawa, M. (2000). Quantification of optical signals with electrophysiological signals in neural activities of Di-4-Anepps stained rat hippocampal slices. J. Neurosci. Methods 102, 11–23.
Vranesic, I., Iijima, T., Ichikawa, M., Matsumoto, G., and Knöpfel, T. (1994). Signal transmission in the parallel fiber-Purkinje cell system visualized by high-resolution imaging. Proc. Natl. Acad. Sci. U.S.A. 20, 13014–13017.
Walter, J. T., Dizon, M. J., and Khodakhah, K. (2009). The functional equivalence of ascending and parallel fiber inputs in cerebellar computation. J. Neurosci. 29, 8462–8473.
Keywords: cerebellum, gain control, GABA-A receptors, NMDA receptors, voltage-sensitive dye, imaging
Citation: Mapelli J, Gandolfi D and D’Angelo E (2010) High-pass filtering and dynamic gain regulation enhance vertical bursts transmission along the mossy fiber pathway of cerebellum. Front. Cell. Neurosci. 4:14. doi: 10.3389/fncel.2010.00014
Received: 07 August 2009;
Paper pending published: 09 November 2009;
Accepted: 16 April 2010;
Published online: 28 May 2010
Edited by:
James M. Bower, University of Texas at San Antonio, USAReviewed by:
Michael Hausser, University College London, UK Dieter Jaeger, Emory University, USACopyright: © 2010 Mapelli, Gandolfi and D’Angelo. This is an open-access article subject to an exclusive license agreement between the authors and the Frontiers Research Foundation, which permits unrestricted use, distribution, and reproduction in any medium, provided the original authors and source are credited.
*Correspondence: Egidio D’Angelo and Jonathan Mapelli, Department of Physiology, University of Pavia, Via Forlanini 6, I-27100 Pavia, Italy. e-mail: dangelo@unipv.it; jonathan.mapelli@unipv.it