A Systematic, Open-Science Framework for Quantification of Cell-Types in Mouse Brain Sections Using Fluorescence Microscopy
 Juan C. Sanchez-Arias1*†
  Micaël Carrier1,2*†
  Simona D. Frederiksen1
  Olga Shevtsova1
  Chloe McKee1
  Emma van der Slagt1
  Elisa Gonçalves de Andrade1
  Hai Lam Nguyen1
  Penelope A. Young1
  Marie-Ève Tremblay1,2,3,4,5,6
  Leigh Anne Swayne1,6,7,8*
- 1Division of Medical Sciences, University of Victoria, Victoria, BC, Canada
- 2Axe Neurosciences, Centre de Recherche du CHU de Québec, Université de Laval, Québec City, QC, Canada
- 3Department of Neurology and Neurosurgery, McGill University, Montréal, QC, Canada
- 4Department of Molecular Medicine, Université de Laval, Québec City, QC, Canada
- 5Department of Biochemistry and Molecular Biology, University of British Columbia, Vancouver, BC, Canada
- 6Djavad Mowafaghian Centre for Brain Health, University of British Columbia, Vancouver, BC, Canada
- 7Department of Cellular and Physiological Sciences, University of British Columbia, Vancouver, BC, Canada
- 8Department of Neurology and Neurosurgery, Centre for Research in Neuroscience, Brain Repair and Integrative Neuroscience Program, Research Institute of the McGill University Health Centre, Montreal General Hospital, Montreal, QC, Canada
The ever-expanding availability and evolution of microscopy tools has enabled ground-breaking discoveries in neurobiology, particularly with respect to the analysis of cell-type density and distribution. Widespread implementation of many of the elegant image processing tools available continues to be impeded by the lack of complete workflows that span from experimental design, labeling techniques, and analysis workflows, to statistical methods and data presentation. Additionally, it is important to consider open science principles (e.g., open-source software and tools, user-friendliness, simplicity, and accessibility). In the present methodological article, we provide a compendium of resources and a FIJI-ImageJ-based workflow aimed at improving the quantification of cell density in mouse brain samples using semi-automated open-science-based methods. Our proposed framework spans from principles and best practices of experimental design, histological and immunofluorescence staining, and microscopy imaging to recommendations for statistical analysis and data presentation. To validate our approach, we quantified neuronal density in the mouse barrel cortex using antibodies against pan-neuronal and interneuron markers. This framework is intended to be simple and yet flexible, such that it can be adapted to suit distinct project needs. The guidelines, tips, and proposed methodology outlined here, will support researchers of wide-ranging experience levels and areas of focus in neuroscience research.
Introduction
Historically, neuroscientists have used microscopes to identify different cell types and determine their distribution in the nervous system. Analysis of cell types provides important information on neurodevelopmental processes and neurological disease states. There is a narrow range of acceptable variance in cell type density and distribution, outside of which is associated with neurological and neuropsychiatric disorders (Stoner et al., 2014; Bernard et al., 2017; DeTure and Dickson, 2019; Briscoe and Marín, 2020). Studies of this kind stemmed from the influential work of neuroscientists such as Ramon y Cajal, Golgi, del Rio-Hortega, and others, who provided the initial morphological descriptions of neurons and glial cells (Glickstein, 2006; Garcia-Lopez et al., 2010; Sierra et al., 2016). Since its inception, microscopic examination of the brain has evolved markedly. Transformative advances in immunostaining techniques, in situ omics technologies, cell-type specific transgenic reporter models, and microscope capabilities (Wilt et al., 2009; Daigle et al., 2018; Yuste et al., 2020) have not only expanded our understanding of the cellular composition of the brain in health and disease, but have also promoted the creation of highly diverse tools and approaches to analyze these types of data. As a result, there is significant variability in the processes used to generate data (e.g., density and distribution) on cell types in the brain, leading to significant challenges when it comes to integrating, interpreting, and reproducing published data (Martone et al., 2004; Geschwind and Konopka, 2009; discussed in Akil et al., 2011). To help mitigate these challenges, various groups have encouraged the adoption of open science frameworks rooted in the Findable, Accessible, Interoperable and Re-usable (FAIR) Data Principles (Wilkinson et al., 2016). Platforms and initiatives supporting open science dataset production and analysis, such as, WholeBrain, BrainGlobe, and Atlas Based Analysis (Niedworok et al., 2016; Fürth et al., 2018; Bourgeois et al., 2021; Tyson et al., 2021), have tremendous potential, yet are still somewhat lacking in accessibility (computing equipment and required expertise). With the on-going push from the neuroscience community to standardize the design, interpretation, and analysis of research studies, there is an unmet need for open science frameworks for experimental design and analysis of fluorescence microscopy images (Bernard, 2019; Picciotto, 2020).
To this end, we provide a framework for neuroscientists of varying expertise and area of research focus rooted in open-science principles and user-friendly resources. We highlight the standard steps and consideration of a research study investigating cell-types in mouse brain, including: statistical power and sample size estimation (Button et al., 2013; Picciotto, 2020), selection of control groups (Tye, 2018; discussed in Picciotto, 2019), sex and genetic background (Kiselycznyk and Holmes, 2011; Vanden Berghe et al., 2015; McCarthy et al., 2017; Luo et al., 2020), image acquisition and processing (Aaron and Chew, 2021; Heddleston et al., 2021), and data visualization and statistical analysis (Calin-Jageman and Cumming, 2019) (Figure 1). Moreover, we provide a step-by-step FIJI-ImageJ image analysis workflow to quantify cell density in the mouse brain sections. Altogether, this work aims to serve as a ‘starter guide’ for facilitating systematic and programmatic analysis approaches and promoting the benefits of open science frameworks in neuroanatomical cell type quantification in mouse brain.
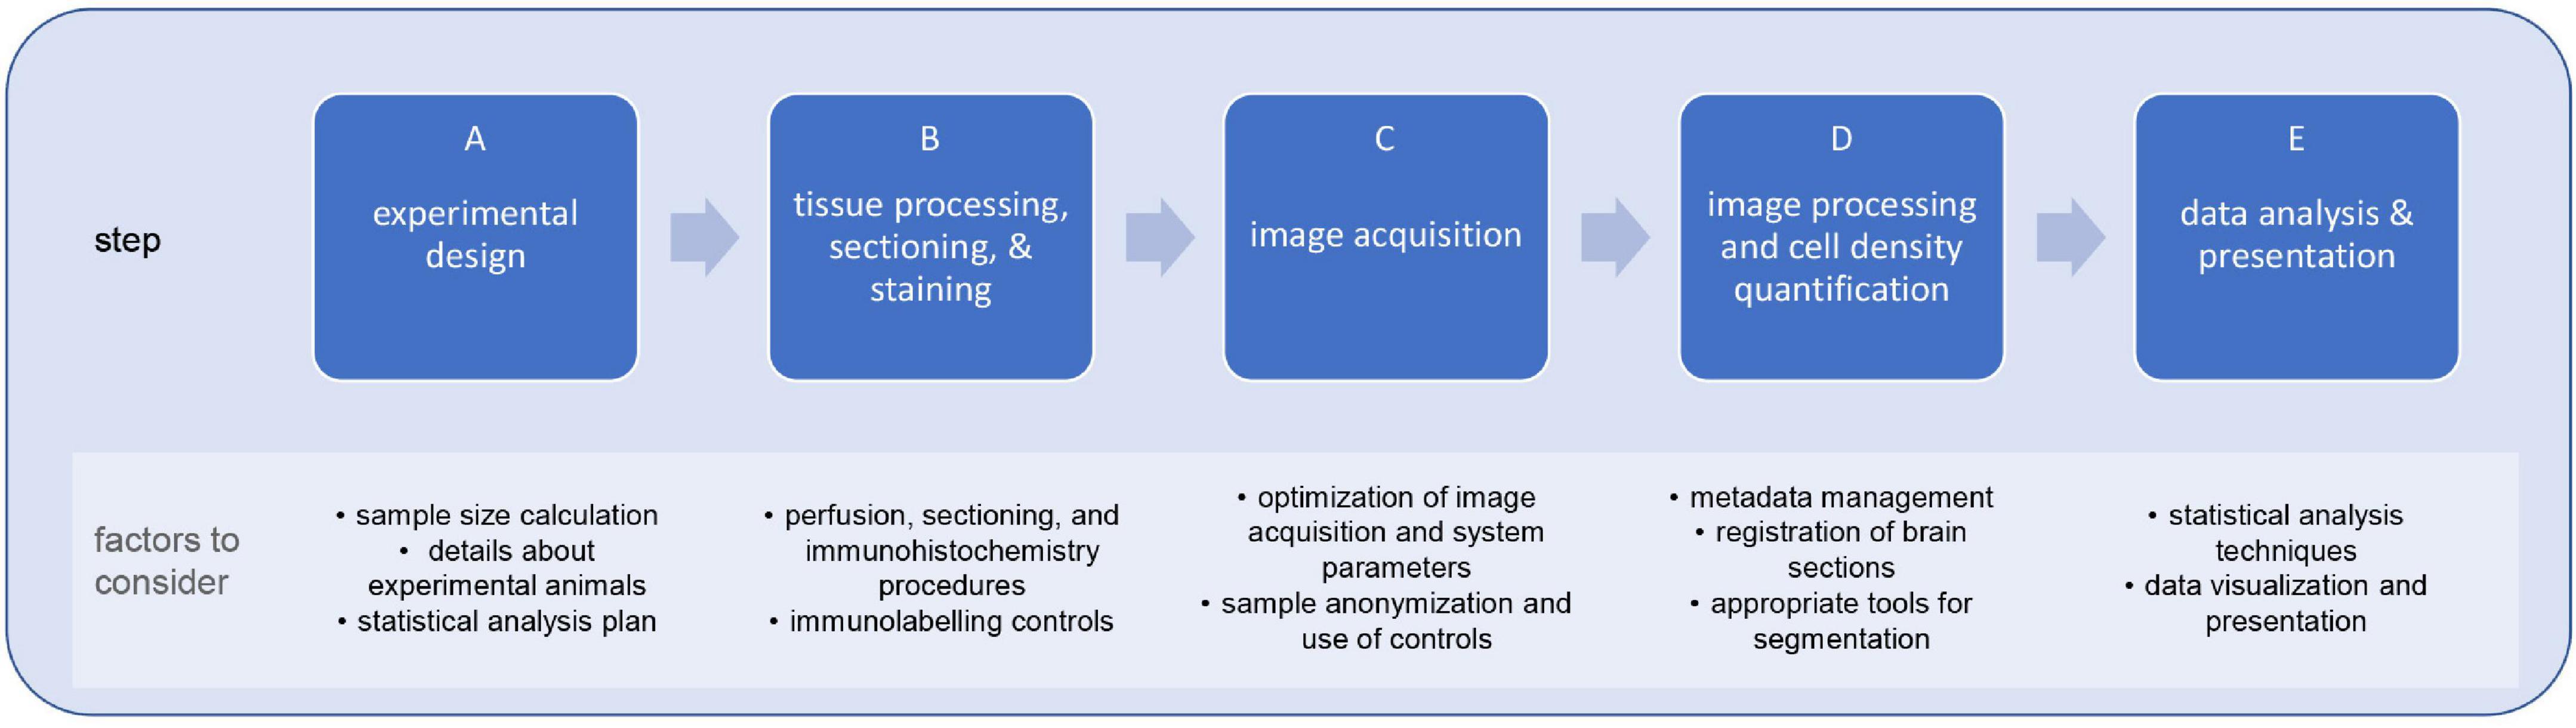
Figure 1. Steps and limiting factors involved in planning and executing a research study on cell-type quantification in brain sections. Research studies for the quantification of cell-types in the mouse brain are sequential multi-step processes (A–E), each with their own limiting factors. By formulating this type of studies within a systematic framework, researchers can mitigate such limiting factors and, consequently, increase the reliability, reproducibility, and usability of study outcomes.
Methods and Results
In the following section and subsections, we will outline and discuss important aspects that aid in systematic and open-science-based design, execution, and reporting of quantification of cell types in mouse brain sections. Within this, we include a FIJI-ImageJ-based workflow to register brain section images, segment region of interest and quantify cell types in them.
Experimental Design
A critical, often overlooked, first step in a study aimed at quantification of cell-types in the mouse brain, is detailed experimental design development. Experimental design is not only the planning of experimental procedures, but also the consideration of study design (e.g., groups to compare, selection of control groups, and determination and balanced allocation of experimental units), sample size determination (e.g., number of experimental units per group, a priori sample size calculations), strategies to mitigate bias (e.g., objective inclusion/exclusion criteria, randomization, identity concealment), details about experimental animals (e.g., species, strains, and substrains, sex, age or developmental stage), experimental procedures (e.g., description of the intervention, timing, location, and rationale), and the statistical analysis plan, expected outcomes, and delivery of results (e.g., presentation of summary and descriptive statistics, measurements of variability, and effect size with confidence intervals when applicable). The steps mentioned above are included in the “Essential 10” item list developed as part of the Animal Research: Reporting of in vivo Experiments (ARRIVE) guidelines (du Sert et al., 2020a,b). These guidelines were designed to help researchers identify key reporting information for animal research, with the aim of increasing reproducibility. Moreover, a well-designed experimental animal study can reduce the number of animals required, and refining experimental procedures can minimize their adverse effects (Festing and Altman, 2002). Studies on mouse brain cell-type densities should include balanced experimental groups with adequate numbers to detect differences between such groups, whilst acknowledging and accounting for strain issues, and sex differences.
In terms of the calculations involved in determining animal numbers within experimental groups, we support the recommendations given in recent editorials in The Journal of Neuroscience and eNeuro (Bernard, 2019; Picciotto, 2019, 2020), for the integration of pilot experiments and power analysis to calculate sample sizes, with the goal of increasing statistical power (defined as 1 – β, where β is the probability of a type II error or, in other words, the probability of accepting a null hypothesis that is actually false – i.e., the false-negative rate–) and consequently increasing the reliability of observed results (Picciotto, 2020). Fortunately, estimating sample size by power analysis is possible with openly available online tools1,2 or free statistical software (e.g., R and the package “pwr”) but require researchers to determine the effect size via pilot studies or previous reports. An alternative can be found in the “resource equation” (Equation 1). The resource equation is based on the notion that a good estimate of error requires at least 10 degrees of freedom (defined as experimental units – 1) (Mead, 1988; Mead et al., 2012; Festing, 2018) and becomes particularly useful when an effect size cannot be determined through pilot studies or approximated from previous literature.
Using this approach and considering the relationship between sample size, power, and effect size (Ellis, 2010; Festing, 2018), researchers can obtain a predicted effect size for a given provisional sample size. From here, given that statistical power increases with size and effect size, the sample size can be adjusted until reaching an effect size that is reasonably acceptable or detectable (Supplementary Figure 1) (Ellis, 2010; see Table 1 in Festing, 2018). For example, if researchers plan to detect the differences of a given cell-population between two genotypes (i.e., 2 groups), they will require between 12 and 22 total animals (i.e., 6–11 animals per genotype). The same researcher could use a plot (Supplementary Figure 1) or table showing the relationship between sample size and standardized effect size to learn the statistical power in the example above.
In terms of proper consideration of the impact of mouse strain (and substrain) genetics and sex, it is important to recognize and mitigate the genetic and phenotypic variation present across and within mouse strains, as reviewed by Chen and Flint (2021) and Shansky and Murphy (2021). For example, it is well-established that C57BL/6, an inbred strain of mice frequently used as wildtype controls, is phenotypically distinct between substrains (e.g., C57BL/6J, C57BL/6N, C57BL/6NTac, and C57BL/6NCrl), highlighting the need to carefully check the mouse transgenic strains (and substrains) in experimental group allocation (Crawley et al., 1997; Beck et al., 2000; Matsuo et al., 2010; Kiselycznyk and Holmes, 2011; Zurita et al., 2011; Kang et al., 2015). These groups must be balanced (i.e., equal numbers of experimental animals per group) and include both sexes whenever possible (Beery and Zucker, 2011; McCarthy et al., 2017; Mamlouk et al., 2020; Woitowich et al., 2020; Shansky and Murphy, 2021). We recommend that researchers refer to the Mouse Genome Informatics website3 for precise information (e.g., nomenclature, strain-specific single nucleotide polymorphism, phenotypes, gene expression, and Cre-recombinase activity), especially ‘‘Me-PaMuFind-It’’4 to identify potential 129S-derived mouse strain passenger mutations (particularly if the strain has not been backcrossed substantially). Consistent use of these resources is critical to prevent and mitigate possible confounds secondary to germline recombination (Luo et al., 2020) and passenger mutations (Vanden Berghe et al., 2015).
With respect to statistical analysis, we support the call for a shift from hypothesis-testing-based statistics toward the more widespread adoption of estimation statistics (Bernard, 2019; Calin-Jageman and Cumming, 2019). Null hypothesis significance testing has been the main framework used by researchers to make predictions of a population from observations of representative sample (McDonald, 2014). Within this framework, observations are measured, summarized, and a p-value is estimated to declare whether there are “statistically significant” differences based on a p-value threshold established, somewhat arbitrarily by RA Fisher (1956), at 0.05 (Gelman and Stern, 2006). On the other hand, estimation statistics emphasizes effect sizes and measures of uncertainty, providing a quantitative assessment of observed differences (and their variability) rather than a binary outcome (i.e., statistically significant vs. not statistically significant) (Calin-Jageman and Cumming, 2019; Wasserstein et al., 2019). While biomedical animal research has heavily relied on null hypothesis significance testing (Gigerenzer, 2018), strong cases have been made that estimation statistics approaches improve interpretation of results (by presenting effect sizes, confidence intervals, and data distribution), tackling overconfident interpretations based on a p-value threshold, and consequently, improving statistical inference (Calin-Jageman and Cumming, 2019; Bernard, 2021). Moreover, establishing a statistical plan before data is collected and that is complemented by the use of estimation statistics can contribute to prevent malpractices such as “harking” or “p-hacking,” which refer to hypothesizing after the data is known, and selecting statistical tests according to the outcome of a study, resulting in ill-bias and interpretation errors when reporting the outcomes of a study (Kerr, 1998; Head et al., 2015; Picciotto, 2018, 2020; Bernard, 2019). Another editorial called for the adoption of analyses using estimation statistics with the goal of improving the interpretation of results (by presenting effect sizes, confidence intervals, and data distribution), tackling overconfident interpretations based on a p-value threshold, and consequently, improving statistical inference (Bernard, 2019, 2021; Calin-Jageman and Cumming, 2019).
Tissue Processing, Sectioning, and Staining
Accurate quantification of cell types in mouse brain sections requires consistent and optimal tissue preparation. Preserving the integrity of the cellular and extracellular components is often accomplished by perfusing an animal with a buffered solution followed by a fixative solution (Gage et al., 2012). Fixatives are typically diluted in a buffered physiological solution (for example, 4% paraformaldehyde diluted in phosphate buffered saline) and the selection of a specific fixative should be tailored to subsequent histological processing and intended applications (Gage et al., 2012; Zhang and Xiong, 2014). Similarly, controlling the flow (by using a peristaltic pump or a simple gravity feed) and temperature of a fixative and assigning tissue extraction and dissection to trained personnel are important aspects that contribute to consistency across samples (Paul et al., 2008). For example, delayed perfusion of fixative (∼5–8 min delay between the initial cut of the diaphragm and the time of visible clear paraformaldehyde outflow) can alter the distribution and detectability of proteins, resulting in inaccurate quantification when compared to fully perfusing an animal within 100 s from cutting the diaphragm (Tao-Cheng et al., 2007). Likewise, whole body perfusion using 4% paraformaldehyde without perfusing first a buffered solution can lead to aberrant vacuolation of neuronal somas (Leonard et al., 2016). The type of fixative used, and its concentration depend on downstream applications. For example, synaptic proteins are sensitive to paraformaldehyde perfusion (Wallrafen et al., 2019), lipophilic dyes required lower concentrations of paraformaldehyde (1.5% or 2%) (Li et al., 2008; Rasia-Filho et al., 2010; Staffend and Meisel, 2011). Glyoxal is known to nicely preserve cellular structures such as actin filaments and microtubules (Jones, 1969). Glutaraldehyde produces higher autofluorescence and irreversible cross-links of proteins (whereas paraformaldehyde does not), acrolein cross-links at higher rate than paraformaldehyde and rapidly penetrates tissues (Jones, 1969), while methanol leads to a fast fixation with loss of organelles (Spector and Goldman, 2006; Richter et al., 2018; Celikkan et al., 2019; Yao et al., 2021). Furthermore, certain paradigms use drop fixation in place of perfusion (limited to 1 mm/per hour of penetration) which causes differences in glial cell morphology (Cǎtǎlin et al., 2017). Because the effects of the above sample preparation profoundly impact downstream analyses (Pereira et al., 2019), we recommend researchers to adopt a quality control checklist. In Supplementary Table 1 (“Tissue processing”), we present an example of such list and provide recommendations. Needlessly to say, the information within the checklist also serves as a useful record of important items to include when reporting a study.
Similarly, it is important to provide details of procedural steps related to sectioning, such as equipment type (e.g., vibratome, cryostat, or freezing microtome), orientation and thickness of sections, embedding medium, use of cryoprotective and preservative reagents, and if sections have been air-dried, all which can impact the quality of immunohistochemistry labeling and morphological metrics (Bacallao et al., 2006; Spector and Goldman, 2006; Estrada et al., 2017). Additionally, details of immunohistochemistry procedures such as use of permeabilization, blocking, labeling, and mounting agents, and their respective incubation/application time should all be included within the ‘‘Methods And Results’’ section. Researchers should use research identifiers (RRID5) for all reagents, particularly dyes and antibodies, and note subsequent manipulations (e.g., adding glycerol to antibodies, diluting dyes in methanol, sonication, etc.) in their Methods. Lastly, the researchers are recommended to include information on immunolabeling controls, such as antigen positive and negative controls, background controls, and reagent controls (Spector and Goldman, 2006; Lee and Kitaoka, 2018; Jonkman et al., 2020).
Image Acquisition: Brief Overview of Foundations and Best Practices
A solid theoretical and practical foundation in light microscopy is vital to carry on reproducible and replicable microscopy-based studies (Thorn, 2016; Lee and Kitaoka, 2018). Numerous factors, if poorly understood or not properly considered, can result in inadequate image quality and variability in measurable outcomes (Aaron and Chew, 2021; Heddleston et al., 2021). For example, limited understanding of the diffraction limit in optical systems and the relationship between an objective numerical aperture (NA = n*sinθ, where n is the refraction index of the medium, θ is the half-angle of the cone of light which can be collected by the objective lens, and NA is numerical aperture) and resolution () can result in acquisition of poorly resolved images. This issue can be solved by optimizing image acquisition to follow the Nyquist sampling principle, in which (for an optical system) the pixel size should be at least two to three times smaller than the resolvable element to capture at the full resolution of the objective (Pawley, 2006; Thorn, 2016; Jonkman et al., 2020). Free online resources such as iBiology Microscopy Series which hosts lectures, virtual laboratories, and self-assessments offer a comprehensive review of the fundamentals of optics and microscopy6, facilitating learning and providing a reference resource to junior and senior researchers. For example, a factor such as brain section thickness plays a critical role in selecting the appropriate type of microscope for a given study: widefield microscopes perform best with sample thickness of 20 μm or less, while spinning-disk and confocal laser-scanning microscopes perform well with a sample thickness between 30 and 50 μm and up to 200 μm, respectively, thanks to their improved resolution in the z-axis (depth) (Thorn, 2016). Likewise, recent advances in technology, such as light-sheet microscopy and tissue clearing, can offer excellent performance to quickly image large volumes (Keller and Ahrens, 2015; Susaki and Ueda, 2016; Thorn, 2016); while this technology is not yet widely available and requires intricate sample preparation protocols, it holds terrific potential as engineering and optic development continue to improve its resolution and usability by non-optic specialists (Mano et al., 2018; Albert-Smet et al., 2019; Lu et al., 2019).
Robust microscopy imaging acquisition incorporates mitigation of confirmation bias, through, for example, sample anonymization, allocation concealment, and use of controls. Imaging acquisition parameters should be established using a positive control (e.g., a sample in which the protein of interest is known to be expressed) and be tested on a negative control sample (e.g., a sample from tissue that does not express the protein of interest, or a sample that was not incubated with the labeling reagent). The parameters should allow the researcher to perform image acquisition using as much of the dynamic range of the detector as possible (North, 2006). Imaging parameters should be optimized to prevent oversaturation or undersaturation, as both of these represent loss of information, and therefore data (however, note that it is critical to extract the background before conducting any quantitative image analysis) (Brown, 2007). Fortunately, many modern-day microscopes and their software suites offer options to visualize, in real time, the intensity distribution of a given image using histograms and high/low or range finder look-up table (LUT), but even when using systems that do not offer these options [for example, do-it-yourself microscope systems for research and education (Gibbs et al., 2018; Grier et al., 2018; Flores and Marzullo, 2021)], open source tools such as FIJI/ImageJ can be used to assess these parameters (Schindelin et al., 2012). Once the parameters have been established, these should be kept constant throughout an experiment (North, 2006). Lastly, acquisition parameters should aim to maximize the signal-to-noise ratio, the relationship between actual signal and background signal. While acquisition parameters can significantly influence signal-to-noise ratio, additional aspects such as the sample preparation, selection of high quantum yield labels, type of sensors and their gain, selection of objectives, and environment (e.g., temperature and vibration) can have an effect (Ogama, 2020). Note that increasing the gain of a sensor does not improve signal-to-noise ratio, as it increases the detection of both the actual signal and background. To increase signal-to-noise ratio with a properly prepared sample using optimized fluorescence labels, one can increase the exposure time or use stronger excitation (higher laser power); however, both of these strategies result in increased phototoxicity and photobleaching (Ogama, 2020). Table 1 summarizes some of the factors that influence signal-to-noise ratio.
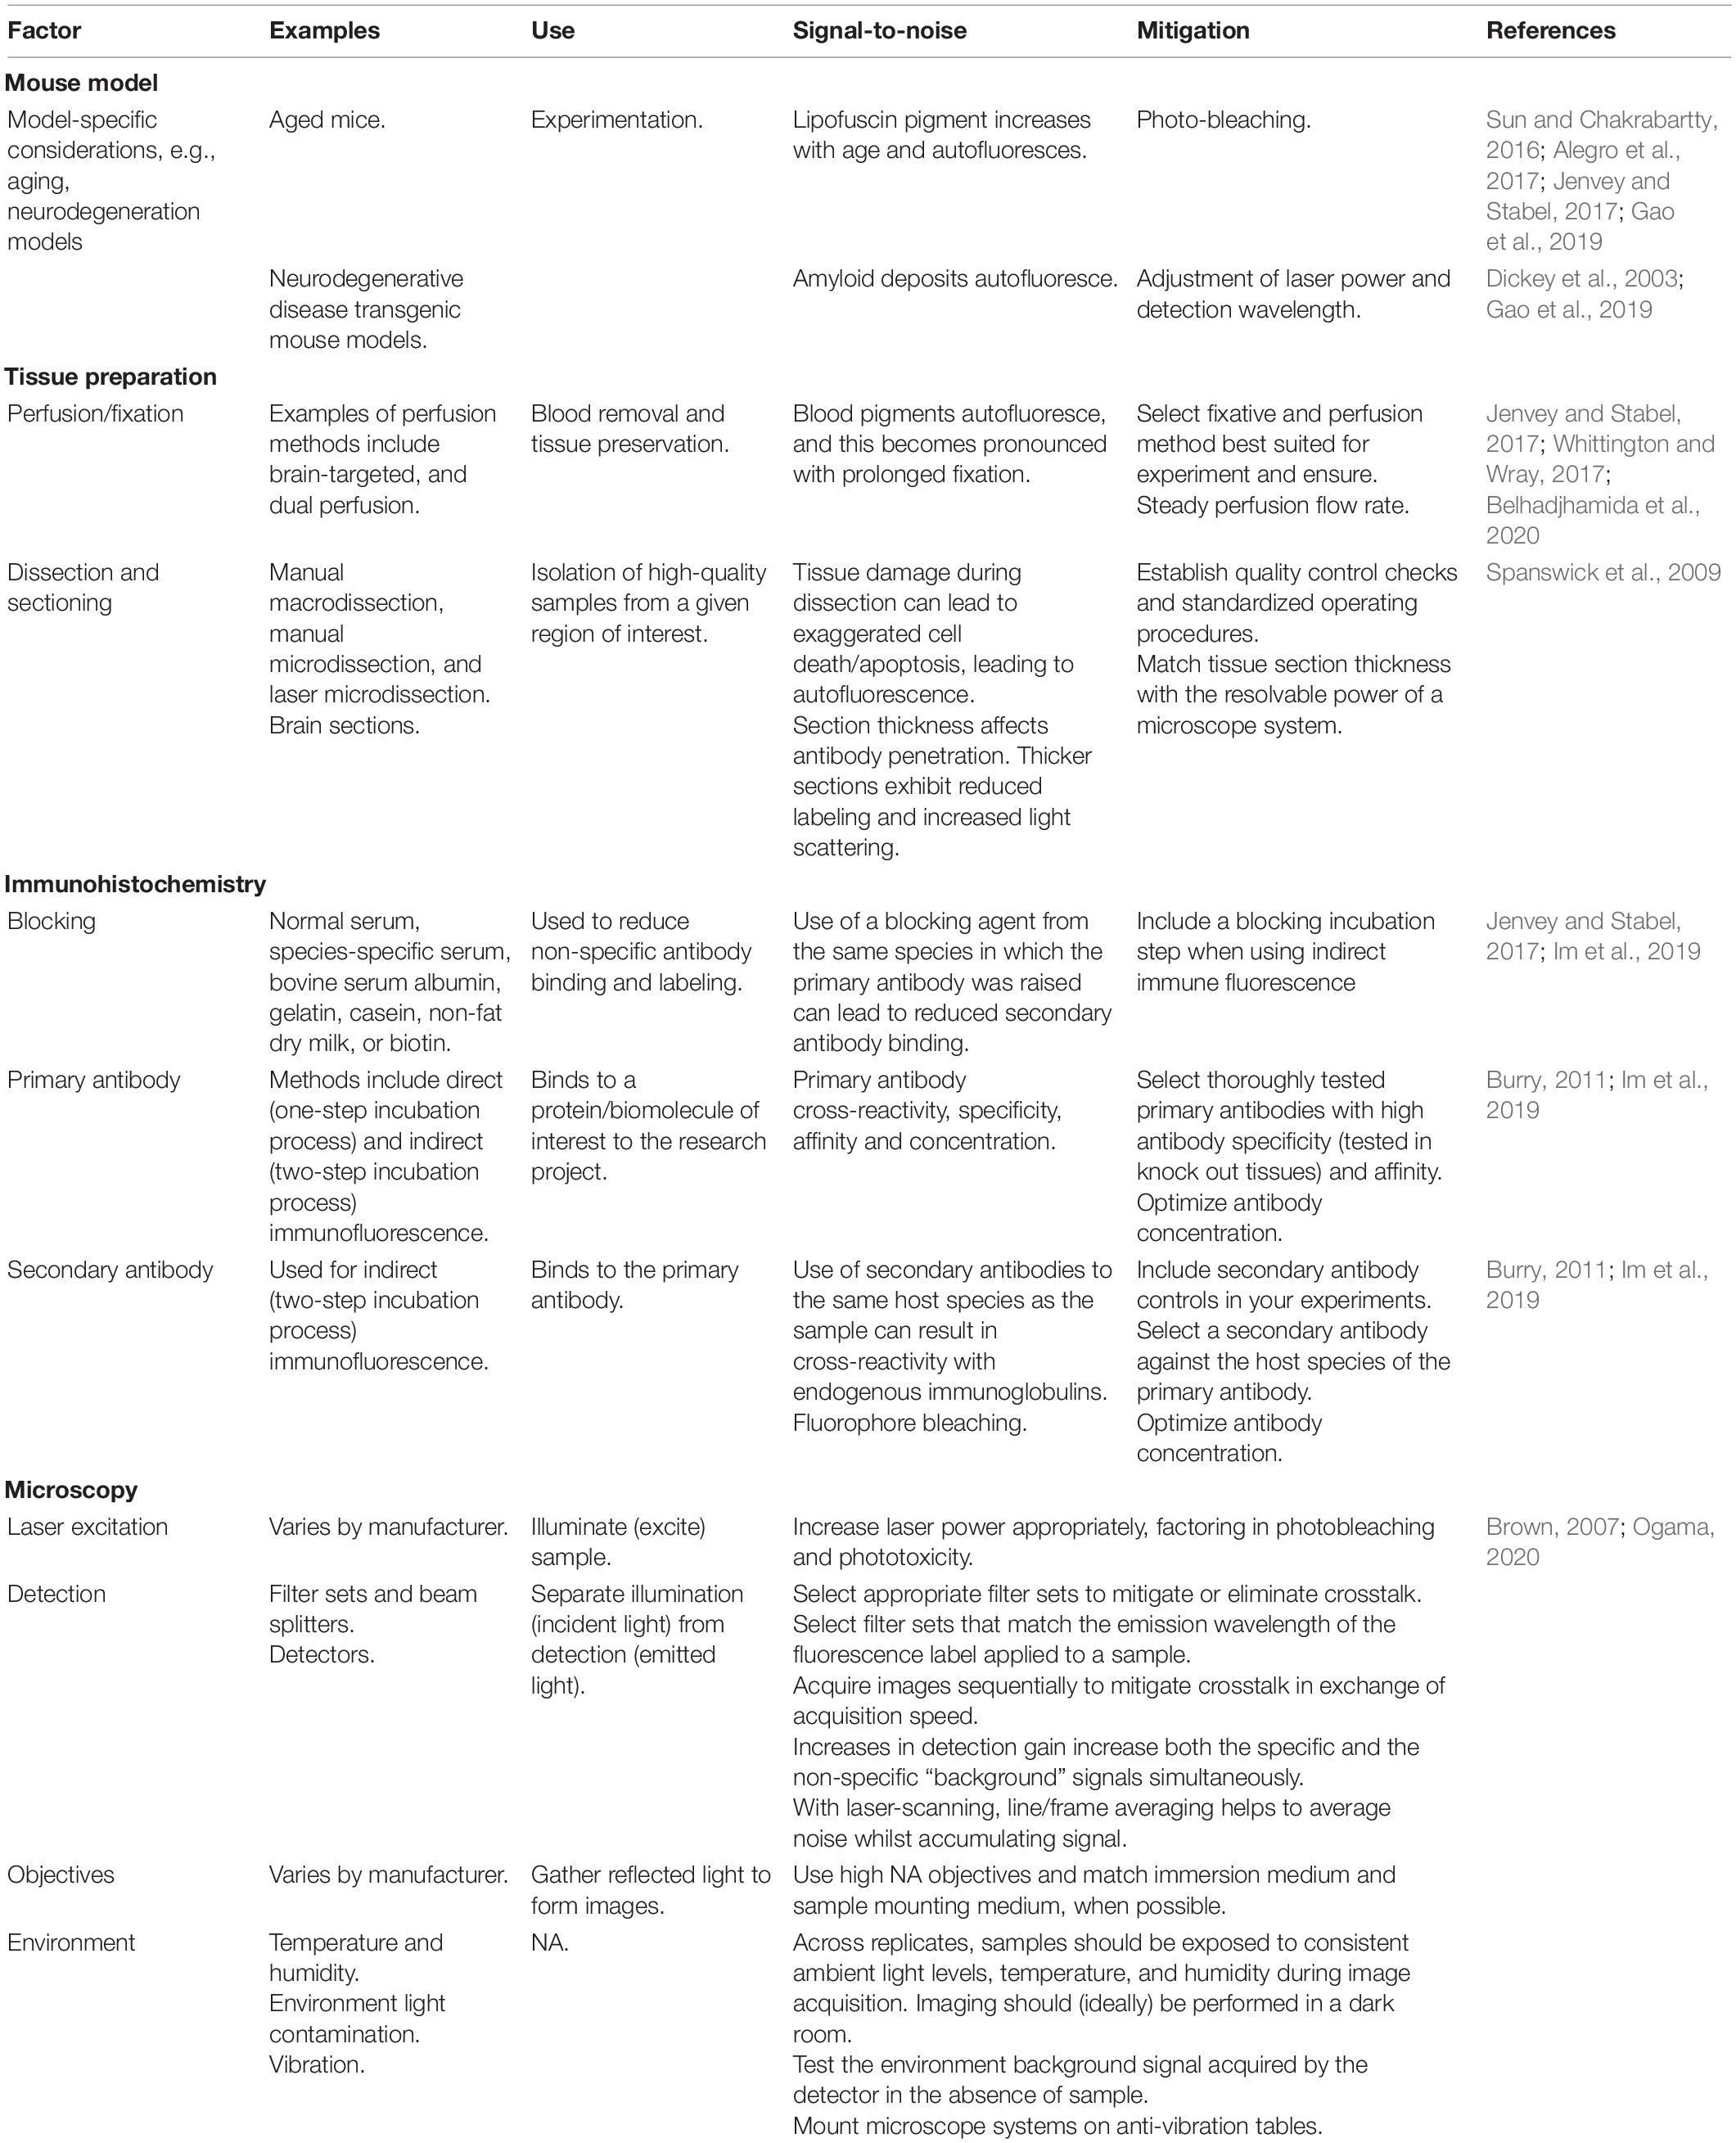
Table 1. Overview of factors that affect the signal-to-noise ratio (SNR) in fluorescence imaging.
Lastly, a key area for improvement in published microscopy-based studies is the reporting of imaging methods. A recent analysis of 240 original research articles published in 8 different journals revealed that imaging methods were only included in approximately 5% (range 2.3–10.2%) of biomedical research papers. Moreover, less than one-fifth of the studies provided sufficient details on imaging methods (Marqués et al., 2020), such as imaging acquisition parameters and the collection of metadata (Linkert et al., 2010; Huisman et al., 2021). Fortunately, various resources exist in the form of reviews that provide great recommendations on how to improve rigor in acquiring, reporting, and analyzing (discussed in following sections) microscopy data (Lee and Kitaoka, 2018; Aaron and Chew, 2021; Heddleston et al., 2021). Table 2 includes a set of recommended image acquisition parameters to be reported to promote reproducibility and replicability.
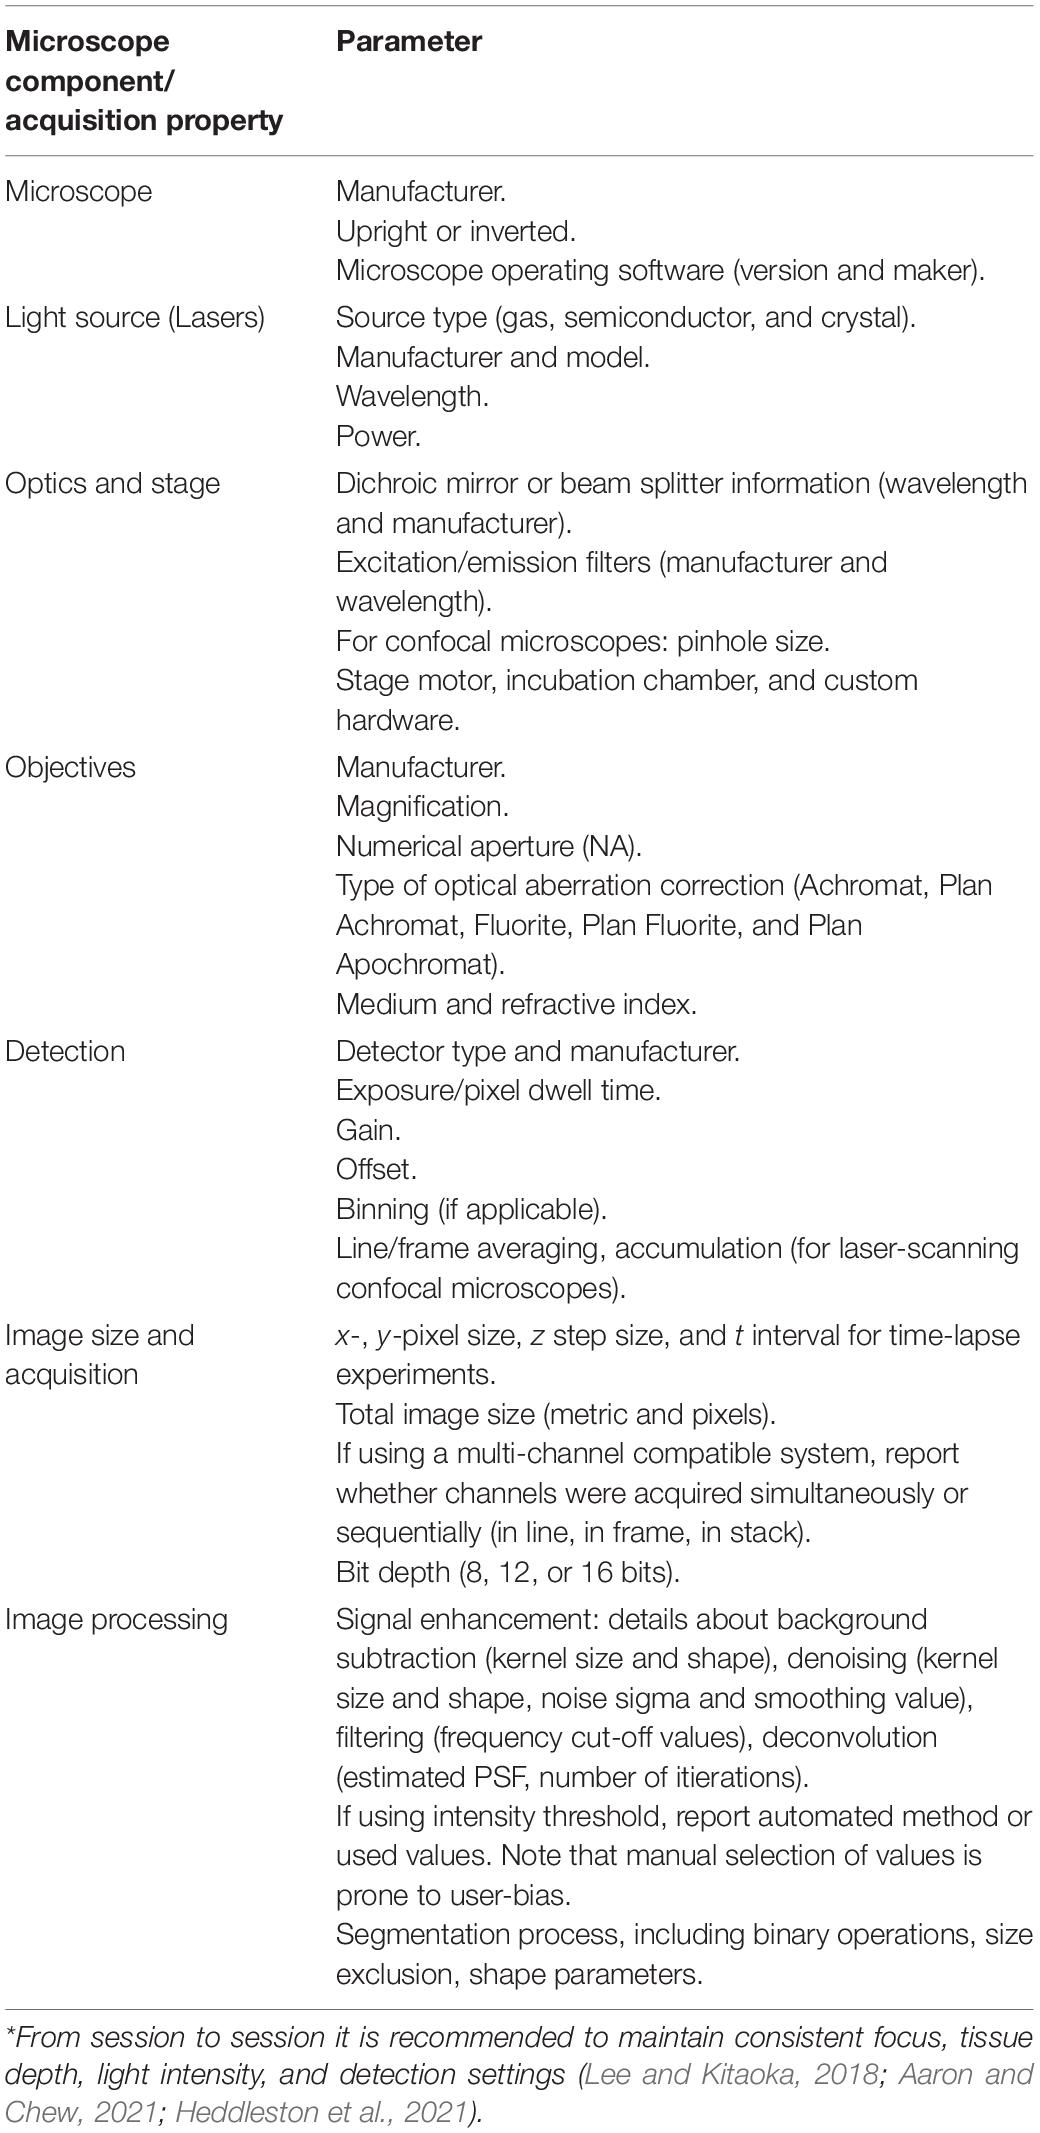
Table 2. Methodological image acquisition parameters to report in scientific publications*.
Framework for Image Processing and Cell Density Quantification in Brain Sections
To increase data reproducibility, various institutions (e.g., funding body, journal requirements, and international collaboration consortiums) have promoted an increased use of quantification in fluorescence microscopy studies (Aaron and Chew, 2021). Earlier neuro-morphometric studies relied on stereology as a method to mitigate variability and inconsistencies (Haug, 1986; Zhao and van Praag, 2020) within small regions; however, newer advances and initiatives permit the quantification of cell density across large regions and even the whole brain at an unprecedented speed. In this regard, neuroscience-specific initiatives, such as the Brain Initiative’s functional connectome project, the Allen Brain Institute Reference Atlas, WholeBrain, and BrainGlobe provide excellent resources and tools (Fürth et al., 2018; Anderson et al., 2021; Claudi et al., 2021). However, barriers such as user-friendliness, proficiency in programming languages, and other inherent restrictions – for example, the requirement for large whole brain section images – still limit the wide application of many of these tools. While image analysis tools continue to evolve and become flexible to a wider range of researchers’ experimental needs and resources, FIJI-ImageJ continues to be the most commonly used image analysis suite, including for the analysis of cell population quantification in brain sections (Schindelin et al., 2012; Bourgeois et al., 2021). For example, Bourgeois et al. (2021) recently proposed a FIJI-ImageJ-based semi-automated atlas-based workflow to obtain cell counts from mouse brain sections using the Paxinos and Watson rat brain atlas for anatomical reference (Paxinos and Watson, 2006), resulting in decreased inter-observer variability and a faster generation of data. However, this workflow is limited by the use of the adult rat brain anatomical reference to register mouse anterior–posterior coordinates and relies on manual tracing to outline regions of interests within cortical (i.e., cortical layers) and subcortical regions, which is prone to technical and human error. With the above in mind, we have developed a simple, adaptable, semi-automated framework prioritizing ease of use, metadata and data management, image quality control, registration to a unified mouse atlas, expandability, and implementation of a machine-learning tool for feature extraction and segmentation (“StarDist”). In the following sections we will describe the steps necessary to use our FIJI-ImageJ based framework to quantify cell density in mouse brain sections.
Loading Image Data
To begin using our image processing and analysis workflow the user first runs a file management script (step 17) and loads their image files into FIJI-ImageJ. This script takes image series stored in a proprietary file format (e.g., “.lif,” “.czi,” and “.oir,” for Leica Microsystems, Zeis Microscopy, and Olympus Microscopy, respectively) and exports these image series in a “.tif” (a file format that complies to FAIR specifications, (Wilkinson et al., 2016; Swedlow et al., 2021). Files are organized into an “output” folder, comprising subdirectories for each image series and subsequent associated files. Multi-channel image series containing z-sections are automatically split into individual channels along with the generation of their maximum intensity projections, including a channel-merged image file. For each image channel, a pixel intensity frequency table is generated and stored (as a “.csv” file) within its respective image series subdirectory. This pixel intensity frequency table can help users assess the distribution of pixels within the image and detect images with over-representation of over-saturated or very dark pixels that might not be fully suitable for further image processing (Brown, 2007). Moreover, this table can be further analyzed using online tools such as ‘‘ggPlotteR’’8 or “PlotsofData” (Postma and Goedhart, 2019). Lastly, the macro also calls a function to extract and store metadata for each opened image data series as “.csv” files (Linkert et al., 2010; Huisman et al., 2021).
Registering Brain Sections
The mouse brain section registration in our proposed semi-automated image analysis framework is based on a freely available enhanced and unified atlas generated by Dr. Yongsoo Kim’s laboratory at Penn State University9 (Chon et al., 2019), which merges the coordinates and labels from the mouse stereotactic atlas by Franklin and Paxinos (2008) with those from the Common Coordinate Framework developed with the Allen Brain Institute Mouse Reference Atlas (Sunkin et al., 2012; Kuan et al., 2015). This unified atlas was refined using magnetic resonance imaging in male and female Ai14 reporter mice at 2–3 months old. Using a unified atlas for image registration is expected to facilitate data integration and cross-analysis of datasets with other open-science data resources (e.g., transcriptomic and electrophysiologic data) generated by institutions (e.g., the Allen Brian Institute) and researchers, while preserving the familiarity of the Franklin and Paxinos coordinate system.
Similar to Bourgeois et al. (2021), upon matching an image series with an anteroposterior coordinate, the user can download the corresponding image from the unified atlas generated by Yongsoo Kim’s laboratory at Penn State University [see Text Footnote 9; (Chon et al., 2019)] and process the included .ai file with a vector graphic software, such as Inkscape (free open source software by The Inkscape Project) or Adobe Illustrator (licensed by Adobe Inc.) to export the included outline as a ‘‘.png,’’ a compatible file format for FIJI-ImageJ. Using our second macro (step 210) the user can upload and deform (“warp”) the “.png” file containing the outline following the imaged brain section with FIJI’s ready-to-use plugin “BigWarp” (Bogovic et al., 2016), and binarize the files within FIJI-ImageJ (Figure 2A). For this process, with the two images side-by-side (we recommend using a strong nuclear stain, such as Hoechst for this step), the user can place landmarks (15–20; landmarks can be managed with the “Landmark Analyzer”) using characteristic anatomical features such as the lateral ventricles, corpus callosum, and boundaries of the dorsolateral cortical surface (Figures 2A,B). To note, the warping process can create 1–5-pixel gaps on the outline, which requires the addition of a border and small adjustments using FIJI-ImageJ’s “Brush tool” to close such gaps and prepare the “warped” image for further processing. Once this step is complete, the user can use FIJI’s “Wand tool” to select their target region of interest. For example, a user can select individual layers within the barrel cortex and transfer them to FIJI’s “ROI Manager” or create a full depth cortical selection of the barrel field by selecting and combining all layer regions of interests using FIJI’s “OR” function (Figure 2B, bottom half). The area of the selected region of interest is then calculated and stored as a “.csv” file.
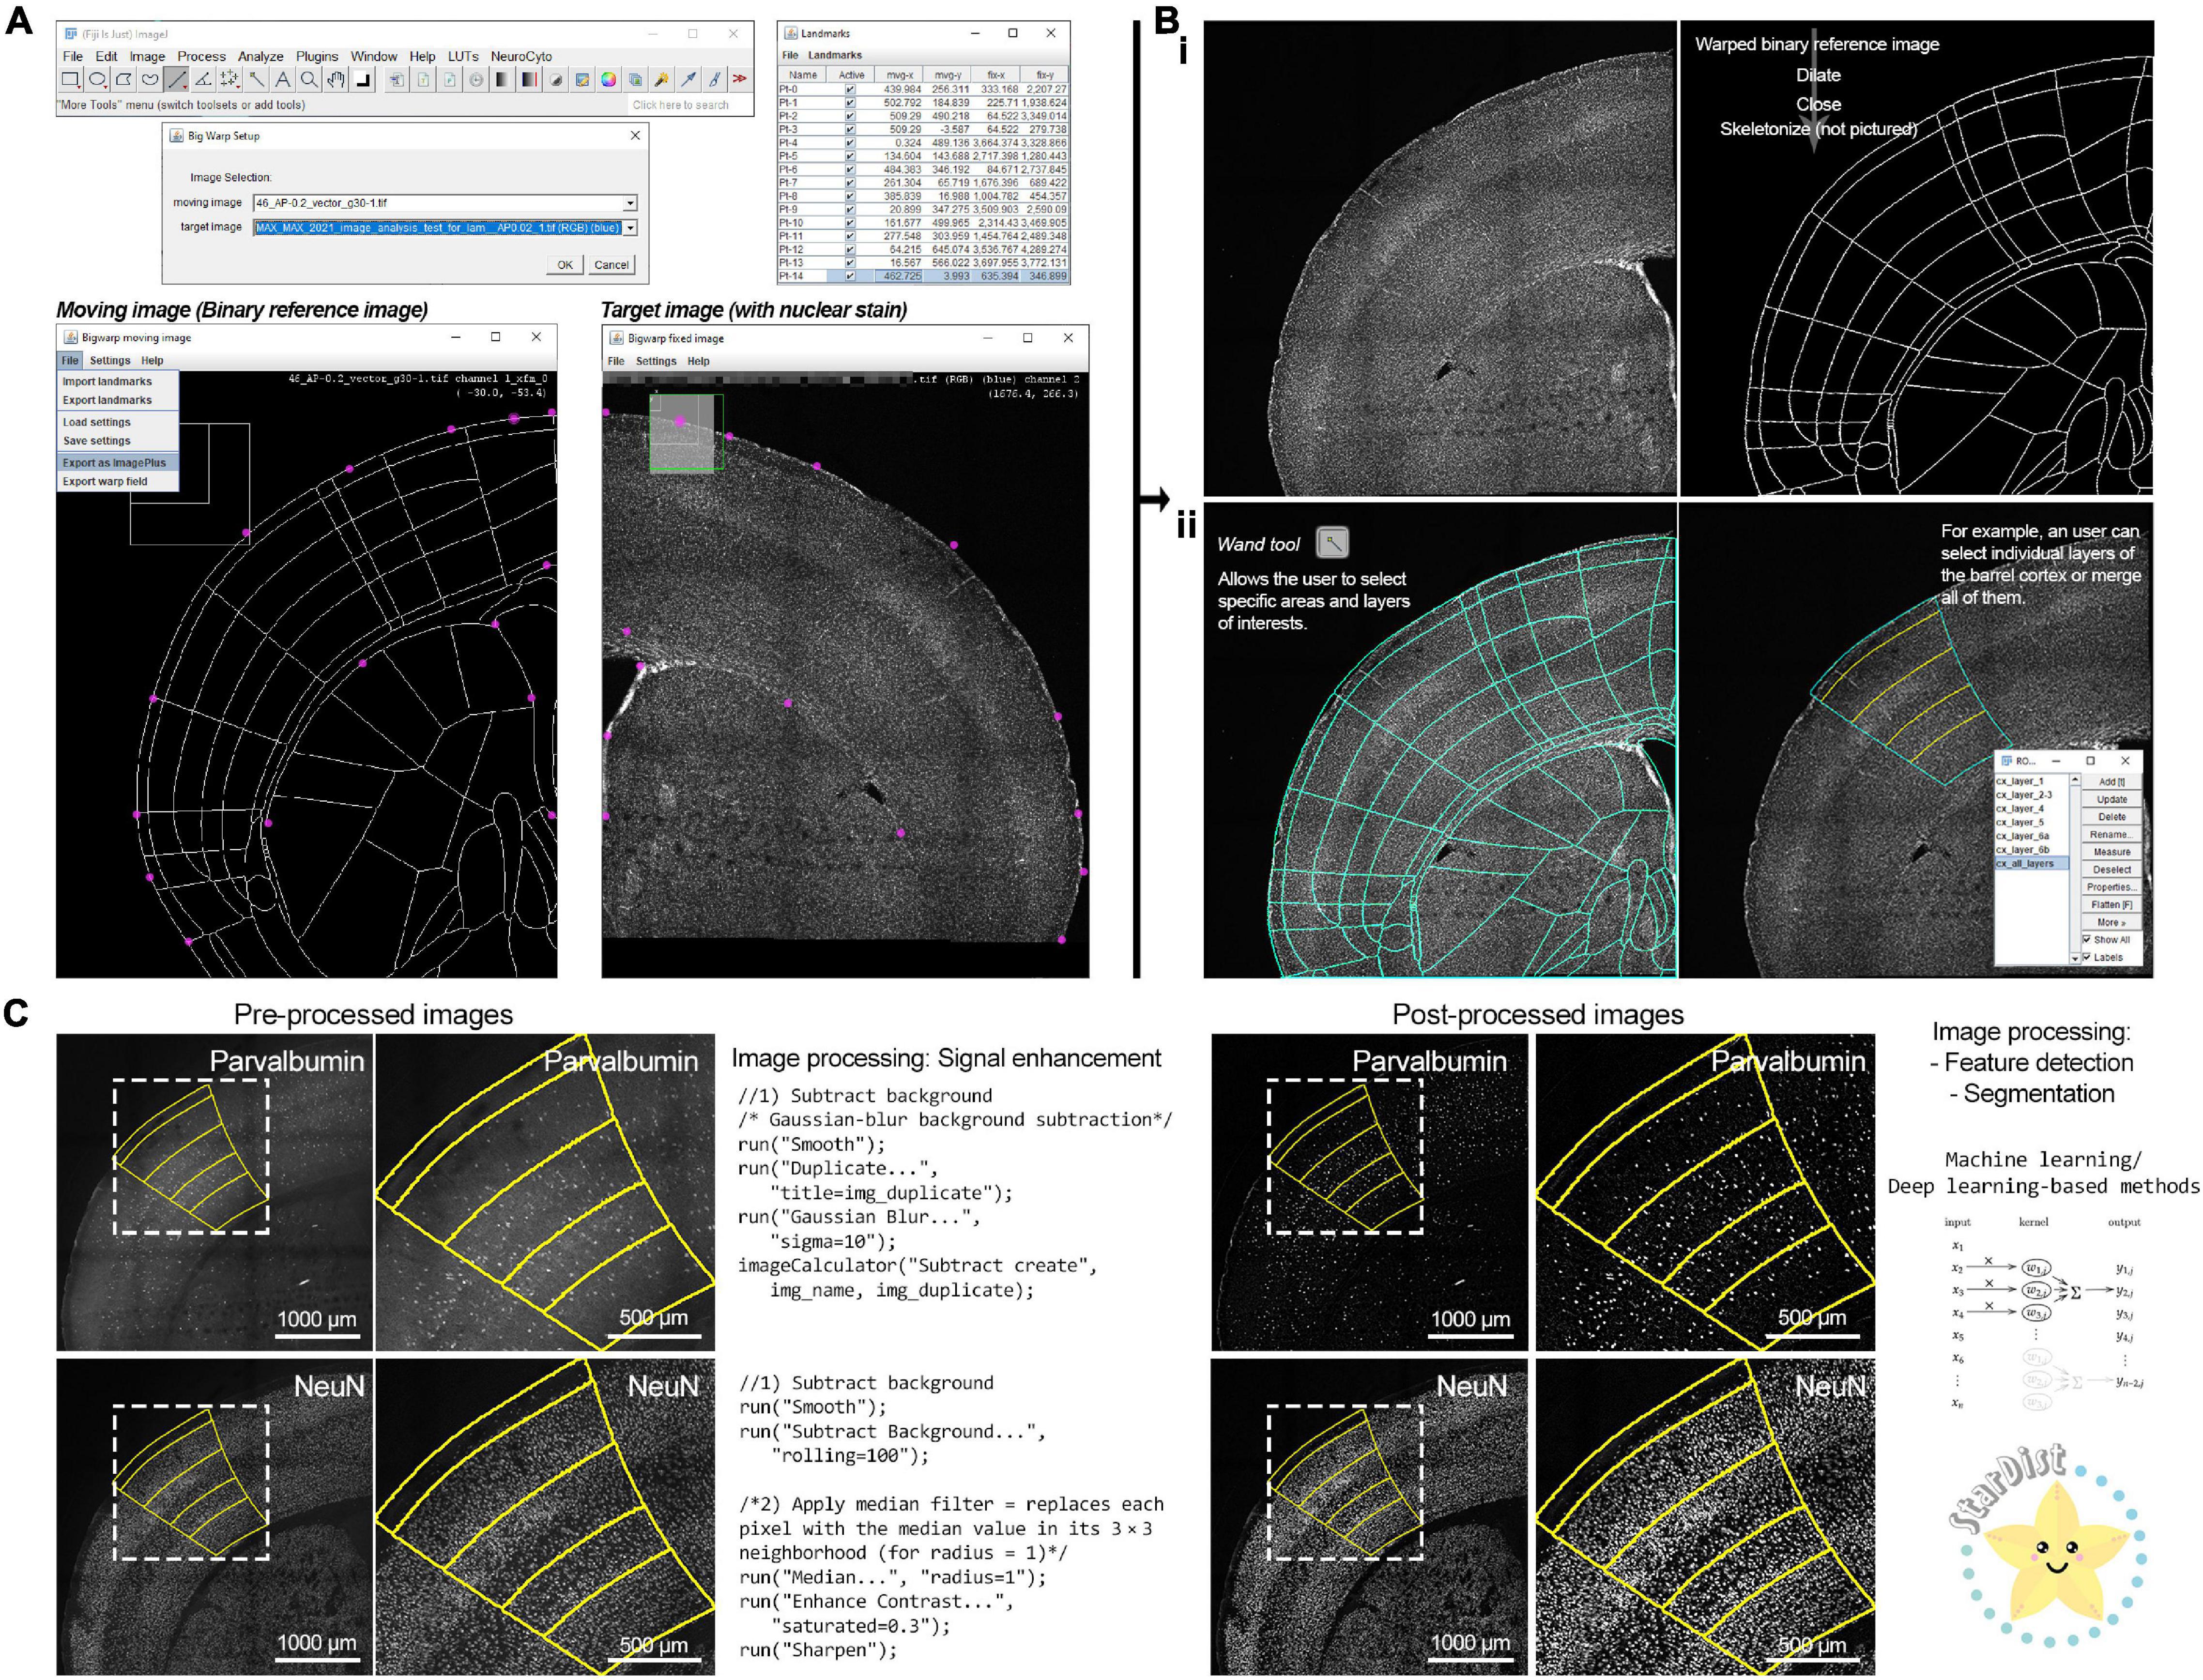
Figure 2. A FIJI-ImageJ based workflow for registration and image processing of mouse brain sections. (A) Brain section images can be registered to a unified atlas using the FIJI-Image-J plugin “Big Warp.” Using a nuclear stain (such as Hoechst) facilitates the placement of anatomical landmarks to adjust the reference atlas outline to the brain section image. (B) (i) The “warped” reference atlas outline can be converted into a binary mask. (ii) By binarizing the reference atlas outline, the user has the ability to select specific anatomical regions of interest (ROI) using the “Wand tool.” Individual ROIs can be merged in the FIJI-ImageJ “ROI Manager” with the operator “OR” to select larger brain areas. (C) Fluorescence microscopy images often require signal enhancement processing (targeted primarily to reducing background noise) to make them suitable for application of feature extraction and segmentation algorithms. Uniform and consistent signal enhancement processing can be achieved through scripts. Signal-enhanced images can be further processed with machine learning-based tools, such as “StarDist.” The “StarDist” logo was used with permission from copyright holder Dr. Martin Weigert. The convolutional neural network diagram is published under the Creative Commons Attribution-Share Alike 4.0 International license (Vicente Oyanedel M., CC BY-SA 4.0; URL: https://commons.wikimedia.org/wiki/File:1D_Convolution.png).
Segmentation and Quantification
Once a region of interest has been selected, automated counts of labeled cells can be obtained using the included ImageJ language macro scripts (step 311,12) (Figures 2C, 3). The key image processing steps in order to obtain cell counts are feature extraction and image segmentation. In the digital image processing and computer vision fields, feature extraction refers to the group of image processing operations that detect edges, corner, and segmentation refers to the separation and labeling of objects based on their signal intensity relative to the background and features, breaking the image into smaller fragments and facilitating image interpretation (Nixon and Aguado, 2019). Prior to these processing steps, images must be prepared by subtracting their background and denoising them, leading to an enhancement of the acquired signal (Sternberg, 1983; Nixon and Aguado, 2019). For signal enhancement of images with cells labeled with the neuronal nuclear protein [NeuN; also known as RNA binding protein fox-1 homolog 3 (Wolf et al., 1996; Kim et al., 2009; Duan et al., 2016)] we use FIJI-ImageJ’s “Subtract Background” function, while the signal on images with parvalbumin-labeled cells was enhanced by smoothing the image (by replacing each pixel with the average of its 3× neighborhood) and subtracting its Gaussian-blurred duplicate from it (sigma = 10) with the “Image Calculator” tool for Figure 2C. Traditionally, feature detection and segmentation workflows for the analysis of cell density in fluorescence microscopy has been based on thresholding (selection of a minimum intensity value to binarize the image) and watershed segmentation (for example, using the auto-thresholding method “Moments” alongside watershed segmentation and size/shape filtering for parvalbumin-positive cells and “Find Maxima” for NeuN-positive cells; see Supplementary Methods for more details) to identify cells (Sezgin and Sankur, 2004; Aaron and Chew, 2021; Bourgeois et al., 2021). While this approach is not resource intensive and relatively simple, it is prone to significant performance variability, leading to inconsistencies across images (Sezgin and Taşaltín, 2000; Sezgin and Sankur, 2004). To overcome this issue, researchers have developed machine learning tools using deep learning of artificial neural network, which in addition to significant improvements in performance, accuracy, and speed, are adaptable to virtually any dataset by training artificial neural networks (Moen et al., 2019; Meijering, 2020; Hallou et al., 2021; Stringer et al., 2021). While implementing these approaches often requires specialized personnel and high-performance computing equipment, the computing efficiency is being optimized work on regular consumer-graded computing equipment (Moen et al., 2019; Meijering, 2020; Tyson et al., 2021; von Chamier et al., 2021) and there are novel developments in user-friendly implementations (Gómez-de-Mariscal et al., 2021; Lucas et al., 2021; von Chamier et al., 2021). For our FIJI-ImageJ-based workflow, we decided to use “StarDist,” a Python implementation for the detection of star-convex objects that uses machine learning and is available as a ready-to-use and user-friendly plugin for FIJI-ImageJ (Schmidt et al., 2018; Weigert et al., 2020). While “StarDist” was originally designed to detect cell nuclei in fluorescence microscopy images via a convolutional neural network that approximates nuclei shape with star-convex polygons, “StarDist” base-and-ready-to-use models perform well at detecting cell bodies for various fluorescence and brightfield microscopy applications, in particular in challenging cases such as images with high cellular density (Schmidt et al., 2018; Weigert et al., 2020). “StarDist” produces two outputs: a 16-bit image containing a color-coded annotation of the segmented objects and the corresponding ROIs for each segmented object (directed to the “ROI Manager”). Following the application of “StarDist,” our framework exports the segmented objects ROIs, their area, and total object count to a “.csv” files into each image series respective subdirectory. From here, users can perform further downstream analysis with open source statistical software tools such as R and RStudio (R Core Team, 2021) or online R-based and Python-based tools such as “ggPlotteR” (see Text Footnote 8), “PlotsofData” (Postma and Goedhart, 2019), “SuperPlotsofData” (Goedhart, 2021), and “DABEST” (Ho et al., 2019); the latter two are further discussed in the following section.
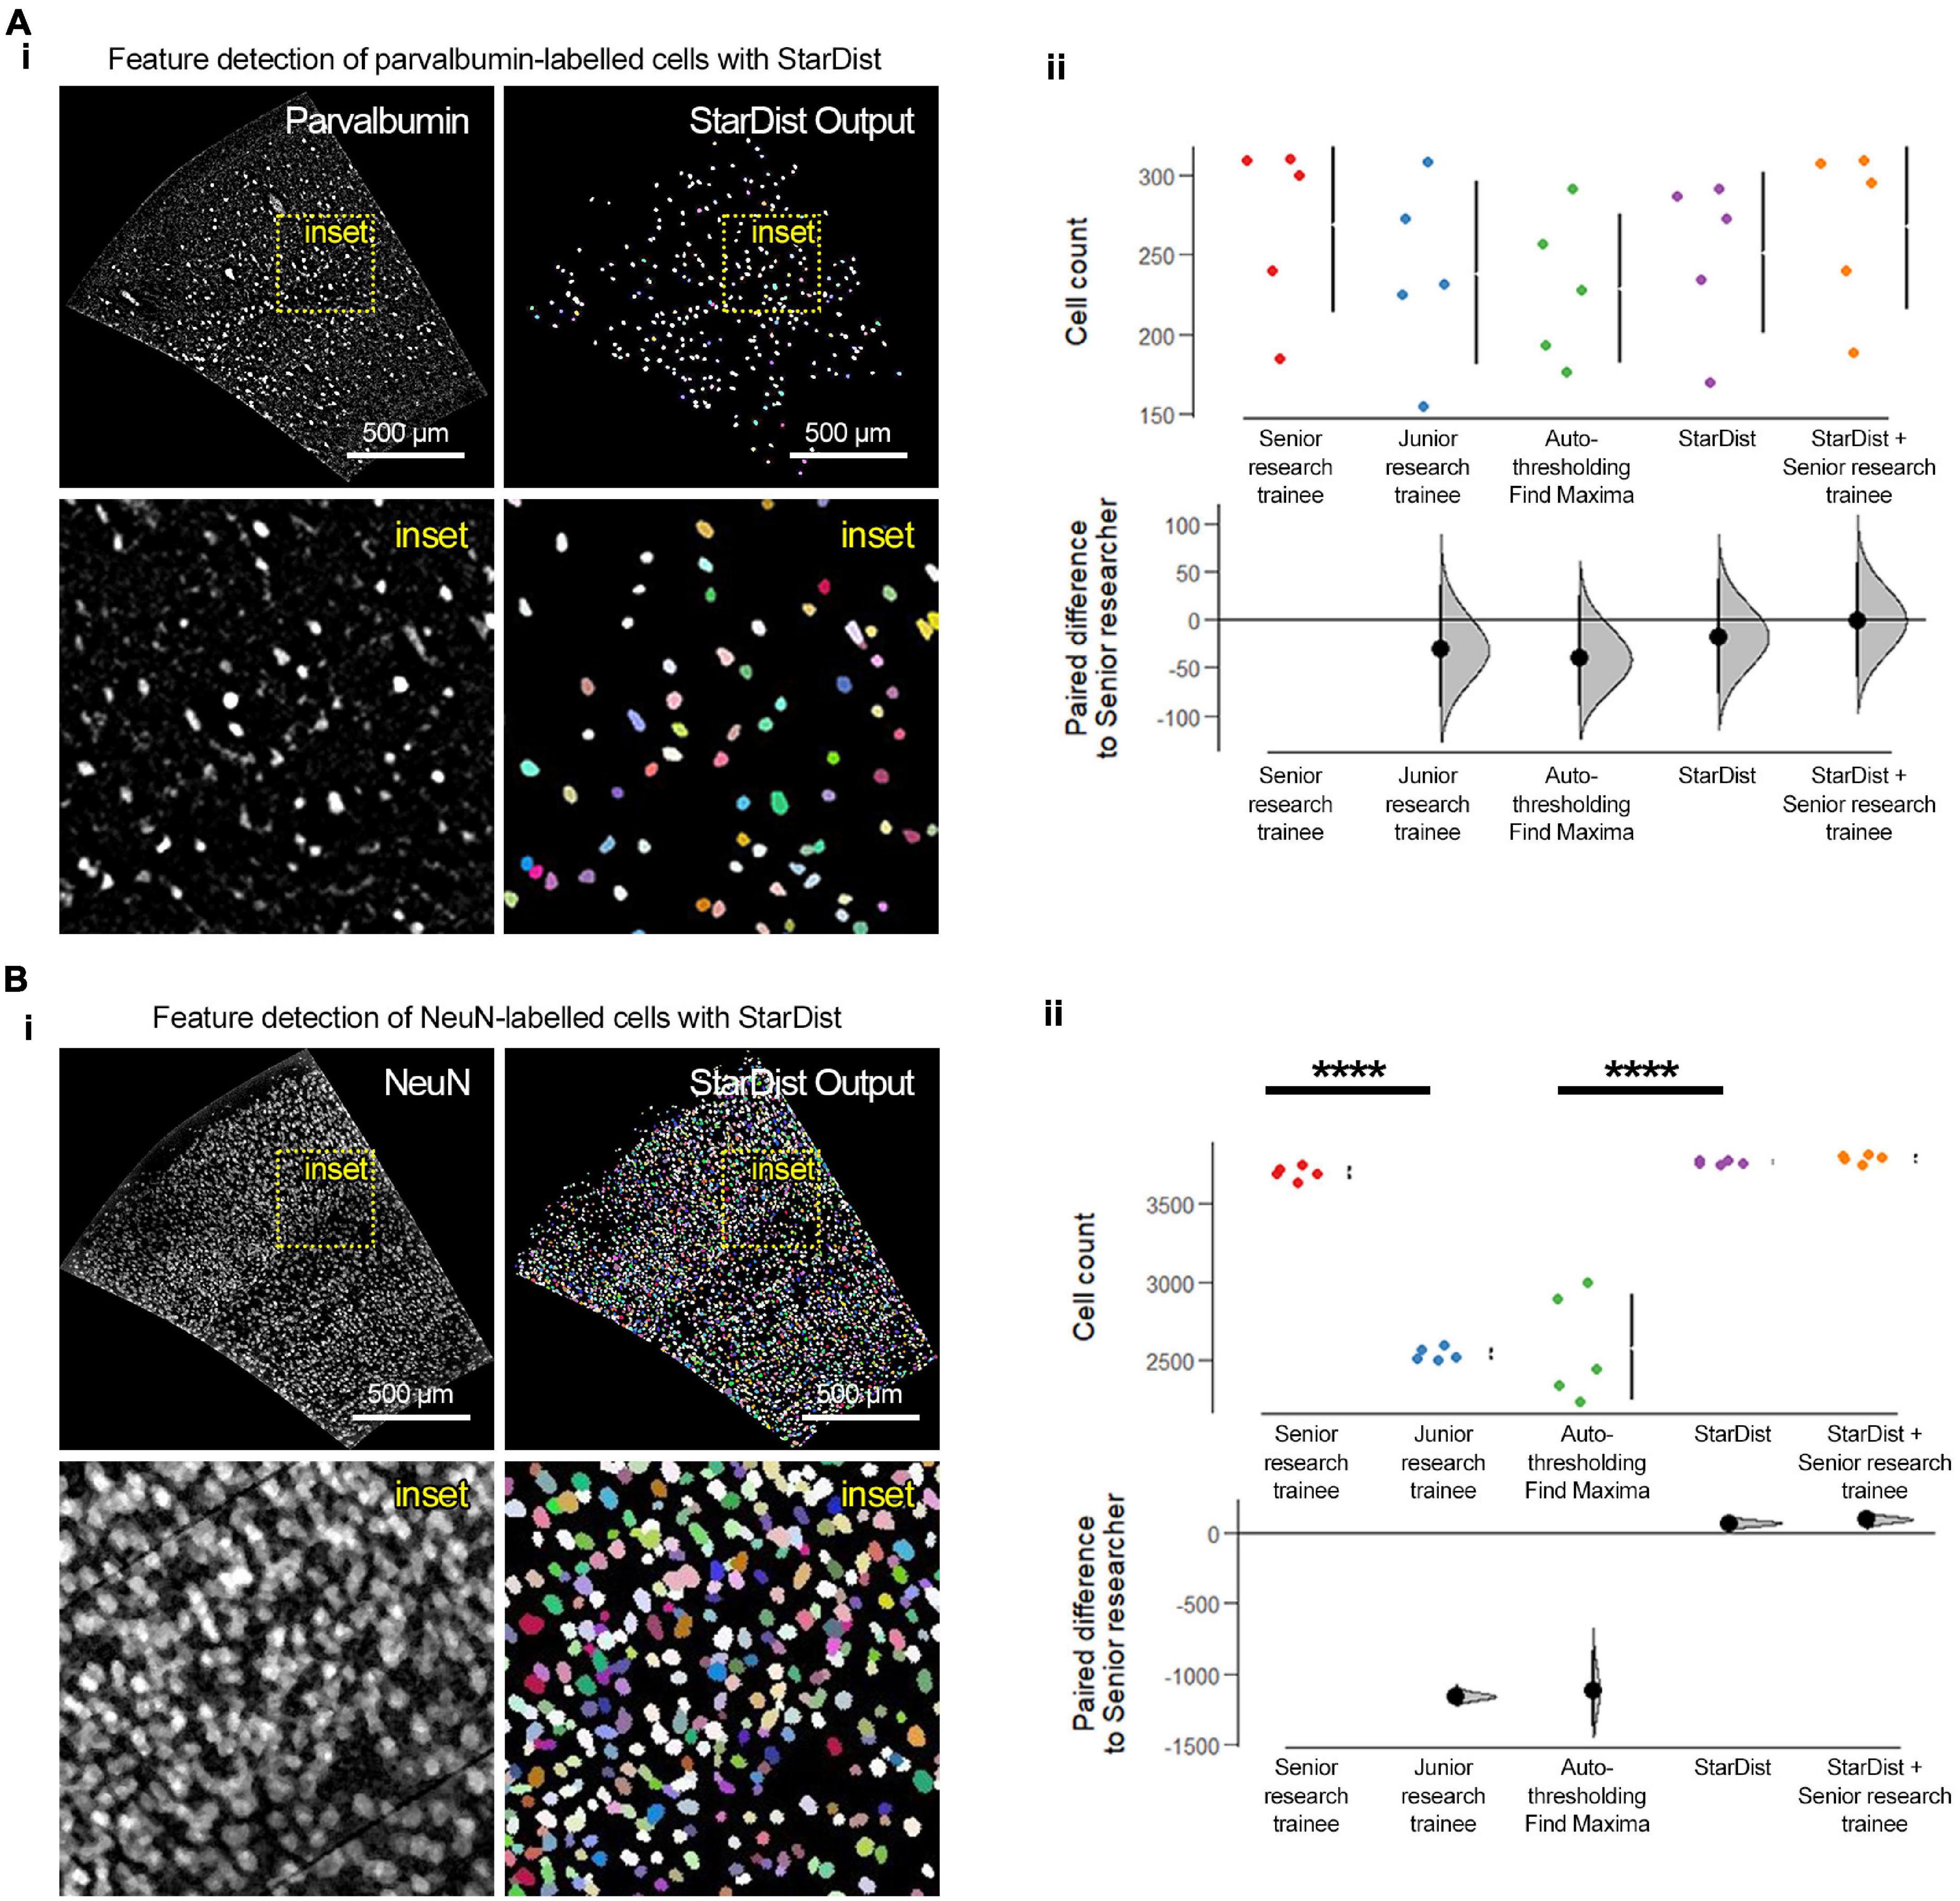
Figure 3. Feature extraction, segmentation, and quantification using “StarDist” and other conventional and manual approaches. (A) (i) Representative fluorescence micrographs of the barrel cortex with parvalbumin-labeled cells and “StarDist” color-coded annotating output of segmented objects. (ii) “StarDist” was as accurate as a senior research trainee in detecting the number of parvalbumin-labeled cells. Note the similar distribution of the data points between “StarDist,” the manual quantification by a senior research trainee, and the two methods combined (“StarDist,” mean: 251 ± 50.6 cells; senior research trainee, mean: 268 ± 55.1 cells; “StarDist” + senior research trainee: 267.8 ± 52.71 cells; mean ± standard deviation; p = 0.694; d = –17.8 [95CI –77.8; 42.8]; d = –1 [95CI –60.8; 60.4]). (B) (i) Representative fluorescence micrographs of the barrel cortex with NeuN-labeled cells and “StarDist” color-coded annotating output of segmented objects. (ii) As expected, using labeling with NeuN results in images with high cellular density, which are significantly challenging for inexperience research trainees and conventional thresholding approaches (p < 0.0001). “StarDist” significantly outperformed the autothresholding and “Find Maxima”-based conventional approaches in detecting, segmenting, and quantifying labeled cells (“StarDist,” mean: 3765.8 ± 13.3 cells; autothresholding/“Find Maxima,” mean: 2580.4 ± 339.8 cells; p < 0.0001; d = 1190 [95CI 907; 1440]). “StarDist” performance was similar to that of the manual quantification by a senior research trainee or the two combined, albeit with lower variability (senior research trainee, mean: 3698.6 ± 40.1 cells; “StarDist” + senior research trainee, mean: 3789 ± 25.7; p = 0.9570; d = –17.8 [95CI –77.8; 42.8] and d = –1 [95CI –60.8; 60.4], respectively). N = 5 randomly selected barrel cortex micrographs; “****”p < 0.0001. For experimental details regarding the animals used and image acquisition and processing parameters see Supplementary Methods.
To validate this workflow, we compared the performance of “StarDist” with that of a conventional thresholding and watershed segmentation, manual counting by a junior research trainee (<1 year of experience), and manual counting by a senior research trainee (>5 years of experience) using 10 randomly selected micrographs of the barrel cortex (anteroposterior coordinate +0.2 mm; 5 images with parvalbumin labeling, and 5 images with NeuN labeling) acquired from 30 μm brain sections obtained from C57BL/6J male and female 1-month old mice (Figure 3). The conventional approach resulted in inaccurate and inconsistent detection and quantification of cells. Moreover, this exercise revealed the prowess of “StarDist” to detect and segment cells consistently and accurately, even in images with high cellular density such as those containing NeuN-labeled cells (p < 0.0001). “StarDist” alone, showed a very small error rate of ∼0.8%, calculated based on the a posteriori inspection and verification of “StarDist” output by a senior researcher (p = 0.9991). In the case of images labeled with parvalbumin, no clear difference was observed between analysis methods; however, “StarDist” output maintained an error rate of 7%. The inclusion of “StarDist” as the feature extraction/segmentation tool within our framework is twofold: first, it significantly speeds up the analysis while maintaining very low error rates and an easy-to-use interactive user interface that allows to tweak the parameters of the object segmentation algorithm to refine it. Second, “StarDist” also provides the flexibility to train its convolutional neural network with additional datasets in case the included machine learning models do not accurately detect the cells or structures of interest in a given set of images; albeit this task requires relative expertise in machine learning and its applications for bio-image analysis. While we have developed and validated this framework using coronal sections from 1-month old C57BL/6J mouse brains (postnatal day age 30–33), brain sections from younger or older animals should be still compatible with our framework, as long as brain sections micrographs contain enough anatomical landmarks can be recognized and adjusted using the described plugins.
Data Analysis and Presentation: Implementing Recent Paradigm-Shifting Advances
The final steps of data analysis, visualization, and sharing and reporting can arguably be the most exciting aspects of scientific discovery. Most biomedical sciences disciplines rely heavily on null hypothesis statistical testing. As a result, p-value significance cut-offs have become a binary arbiter of biological importance (Halsey, 2019; Ho et al., 2019). It is important to understand that the p-value is an error threshold (Wasserstein et al., 2019), and while these values can identify differences between two groups, they provide no insight into the amplitude of difference. In other words, though a statistical test comparing two means can result in a statistically significant p-value (<0.05), the difference between those means may not have any biological relevance [an excellent example in neuroscience is provided in Calin-Jageman and Cumming (2019)]. While p-values cannot resolve the extent of observable difference, a measure that can provide this insight is effect size, obtained with estimation-based statistical analysis (Ho et al., 2019). For this reason, we strongly advocate to complement null hypothesis statistical testing with estimation-based statistical analysis, available in open-source web-packages such as “DABEST” (“data analysis with bootstrap-coupled estimation”) (Ho et al., 2019). The advantage of estimation statistics is to report quantitative data and eliminate statistical uncertainty by providing the potential for error, reported as confidence interval estimates (Calin-Jageman and Cumming, 2019), enabling the comparison of results from different studies/contexts (Bernard, 2019; Calin-Jageman and Cumming, 2019; Ho et al., 2019). Lastly, because statistical analysis goes hand in hand with appropriate data visualization and presentation, we recommend plotting data according to the recommendations outlined by Lord et al. (2020) in their “SuperPlots” paper and estimation graphics such as Gardner-Altman and Cummings estimation plots (Ho et al., 2019). The key points can be summarized as follows: (1) display all data points, including all technical and biological replicates; (2) avoid presenting data using bars or boxplots; (3) always display a measure of variability, such as the standard deviation or confidence intervals; and lastly (4) add the results of the statistical test used. Both DABEST and “SuperPlots” are suitable tools to communicate data variability and reproducibility. These plots can be easily generated through free and open-source web tools (Ho et al., 2019; Goedhart, 2021), thereby dismantling barriers to reproducible data visualization and analysis.
Discussion
Quantitative analysis of cell-types in mouse brain has enabled critical advances in understanding proper neurodevelopment and neurological disease in mammals (Stoner et al., 2014; DeTure and Dickson, 2019; Briscoe and Marín, 2020). However, the reusability of datasets and analysis methods is hampered by inconsistencies and errors in experimental design, gaps in the reporting of studies, as well as lack of user-friendly resources to design and produce systematic research studies that adhere to current best practices and open science principles (Button et al., 2013; Marqués et al., 2020; Picciotto, 2020). Given the growing (and much-needed) popularity of the open science movement (Koch and Jones, 2016), there is an impending need to elaborate and implement frameworks that are easy to adopt and adapt to each researcher interests. Here we provide an accessible and flexible framework for a commonly used study approach in neuroscience: quantification of cell density in a given brain region. Within this framework, we aimed to compile information that can help guide the implementation of open science workflows throughout the full span of an experimental research study, beginning with experimental design, tissue processing, and image acquisition, and concluding with an example of a workflow for image processing registration, and data analysis (Figure 4). This workflow takes advantage of the popularity, familiarity, and ease of use of the open-source platform for image analysis FIJI-ImageJ and availability of bio-image analysis community-built plugins, such as “Bio-Formats,” “BigWarp,” and “StarDist” (Linkert et al., 2010; Schindelin et al., 2012; Schmidt et al., 2018). We acknowledge that our proposed approach may not fulfill every researcher’s needs, and for this reason, we sought to complement our discussion with a compilation of emerging and in-development analysis tools (Supplementary Table 2). While simple, the flexibility of our framework allows for adaptation to capture more subtle or complex morphological features (e.g., quantifying cells with cytoskeletal markers) or to quantify other cell types (e.g., microglia, oligodendrocytes, and astrocytes) by modifying the image processing and segmentation steps with alternative FIJI-ImageJ-based tools and plugins. As the availability of bio-image analysis tools that use machine learning and artificial intelligence continues to grow, these tools can be implemented as modules within our proposed framework, expanding its capabilities and usability. We discuss some of these exciting new tools in Supplementary Table 2, such as those within the Python-based BrainGlobe platform (which includes “brainreg,” “cellfinder,” “brainredner,” and an “ilastik” implementation) which provide powerful and integrative analyses platforms for whole mouse brain sections, as well as alternative workflows to those published in the past (Berg et al., 2019; Yates et al., 2019; Claudi et al., 2021).
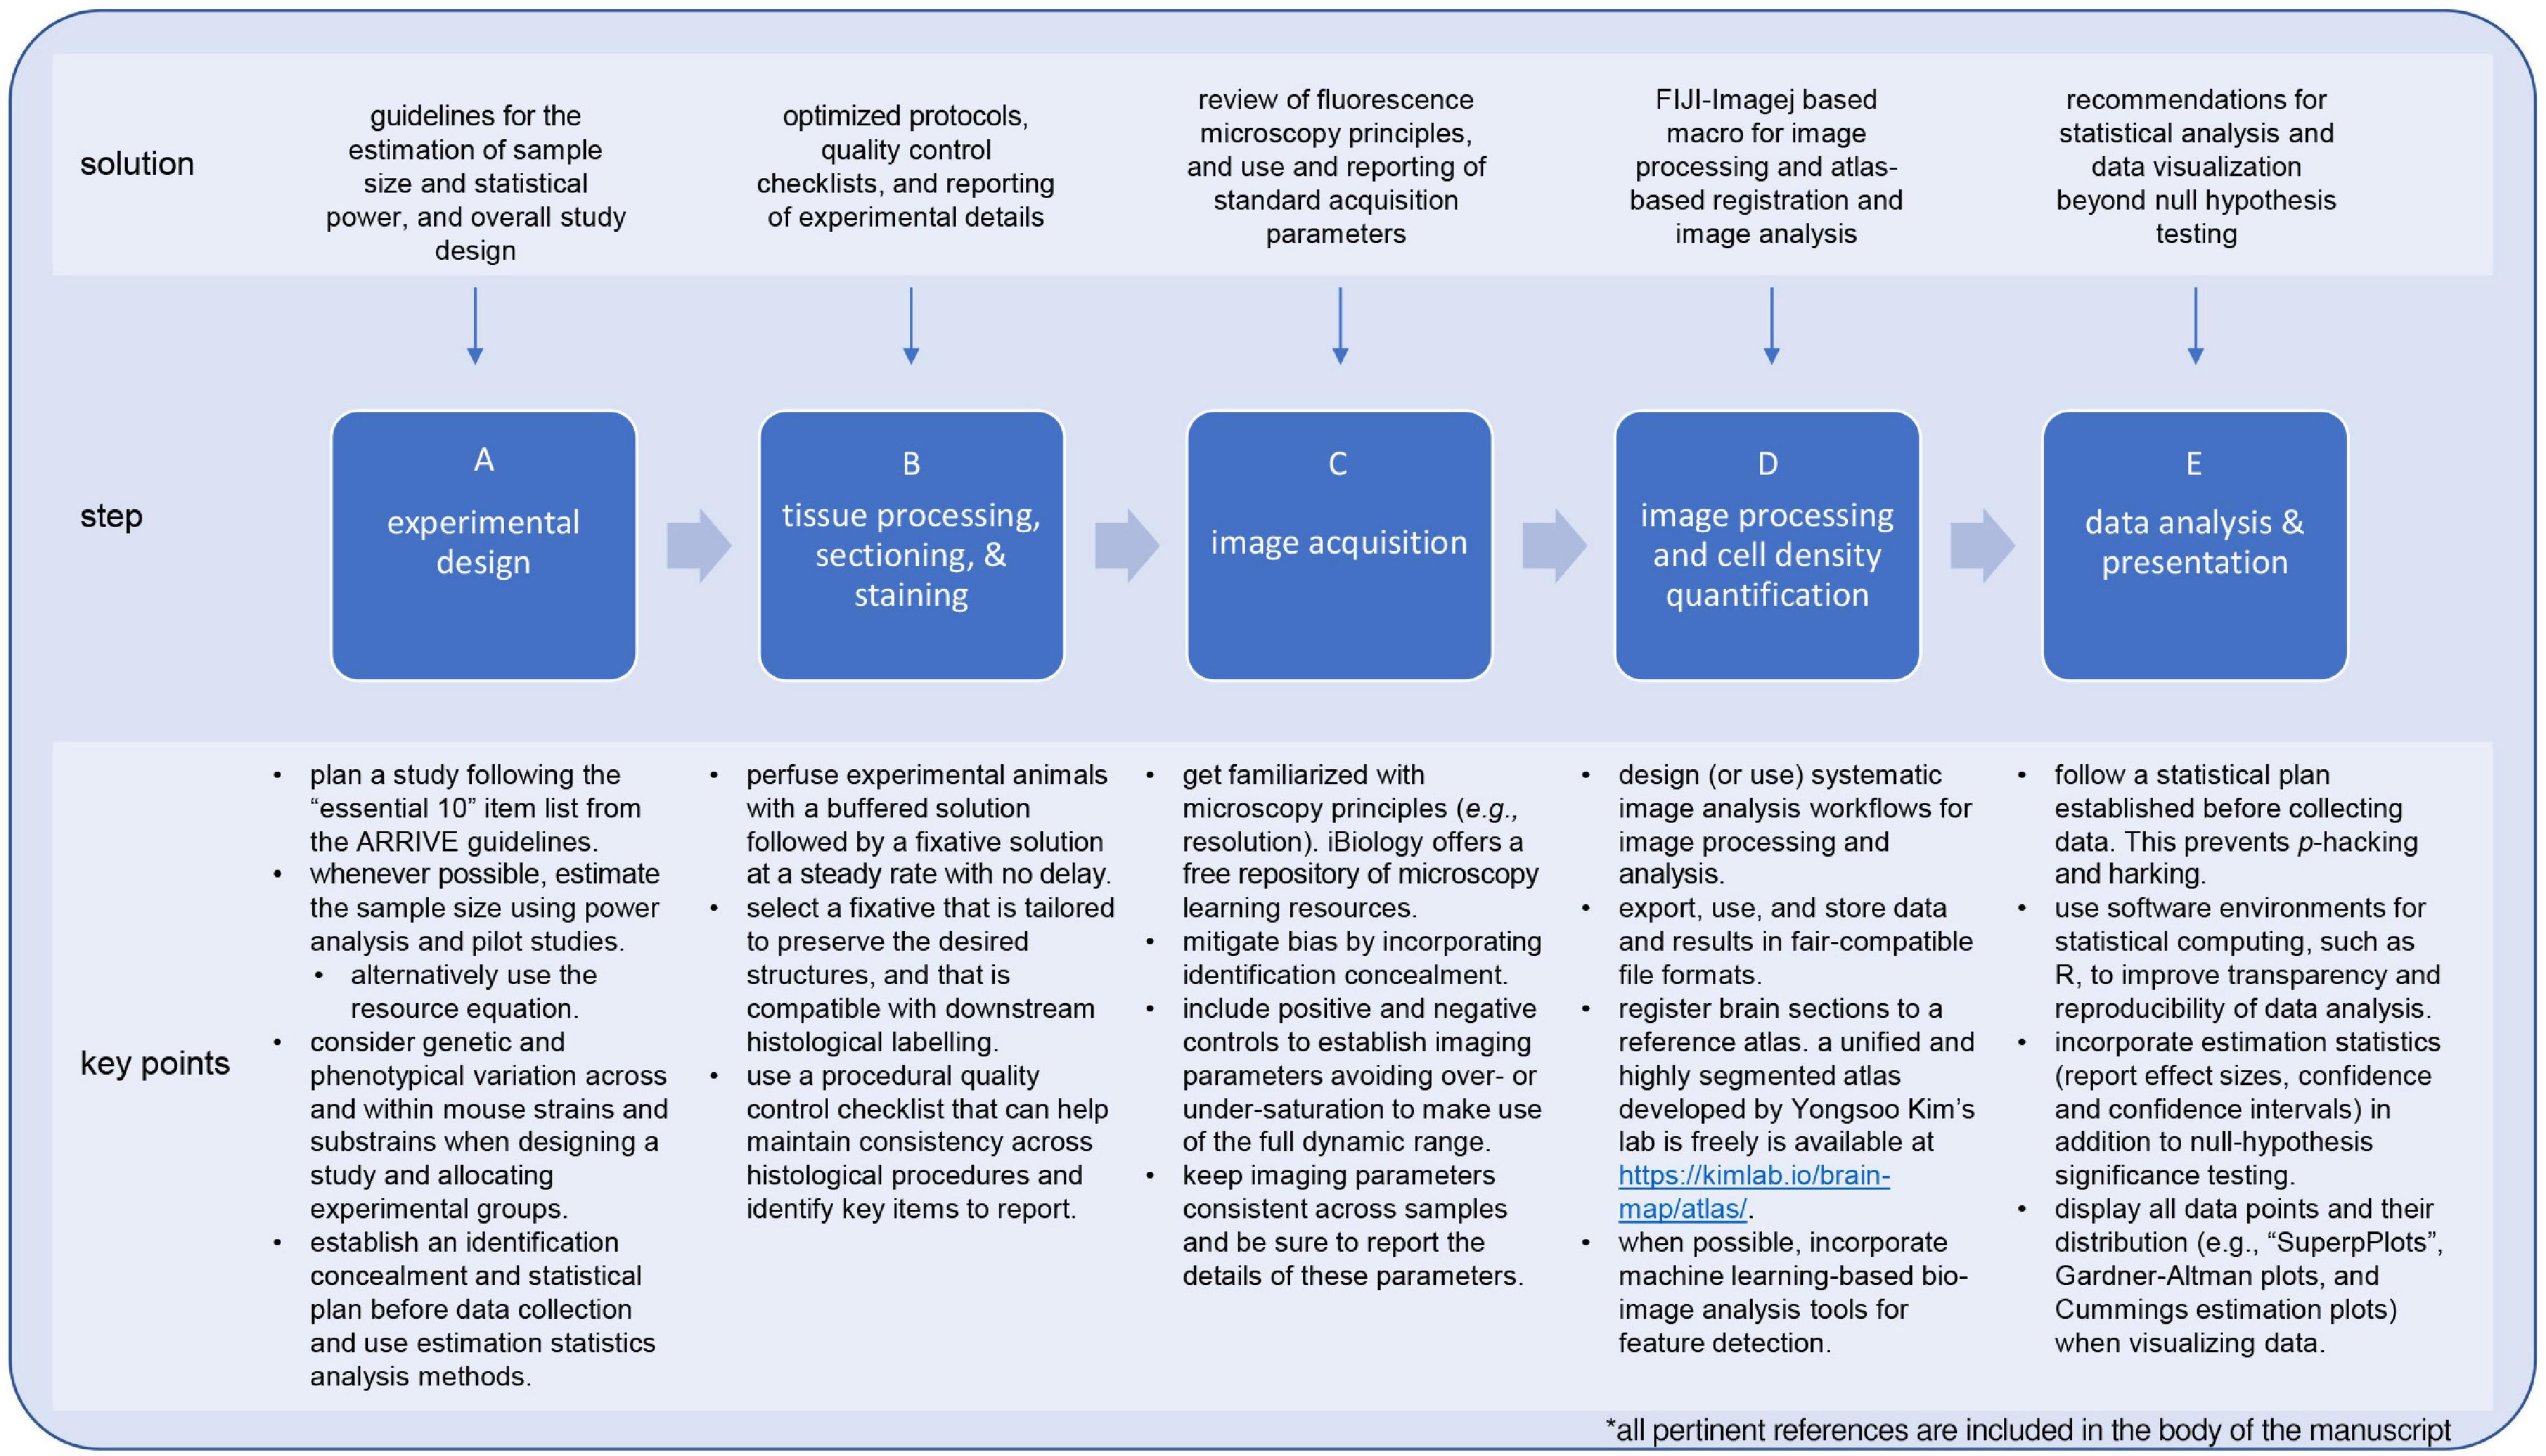
Figure 4. Solutions and recommendations for the implementation of systematic and open science framework to studies for quantifying cell-types in the mouse brain. Familiarization with experimental design concepts and principles helps to identify sources of bias early on and establish plans to mitigate these, resulting in conducting research in an efficient and reliable way. For example, using the ARRIVE guidelines to design an experimental plan not only provides a procedural a structure but also a reference to identify critical items to report on a study (A). Likewise, be acquainted with research methods and equipment is paramount to keep consistency across processed samples (B,C). Using quality control checklist for these steps can facilitate achieving this goal while at the same time provide a reference when it comes to reporting the study. When it comes to process images and extracting data, using workflows based on user-friendly and open-source tools (e.g., FIJI-ImageJ) will contribute to the reproducibility and usability of a study (D). Lastly, incorporating estimation statistics analysis to statistical analysis plan improves the interpretation of study outcomes by providing a quantitative measure of the extent of an outcome (i.e., effect size) and clearly depicting variability. The latter is further benefited by plotting all the data points and their respective distributions using highly descriptive types of scatterplots such as “SuperPlots” or Gardner-Altman and Cummings estimation plots (E). Implementing these items not only contributes to open science, but also enhanced the robustness of a research study.
In all, the present work represents a compilation of key theoretical and practical considerations, and an operational framework that support and encourages a broader implementation of systematic and open-science workflows with the goal of creating greater synergy in our collective efforts as neuroscientists. Not only do we hope that this resource is helpful to the neuroscience research community, especially trainees, but we expect it will be further refined and improved upon.
Data Availability Statement
The raw data has been deposited at the University of Victoria Scholar Portal Dataverse (https://doi.org/10.5683/SP2/KRGFTC). The scripts associated with this article are available on GitHub (https://github.com/SwayneLab/PFIA).
Ethics Statement
The animal study was reviewed and approved by University of Victoria Animal Care Committee.
Author Contributions
LAS designed the research together with JCS-A. Manuscript writing and revision was led by JCS-A, MC, and LAS. LAS, JCS-A, and SDF designed the image analysis workflow. SDF created the early versions of image analysis scripts with help from OS and PY for testing and development. JCS-A and HLN revised and refactored early versions of image analysis scripts. JCS-A redesigned the image analysis scripts and revised and refactored subsequent versions. JCS-A and EGA validated the redesigned image analysis workflow. OS prepared all brain tissues and performed the immunohistochemistry for fluorescent microscopy and image acquisition with help from PY. CM, OS, JCS-A, and SDF prepared the tables. LAS created Figures 1, 4. JCS-A created Figures 2, 3. JCS-A, LAS, EvdS, and MC revised all tables and figures. All authors contributed to the study, the writing, and revision of the manuscript.
Funding
Research in the Swayne lab has recently been supported by grants from the Canadian Institutes of Health Research (CIHR; MOP-142215; GA4-177766, and PJT-169064) and from the Natural Sciences and Engineering Research Council (NSERC; RGPIN-2017-03889) awarded to LAS. JCS-A is supported by a MSFHR Research Trainee Award (RT-2021-1735). EvdS is supported by a University of Victoria Fellowship Graduate Award. MC is supported by a doctoral training award from the Fond de Recherche du Québec, Santé (FRQS). CM is supported by a University of Victoria Faculty of Science Undergraduate Research Award (SURA) and a Jamie Cassels Undergraduate Research Award (JCURA). EGA is supported by a University of Victoria Graduate Entrance Award. PY was supported by the NSERC CGS-M. M-ÈT is supported by the Tier 2 Canada Research Chair in Neurobiology of Aging and Cognition. The Leica TCS SP8 microscope system was purchased using grants from the Canada Foundation for Innovation (29462) and the BC Knowledge Development Fund (804754) awarded to LAS.
Conflict of Interest
The authors declare that the research was conducted in the absence of any commercial or financial relationships that could be construed as a potential conflict of interest.
Publisher’s Note
All claims expressed in this article are solely those of the authors and do not necessarily represent those of their affiliated organizations, or those of the publisher, the editors and the reviewers. Any product that may be evaluated in this article, or claim that may be made by its manufacturer, is not guaranteed or endorsed by the publisher.
Acknowledgments
We would like to thank the University of Victoria Animal Care Committee and Animal Technician team, as well as Dr. Taimei Yang (Animal Research Technician for the Division of Medical Sciences the University of Victoria) for their support in taking care of the animals involved in this study. We acknowledge and respect the  peoples on whose traditional territory the university stands and the Songhees, Esquimalt and WSÁNEĆ peoples whose historical relationships with the land continue to this day.
Supplementary Material
The Supplementary Material for this article can be found online at: https://www.frontiersin.org/articles/10.3389/fnana.2021.722443/full#supplementary-material
Footnotes
- ^ https://www.stat.ubc.ca/rollin/stats/ssize/n2.html
- ^ http://powerandsamplesize.com/Calculators/
- ^ http://www.informatics.jax.org/
- ^ http://bioit2.irc.ugent.be/prx/me-pamufind-it/
- ^ https://scicrunch.org/resources
- ^ https://www.ibiology.org/online-biology-courses/microscopy-series/
- ^ https://github.com/SwayneLab/PFIA/blob/main/pfia_step_1_file_mgmt.ijm
- ^ https://huygens.science.uva.nl/ggPlotteR/
- ^ http://kimlab.io/brain-map/atlas/
- ^ https://github.com/SwayneLab/PFIA/blob/main/pfia_step_2_warp-register_brain_section.ijm
- ^ https://github.com/SwayneLab/PFIA/blob/main/pfia_step_3_count_pv_ cells.ijm
- ^ https://github.com/SwayneLab/PFIA/blob/main/pfia_step_3_count_neun_ cells.ijm
References
Aaron, J., and Chew, T.-L. (2021). A guide to accurate reporting in digital image processing – can anyone reproduce your quantitative analysis? J. Cell Sci. 134:jcs254151. doi: 10.1242/jcs.254151
Akil, H., Martone, M. E., and Van Essen, D. C. (2011). Challenges and opportunities in mining neuroscience data. Science 331, 708–712. doi: 10.1126/science.1199305
Albert-Smet, I., Marcos-Vidal, A., Vaquero, J. J., Desco, M., Muñoz-Barrutia, A., and Ripoll, J. (2019). Applications of light-sheet microscopy in microdevices. Front. Neuroanat. 13:1. doi: 10.3389/fnana.2019.00001
Alegro, M., Theofilas, P., Nguy, A., Castruita, P. A., Seeley, W., Heinsen, H., et al. (2017). Automating cell detection and classification in human brain fluorescent microscopy images using dictionary learning and sparse coding. J. Neurosci. Methods 282, 20–33. doi: 10.1016/j.jneumeth.2017.03.002
Anderson, K. R., Harris, J. A., Ng, L., Prins, P., Memar, S., Ljungquist, B., et al. (2021). Highlights from the Era of open source web-based tools. J. Neurosci. 41, 927–936. doi: 10.1523/JNEUROSCI.1657-20.2020
Bacallao, R., Sohrab, S., and Phillips, C. (2006). “Guiding principles of specimen preservation for confocal fluorescence microscopy,” in Handbook of Biological Confocal Microscopy, ed. J. B. Pawley (Boston, MA: Springer), 368–380. doi: 10.1007/978-0-387-45524-2_18
Beck, J. A., Lloyd, S., Hafezparast, M., Lennon-Pierce, M., Eppig, J. T., Festing, M. F. W., et al. (2000). Genealogies of mouse inbred strains. Nat. Genet. 24, 23–25. doi: 10.1038/71641
Beery, A. K., and Zucker, I. (2011). Sex bias in neuroscience and biomedical research. Neurosci. Biobehav. Rev. 35, 565–572. doi: 10.1016/j.neubiorev.2010.07.002
Belhadjhamida, R., Lea-Banks, H., and Hynynen, K. (2020). Perfusion fixation methods for preclinical biodistribution studies: a comparative assessment using automated image processing. Methods Appl. Fluoresc. 9:039501. doi: 10.1088/2050-6120/abd37b
Berg, S., Kutra, D., Kroeger, T., Straehle, C. N., Kausler, B. X., Haubold, C., et al. (2019). ilastik: interactive machine learning for (bio)image analysis. Nat. Methods 16, 1226–1232. doi: 10.1038/s41592-019-0582-9
Bernard, C. (2019). Changing the way we report, interpret, and discuss our results to rebuild trust in our research. eNeuro 6, 1–3. doi: 10.1523/ENEURO.0259-19.2019
Bernard, C. (2021). Estimation statistics, one year later. eNeuro 8:1. doi: 10.1523/ENEURO.0091-21.2021
Bernard, P. B., Ramsay, L. A., MacDonald, D. S., and Tasker, R. A. (2017). Progressive changes in hippocampal cytoarchitecture in a neurodevelopmental rat model of epilepsy: implications for understanding presymptomatic epileptogenesis, predictive diagnosis, and targeted treatments. EPMA J. 8, 247–254. doi: 10.1007/s13167-017-0111-9
Bogovic, J. A., Hanslovsky, P., Wong, A., and Saalfeld, S. (2016). “Robust registration of calcium images by learned contrast synthesis,” in Proceedings of the 2016 IEEE 13th International Symposium on Biomedical Imaging (ISBI), (Piscataway, NJ: IEEE), 1123–1126. doi: 10.1109/ISBI.2016.7493463
Bourgeois, J. R., Kalyanasundaram, G., Figueroa, C., Srinivasan, A., and Kopec, A. M. (2021). A semi-automated brain atlas-based analysis pipeline for c-Fos immunohistochemical data. J. Neurosci. Methods 348:108982. doi: 10.1016/j.jneumeth.2020.108982
Briscoe, J., and Marín, O. (2020). Looking at neurodevelopment through a big data lens. Science 369:eaaz8627. doi: 10.1126/science.aaz8627
Brown, C. M. (2007). Fluorescence microscopy – avoiding the pitfalls. J. Cell Sci. 120, 1703–1705. doi: 10.1242/jcs.03433
Burry, R. W. (2011). Controls for immunocytochemistry: an update. J. Histochem. Cytochem. Off. J. Histochem. Soc. 59, 6–12. doi: 10.1369/jhc.2010.956920
Button, K. S., Ioannidis, J. P. A., Mokrysz, C., Nosek, B. A., Flint, J., Robinson, E. S. J., et al. (2013). Power failure: why small sample size undermines the reliability of neuroscience. Nat. Rev. Neurosci. 14, 365–376. doi: 10.1038/nrn3475
Calin-Jageman, R. J., and Cumming, G. (2019). Estimation for better inference in neuroscience. eNeuro 6, 1–11. doi: 10.1523/ENEURO.0205-19.2019
Cǎtǎlin, B., Stopper, L., Bǎlşeanu, T.-A., and Scheller, A. (2017). The in situ morphology of microglia is highly sensitive to the mode of tissue fixation. J. Chem. Neuroanat. 86, 59–66. doi: 10.1016/j.jchemneu.2017.08.007
Celikkan, F. T., Mungan, C., Sucu, M., Uysal, F., Kahveci, S., Hayme, S., et al. (2019). Glyoxal does not preserve cellular proteins as accurately as PFA: a microscopical survey of epitopes. bioRxiv [preprint] doi: 10.1101/625863
Chen, P. B., and Flint, J. (2021). What connectomics can learn from genomics. PLoS Genet. 17:e1009692. doi: 10.1371/journal.pgen.1009692
Chon, U., Vanselow, D. J., Cheng, K. C., and Kim, Y. (2019). Enhanced and unified anatomical labeling for a common mouse brain atlas. Nat. Commun. 10:5067. doi: 10.1038/s41467-019-13057-w
Claudi, F., Tyson, A. L., Petrucco, L., Margrie, T. W., Portugues, R., and Branco, T. (2021). Visualizing anatomically registered data with brainrender. eLife 10:e65751. doi: 10.7554/eLife.65751
Crawley, J. N., Belknap, J. K., Collins, A., Crabbe, J. C., Frankel, W., Henderson, N., et al. (1997). Behavioral phenotypes of inbred mouse strains: implications and recommendations for molecular studies. Psychopharmacology (Berl.) 132, 107–124. doi: 10.1007/s002130050327
Daigle, T. L., Madisen, L., Hage, T. A., Valley, M. T., Knoblich, U., Larsen, R. S., et al. (2018). A suite of transgenic driver and reporter mouse lines with enhanced brain-cell-type targeting and functionality. Cell 174, 465–480.e22. doi: 10.1016/j.cell.2018.06.035
DeTure, M. A., and Dickson, D. W. (2019). The neuropathological diagnosis of Alzheimer’s disease. Mol. Neurodegener. 14:32. doi: 10.1186/s13024-019-0333-5
Dickey, C. A., Loring, J. F., Montgomery, J., Gordon, M. N., Eastman, P. S., and Morgan, D. (2003). Selectively reduced expression of synaptic plasticity-related genes in amyloid precursor protein + presenilin-1 transgenic mice. J. Neurosci. Off. J. Soc. Neurosci. 23, 5219–5226. doi: 10.1523/JNEUROSCI.23-12-05219.2003
du Sert, N. P., Ahluwalia, A., Alam, S., Avey, M. T., Baker, M., Browne, W. J., et al. (2020a). Reporting animal research: explanation and elaboration for the ARRIVE guidelines 2.0. PLoS Biol. 18:e3000411. doi: 10.1371/journal.pbio.3000411
du Sert, N. P., Hurst, V., Ahluwalia, A., Alam, S., Avey, M. T., Baker, M., et al. (2020b). The ARRIVE guidelines 2.0: updated guidelines for reporting animal research. PLoS Biol. 18:e3000410. doi: 10.1371/journal.pbio.3000410
Duan, W., Zhang, Y.-P., Hou, Z., Huang, C., Zhu, H., Zhang, C.-Q., et al. (2016). Novel insights into neun: from neuronal marker to splicing regulator. Mol. Neurobiol. 53, 1637–1647. doi: 10.1007/s12035-015-9122-5
Ellis, P. D. (2010). The Essential Guide to Effect Sizes: Statistical Power, Meta-Analysis, and the Interpretation of Research Results. Cambridge: Cambridge University Press. doi: 10.1017/CBO9780511761676
Estrada, L. I., Robinson, A. A., Amaral, A. C., Giannaris, E. L., Heyworth, N. C., Mortazavi, F., et al. (2017). Evaluation of long-term cryostorage of brain tissue sections for quantitative histochemistry. J. Histochem. Cytochem. 65, 153–171. doi: 10.1369/0022155416686934
Festing, M. F. (2018). On determining sample size in experiments involving laboratory animals. Lab. Anim. 52, 341–350. doi: 10.1177/0023677217738268
Festing, M. F. W., and Altman, D. G. (2002). Guidelines for the design and statistical analysis of experiments using laboratory animals. ILAR J. 43, 244–258. doi: 10.1093/ilar.43.4.244
Fisher, R. A. (1956). “Statistical methods for research workers,” in Breakthroughs in Statistics, eds S. Kotz and N. L. Johnson (New York, NY: Springer), 66–70.
Flores, D. P., and Marzullo, T. C. (2021). The construction of high-magnification homemade lenses for a simple microscope: an easy “DIY” tool for biological and interdisciplinary education. Adv. Physiol. Educ. 45, 134–144. doi: 10.1152/advan.00127.2020
Franklin, K. B. J., and Paxinos, G. (2008). The Mouse Brain in Stereotaxic Coordinates. New York, NY: Academic Press.
Fürth, D., Vaissière, T., Tzortzi, O., Xuan, Y., Märtin, A., Lazaridis, I., et al. (2018). An interactive framework for whole-brain maps at cellular resolution. Nat. Neurosci. 21, 139–149. doi: 10.1038/s41593-017-0027-7
Gage, G. J., Kipke, D. R., and Shain, W. (2012). Whole animal perfusion fixation for rodents. JoVE J. Vis. Exp. 65:e3564. doi: 10.3791/3564
Gao, Y., Liu, Q., Xu, L., Zheng, N., He, X., and Xu, F. (2019). Imaging and spectral characteristics of amyloid plaque autofluorescence in brain slices from the APP/PS1 mouse model of Alzheimer’s disease. Neurosci. Bull. 35, 1126–1137. doi: 10.1007/s12264-019-00393-6
Garcia-Lopez, P., Garcia-Marin, V., and Freire, M. (2010). The histological slides and drawings of cajal. Front. Neuroanat. 4:9. doi: 10.3389/neuro.05.009.2010
Gelman, A., and Stern, H. (2006). The difference between “significant” and “not significant” is not itself statistically significant. Am. Stat. 60, 328–331. doi: 10.1198/000313006X152649
Geschwind, D. H., and Konopka, G. (2009). Neuroscience in the era of functional genomics and systems biology. Nature 461, 908–915. doi: 10.1038/nature08537
Gibbs, D. R., Kaur, A., Megalathan, A., Sapkota, K., and Dhakal, S. (2018). Build your own microscope: step-by-step guide for building a prism-based TIRF microscope. Methods Protoc. 1:40. doi: 10.3390/mps1040040
Gigerenzer, G. (2018). Statistical rituals: the replication delusion and how we got there. Adv. Methods Pract. Psychol. Sci. 1, 198–218. doi: 10.1177/2515245918771329
Glickstein, M. (2006). Golgi and Cajal: the neuron doctrine and the 100th anniversary of the 1906 Nobel Prize. Curr. Biol. CB 16, R147–R151. doi: 10.1016/j.cub.2006.02.053
Goedhart, J. (2021). SuperPlotsOfData—a web app for the transparent display and quantitative comparison of continuous data from different conditions. Mol. Biol. Cell 32, 470–474. doi: 10.1091/mbc.E20-09-0583
Gómez-de-Mariscal, E., García-López-de-Haro, C., Ouyang, W., Donati, L., Lundberg, E., Unser, M., et al. (2021). DeepImageJ: a user-friendly environment to run deep learning models in ImageJ. Nat. Methods 18, 1192–1195. doi: 10.1038/s41592-021-01262-9
Grier, Z., Soddu, M. F., Kenyatta, N., Odame, S. A., Sanders, J., Wright, L., et al. (2018). “A low-cost do-it-yourself microscope kit for hands-on science education,” in Optics Education and Outreach V, Vol. 10741, ed. G. G. Gregory (Bellingham, WA: International Society for Optics and Photonics), 16. doi: 10.1117/12.2320655
Hallou, A., Yevick, H., Dumitrascu, B., and Uhlmann, V. (2021). Deep learning for Bioimage Analysis. ArXiv210702584 Phys. Q-Bio. Available online at: http://arxiv.org/abs/2107.02584 (accessed October 20, 2021).
Halsey, L. G. (2019). The reign of the p-value is over: what alternative analyses could we employ to fill the power vacuum? Biol. Lett. 15:20190174. doi: 10.1098/rsbl.2019.0174
Haug, H. (1986). History of neuromorphometry. J. Neurosci. Methods 18, 1–17. doi: 10.1016/0165-0270(86)90110-X
Head, M. L., Holman, L., Lanfear, R., Kahn, A. T., and Jennions, M. D. (2015). The extent and consequences of P-Hacking in science. PLoS Biol. 13:e1002106. doi: 10.1371/journal.pbio.1002106
Heddleston, J. M., Aaron, J. S., Khuon, S., and Chew, T.-L. (2021). A guide to accurate reporting in digital image acquisition – can anyone replicate your microscopy data? J. Cell Sci. 134:jcs254144. doi: 10.1242/jcs.254144
Ho, J., Tumkaya, T., Aryal, S., Choi, H., and Claridge-Chang, A. (2019). Moving beyond P values: data analysis with estimation graphics. Nat. Methods 16, 565–566. doi: 10.1038/s41592-019-0470-3
Huisman, M., Hammer, M., Rigano, A., Boehm, U., Chambers, J. J., Gaudreault, N., et al. (2021). A perspective on Microscopy Metadata: Data Provenance and Quality Control. ArXiv191011370 Cs Q-Bio. Available online at: http://arxiv.org/abs/1910.11370 (accessed May 25, 2021).
Im, K., Mareninov, S., Diaz, M. F. P., and Yong, W. H. (2019). An introduction to performing immunofluorescence staining. Methods Mol. Biol. Clifton NJ 1897, 299–311. doi: 10.1007/978-1-4939-8935-5_26
Jenvey, C. J., and Stabel, J. R. (2017). Autofluorescence and nonspecific immunofluorescent labeling in frozen bovine intestinal tissue sections: solutions for multicolor immunofluorescence experiments. J. Histochem. Cytochem. Off. J. Histochem. Soc. 65, 531–541. doi: 10.1369/0022155417724425
Jonkman, J., Brown, C. M., Wright, G. D., Anderson, K. I., and North, A. J. (2020). Tutorial: guidance for quantitative confocal microscopy. Nat. Protoc. 15, 1585–1611. doi: 10.1038/s41596-020-0313-9
Kang, M., Ryu, H.-H., and Lee, Y.-S. (2015). Comparisons of behavior and synaptic plasticity among three C57BL/6 substrains. Anim. Cells Syst. 19, 181–187. doi: 10.1080/19768354.2015.1023830
Keller, P. J., and Ahrens, M. B. (2015). Visualizing whole-brain activity and development at the single-cell level using light-sheet microscopy. Neuron 85, 462–483. doi: 10.1016/j.neuron.2014.12.039
Kerr, N. L. (1998). HARKing: hypothesizing after the results are known. Pers. Soc. Psychol. Rev. Off. J. Soc. Personal. Soc. Psychol. Inc 2, 196–217. doi: 10.1207/s15327957pspr0203_4
Kim, K. K., Adelstein, R. S., and Kawamoto, S. (2009). Identification of neuronal nuclei (NeuN) as Fox-3, a new member of the Fox-1 gene family of splicing factors *. J. Biol. Chem. 284, 31052–31061. doi: 10.1074/jbc.M109.052969
Kiselycznyk, C., and Holmes, A. (2011). All (C57BL/6) mice are not created equal. Front. Neurosci. 5:10. doi: 10.3389/fnins.2011.00010
Koch, C., and Jones, A. (2016). Big science, team science, and open science for neuroscience. Neuron 92, 612–616. doi: 10.1016/j.neuron.2016.10.019
Kuan, L., Li, Y., Lau, C., Feng, D., Bernard, A., Sunkin, S. M., et al. (2015). Neuroinformatics of the allen mouse brain connectivity atlas. Methods 73, 4–17.
Lee, J.-Y., and Kitaoka, M. (2018). A beginner’s guide to rigor and reproducibility in fluorescence imaging experiments. Mol. Biol. Cell 29, 1519–1525. doi: 10.1091/mbc.E17-05-0276
Leonard, C., Syed, J., and Radi, Z. (2016). Comparison and impact of various whole body perfusion techniques on tissue preservation quality and immunorecognition. J. Histotechnol. 39, 39–46. doi: 10.1080/01478885.2016.1144844
Li, Y., Song, Y., Zhao, L., Gaidosh, G., Laties, A. M., and Wen, R. (2008). Direct labeling and visualization of blood vessels with lipophilic carbocyanine dye DiI. Nat. Protoc. 3, 1703–1708. doi: 10.1038/nprot.2008.172
Linkert, M., Rueden, C. T., Allan, C., Burel, J.-M., Moore, W., Patterson, A., et al. (2010). Metadata matters: access to image data in the real world. J. Cell Biol. 189, 777–782. doi: 10.1083/jcb.201004104
Lord, S. J., Velle, K. B., Mullins, R. D., and Fritz-Laylin, L. K. (2020). SuperPlots: communicating reproducibility and variability in cell biology. J. Cell Biol. 219:e202001064. doi: 10.1083/jcb.202001064
Lu, C.-H., Tang, W.-C., Liu, Y.-T., Chang, S.-W., Wu, F. C. M., Chen, C.-Y., et al. (2019). Lightsheet localization microscopy enables fast, large-scale, and three-dimensional super-resolution imaging. Commun. Biol. 2:177. doi: 10.1038/s42003-019-0403-9
Lucas, A. M., Ryder, P. V., Li, B., Cimini, B. A., Eliceiri, K. W., and Carpenter, A. E. (2021). Open-source deep-learning software for bioimage segmentation. Mol. Biol. Cell 32, 823–829. doi: 10.1091/mbc.E20-10-0660
Luo, L., Ambrozkiewicz, M. C., Benseler, F., Chen, C., Dumontier, E., Falkner, S., et al. (2020). Optimizing nervous system-specific gene targeting with cre driver lines: prevalence of germline recombination and influencing factors. Neuron 106, 37–65.e5. doi: 10.1016/j.neuron.2020.01.008
Mamlouk, G. M., Dorris, D. M., Barrett, L. R., and Meitzen, J. (2020). Sex bias and omission in neuroscience research is influenced by research model and journal, but not reported NIH funding. Front. Neuroendocrinol. 57:100835. doi: 10.1016/j.yfrne.2020.100835
Mano, T., Albanese, A., Dodt, H.-U., Erturk, A., Gradinaru, V., Treweek, J. B., et al. (2018). Whole-Brain analysis of cells and circuits by tissue clearing and light-sheet microscopy. J. Neurosci. 38, 9330–9337. doi: 10.1523/JNEUROSCI.1677-18.2018
Marqués, G., Pengo, T., and Sanders, M. A. (2020). Imaging methods are vastly underreported in biomedical research. eLife 9:e55133. doi: 10.7554/eLife.55133
Martone, M. E., Gupta, A., and Ellisman, M. H. (2004). e-Neuroscience: challenges and triumphs in integrating distributed data from molecules to brains. Nat. Neurosci. 7, 467–472. doi: 10.1038/nn1229
Matsuo, N., Takao, K., Nakanishi, K., Yamasaki, N., Tanda, K., and Miyakawa, T. (2010). Behavioral profiles of three C57BL/6 substrains. Front. Behav. Neurosci. 4:29. doi: 10.3389/fnbeh.2010.00029
McCarthy, M. M., Woolley, C. S., and Arnold, A. P. (2017). Incorporating sex as a biological variable in neuroscience: what do we gain? Nat. Rev. Neurosci. 18, 707–708. doi: 10.1038/nrn.2017.137
Mead, R. (1988). The Design of Experiments: Statistical Principles for Practical Applications. New York, NY: Cambridge University Press.
Mead, R., Gilmour, S. G., and Mead, A. (2012). Statistical Principles for the Design of Experiments: Applications to Real Experiments. Cambridge: Cambridge University Press, doi: 10.1017/CBO9781139020879
Meijering, E. (2020). A bird’s-eye view of deep learning in bioimage analysis. Comput. Struct. Biotechnol. J. 18, 2312–2325. doi: 10.1016/j.csbj.2020.08.003
Moen, E., Bannon, D., Kudo, T., Graf, W., Covert, M., and Valen, D. V. (2019). Deep learning for cellular image analysis. Nat. Methods 16, 1233–1246. doi: 10.1038/s41592-019-0403-1
Niedworok, C. J., Brown, A. P. Y., Jorge Cardoso, M., Osten, P., Ourselin, S., Modat, M., et al. (2016). aMAP is a validated pipeline for registration and segmentation of high-resolution mouse brain data. Nat. Commun. 7:11879. doi: 10.1038/ncomms11879
Nixon, M., and Aguado, A. (2019). Feature Extraction and Image Processing for Computer Vision. Cambridge, MA: Academic press.
North, A. J. (2006). Seeing is believing? A beginners’ guide to practical pitfalls in image acquisition. J. Cell Biol. 172, 9–18. doi: 10.1083/jcb.200507103
Ogama, T. (2020). A beginner’s guide to improving image acquisition in fluorescence microscopy. Biochemist 42, 22–27. doi: 10.1042/BIO20200075
Paul, C. A., Beltz, B., and Berger-Sweeney, J. (2008). Perfusion of brain tissues with fixative. CSH Protoc. 2008: pdb.prot4802. doi: 10.1101/pdb.prot4802
Pawley, J. B. (2006). “Fundamental limits in confocal microscopy,” in Handbook of Biological Confocal Microscopy, ed. J. B. Pawley (Boston, MA: Springer US), 20–42. doi: 10.1007/978-0-387-45524-2_2
Paxinos, G., and Watson, C. (2006). The Rat Brain in Stereotaxic Coordinates: Hard Cover Edition. Amsterdam: Elsevier.
Pereira, P. M., Albrecht, D., Culley, S., Jacobs, C., Marsh, M., Mercer, J., et al. (2019). Fix your membrane receptor imaging: actin cytoskeleton and CD4 membrane organization disruption by chemical fixation. Front. Immunol. 10:675. doi: 10.3389/fimmu.2019.00675
Picciotto, M. (2018). Analytical transparency and reproducibility in human neuroimaging studies. J. Neurosci. 38, 3375–3376. doi: 10.1523/JNEUROSCI.0424-18.2018
Picciotto, M. (2019). Considerations for experimental design of behavioral studies using model organisms. J. Neurosci. 39, 1–2. doi: 10.1523/JNEUROSCI.2794-18.2018
Picciotto, M. (2020). Consideration of sample size in neuroscience studies. J. Neurosci. 40, 4076–4077. doi: 10.1523/JNEUROSCI.0866-20.2020
Postma, M., and Goedhart, J. (2019). PlotsOfData—A web app for visualizing data together with their summaries. PLoS Biol. 17:e3000202. doi: 10.1371/journal.pbio.3000202
R Core Team (2021). R: The R Project for Statistical Computing. Available online at: https://www.r-project.org/ (accessed April 14, 2021).
Rasia-Filho, A., Brusco, J., Rocha, L., and Moreira, J. (2010). Dendritic spines observed by extracellular DiI dye and immunolabeling under confocal microscopy. Protoc. Exch. 1–13. doi: 10.1038/nprot.2010.153 (accessed May 05, 2021).
Richter, K. N., Revelo, N. H., Seitz, K. J., Helm, M. S., Sarkar, D., Saleeb, R. S., et al. (2018). Glyoxal as an alternative fixative to formaldehyde in immunostaining and super-resolution microscopy. EMBO J. 37, 139–159. doi: 10.15252/embj.201695709
Schindelin, J., Arganda-Carreras, I., Frise, E., Kaynig, V., Longair, M., Pietzsch, T., et al. (2012). Fiji: an open-source platform for biological-image analysis. Nat. Methods 9, 676–682. doi: 10.1038/nmeth.2019
Schmidt, U., Weigert, M., Broaddus, C., and Myers, G. (2018). “Cell detection with star-convex polygons,” in Medical Image Computing and Computer Assisted Intervention – MICCAI 2018 Lecture Notes in Computer Science, eds A. F. Frangi, J. A. Schnabel, C. Davatzikos, C. Alberola-López, and G. Fichtinger (Cham: Springer International Publishing), 265–273. doi: 10.1007/978-3-030-00934-2_30
Sezgin, M., and Sankur, B. (2004). Survey over image thresholding techniques and quantitative performance evaluation. J. Electron. Imaging 13, 146–165. doi: 10.1117/1.1631315
Sezgin, M., and Taşaltín, R. (2000). A new dichotomization technique to multilevel thresholding devoted to inspection applications. Pattern Recognit. Lett. 21, 151–161. doi: 10.1016/S0167-8655(99)00142-7
Shansky, R. M., and Murphy, A. Z. (2021). Considering sex as a biological variable will require a global shift in science culture. Nat. Neurosci. 24, 457–464. doi: 10.1038/s41593-021-00806-8
Sierra, A., de Castro, F., Del Río-Hortega, J., Rafael Iglesias-Rozas, J., Garrosa, M., and Kettenmann, H. (2016). The “Big-Bang” for modern glial biology: translation and comments on Pío del Río-Hortega 1919 series of papers on microglia. Glia 64, 1801–1840. doi: 10.1002/glia.23046
Spanswick, S. C., Bray, D., Zelinski, E. L., and Sutherland, R. J. (2009). A novel method for reliable nuclear antibody detection in tissue with high levels of pathology-induced autofluorescence. J. Neurosci. Methods 185, 45–49. doi: 10.1016/j.jneumeth.2009.09.007
Spector, D. L., and Goldman, R. D. (2006). Basic Methods in Microscopy: Protocols and Concepts from Cells?: a Laboratory Manual. Cold Spring Harbor, NY: CSHL Press.
Staffend, N. A., and Meisel, R. L. (2011). DiOlistic labeling of neurons in tissue slices: a qualitative and quantitative analysis of methodological variations. Front. Neuroanat. 5:14. doi: 10.3389/fnana.2011.00014
Sternberg, S. R. (1983). Biomedical image processing. Computer 16, 22–34. doi: 10.1109/MC.1983.1654163
Stoner, R., Chow, M. L., Boyle, M. P., Sunkin, S. M., Mouton, P. R., Roy, S., et al. (2014). Patches of disorganization in the neocortex of children with autism. N. Engl. J. Med. 370, 1209–1219. doi: 10.1056/NEJMoa1307491
Stringer, C., Wang, T., Michaelos, M., and Pachitariu, M. (2021). Cellpose: a generalist algorithm for cellular segmentation. Nat. Methods 18, 100–106. doi: 10.1038/s41592-020-01018-x
Sun, Y., and Chakrabartty, A. (2016). Cost-effective elimination of lipofuscin fluorescence from formalin-fixed brain tissue by white phosphor light emitting diode array. Biochem. Cell Biol. Biochim. Biol. Cell. 94, 545–550. doi: 10.1139/bcb-2016-0125
Sunkin, S. M., Ng, L., Lau, C., Dolbeare, T., Gilbert, T. L., Thompson, C. L., et al. (2012). Allen Brain Atlas: an integrated spatio-temporal portal for exploring the central nervous system. Nucleic Acids Res. 41, D996–D1008.
Susaki, E. A., and Ueda, H. R. (2016). Whole-body and whole-organ clearing and imaging techniques with single-cell resolution: toward organism-level systems biology in mammals. Cell Chem. Biol. 23, 137–157. doi: 10.1016/j.chembiol.2015.11.009
Swedlow, J. R., Kankaanpää, P., Sarkans, U., Goscinski, W., Galloway, G., Malacrida, L., et al. (2021). A global view of standards for open image data formats and repositories. Nat. Methods 1–7. doi: 10.1038/s41592-021-01113-7
Tao-Cheng, J.-H., Gallant, P. E., Brightman, M. W., Dosemeci, A., and Reese, T. S. (2007). Structural changes at synapses after delayed perfusion fixation in different regions of the mouse brain. J. Comp. Neurol. 501, 731–740. doi: 10.1002/cne.21276
Thorn, K. (2016). A quick guide to light microscopy in cell biology. Mol. Biol. Cell 27, 219–222. doi: 10.1091/mbc.e15-02-0088
Tye, K. M. (2018). Neural circuit motifs in valence processing. Neuron 100, 436–452. doi: 10.1016/j.neuron.2018.10.001
Tyson, A. L., Rousseau, C. V., Niedworok, C. J., Keshavarzi, S., Tsitoura, C., Cossell, L., et al. (2021). A deep learning algorithm for 3D cell detection in whole mouse brain image datasets. bioRxiv [preprint] doi: 10.1101/2020.10.21.348771
Vanden Berghe, T., Hulpiau, P., Martens, L., Vandenbroucke, R. E., Van Wonterghem, E., Perry, S. W., et al. (2015). Passenger mutations confound interpretation of all genetically modified congenic mice. Immunity 43, 200–209. doi: 10.1016/j.immuni.2015.06.011
von Chamier, L., Laine, R. F., Jukkala, J., Spahn, C., Krentzel, D., Nehme, E., et al. (2021). Democratising deep learning for microscopy with ZeroCostDL4Mic. Nat. Commun. 12:2276. doi: 10.1038/s41467-021-22518-0
Wallrafen, R., Dresbach, T., and Viotti, J. S. (2019). Quantifying the heterogeneous distribution of a synaptic protein in the mouse brain using immunofluorescence. JoVE J. Vis. Exp. 143:e58940. doi: 10.3791/58940
Wasserstein, R. L., Schirm, A. L., and Lazar, N. A. (2019). Moving to a world beyond “p < 0.05.”. Am. Stat. 73, 1–19. doi: 10.1080/00031305.2019.1583913
Weigert, M., Schmidt, U., Haase, R., Sugawara, K., and Myers, G. (2020). “Star-convex Polyhedra for 3D Object Detection and Segmentation in Microscopy,” in Proceedings of the 2020 IEEE Winter Conference on Applications of Computer Vision (WACV), (Piscataway, NJ: IEEE), 3655–3662. doi: 10.1109/WACV45572.2020.9093435
Whittington, N. C., and Wray, S. (2017). Suppression of red blood cell autofluorescence for immunocytochemistry on fixed embryonic mouse tissue. Curr. Protoc. Neurosci. 81, 2.28.1–2.28.12. doi: 10.1002/cpns.35
Wilkinson, M. D., Dumontier, M., Aalbersberg, I. J. J., Appleton, G., Axton, M., Baak, A., et al. (2016). The FAIR Guiding Principles for scientific data management and stewardship. Sci. Data 3:160018. doi: 10.1038/sdata.2016.18
Wilt, B. A., Burns, L. D., Wei Ho, E. T., Ghosh, K. K., Mukamel, E. A., and Schnitzer, M. J. (2009). Advances in light microscopy for neuroscience. Annu. Rev. Neurosci. 32, 435–506. doi: 10.1146/annurev.neuro.051508.135540
Woitowich, N. C., Beery, A., and Woodruff, T. (2020). A 10-year follow-up study of sex inclusion in the biological sciences. eLife 9:e56344. doi: 10.7554/eLife.56344
Wolf, H. K., Buslei, R., Schmidt-Kastner, R., Schmidt-Kastner, P. K., Pietsch, T., Wiestler, O. D., et al. (1996). NeuN: a useful neuronal marker for diagnostic histopathology. J. Histochem. Cytochem. 44, 1167–1171. doi: 10.1177/44.10.8813082
Yao, R.-W., Luan, P.-F., and Chen, L.-L. (2021). An optimized fixation method containing glyoxal and paraformaldehyde for imaging nuclear bodies. RNA 27, 725–733. doi: 10.1261/rna.078671.120
Yates, S. C., Groeneboom, N. E., Coello, C., Lichtenthaler, S. F., Kuhn, P.-H., Demuth, H.-U., et al. (2019). QUINT: workflow for quantification and spatial analysis of features in histological images from rodent brain. Front. Neuroinformatics 13:75. doi: 10.3389/fninf.2019.00075
Yuste, R., Hawrylycz, M., Aalling, N., Aguilar-Valles, A., Arendt, D., Armañanzas, R., et al. (2020). A community-based transcriptomics classification and nomenclature of neocortical cell types. Nat. Neurosci. 23, 1456–1468. doi: 10.1038/s41593-020-0685-8
Zhang, J., and Xiong, H. (2014). “Brain tissue preparation, sectioning, and staining,” in Current Laboratory Methods in Neuroscience Research Springer Protocols Handbooks, eds H. Xiong and H. E. Gendelman (New York, NY: Springer), 3–30. doi: 10.1007/978-1-4614-8794-4_1
Zhao, X., and van Praag, H. (2020). Steps towards standardized quantification of adult neurogenesis. Nat. Commun. 11:4275. doi: 10.1038/s41467-020-18046-y
Keywords: open science, fluorescence microscopy, image analysis, mouse brain, reproducibility, experimental design, neuroscience
Citation: Sanchez-Arias JC, Carrier M, Frederiksen SD, Shevtsova O, McKee C, van der Slagt E, Gonçalves de Andrade E, Nguyen HL, Young PA, Tremblay M-È and Swayne LA (2021) A Systematic, Open-Science Framework for Quantification of Cell-Types in Mouse Brain Sections Using Fluorescence Microscopy. Front. Neuroanat. 15:722443. doi: 10.3389/fnana.2021.722443
Received: 08 June 2021; Accepted: 28 October 2021;
Published: 06 December 2021.
Edited by:
Chiara Magliaro, University of Pisa, ItalyReviewed by:
Nicholas W. Plummer, National Institute of Environmental Health Sciences (NIEHS), United StatesFlorian Levet, UMR 5297 Institut Interdisciplinaire de Neurosciences (IINS), France
Copyright © 2021 Sanchez-Arias, Carrier, Frederiksen, Shevtsova, McKee, van der Slagt, Gonçalves de Andrade, Nguyen, Young, Tremblay and Swayne. This is an open-access article distributed under the terms of the Creative Commons Attribution License (CC BY). The use, distribution or reproduction in other forums is permitted, provided the original author(s) and the copyright owner(s) are credited and that the original publication in this journal is cited, in accordance with accepted academic practice. No use, distribution or reproduction is permitted which does not comply with these terms.
*Correspondence: Juan C. Sanchez-Arias, juansa@uvic.ca; Micaël Carrier, micael.carrier.1@ulaval.ca; Leigh Anne Swayne, lswayne@uvic.ca
†These authors have contributed equally to this work