The Neurotransmitter Receptor Architecture of the Mouse Olfactory System
 Kimberley Lothmann
 Katrin Amunts
 Christina Herold
- 1C. & O. Vogt-Institute of Brain Research, Medical Faculty, University Hospital Düsseldorf, Heinrich Heine University of Düsseldorf, Düsseldorf, Germany
- 2Institute of Neuroscience and Medicine INM-1, Research Centre Jülich, Jülich, Germany
The uptake, transmission and processing of sensory olfactory information is modulated by inhibitory and excitatory receptors in the olfactory system. Previous studies have focused on the function of individual receptors in distinct brain areas, but the receptor architecture of the whole system remains unclear. Here, we analyzed the receptor profiles of the whole olfactory system of adult male mice. We examined the distribution patterns of glutamatergic (AMPA, kainate, mGlu2/3, and NMDA), GABAergic (GABAA, GABAA(BZ), and GABAB), dopaminergic (D1/5) and noradrenergic (α1 and α2) neurotransmitter receptors by quantitative in vitro receptor autoradiography combined with an analysis of the cyto- and myelo-architecture. We observed that each subarea of the olfactory system is characterized by individual densities of distinct neurotransmitter receptor types, leading to a region- and layer-specific receptor profile. Thereby, the investigated receptors in the respective areas and strata showed a heterogeneous expression. Generally, we detected high densities of mGlu2/3Rs, GABAA(BZ)Rs and GABABRs. Noradrenergic receptors revealed a highly heterogenic distribution, while the dopaminergic receptor D1/5 displayed low concentrations, except in the olfactory tubercle and the dorsal endopiriform nucleus. The similarities and dissimilarities of the area-specific multireceptor profiles were analyzed by a hierarchical cluster analysis. A three-cluster solution was found that divided the areas into the (1) olfactory relay stations (main and accessory olfactory bulb), (2) the olfactory cortex (anterior olfactory cortex, dorsal peduncular cortex, taenia tecta, piriform cortex, endopiriform nucleus, entorhinal cortex, orbitofrontal cortex) and the (3) olfactory tubercle, constituting its own cluster. The multimodal receptor-architectonic analysis of each component of the olfactory system provides new insights into its neurochemical organization and future possibilities for pharmaceutic targeting.
Introduction
Olfactory areas form a highly interconnected network to process chemical olfactory information for olfactory recognition, memory, mating, and learning in mice. Thereby the olfactory system consists of two main subdivisions, the main and the accessory olfactory system. The processing of sensory stimuli into functional olfactory information is further accomplished by the primary and the secondary olfactory cortex. The primary olfactory cortex is composed of the anterior olfactory cortex (anterior olfactory nucleus), the taenia tecta (dorsal, ventral), the dorsal peduncular cortex, the olfactory tubercle, the piriform cortex with the dorsal endopiriform nucleus and the entorhinal cortex (lateral and medial). These structures directly receive input from the main olfactory bulb and project back (Luskin and Price, 1983; Shepherd, 2004; Wilson et al., 2015). The orbitofrontal cortex (medial, lateral, and ventrolateral), particularly the medial part, represents the secondary olfactory cortex. While the peripheral sensory organs of the olfactory epithelium and vomeronasal organ initiate the uptake, different neurotransmitter systems of the main and accessory olfactory CNS serve to process the information and, moreover, modulate cortical and subcortical olfactory areas via feedback-regulation. Therefore, we focused on all known cortical and subcortical olfactory areas and their receptor architecture in the mouse brain.
Sensory information is first processed in the main and accessory olfactory bulb via various neurotransmitters, either supplied directly by local interneurons of both, the main and accessory olfactory bulbs (main olfactory bulb: Murphy et al., 2004; Shepherd, 2004; Ennis et al., 2007; Linster and Cleland, 2016; Blakemore et al., 2018; Dong and Ennis, 2018; accessory olfactory bulb: Brennan et al., 1995; Dudley and Moss, 1995; Jia et al., 1999; Mohrhardt et al., 2018), via the horizontal limb of the diagonal band (GABAergic and cholinergic input; Brashear et al., 1986; Zaborszky et al., 1986) and the locus coeruleus (noradrenergic input; McLean et al., 1989). Several studies focused on the role of neurotransmitters in the olfactory system and showed that AMPARs/kainateRs and NMDARs regulate the excitability of mitral and tufted cells (Salin et al., 2001; Urban and Sakmann, 2002; Christie and Westbrook, 2006; Blakemore et al., 2018). Further, glutamatergic receptors play a role in vomeronasal stimulation in the glomeruli of the accessory olfactory bulb, enabling social and reproductive events (Dudley and Moss, 1995; Mohrhardt et al., 2018). Group II metabotropic glutamate receptors (mGluRs) (Zak et al., 2015), GABAergic GABAARs and GABABRs (Smith and Jahr, 2002; Shepherd, 2004; Panzanelli et al., 2005) enable the contrasting of odors, while GABAA benzodiazepine binding sites (GABAA(BZ)Rs) play a pivotal role in olfactory discrimination learning (McGregor et al., 2004; Sokolic and McGregor, 2007). Noradrenaline receptors are active during reward odor responses (Doucette et al., 2011), while dopamine receptors generate odor-preference and modulate reward signals in the olfactory tubercle (Zhang et al., 2017).
However, previous studies that examined the receptor distribution regarding specific functions of olfactory areas often focused on larger areas, for example, the main olfactory bulb (Shepherd, 2004; Ennis et al., 2007), the piriform (Petralia and Wenthold, 1992; Wisden and Seeburg, 1993; Petralia et al., 1994a,b; Wada et al., 1998; Ennis et al., 2007) and entorhinal cortex (Fotuhi et al., 1994; Caruana et al., 2006; Thompson et al., 2006; West et al., 2007; Middleton et al., 2008; Glovaci et al., 2014; Glovaci and Chapman, 2019), while the smaller areas like the taenia tecta, the dorsal peduncular cortex and the dorsal endopiriform nucleus were less covered. Furthermore, most studies focused on a specific receptor or receptor family. For example, there have been studies (for review see: Shepherd, 2004; Ennis et al., 2007) providing information about the receptors in individual olfactory areas, but no reference atlas of the entire system has been generated to provide a basis to link the accumulated knowledge on a chemoarchitectural level.
Up to now, the cytoarchitecture, the connectivity and functionality of the rodent olfactory areas are widely known (Dong, 2008; Ennis et al., 2008, 2015; Mucignat-Caretta, 2010; Franklin and Paxinos, 2013; Cleland and Linster, 2019), with exception of the taenia tecta and the dorsal peduncular cortex. The taenia tecta is divided into two parts. The dorsal part is referred to the hippocampal formation while the ventral part corresponds to the main olfactory cortex (Haberly and Price, 1978; Luskin and Price, 1983; Santiago and Shammah-Lagnado, 2005; Shiotani et al., 2020). To gain a more comprehensive understanding of the olfactory system including its different areas, it is necessary to focus on these regions as well because they are part of the primary olfactory cortex and connect the olfactory network within the limbic system (Dong, 2008; Ennis et al., 2008; Mucignat-Caretta, 2010; Franklin and Paxinos, 2013; Ennis et al., 2015; Cleland and Linster, 2019).
In addition, the in vitro receptor autoradiography of the olfactory system shows anatomically distinct and different receptor densities at a high spatial resolution. This provides a basis for the validation/development of existing/potential positron emission tomography (PET) tracers, a technique with a 10-times lower resolution compared to autoradiography (Bergström et al., 2003). PET as an interdisciplinary, non-invasive in vivo method is used for the study of neuropharmacological drug-receptor targets, particularly in rodent brains (Lancelot and Zimmer, 2010; Herfert et al., 2020). Importantly, the olfactory system seems to play a pivotal role in the neuropathology of neurodegenerative diseases like Alzheimer's or Parkinson's disease. Here, olfactory dysfunction is one of the first clinical symptoms (Mesholam et al., 1998; Albers et al., 2006; Zou et al., 2016). Thus, the understanding of the specific receptor distribution may help to find strategies for new therapeutic targets. Therefore, we investigated the receptor distribution of glutamatergic (AMPA, kainate, NMDA, mGlu2/3), GABAergic (GABAA, GABAA(BZ), GABAB), noradrenergic (α1, α2) and dopaminergic (D1/5) receptors in detail. Our findings not only resulted in a chemoarchitectonic parceling of the olfactory areas and layers, but also provides a detailed, layer-specific multi-receptor profile of all known associated regions of the entire olfactory system. The comparative analysis of the different receptor profiles (ratio of the different receptors in a brain area) within the system may also help to gain further insights into hitherto undiscovered area functionality. Therefore, the specific analysis of multiple receptor expressions of the entire rodent olfactory system and the observed receptor architecture can serve as a comparative multireceptor map and provides further insights in previously less studied regions such as the taenia tecta and the dorsal peduncular cortex. We also provide a molecular organization profile within the primary olfactory cortex by multi-receptor fingerprints and a subsequent multidimensional cluster analysis.
Materials and Methods
Animals and Tissue Preparation
Ten, adult male C57BL/6 mice from CERJ (Janvier Labs, Germany) were kept in two groups (five animals/cage) in an enriched environment under constant room temperature and humidity control in a 12-h light-dark cycle for 8 weeks. Water and food pellets were provided ad libitum. At the time of brain removal, each mouse was 27 weeks in age.
The project was implemented in accordance with the guidelines of the “Landesamt für Natur, Umwelt und Verbraucherschutz NRW, Germany (LANUV),” the directives of the National Institute of Health Guide for Care and Use of Laboratory Animals in addition to the German Animal Welfare Act (Az.87-51.04.2010.A250).
To perform the histology and receptor autoradiography the ten mice were decapitated, and their brains were directly removed and frozen in isopentane at −40°C. Until dissection, the tissues were stored at −80°C and were processed contemporary.
Histology and Receptor Autoradiography
Serial coronal sections (16 μm) were obtained from a hemisphere/animal (in total n = 10, left and right hemispheres were randomized) using a cryostat microtome (Leica, Germany). Each brain was used for all ligands. Overall, a total of 37–40 slices were processed from a single mouse brain for each ligand. For the analysis of the olfactory system, only sections between Bregma level 3.56 to −2.92 mm, previously identified using a cytoarchitectonic atlas of the C57BL6 mouse brain (Hof et al., 2000), were analyzed. To achieve a sufficient number of data per region of interest, at least nine slices per ligand and mouse were used. This gave us a total of 90 sections per mouse for receptor autoradiography and 18 sections per mouse for histology (cell body and myelin staining). After dissecting, slices were frozen and stored at −80° to process all slices for each ligand at the same time. The detailed autoradiographic labeling procedure has been published elsewhere (Zilles et al., 2002a,b; Schleicher et al., 2005). The glass-mounted slices have been prepared according to a standard protocol for quantitative in vitro receptor autoradiography (Zilles et al., 2002a,b; Palomero-Gallagher et al., 2009; Herold et al., 2017; Supplementary Table 1). Glutamatergic, GABAergic, noradrenergic und dopaminergic receptors were labeled using the respective tritiated ligands: [3H]AMPA (AMPAR), [3H]kainate (kainateR), [3H]MK-801 (NMDAR), [3H]LY-341495 (mGlu2/3R), [3H]muscimol (GABAAR), [3H]flumazenil (GABAA associated benzodiazepine (BZ) binding sites, GABAA(BZ)R), [3H]CGP-54626 (GABABR), [3H]prazosin (α1R), [3H]RX-821002 (α2R), and [3H]SCH-23390 (D1/5R). Additionally, cryosections were stained for cell bodies in regular intervals using standard staining protocols to label cell bodies and myelinated fibers for cyto- and myeloarchitectonic analysis, respectively (Gallyas, 1971; Merker, 1983).
The first step of receptor autoradiography involved the pre-incubation of the sections by rinsing the endogenous ligand. Subsequently, the main incubation is performed. Here, both the total binding as well as the unspecific binding is determined. For total binding, sections were labeled with the tritiated receptor ligand, whereas in unspecific binding, a specific, unlabeled displacer was co-incubated. To stop the binding process, slices were rinsed with buffer to remove the non-specific radioactive ligand. Thereafter, the radioactively marked tissue sections were exposed to tritium-sensitive hyperfilms (Hyperfilm, Amersham, UK) for 10–18 weeks together with isotope [3H]-standards of known radioactivity concentrations (Microscales, Amersham, UK). The exposure time depends on the binding saturation. The time has to be sufficiently long for measurable signals, but not too long to obtain a good signal-to-noise ratio and a low background signal. All slices of one brain hemisphere were simultaneously and constantly exposed: 10 weeks (GABAA(BZ)), 12 weeks (kainate, NMDA, mGlu2/3, GABAA, GABAB), or 15 weeks (AMPA, D1/5).
Image Analysis
The resulting autoradiographs were densiometrically processed with an image analysis technique (Figure 1, Zilles et al., 2002b, Schleicher et al., 2005). They were digitized using AxioVision Rel. 4.7 (Zeiss, Germany), in-house scripts and an AxioCam camera (Zeiss, Japan). The images were stored as binary files with a resolution of 512 × 512 pixels and 8-bit gray value. Initially, a calibration curve (Figure 1A) was defined using the gray values of the microscales with known radioactivity concentration. According to the specific experimental conditions, this calibration curve was adjusted specifically for each ligand (e.g., specific activity, dissociation constant, and free concentration of the ligand during incubation; see Zilles et al., 2002b; Zilles and Palomero-Gallagher, 2017). The concentrations of binding sites were transformed into fmol/mg protein at saturation conditions by
where KD is the equilibrium dissociation constant of ligand-binding kinetics, L the incubation concentration of ligand, AS the specific activity of the ligand. The results determine the binding site density measurements.
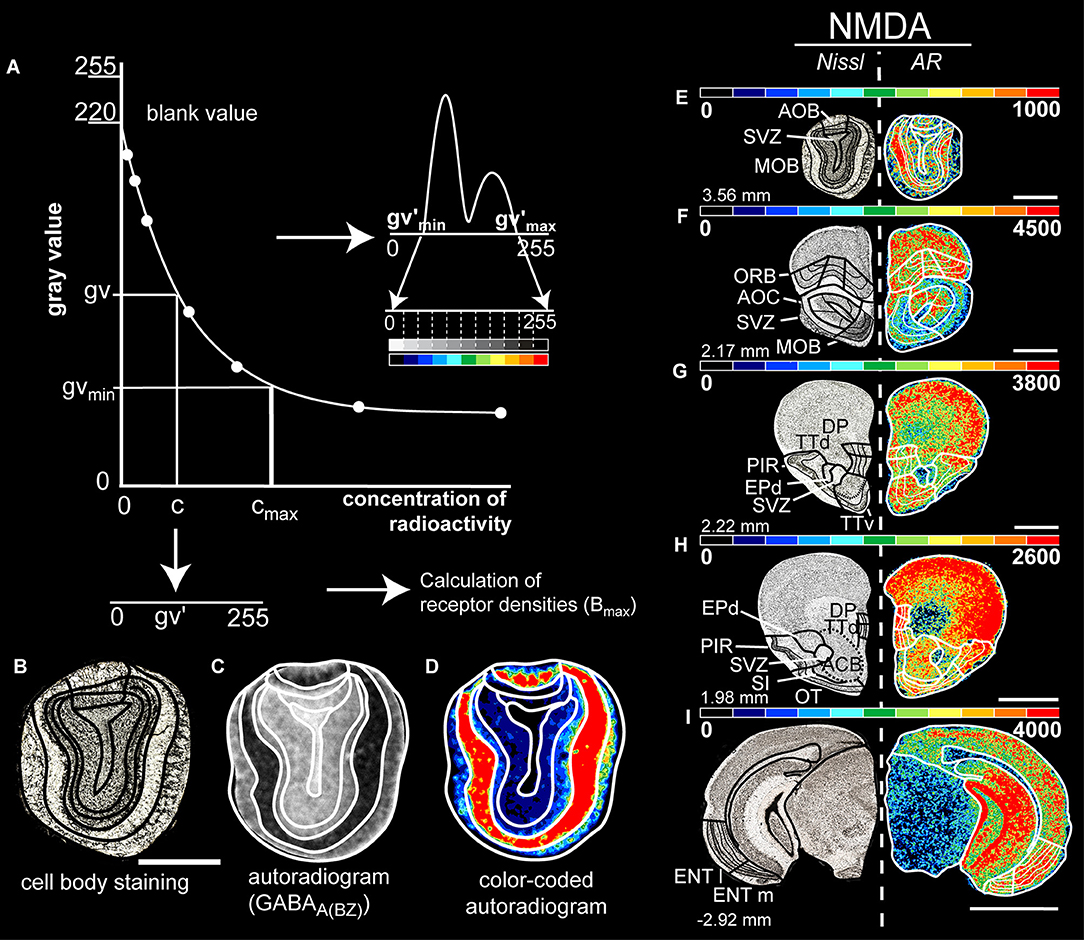
Figure 1. (A) Calibration curve of the co-exposed isotope standards of known radioactivity for computation of the concentration of the bound ligand. A non-linear dependence of gray values and radioactivity concentration is provided. This allows the gray values of the autoradiograms to be converted pixel by pixel to the corresponding concentration of radioactivity. A gray level histogram of the transformed autoradiogram (C) was generated, followed by a linear contrast enhancement procedure. Here, the gray-scale histogram is transformed into a spectral arrangement of 11 colors to facilitate visualization of the density patterns on the autoradiograms (D). A brain section of the same level with cell body staining (B) is used simultaneously to determine the boundaries. Figure (A) adapted by Zilles and Schleicher (1995) and Herold et al. (2014). (E–I) Exemplary figure of the border identification in color-coded images that shows the distribution and density of glutamatergic NMDA receptors at different Bregma levels (left). The color scale of 11 equally distributed colors corresponds to the densities of receptors in fmol/mg protein. The color scale of each image has been optimized to provide the best visualization for different densities of the receptors. Therefore, the red end corresponds to the best visual fit for the investigated olfactory structure that is not necessarily the maximum density. Scale bars: (B–E), 1.3 mm; (F–H), 1.5 mm; (I), 2 mm; MOB, main olfactory bulb; AOB, accessory olfactory bulb; AOC, anterior olfactory nucleus; TTd, taenia tecta, dorsal; TTv, taenia tecta, ventral; DP, dorsal peduncular cortex; PIR, piriform cortex; EPd, dorsal endopiriform nucleus; ENTl, entorhinal cortex, lateral; ENTm, entorhinal cortex, medial; ORB, orbitofrontal cortex; OT, olfactory tubercle; SVZ, subependymal zone; SI, substantia innominate.
The calibration curve is used to compute the gray values of autoradiography images into their corresponding concentrations of radioactivity. By non-linear, least-squares fitting, the relationship between gray values of the autoradiographs and concentrations of radioactivity is defined. By interpolation of each pixel into the calibration curve, the pixel is converted into the corresponding concentration of radioactivity. Subsequently, it is linearly transformed into a new range of 256 gray values (0, black to 255, white) to create a linearized autoradiogram in which gray values are a linear function of the concentration of radioactivity (Figure 1A).
Anatomical Identification
For the identification of the regions of interest we converted the original autoradiogram into its pseudo-color-coded ligand-specific image for visual purposes (Figures 1C,D). Based on a predefined spectral assignment of 11 colors to the density ranges, an optimized visualization of the densities of the autoradiograms is achieved (Figures 1E–I; Zilles and Schleicher, 1995).
Subsequently, we compared these colored autoradiograms with the adjacent Nissl or myelin sections, the brain atlas of Paxinos (Franklin and Paxinos, 2013) and the Allen Brain Atlas (Lein et al., 2007; Dong, 2008) to locate the boundaries of the brain regions (Figures 1B–D).
The obtained receptor densities of each investigated region of the olfactory system were calculated over all available tissues of a hemisphere for each animal, averaged over the ten animals and given as total receptor concentration (mean concentration ± standard error of means in fmol/mg protein; Table 1, Supplementary Tables 2, 3). The quantitative multi-receptor data are presented in color-coded autoradiographs (Figures 3–9), a heat map (Figure 10) and regional receptor fingerprints (Figure 11).
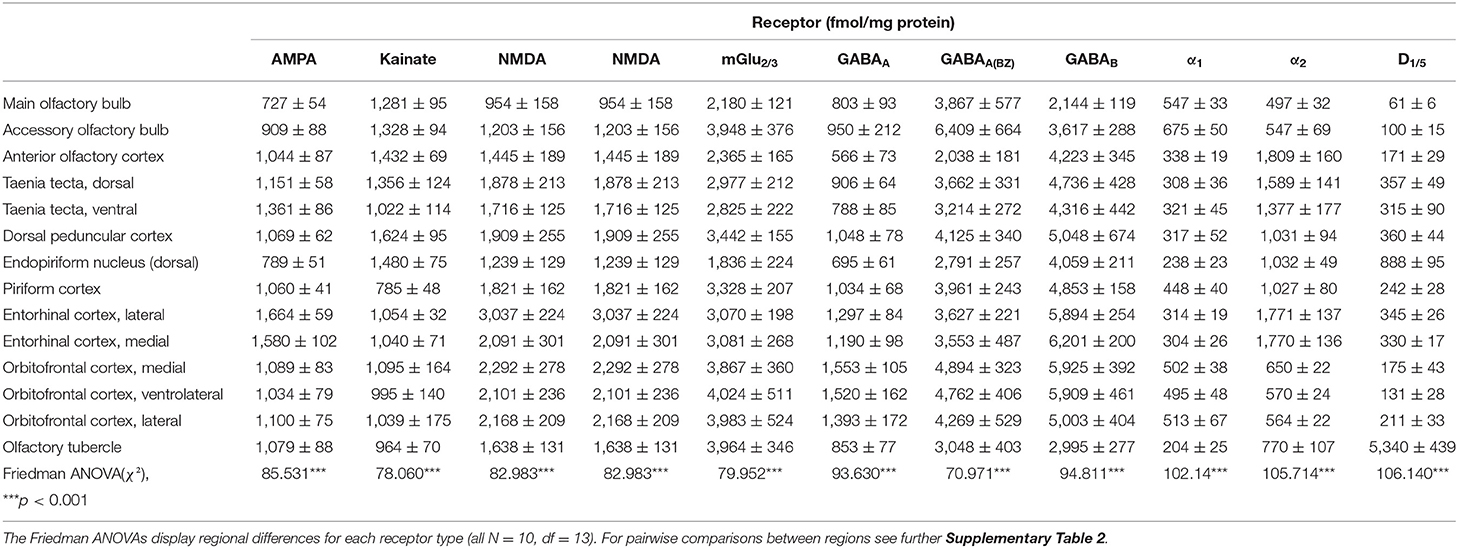
Table 1. Neurotransmitter receptor densities (fmol/mg protein) in different regions of the mouse olfactory system (Mean ± SEM).
Statistical Analysis
For statistical analysis, all measured values regarding our regions of interests were used. A Friedman ANOVA was performed across all subregions and layers for each receptor to detect general differences in the chemoarchitecture of the different areas of the olfactory system. If a significant result was obtained, a Wilcoxon rank test was then performed for pairwise inter-subarea comparisons (Supplementary Tables 4–16). A Dunn-Bonferroni post-hoc test was used for regional differences (Supplementary Table 2). Statistica 10 (StatSoft, Tulsa, RRID:SCR_015627) was used for Wilcoxon rank tests, SPSS (IBM Corp. Released 2017. IBM SPSS Statistics for Windows, Version 25.0. Armonk, NY: IBM Corp.) was used for the Friedman ANOVA and Dunn-Bonferroni post-hoc tests. The significance level was set to 0.05. Statistical data are available in Table 1, Supplementary Tables 2, 4–16.
A hierarchical cluster analysis was performed using SPSS Statistics 26 (Figures 10, 11). The degree of similarity or dissimilarity between the multi-receptor balance of the analyzed areas was quantified in pairs over the Euclidean distance. The result was visualized in two dimensions using non-linear multidimensional scaling (MDS; Figure 11). The resulting clusters of the areas based on the receptor profile of the respective areas were determined by hierarchical cluster analysis (Ward linkage with Euclidean distances). To visualize the normalized mean values of the receptor densities and therefore to display the proportion of the individual receptors within a cluster, we generated a heat map. The order of the ROIs is based on the outcome of the cluster analysis and is represented by a dendrogram (Figure 10).
Results
Areas of the main and accessory olfactory bulb at Bregma level 3.56 mm, the orbitofrontal cortex (medial, ventrolateral, lateral) and the anterior olfactory nucleus at Bregma level 2.17 mm, the piriform cortex, the taenia tecta (dorsal, ventral) at Bregma level 2.22 to 1.98 mm, the dorsal peduncular cortex at Bregma level 1.98 mm and the entorhinal cortex at Bregma level −2.92 mm have been mapped and analyzed. Figure 2 illustrates the anatomical subdivisions of the olfactory system that we used to map the receptor autoradiographs. The densities of the receptor binding sites of all analyzed receptors are presented for each region of interest in the color-coded autoradiographs (Figures 3–9), as well as in multireceptor fingerprints (Figure 11). The mean densities for each olfactory area are summarized in Table 1, the layer-specific densities are provided in Supplementary Table 2. All receptor binding densities are provided in fmol/mg protein. For statistical analyses see Table 1, Supplementary Tables 2, 4–16.
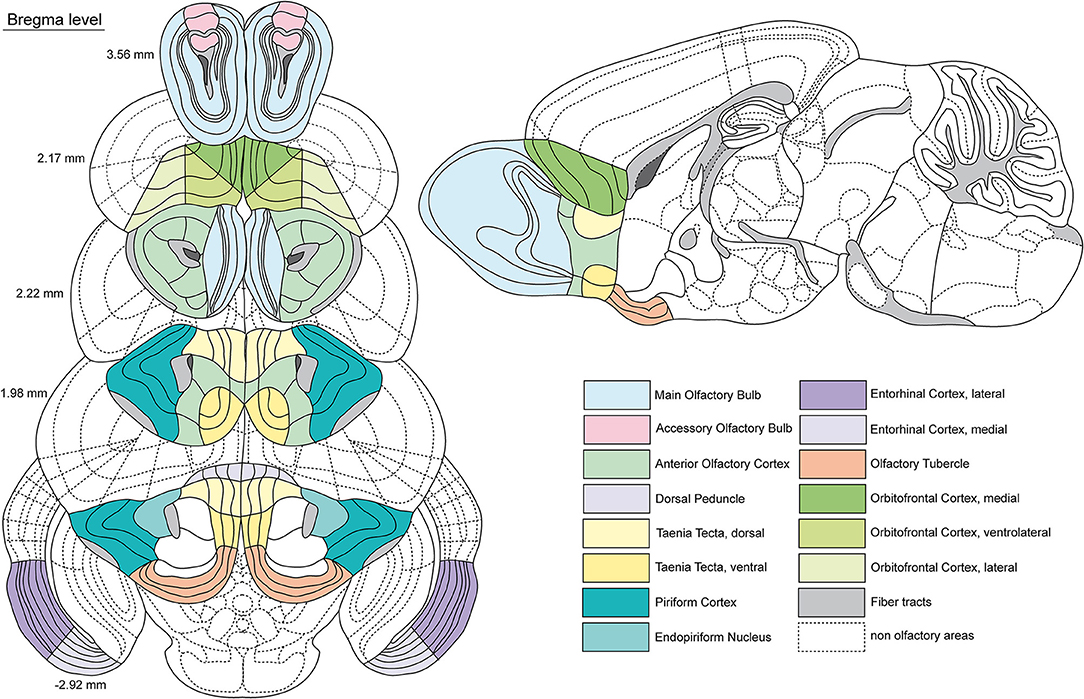
Figure 2. Schematic representation of the investigated olfactory areas. Coronal sections of the mouse (C57BL/6) brain along the anterior-posterior axis (related Bregma levels alongside). A sagittal section serves for further local orientation of certain areas. The investigated areas are indicated by different colors (see legend). Dashed lines show non olfactory areas for a better orientation. Gray areas show fiber tracts, whereas dark gray areas represent the subventricular zone. Boundaries adapted by the Allen Brain Reference Atlas (Lein et al., 2007; Dong, 2008).
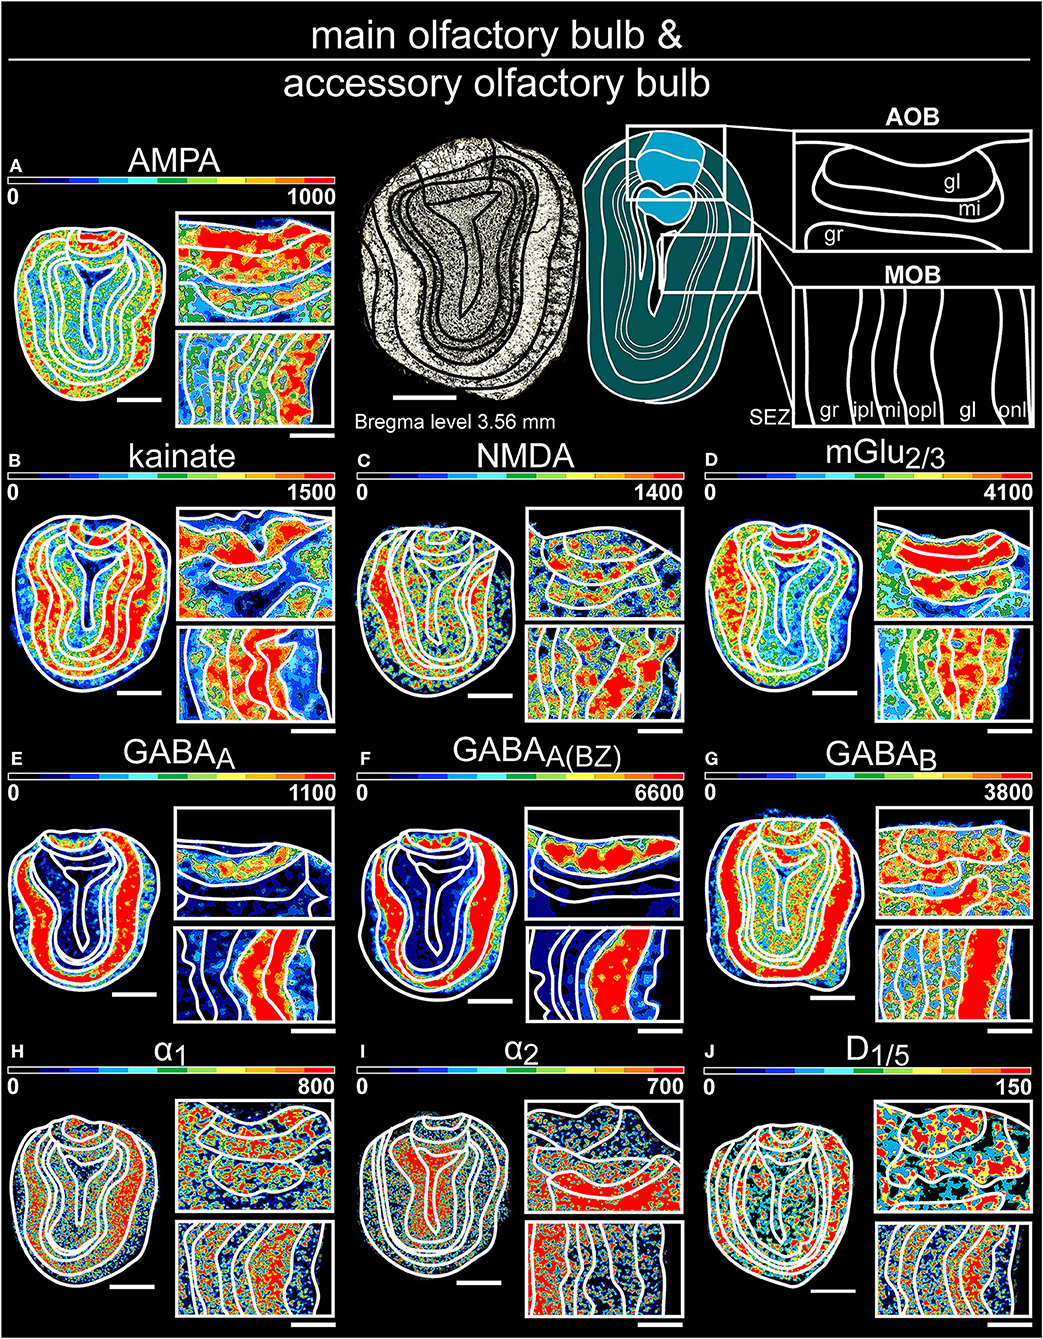
Figure 3. Color-coded autoradiographs showing the distribution and density of all investigated receptors of the main olfactory bulb (A–J) and accessory olfactory bulb (K–T). Densities of the color-coded autoradiograms in fmol/mg protein according to color scales. For detailed receptor densities see Table 1. Scale bars: (A–J), Coronal slice: 1.3 mm; Magnifications: 400 μm; onl, olfactory nerve layer; gl, glomerular layer; mi, mitral layer; ipl, inner plexiform layer; opl, outer plexiform layer; gr, granular layer; SEZ subependymal zone.
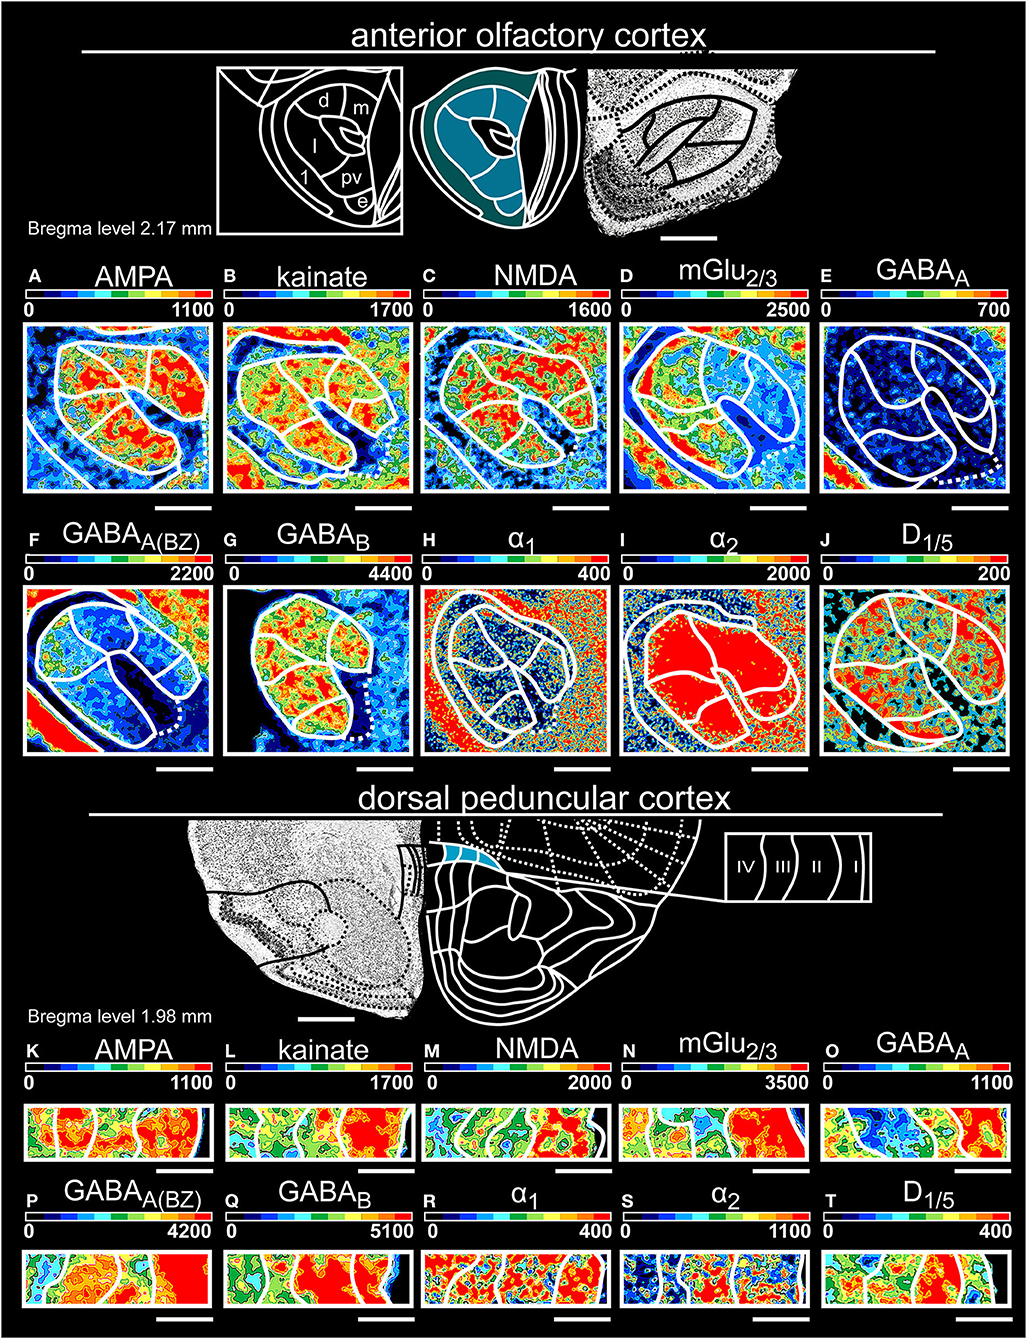
Figure 4. Color-coded autoradiographs showing the distribution and density of all investigated receptors of the anterior olfactory cortex (A–J) and dorsal peduncular cortex (K–T). Densities of the color-coded autoradiograms in fmol/mg protein according to color scales. For detailed receptor densities see Table 1. Scale bars: Atlas, 800 μm; (A–J), 600 μm; (K–T), 200 μm; m, medial; d, dorsal; l, lateral; pv, posteroventral; 1, pars externa. I, layer 1; II, layer 2; III, layer 3; IV, layer 4.
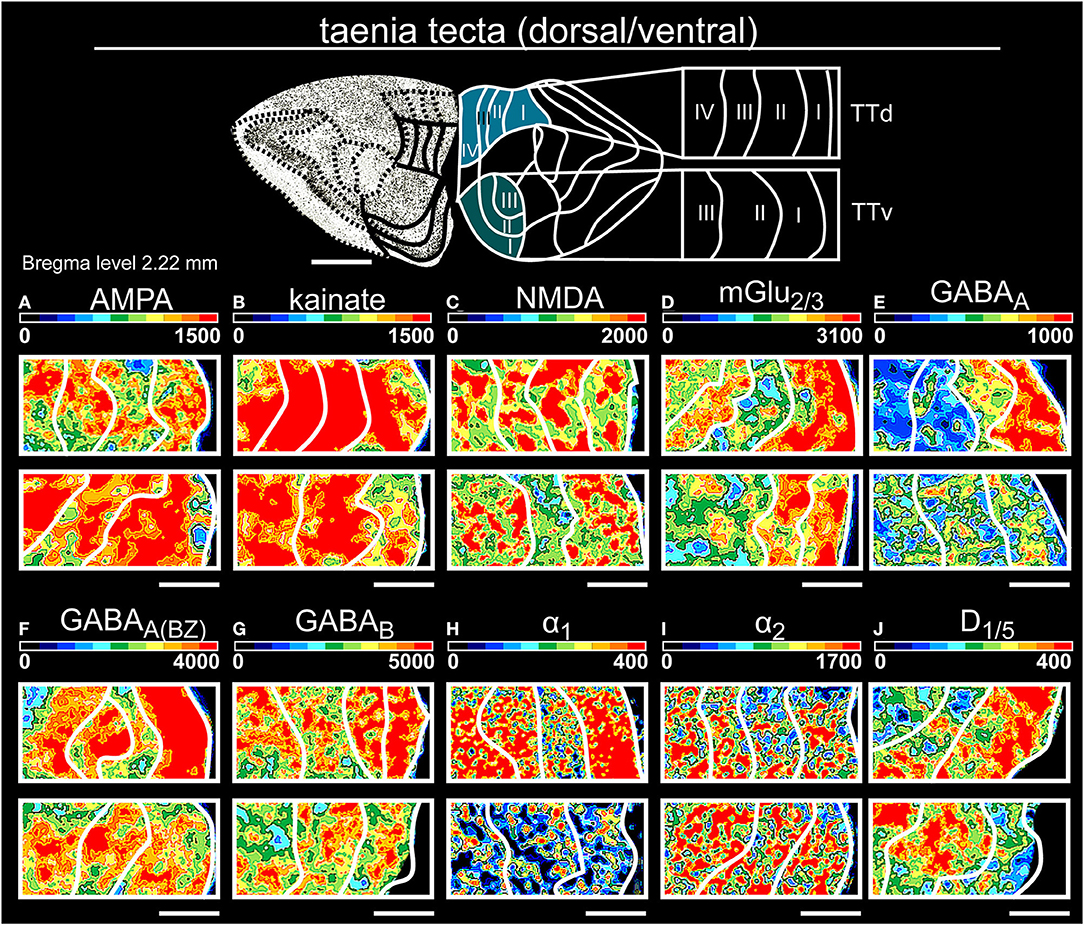
Figure 5. Color-coded autoradiographs showing the distribution and density of all investigated receptors of the taenia tecta (dorsal, ventral). Densities of the color-coded autoradiograms in fmol/mg protein according to color scales. For detailed receptor densities see Table 1. Scale bars: Atlas, 1 mm; (A–J), 400 μm; TTd, taenia tecta, dorsal; TTv, taenia tecta, ventral. I, layer 1; II, layer 2; III, layer 3; IV, layer 4.
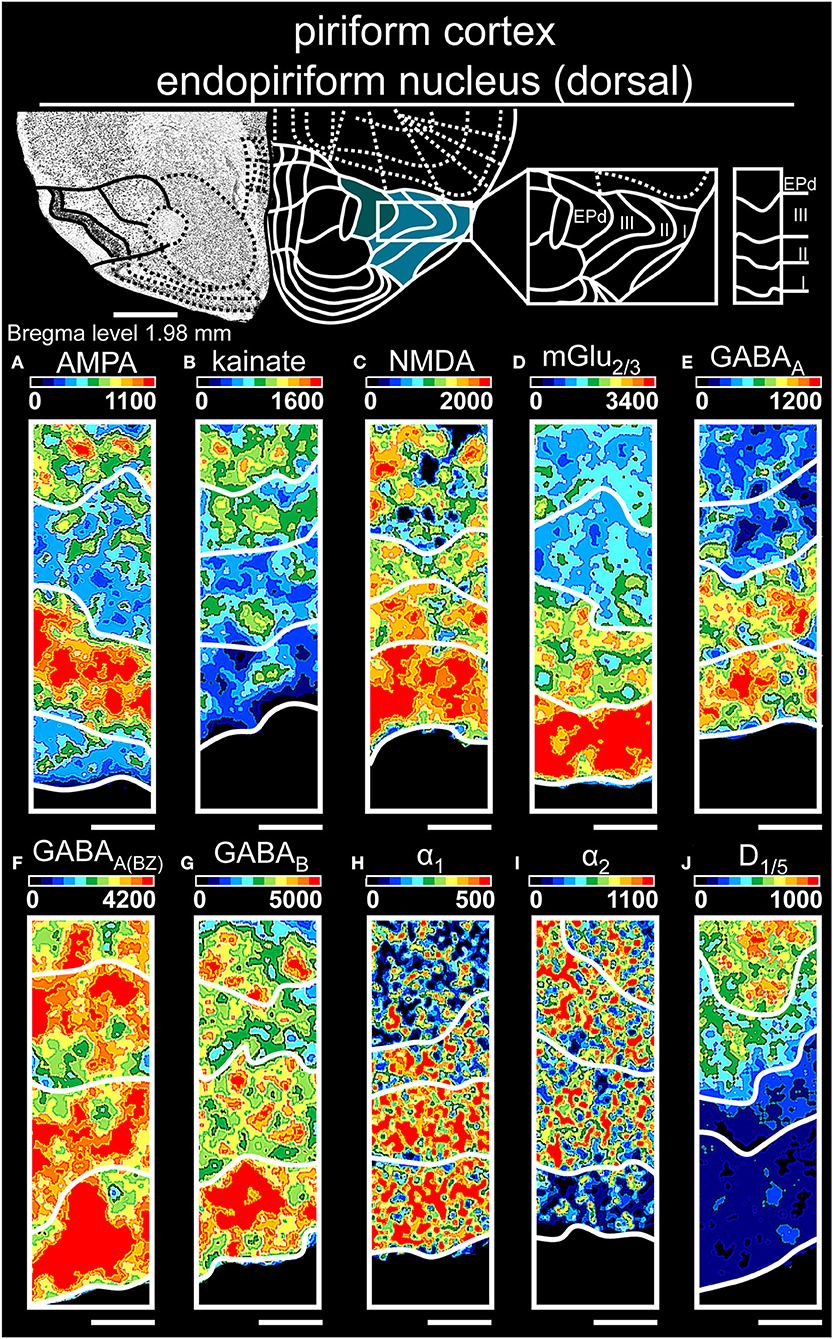
Figure 6. Color-coded autoradiographs showing the distribution and density of all investigated receptors of the piriform cortex and endopiriform nucleus (dorsal). Densities of the color-coded autoradiograms in fmol/mg protein according to color scales. For detailed receptor densities see Table 1. Scale bars: Atlas, 1.2 mm; (A–J), 400 μm; EPd, dorsal endopiriform nucleus. I, layer 1; II, layer 2; III, layer 3.
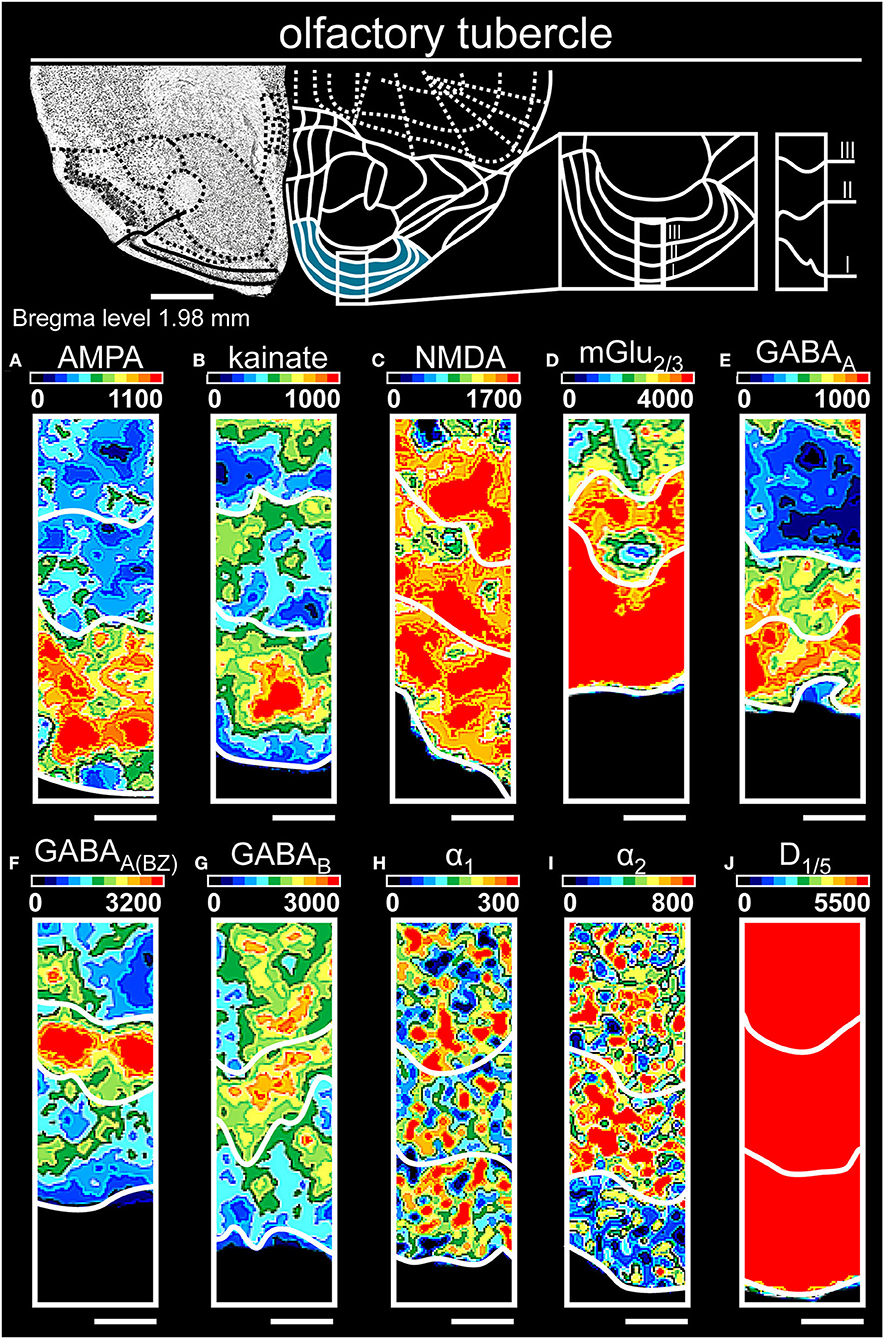
Figure 7. Color-coded autoradiographs showing the distribution and density of all investigated receptors of the olfactory tubercle. Densities of the color-coded autoradiograms in fmol/mg protein according to color scales. For detailed receptor densities see Table 1. Scale bars: Atlas, 1.2 mm; (A–J), 400 μm. I, layer 1; II, layer 2; III, layer 3.
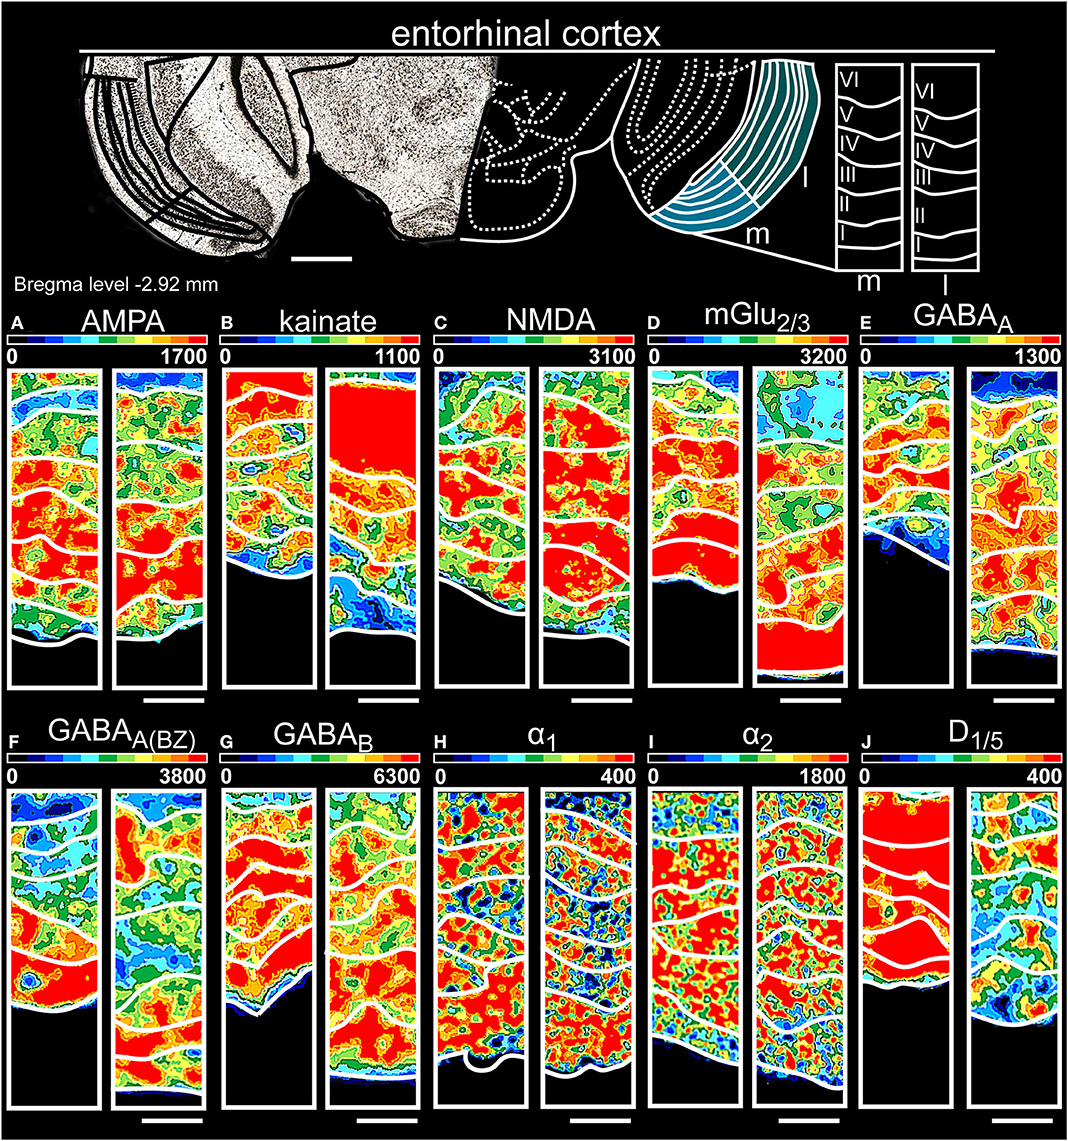
Figure 8. Color-coded autoradiographs showing the distribution and density of all investigated receptors of the entorhinal cortex (l, lateral; m, medial). Densities of the color-coded autoradiograms in fmol/mg protein according to color scales. For detailed receptor densities see Table 1. Scale bars: Atlas, 1.5 mm; (A–J), 200 μm. I, layer 1; II, layer 2; III, layer 3; IV, layer 4; V, layer 5; VI, layer 6.
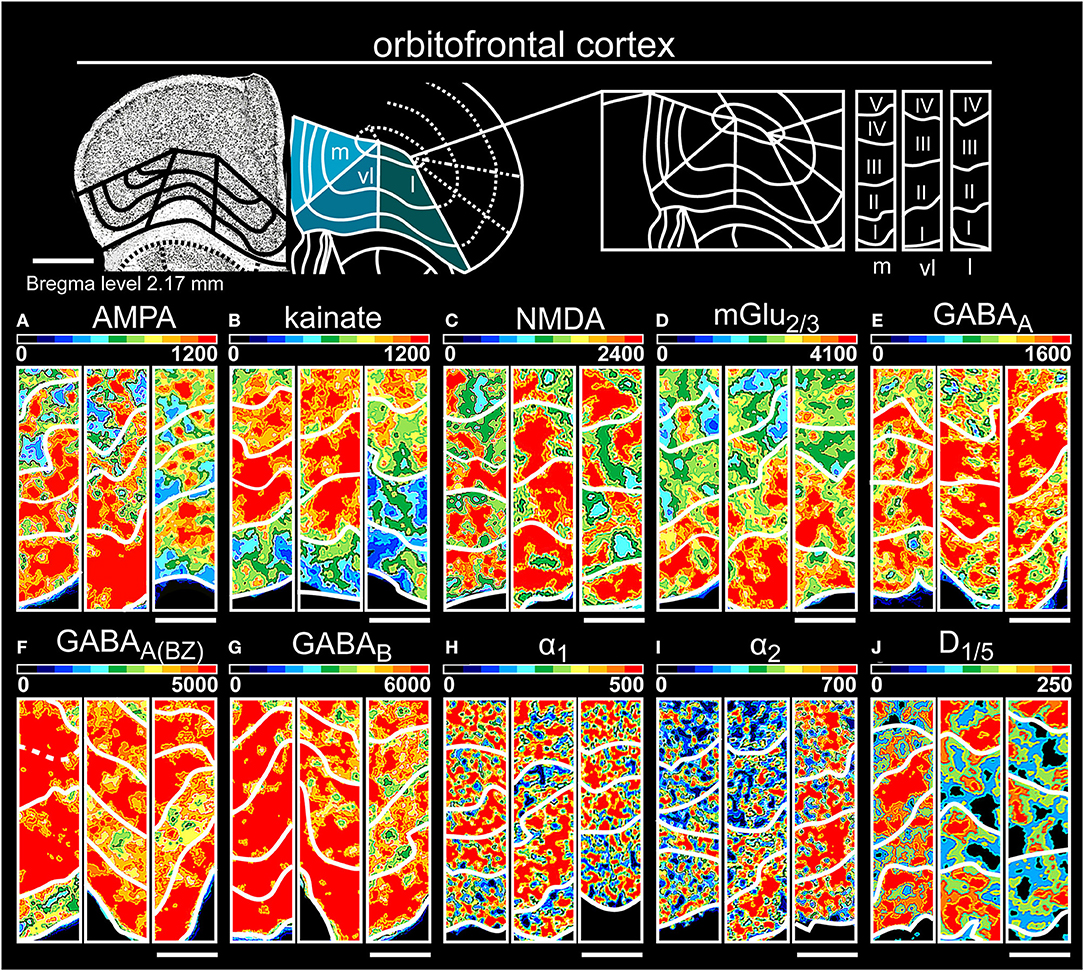
Figure 9. Color-coded autoradiographs showing the distribution and density of all investigated receptors of the orbitofrontal cortex (l, lateral; m, medial; vl, ventrolateral). Densities of the color-coded autoradiograms in fmol/mg protein according to color scales. For detailed receptor densities see Table 1. Scale bars: Atlas, 800 μm; (A–J), 300 μm. I, layer 1; II, layer 2; III, layer 3; IV, layer 4; V, layer 5; VI, layer 6.
Generally, all investigated receptors were differentially expressed in the olfactory system. Glutamatergic mGlu2/3Rs, and GABAergic benzodiazepine binding sites and GABABRs showed the highest densities, while low densities for α1Rs and D1/5Rs (except in the olfactory tubercle) were observed (see Figures 10, 11). In the following we will describe the highlights of different densities in the areas of the olfactory system.
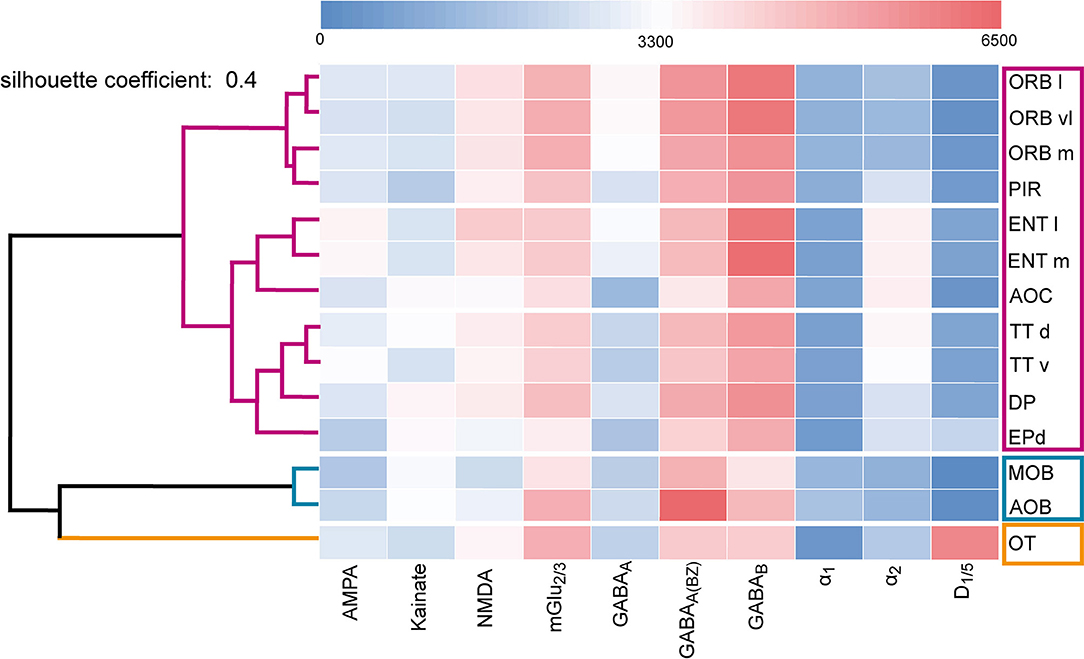
Figure 10. Dendrogram of the hierarchical cluster analysis. The area-specific receptor densities are displayed as a heat map according to their classification into clusters (Figure 11). The color legend represents the receptor densities (fmol/mg protein). Red color indicates high values (>3,300 fmol/mg protein), while blue color displays lower values (<3,300 fmol/mg protein). For abbreviations see (Figure 1).
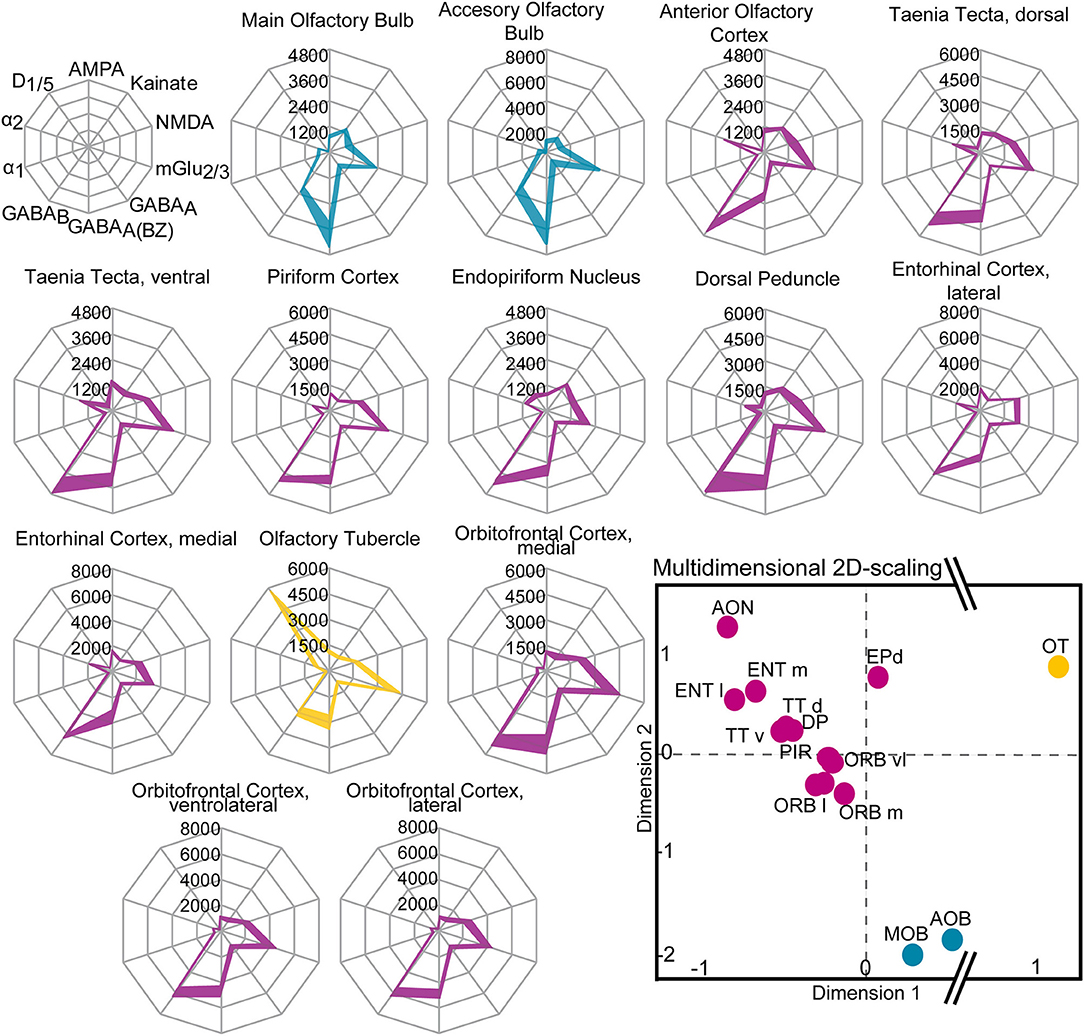
Figure 11. Receptor fingerprints of the 14 investigated olfactory areas. Mean densities (in fmol/mg protein) are provided for each individual receptor type, connected by a colored line (colors are similar to the multidimensional 2D-scaling analysis). The positions of the receptors are shown schematically in the first row. Filled areas mark upper and lower standard errors of the mean values of the receptor densities (± SEM). Lower right: Receptor-driven multidimensional 2D-scaling of the olfactory system. The dots represent a receptor feature vector, based on the area-specific multi-receptor balance of all investigated receptors (averaged over ten animals/hemispheres). The closer the dots, the smaller the Euclidean distance and the higher the similarity of the receptor architecture of the investigated areas. The hierarchical cluster analysis resulted in a three-cluster solution: the olfactory relay centers (blue), the cortical olfactory areas (violet) and the olfactory tubercle (yellow). The olfactory tubercle shows the highest Euclidean distance from all other areas (interruption of the X-axis, dimension 1). For abbreviations see (Figure 1).
Receptor-Specific Differentiation of Olfactory Areas
Glutamatergic Receptors
Glutamatergic receptors revealed a heterogenous distribution in the olfactory system: mGlu2/3Rs were highly expressed from 1,836 ± 224 fmol/mg protein in the endopiriform nucleus up to 4,024 ± 511 fmol/mg protein in the ventrolateral orbitofrontal cortex (Supplementary Table 2). Compared to these densities, AMPARs, kainateRs and NMDARs showed lower densities (Table 1). AMPARs and kainateRs always differed in a homeostatic relationship in their densities, except in the orbitofrontal cortex. The highest concentration of AMPARs was observed in the lateral entorhinal cortex (1,664 ± 59 fmol/mg protein), while kainateRs showed the highest densities in the endopiriform nucleus (1,624 ± 95 fmol/mg protein). NMDARs showed high concentrations (up to 3,037 ± 224 fmol/mg protein for example in the lateral entorhinal cortex) except for the main olfactory bulb (954 ± 158 fmol/mg protein). mGlu2/3Rs showed high concentrations in the orbitofrontal cortex (4,024 ± 511 fmol/mg protein). The receptor marked the border of the accessory olfactory bulb (3,948 ± 376 fmol/mg protein) to the neighboring main olfactory bulb (2,180 ± 121 fmol/mg protein, p ≤ 0.001 Supplementary Table 2) and anterior olfactory cortex (2,365 fmol/mg protein, Table 1, p ≤ 0.025, Supplementary Table 2).
GABAergic Receptors
GABAergic receptors showed high concentrations in the olfactory system, compared to the other investigated receptors. GABAARs showed low receptor densities (803 ± 93 fmol/mg protein in the main olfactory bulb up to 1,553 ± 105 fmol/mg protein in the medial orbitofrontal cortex, Supplementary Table 2), while benzodiazepine binding sites showed higher concentrations (2,791 ± 257 fmol/mg protein up to 6,409 ± 664 fmol/mg protein in the accessory olfactory bulb, Table 1). Benzodiazepine binding sites were highest in the accessory olfactory bulb where they marked the border to the main olfactory bulb and the border of the anterior olfactory cortex to the ventral part of the taenia tecta (Supplementary Table 2). GABABRs showed the highest expression in the medial entorhinal cortex (6,201 ± 200 fmol/mg protein). The GABAR densities revealed differences between parts of the orbitofrontal cortex, particularly by low densities of GABABRs and GABAARs in the lateral part (Table 1, Supplementary Table 2).
Monoaminergic Receptors
Noradrenergic receptors revealed a heterogenic distribution. α1Rs showed comparatively low concentrations in the primary and secondary olfactory cortices from 513 ± 67 fmol/mg protein in the lateral orbitofrontal cortex up to 675 ± 50 fmol/mg protein in the accessory olfactory bulb. α2Rs showed higher densities in the olfactory cortices (up to 1,809 ± 160 fmol/mg protein) compared to the main olfactory bulb (497 fmol/mg protein, Supplementary Table 2). D1/5Rs showed low densities if compared to all investigated receptors. Only the olfactory tubercle revealed very high expression levels (5,340 ± 439 fmol/mg protein). This clearly marked the border of the olfactory tubercle to the neighboring piriform cortex (p ≤ 0.000, Supplementary Table 2).
Layer-Specific Receptor Heterogeneity Within Olfactory Areas
The analysis of the individual receptors for each layer of an olfactory area further revealed a heterogeneous receptor profile for each area that is visualized schematically in Figures 3–9. Quantitative measurements of receptor densities (fmol/mg protein) for each area are provided in Table 1; Supplementary Table 3 with statistical analysis in Supplementary Tables 2, 4–18.
The Main and Accessory Olfactory Bulb
In general, all receptors, except AMPARs and α2Rs, were strongly expressed in the glomerular layer of the main olfactory bulb (Supplementary Tables 3, 4) and the mitral layer of the accessory olfactory bulb (Supplementary Tables 2, 3, 5). mGlu2/3Rs (Figure 3D), and GABABRs (Figure 3G) displayed significantly higher concentrations in the superficial layers of both while GABAA(BZ)Rs revealed the highest densities in the deeper layers of the main olfactory bulb (Figure 3F). In contrast, α2Rs and D1/5Rs were highest expressed in the granular layer of the accessory olfactory bulb (Figures 3I,J).
The Primary and Secondary Olfactory Cortices
In the anterior olfactory cortex (for layer-specific statistical analysis see Supplementary Table 6), all subareas showed high concentrations of GABABRs (Figure 4G) and mGlu2/3Rs (Figure 4D). Higher mGlu2/3, GABAA(BZ) (Figure 4F) and α1 (Figure 4H) receptor densities separated the pars externa from the pars principalis. Here, higher densities of AMPA (Figure 4A) and GABAB (Figure 4G) receptor densities characterized the medial part. The dorsal part of the anterior olfactory cortex was clearly separated by high concentrations of α2Rs (Figure 4I) and D1/5Rs (Figure 4J) and low densities of GABAA(BZ)Rs (Figure 4F). The posteroventral subarea showed the highest expression of kainateRs and the lowest densities of mGlu2/3Rs (Figure 4D) and α1Rs (Figure 4H). In the lateral part of the pars principalis, higher NMDA (Figure 4C) and GABAB (Figure 4G) receptor densities and low concentrations of GABAARs (Figure 4E) separated this subarea from the remaining parts. The external subarea generally displayed lower expressions for all investigated receptors, except for GABAARs (Figure 4E).
The dorsal peduncular cortex (Table 1, Supplementary Tables 2, 3, 10) showed the lowest receptor concentrations in deep layer VI except for kainateRs (Figure 4L) and D1/5Rs (Figure 4T), which were highly expressed. GABAergic receptors revealed a high distribution in layer II/III and layer V.
Glutamatergic receptors were highly expressed in both areas of the taenia tecta (Table 1, Supplementary Tables 2, 3, 7, 8). Superficial layers I/II showed high concentrations of glutamatergic (except kainateRs, Figures 5A–D) and GABAergic receptors (Figures 5E,F) while catecholaminergic receptors were highest in deep layer IV (Figure 5I). GABABRs showed maximum densities in layer II of both areas but were significantly higher expressed in dorsal compared to ventral parts (Figure 5G).
The piriform cortex (Table 1, Supplementary Tables 2, 3, 11) revealed high densities of glutamatergic [NMDARs (Figure 6C), mGlu2/3Rs (Figure 6D)] and GABAergic receptors [GABAARs (Figure 6E), GABAA(BZ)Rs (Figure 6F)] in the superficial layer I, while deep layer III had highest concentrations of catecholaminergic receptors α2R (Figure 6I) and D1/5R (Figure 6J). The endopiriform nucleus (Table 1, Supplementary Table 3) showed high levels of GABAergic receptors (Figures 6E–G), while AMPARs (Figure 6A) and α1Rs (Figure 6H) revealed a low receptor distribution.
The entorhinal cortex (Table 1, Supplementary Tables 2, 3, 12, 13) expressed high levels of glutamatergic receptors [NMDA (Figure 8C), mGlu2/3Rs (Figure 8D)] and GABAergic receptors in layers II/III of both parts (Figures 8E–G). KainateRs (Figure 8B) and catecholaminergic receptors (Figures 8H–J) showed the highest expression in the deep layers V/VI. Although NMDARs (Figure 8C) and GABABRs (Figure 8G) were low expressed in layer VI of both subdivisions, their concentration in the medial part were higher compared to lateral. In general, layer II of both subdivisions showed the highest receptor densities.
The three areas of the orbitofrontal cortex (Table 1, Supplementary Tables 2, 3, 14–16) revealed high receptor densities in layers I/II for glutamatergic (Figures 9A–D) and GABAergic receptors (Figures 9E–G), except for kainateRs in layer VI (Figure 9B). While noradrenergic receptors were highest in layer III/V of the medial and lateral part, the ventrolateral part showed higher concentrations in layer I (Figures 9H,I). D1/5 receptors were generally low concentrated but highly expressed in deep layer VI (Figure 9J).
The Olfactory Tubercle
In the olfactory tubercle (Table 1; Supplementary Tables 2, 3, 9), low receptor concentrations (except mGlu2/3Rs [Figure 7D]) separated the molecular layer, while high AMPA (Figure 7A), NMDA (Figure 7C), GABAA (Figure 7E) and D1/5 (Figure 7J) characterized the pyramidal layer. Noradrenergic (Figures 7H–J) and GABAergic (Figures 7E–G) receptors characterized the polymorphic layer.
Molecular Structure of the Olfactory Subdivisions
Similarities and dissimilarities of the receptor architecture between the areas of the olfactory system were visualized in receptor fingerprints for each area (Figure 10). The receptor densities are averaged over all cortical layers or subdivisions representing the area-specific receptor balance of the ten investigated receptors (Table 1; Supplementary Table 2).
The fingerprints of the main and accessory olfactory bulb were highly similar in their shape. The same was true for areas of the primary and secondary olfactory cortices that differed mainly because of higher GABABRs, α2Rs, NMDARs, and lower benzodiazepine binding sites from the fingerprints of the main and accessory olfactory bulbs. The olfactory tubercle constituted its own cluster because of the high amount of D1/5Rs and mGlu2/3Rs. Additionally, the olfactory tubercle showed a low amount of GABAA(BZ)Rs and GABABRs, which was in contrast to the other olfactory areas, where GABABRs were higher concentrated compared to GABAA(BZ)Rs (Figure 11).
A multidimensional scaling analysis (Figure 11) and a dendrogram (Figure 10) showed a clear separation into three clusters (silhouette coefficient 0.4): (1) a cluster of the olfactory bulbs (main and accessory olfactory bulb), (2) a cluster of the areas of the primary and secondary cortex, excluding the olfactory tubercle (3) that constituted its own cluster. Based on the three-cluster solution, we visualized the influence of the individual receptors in a dendrogram and a heat map (Figure 10). For example, low α2Rs (blue color in heat map) and high GABAA(BZ)Rs (red color) distinguished the olfactory bulbs from the olfactory cortices. High D1/5Rs and low noradrenergic receptors distinguished the olfactory tubercle from the remaining subdivisions. The heat map showed a highly similar distribution of catecholaminergic receptors for the entorhinal cortex, anterior olfactory cortex and the taenia tecta (Figure 10).
Discussion
Previous studies that focused on the receptors of the olfactory system were primarily related to the main olfactory bulb and the piriform cortex (for review see Shepherd, 2004; Ennis et al., 2007). Until now, the receptor architecture of the dorsal peduncular cortex, dorsal and ventral taenia tecta and the endopiriform nucleus has been scarcely analyzed. More generally, the identified olfactory areas have not been investigated as a comprehensive system yet. Therefore, there is no reliable basis for identifying alterations in the receptor balance in relation to disorders that are related to the olfactory system. Multiple receptor types play a role in neurodegenerative diseases (Armstrong et al., 1994; Hawkes, 2006; Zhang et al., 2015; Kwakowsky et al., 2018) and dysfunctions (Thompson et al., 2006; Yuan and Slotnick, 2014; Münster et al., 2020). Thus, the area- and layer-specific receptor balance of the entire olfactory system provides valuable pharmacological targeting-indications in case of disease-related alterations of the investigated receptor distribution patterns. For example, a bilateral bulbectomy and thus, a change in the neurotransmitter system is capable to induce the symptoms of major depression (Song and Leonard, 2005; Yuan and Slotnick, 2014) and α2C adrenoceptors were identified as a potential pharmacological target for neurodegenerative and neuropsychiatric disorders such as depression and schizophrenia (Arponen et al., 2014). The study of Apronen and colleagues suspected the highest α2C receptor concentration in the human olfactory tubercle and striatum, whereas our data and other studies detected the highest expression in the rodent anterior olfactory cortex and the entorhinal cortex (Scheinin et al., 1994; Holmberg et al., 2003).
The receptor fingerprint of an area provides an indication of its functional features (Zilles et al., 2002a, 2015; Eickhoff et al., 2008; Palomero-Gallagher et al., 2009; Zilles and Palomero-Gallagher, 2017; Impieri et al., 2019). Furthermore, the similarity of the fingerprints allows inferences regarding a common network (Palomero-Gallagher et al., 2009; Zilles et al., 2015; Palomero-Gallagher and Zilles, 2018).
The Special Role of the Olfactory Tubercle in the Olfactory System
The olfactory tubercle builts a single cluster due to its high amounts of dopaminergic receptors, which was also reported in earlier studies (Wamsley et al., 1991; Duffy et al., 2000). Usually, dopaminergic receptors become active following the perception of reward promising olfactory signals, explaining the role of the olfactory tubercle as a motivational and evaluating area for olfactory preferences (Ikemoto, 2007; Zhang et al., 2017; Murata et al., 2019). The neurochemical structure of the olfactory tubercle has been extensively researched (Cansler et al., 2020). Its unique position in the olfactory system is caused by the fact that the olfactory tubercle is considered to be part of the olfactory cortex as well as the ventral striatum (de Olmos and Heimer, 1999; Cansler et al., 2020). Because of the high dopamine receptor density, the olfactory tubercle displays a receptor profile, which is more similar to the striatal than to the olfactory system (Knable et al., 1994; Sulzer et al., 2016). However, further autoradiographic studies of the striatum would be necessary to gain more comparisons at this point. In general, more attention should be paid on the olfactory tubercle as a multisensory region, as it seems to play a crucial role in odor-guided behavior (Fitzgerald et al., 2014; Murata et al., 2015; Murata, 2020). The olfactory tubercle also differentiates in its cytoarchitecture, as it contains clusters of granule cells (Islands of Calleja) as well as a trilaminar cortical organization (Pigache, 1970). These cells are divided into different groups and are located in layers II and III of the olfactory tubercle and receive input from the main olfactory bulb (Bayer, 1985; Xiong and Wesson, 2016). The receptor architecture indicates that layer I has significantly lower receptor concentrations than layer II/III. Only mGlu2/3Rs are higher expressed in layer I which is correlated with a direct input from the tufted cells of the main olfactory bulb (Scott et al., 1980; Imamura et al., 2011; Xiong and Wesson, 2016). The olfactory tubercle also differs from the olfactory cortex in embryogenesis and shows more similarities to the ventral striatum (Bayer, 1985). For example, ventricular zone progenitors in the subpallium give rise to astrocytes in the ventral striatum and the olfactory tubercle (Torigoe et al., 2015). The olfactory tubercle and the piriform cortex develop their laminae prior to the olfactory cortex (Schwob and Price, 1984a,b), suggesting that both areas have advanced maturation and function at an early age (Wesson and Wilson, 2011).
The Molecular Organization in the Olfactory Cortex in Comparison to Function
The hierarchical cluster analysis of the receptor fingerprints revealed a three-cluster-solution. The main and accessory olfactory bulb were very similar in their receptor balance. They constitute a cluster and show greater distance in their similarity to the primary and secondary olfactory cortex, because both areas serve the primary acquisition and processing of olfactory information (Mucignat-Caretta, 2010; Cleland and Linster, 2019).
The primary and secondary olfactory cortices clustered as olfactory processing areas, consisting of three smaller clusters. First, the taenia tecta, the dorsal peduncular cortex and the endopiriform nucleus clustered. The functional role of these areas as part of the olfactory system has not been fully investigated yet. Both, the taenia tecta and the dorsal peduncular cortex showed a highly heterogeneous receptor profile and differ mainly in their densities of glutamatergic receptors and α2Rs from the other analyzed areas. Until now, only group II mGluRs (McOmish et al., 2016), subunits of GABAARs (Zhang et al., 1991) and D1Rs in pyramidal and GABAergic neurons of the taenia tecta (Santana et al., 2009) were analyzed. The knowledge about these areas is incomplete, however, they may play an important role in essential olfactory functions. The taenia tecta and the dorsal peduncular cortex participate in associative and extinction learning and exhibit connections to the lateral entorhinal cortex, piriform cortex, main olfactory bulb and the olfactory tubercle (Haberly and Price, 1978; Ottersen, 1982; Wyss and Sripanidkulchai, 1983; Santiago and Shammah-Lagnado, 2005; Peters et al., 2009; Cleland and Linster, 2019). It is noticeable that increased concentrations of kainateRs contributed to the clustering, while kainateRs are well-known for their crucial role in epilepsy (Falcón-Moya et al., 2018). However, future studies should focus on the functional network of these clustering areas. The dorsal endopiriform nucleus is located next to the cluster of the taenia tecta and the dorsal peduncular cortex. Its function also remains unclear, but previous studies assumed that the dorsal endopiriform nucleus integrates olfactory processed information of the piriform cortex with gustatory information of the gustatory cortex (Sugai et al., 2012). Similar to the piriform cortex, it is highly epileptogenic (Hoffman and Haberly, 1993, 1996; Demir et al., 1998) but differs significantly in its receptor architecture from the piriform cortex. Presumably, because the dorsal endopiriform nucleus is closely connected to the claustrum and the insular cortex and is thus also involved in the processing of non-olfactory information (Sugai et al., 2012). This discrepancy may constitute an important criterion in the study of epilepsy. In general, the dorsal endopiriform nucleus and the claustrum together are considered to be the claustral complex. Both regions derive from the lateral pallium and play a crucial role in limbic circuitry (Watson and Puelles, 2017; Bruguier et al., 2020).
Second, the entorhinal cortex clustered with the anterior olfactory cortex. The clustering of the entorhinal and anterior olfactory cortex is particularly interesting because both areas play a key role during the development of neurodegenerative diseases. The entorhinal cortex, which belongs to the hippocampal formation, connects the hippocampal formation with the olfactory system (Haberly and Price, 1978; Stäubli et al., 1984; Chapuis et al., 2013; Leitner et al., 2016), including the anterior olfactory cortex (Luskin and Price, 1983; Wyss and Sripanidkulchai, 1983; Mason et al., 2016; Cleland and Linster, 2019). Here, receptors play a decisive role in Alzheimer's disease (Armstrong et al., 1994; Kwakowsky et al., 2018; Berggaard et al., 2019) and also epilepsy (Spencer and Spencer, 1994; Du et al., 1995; Mann et al., 2009; Nibber et al., 2017; Stefanits et al., 2019). Early studies discovered neurofibrillary tangles and neuritic plaques in combination with cell loss limited to the anterior olfactory cortex in patients with Alzheimer's disease (Esiri and Wilcock, 1984; Ohm and Braak, 1987; Ubeda-Bañon et al., 2020). Further, the pathological dysfunctionality of the human entorhinal cortex causes impairment of memory function in Alzheimer's disease (Van Hoesen et al., 1986; Braak and Braak, 1991). In Parkinson's disease, the anterior olfactory cortex plays a key role for olfactory dysfunctions, because of neuronal depletion and the occurrence of Lewy Bodies in early stages (Pearce et al., 1995; Braak et al., 2003; Beach et al., 2009; Mason et al., 2016). Thus, the anterior olfactory cortex and the entorhinal cortex constitute key components of the olfactory system in both, Alzheimer's and Parkinson's disease, and are linked to network dysfunction in these diseases (Ubeda-Bañon et al., 2020). Here, our data indicate a correlation of both areas at the receptor level and offer a further approach to examine these diseases.
Third, the orbitofrontal cortex clustered with the piriform cortex. Both areas are involved in olfactory discrimination (Staubli et al., 1987; Critchley and Rolls, 1996; Schoenbaum et al., 1999; Lazic et al., 2007). Furthermore, it was discovered that the projections between the piriform cortex and the orbitofrontal cortex serve as a motivation-related pathway in opioid abstinence (Reiner et al., 2020), since the piriform cortex has reciprocal connections to the orbitofrontal cortex and the amygdaloid complex (Illig, 2006). Additionally, atrophies in the piriform cortex and orbitofrontal cortex were also observed in early stages of Parkinson‘s disease and contribute to olfactory dysfunctions (Lee et al., 2020). However, further research is required to establish the full extent of the impact at an organizational level (Li et al., 2010; Xu et al., 2012; Cremer et al., 2015a,b; Zhang et al., 2015; Perez-Lloret and Barrantes, 2016; Kwakowsky et al., 2018).
Comparison of the Layer-Specific Organization of the Olfactory System
Up to now, few studies have investigated receptor densities of the individual layers of the olfactory areas. In the main olfactory bulb, we observed high expression rates of GABAA(BZ)Rs in the olfactory nerve layer, which is in line with a study that detected high levels of [3H]Ro5-4864 binding sites, a ligand for selective peripheral-type benzodiazepine receptors (Anholt et al., 1984). Our data are consistent with other studies of the piriform cortex, that detected the highest concentrations of AMPARs in layer II (Petralia and Wenthold, 1992), high levels of NMDARs (Petralia et al., 1994b) and mGlu2/3Rs (Wada et al., 1998) in layers I/II and kainateRs (Wisden and Seeburg, 1993; Petralia et al., 1994a) in layer III. We can also confirm that GABAARs are mainly distributed in layers I and II (Ennis et al., 2007). In line with earlier reports, we further observed the minimum receptor density of α1Rs (Jones et al., 1985) and high concentrations of α2Rs (Unnerstall et al., 1984) in layer III of the piriform cortex.
GABAARs and GABABRs are present in the anterior olfactory cortex (Bowery et al., 1987; Zhang et al., 1991), but our data showed a heterogenous distribution of the receptors: GABABRs are significantly higher expressed compared to GABAARs. High densities of GABAA(BZ)Rs were also observed in the anterior olfactory cortex of the turtle (Schlegel and Kriegstein, 1987) and rat (Richards et al., 1987). Receptors for noradrenaline and dopamine were observed in the anterior olfactory cortex (Fallon and Moore, 1978), but we found significant differences in the subareas with respect to the receptor distribution. While α1Rs were highly concentrated in the pars externa, high levels of α2Rs were observed in the pars principalis, particularly dorsal, medial and posteroventral (Unnerstall et al., 1984). In line with our observations for D1/5Rs, Savasta and colleagues found high amounts of D1Rs in the rat anterior olfactory cortex (Savasta et al., 1986). Particularly in the anterior olfactory cortex, significant differences in receptor densities were observed in the dorsal part. While GABAARs, α1Rs and D1/5Rs showed low amounts, mGlu2/3Rs, α2Rs and GABABRs were present in high concentrations.
In the lateral entorhinal cortex, a strong expression of group II and III mGluRs was detected (Ohishi et al., 1993; Fotuhi et al., 1994; Wright et al., 2013). Here, we observed the highest expression of mGlu2/3Rs in layer II and III.
Up to now only few receptor data exist for the olfactory tubercle. KainateRs were investigated in previous studies (Gall et al., 1990; Bischoff et al., 1997), but no conclusions were made regarding the layer specificity. We observed highest levels of kainateRs and GABAA(BZ)Rs in the polymorphic layer. High concentrations of GABAA(BZ)Rs were detected in GABAergic receptors using flunitrazepam (Biscoe et al., 1984). In line with our results, α2Rs occur in the plexiform and polymorphic layers (Unnerstall et al., 1984). We further confirmed a strong expression of D1Rs (Wamsley et al., 1991), particularly D1/5Rs (Duffy et al., 2000) in the pyramidal layer of the olfactory tubercle.
Conclusion
The present study provides a detailed layer-specific multireceptor-architectonic characterization of the mouse olfactory system. The clustering leads to the conclusion that the chemical organization of olfactory tubercle is clearly different from the remaining olfactory system, while the secondary and primary olfactory cortex build three distinct clusters. This leads to novel coherences in connectivity, for example for the close relationship between the taenia tecta, the dorsal peduncular cortex and the dorsal endopiriform nucleus. Furthermore, our results provide comparative reference data for future studies in the human olfactory system. Considering that the human olfactory system is affected in the first instance in multiple neurodegenerative diseases and dysfunctions, our data may provide new study approaches regarding pharmacological targeting research and external and internal determinants, including cognitive training and adult neurogenesis. Additionally, the resulting molecular atlas can be used for comparative studies to parcellate the olfactory system in other mammals like primates to gain further functional and molecular insights.
Data Availability Statement
The original contributions presented in the study are included in the article/Supplementary Material, further inquiries can be directed to the corresponding author/s.
Ethics Statement
The animal study was reviewed and approved by Landesamt für Natur, Umwelt und Verbraucherschutz NRW, Germany (LANUV) National Institute of Health Guide for Care and Use of Laboratory Animals.
Author Contributions
KL performed the analysis of the receptor autoradiograms, designed the figures, evaluated the results and wrote the initial draft of the manuscript. KA provided critical feedback and expertise for the manuscript. CH designed the study, verified the methods and supervised the project. KA and CH acquisitioned funding for the project. All authors reviewed and edited the manuscript during each stage and approved the final manuscript.
Funding
This project has received funding from the European Union's Horizon 2020 Framework Programme for Research and Innovation under the Specific Grant Agreement No. 945539 (Human Brain Project SGA3) to KA. Further this work was supported through a grant to CH from the medizinische Forschungskommission HHU (CH37/2010).
Conflict of Interest
The authors declare that the research was conducted in the absence of any commercial or financial relationships that could be construed as a potential conflict of interest.
Acknowledgments
We thank Nicole Delhaes and Ulrich Opfermann-Emmerich for technical assistance with the autoradiographic procedures. Furthermore, we would like to thank Isabelle Mafoppa-Fomat and Sabrina Behuet for their technical support in image processing of the autoradiographic slices. We would also like to thank Nicola Palomero-Gallagher for valuable advice in the beginning of densiometric analysis of autoradiographs. Additionally, we specially thank Kai Kiwitz for his excellent support in statistics.
Supplementary Material
The Supplementary Material for this article can be found online at: https://www.frontiersin.org/articles/10.3389/fnana.2021.632549/full#supplementary-material
References
Albers, M. W., Tabert, M. H., and Devanand, D. P. (2006). Olfactory dysfunction as a predictor of neurodegenerative disease. Curr. Neurol. Neurosci. Rep. 6, 379–386. doi: 10.1007/s11910-996-0018-7
Anholt, R. R., Murphy, K. M., Mack, G. E., and Snyder, S. H. (1984). Peripheral-type benzodiazepine receptors in the central nervous system: localization to olfactory nerves. J. Neurosci. 4, 593–603. doi: 10.1523/JNEUROSCI.04-02-00593.1984
Armstrong, D. M., Ikonomovic, M. D., Sheffield, R., and Wenthold, R. J. (1994). AMPA-selective glutamate receptor subtype immunoreactivity in the entorhinal cortex of non-demented elderly and patients with Alzheimer's disease. Brain Res. 639, 207–216. doi: 10.1016/0006-8993(94)91732-9
Arponen, E., Helin, S., Marjamäki, P., Grönroos, T., Holm, P., Löyttyniemi, E., et al. (2014). A PET Tracer for Brain α2C Adrenoceptors, (11)C-ORM-13070: radiosynthesis and preclinical evaluation in rats and knockout mice. J. Nucl. Med. 55, 1171–1177. doi: 10.2967/jnumed.113.135574
Bayer, S. A. (1985). Neurogenesis in the olfactory tubercle and islands of Calleja in the rat. Int. J. Dev. Neurosci. 3, 135–147. doi: 10.1016/0736-5748(85)90004-8
Beach, T. G., White, C. L. 3rd, Hladik, C. L., Sabbagh, M. N., Connor, D. J., Shill, H. A., et al. (2009). Olfactory bulb alpha-synucleinopathy has high specificity and sensitivity for Lewy body disorders. Acta Neuropathol. 117, 169–174. doi: 10.1007/s00401-008-0450-7
Berggaard, N., Witter, M. P., and van der Want, J. J. L. (2019). GABA(A) receptor subunit α3 in network dynamics in the medial entorhinal cortex. Front. Syst. Neurosci. 13:10. doi: 10.3389/fnsys.2019.00010
Bergström, M., Awad, R., Estrada, S., Mälman, J., Lu, L., Lendvai, G., et al. (2003). Autoradiography with positron emitting isotopes in positron emission tomography tracer discovery. Mol. Imaging Biol. 5, 390–396. doi: 10.1016/j.mibio.2003.09.004
Bischoff, S., Barhanin, J., Bettler, B., Mulle, C., and Heinemann, S. (1997). Spatial distribution of kainate receptor subunit mRNA in the mouse basal ganglia and ventral mesencephalon. J. Comp. Neurol. 379, 541–562. doi: 10.1002/(SICI)1096-9861(19970324)379:4<541::AID-CNE6>3.0.CO
Biscoe, T. J., Fry, J. P., and Rickets, C. (1984). Autoradiography of benzodiazepine receptor binding in the central nervous system of the normal C57BL6J mouse. J. Physiol. (Lond) 352, 495–508. doi: 10.1113/jphysiol.1984.sp015305
Blakemore, L. J., Corthell, J. T., and Trombley, P. Q. (2018). Kainate receptors play a role in modulating synaptic transmission in the olfactory bulb. Neuroscience 391, 25–49. doi: 10.1016/j.neuroscience.2018.09.002
Bowery, N. G., Hudson, A. L., and Price, G. W. (1987). GABAA and GABAB receptor site distribution in the rat central nervous system. Neuroscience 20, 365–383. doi: 10.1016/0306-4522(87)90098-4
Braak, H., and Braak, E. (1991). Neuropathological stageing of Alzheimer-related changes. Acta Neuropathol. 82, 239–259. doi: 10.1007/BF00308809
Braak, H., Del Tredici, K., Rüb, U., de Vos, R. A., Jansen Steur, E. N., and Braak, E. (2003). Staging of brain pathology related to sporadic Parkinson's disease. Neurobiol. Aging 24, 197–211. doi: 10.1016/S0197-4580(02)00065-9
Brashear, H. R., Zaborszky, L., and Heimer, L. (1986). Distribution of GABAergic and cholinergic neurons in the rat diagonal band. Neuroscience 17, 439–451. doi: 10.1016/0306-4522(86)90258-7
Brennan, P. A., Kendrick, K. M., and Keverne, E. B. (1995). Neurotransmitter release in the accessory olfactory bulb during and after the formation of an olfactory memory in mice. Neuroscience 69, 1075–1086. doi: 10.1016/0306-4522(95)00309-7
Bruguier, H., Suarez, R., Manger, P., Hoerder-Suabedissen, A., Shelton, A. M., Oliver, D. K., et al. (2020). In search of common developmental and evolutionary origin of the claustrum and subplate. J. Comp. Neurol. 528, 2956–2977. doi: 10.1002/cne.24922
Cansler, H. L., Wright, K. N., Stetzik, L. A., and Wesson, D. W. (2020). Neurochemical organization of the ventral striatum's olfactory tubercle. J. Neurochem. 152, 425–448. doi: 10.1111/jnc.14919
Caruana, D. A., Sorge, R. E., Stewart, J., and Chapman, C. A. (2006). Dopamine has bidirectional effects on synaptic responses to cortical inputs in layer II of the lateral entorhinal cortex. J. Neurophysiol. 96, 3006–3015. doi: 10.1152/jn.00572.2006
Chapuis, J., Cohen, Y., He, X., Zhang, Z., Jin, S., Xu, F., et al. (2013). Lateral entorhinal modulation of piriform cortical activity and fine odor discrimination. J. Neurosci. 33, 13449–13459. doi: 10.1523/JNEUROSCI.1387-13.2013
Christie, J. M., and Westbrook, G. L. (2006). Lateral excitation within the olfactory bulb. J. Neurosci. 26, 2269–2277. doi: 10.1523/JNEUROSCI.4791-05.2006
Cleland, T. A., and Linster, C. (2019). Central olfactory structures. Handb. Clin. Neurol. 164, 79–96. doi: 10.1016/B978-0-444-63855-7.00006-X
Cremer, J. N., Amunts, K., Graw, J., Piel, M., Rösch, F., and Zilles, K. (2015a). Neurotransmitter receptor density changes in Pitx3ak mice–a model relevant to Parkinson's disease. Neuroscience 285, 11–23. doi: 10.1016/j.neuroscience.2014.10.050
Cremer, J. N., Amunts, K., Schleicher, A., Palomero-Gallagher, N., Piel, M., Rösch, F., et al. (2015b). Changes in the expression of neurotransmitter receptors in Parkin and DJ-1 knockout mice–a quantitative multireceptor study. Neuroscience 311, 539–551. doi: 10.1016/j.neuroscience.2015.10.054
Critchley, H. D., and Rolls, E. T. (1996). Olfactory neuronal responses in the primate orbitofrontal cortex: analysis in an olfactory discrimination task. J. Neurophysiol. 75, 1659–1672. doi: 10.1152/jn.1996.75.4.1659
de Olmos, J. S., and Heimer, L. (1999). The concepts of the ventral striatopallidal system and extended amygdala. Ann. N. Y. Acad. Sci. 877, 1–32. doi: 10.1111/j.1749-6632.1999.tb09258.x
Demir, R., Haberly, L. B., and Jackson, M. B. (1998). Voltage imaging of epileptiform activity in slices from rat piriform cortex: onset and propagation. J. Neurophysiol. 80, 2727–2742. doi: 10.1152/jn.1998.80.5.2727
Dong, H. W. (2008). The Allen Reference Atlas: A digital Color Brain Atlas of the C57Bl/6J Male Mouse. Hoboken, NJ, US: John Wiley & Sons Inc.
Dong, H. W., and Ennis, M. (2018). Activation of group II metabotropic glutamate receptors suppresses excitability of mouse main olfactory bulb external tufted and mitral cells. Front. Cell. Neurosci. 11:436. doi: 10.3389/fncel.2017.00436
Doucette, W., Gire, D. H., Whitesell, J., Carmean, V., Lucero, M. T., and Restrepo, D. (2011). Associative cortex features in the first olfactory brain relay station. Neuron 69, 1176–1187. doi: 10.1016/j.neuron.2011.02.024
Du, F., Eid, T., Lothman, E. W., Köhler, C., and Schwarcz, R. (1995). Preferential neuronal loss in layer III of the medial entorhinal cortex in rat models of temporal lobe epilepsy. J. Neurosci. 15, 6301–6313. doi: 10.1523/JNEUROSCI.15-10-06301.1995
Dudley, C. A., and Moss, R. L. (1995). Electrophysiological evidence for glutamate as a vomeronasal receptor cell neurotransmitter. Brain Res. 675, 208–214. doi: 10.1016/0006-8993(95)00075-2
Duffy, R. A., Hunt, M. A., Wamsley, J. K., and McQuade, R. D. (2000). In vivo autoradiography of [3H]SCH 39166 in rat brain: selective displacement by D1/D5 antagonists. J. Chem. Neuroanat. 19, 41–46. doi: 10.1016/S0891-0618(00)00045-4
Eickhoff, S. B., Rottschy, C., Kujovic, M., Palomero-Gallagher, N., and Zilles, K. (2008). Organizational principles of human visual cortex revealed by receptor mapping. Cereb. Cortex 18, 2637–2645. doi: 10.1093/cercor/bhn024
Ennis, M. a.H A. (2008). “Physiology of the olfactory bulb,” in The Senses: A Comprehensive Reference, Basbaum, A., Kaneko, A., and Shepherd, G. (Eds.-In Chief). Olfaction and Taste, Firestein, S. and Beauchamp, G. (Eds.). (San Diego: Academic Press) 4, 641–686. doi: 10.1016/B978-012370880-9.00118-3
Ennis, M., Hamilton, K., and Hayar, A. (2007). “Neurochemistry of the main olfactory system,” in Handbook of Neurochemistry and Molecular Neurobiology: Sensory Neurochemistry, eds A. Lajtha and D. A. Johnson (Boston, MA: Springer), 137–204. doi: 10.1007/978-0-387-30374-1_6
Ennis, M., Puche, A. C., Holy, T., and Shipley, M. T. (2015). “Chapter 27 - the olfactory system,” in The Rat Nervous System (Fourth Edition), ed G. Paxinos (San Diego: Academic Press), 761–803. doi: 10.1016/B978-0-12-374245-2.00027-9
Esiri, M. M., and Wilcock, G. K. (1984). The olfactory bulbs in Alzheimer's disease. J. Neurol. Neurosurg. Psychiatr. 47, 56–60. doi: 10.1136/jnnp.47.1.56
Falcón-Moya, R., Sihra, T. S., and Rodríguez-Moreno, A. (2018). Kainate receptors: role in epilepsy. Front. Mol. Neurosci. 11:217. doi: 10.3389/fnmol.2018.00217
Fallon, J. H., and Moore, R. Y. (1978). Catecholamine innervation of the basal forebrain. III. Olfactory bulb, anterior olfactory nuclei, olfactory tubercle and piriform cortex. J. Comp. Neurol. 180, 533–544. doi: 10.1002/cne.901800309
Fitzgerald, B. J., Richardson, K., and Wesson, D. W. (2014). Olfactory tubercle stimulation alters odor preference behavior and recruits forebrain reward and motivational centers. Front. Behav. Neurosci. 8:81. doi: 10.3389/fnbeh.2014.00081
Fotuhi, M., Standaert, D. G., Testa, C. M., Penney, J. B. Jr., and Young, A. B. (1994). Differential expression of metabotropic glutamate receptors in the hippocampus and entorhinal cortex of the rat. Brain Res. Mol. Brain Res. 21, 283–292. doi: 10.1016/0169-328X(94)90259-3
Franklin, K. B. J., and Paxinos, G. (2013). Paxinos and Franklin's The Mouse Brain in Stereotaxic Coordinates, 4th Edn. Amsterdam: Elsevier Academic Press.
Gall, C., Sumikawa, K., and Lynch, G. (1990). Regional distribution of mRNA for a putative kainate receptor in rat brain. Eur. J. Pharmacol. 189, 217–221. doi: 10.1016/0922-4106(90)90025-S
Gallyas, F. (1971). A principle for silver staining of tissue elements by physical development. Acta Morphol. Acad. Sci. Hung. 19, 57–71.
Glovaci, I., Caruana, D. A., and Chapman, C. A. (2014). Dopaminergic enhancement of excitatory synaptic transmission in layer II entorhinal neurons is dependent on D1-like receptor-mediated signaling. Neuroscience 258, 74–83. doi: 10.1016/j.neuroscience.2013.10.076
Glovaci, I., and Chapman, C. A. (2019). Dopamine induces release of calcium from internal stores in layer II lateral entorhinal cortex fan cells. Cell Calcium 80, 103–111. doi: 10.1016/j.ceca.2019.04.003
Haberly, L. B., and Price, J. L. (1978). Association and commissural fiber systems of the olfactory cortex of the rat. II. Systems originating in the olfactory peduncle. J. Comp. Neurol. 181, 781–807. doi: 10.1002/cne.901810407
Hawkes, C. (2006). Olfaction in neurodegenerative disorder. Adv. Otorhinolaryngol. 63, 133–151. doi: 10.1159/000093759
Herfert, K., Mannheim, J. G., Kuebler, L., Marciano, S., Amend, M., Parl, C., et al. (2020). Quantitative rodent brain receptor imaging. Mol. Imag. Biol. 22, 223–244. doi: 10.1007/s11307-019-01368-9
Herold, C., Bingman, V. P., Ströckens, F., Letzner, S., Sauvage, M., Palomero-Gallagher, N., et al. (2014). Distribution of neurotransmitter receptors and zinc in the pigeon (Columba livia) hippocampal formation: a basis for further comparison with the mammalian hippocampus. J. Comp. Neurol. 522, 2553–2575. doi: 10.1002/cne.23549
Herold, C., Paulitschek, C., Palomero-Gallagher, N., Gunturkun, O., and Zilles, K. (2017). Transmitter receptors reveal segregation of the arcopallium/amygdala complex in pigeons (Columba livia). J. Comp. Neurol. 526, 439–466. doi: 10.1002/cne.24344
Hof, P., Young, W., Bloom, F., and Belichenko, P. (2000). Comparative Cytoarchitectonic Atlas of the C57BL6 and 129 Sv Mouse Brains. Amsterdam: Elsevier.
Hoffman, W. H., and Haberly, L. B. (1993). Role of synaptic excitation in the generation of bursting-induced epileptiform potentials in the endopiriform nucleus and piriform cortex. J. Neurophysiol. 70, 2550–2561. doi: 10.1152/jn.1993.70.6.2550
Hoffman, W. H., and Haberly, L. B. (1996). Kindling-induced epileptiform potentials in piriform cortex slices originate in the underlying endopiriform nucleus. J. Neurophysiol. 76, 1430–1438. doi: 10.1152/jn.1996.76.3.1430
Holmberg, M., Fagerholm, V., and Scheinin, M. (2003). Regional distribution of alpha(2C)-adrenoceptors in brain and spinal cord of control mice and transgenic mice overexpressing the alpha(2C)-subtype: an autoradiographic study with [(3)H]RX821002 and [(3)H]rauwolscine. Neuroscience 117, 875–898. doi: 10.1016/S0306-4522(02)00966-1
Ikemoto, S. (2007). Dopamine reward circuitry: two projection systems from the ventral midbrain to the nucleus accumbens-olfactory tubercle complex. Brain Res. Rev. 56, 27–78. doi: 10.1016/j.brainresrev.2007.05.004
Illig, K. R. (2006). Projections from orbitofrontal cortex to anterior piriform cortex in the rat suggest a role in olfactory information processing. J. Comp. Neurol. 488, 224–231. doi: 10.1002/cne.20595
Imamura, F., Ayoub, A. E., Rakic, P., and Greer, C. A. (2011). Timing of neurogenesis is a determinant of olfactory circuitry. Nat. Neurosci. 14, 331–337. doi: 10.1038/nn.2754
Impieri, D., Zilles, K., Niu, M., Rapan, L., Schubert, N., Galletti, C., et al. (2019). Receptor density pattern confirms and enhances the anatomic-functional features of the macaque superior parietal lobule areas. Brain Struct. Funct. 224, 2733–2756. doi: 10.1007/s00429-019-01930-9
Jia, C., Chen, W. R., and Shepherd, G. M. (1999). Synaptic organization and neurotransmitters in the rat accessory olfactory bulb. J. Neurophysiol. 81, 345–355. doi: 10.1152/jn.1999.81.1.345
Jones, L. S., Gauger, L. L., and Davis, J. N. (1985). Anatomy of brain alpha 1-adrenergic receptors: in vitro autoradiography with [125I]-heat. J. Comp. Neurol. 231, 190–208. doi: 10.1002/cne.902310207
Knable, M. B., Hyde, T. M., Herman, M. M., Carter, J. M., Bigelow, L., and Kleinman, J. E. (1994). Quantitative autoradiography of dopamine-D1 receptors, D2 receptors, and dopamine uptake sites in postmortem striatal specimens from schizophrenic patients. Biol. Psychiatry 36, 827–835. doi: 10.1016/0006-3223(94)90593-2
Kwakowsky, A., Calvo-Flores Guzmán, B., Pandya, M., Turner, C., Waldvogel, H. J., and Faull, R. L. (2018). GABA(A) receptor subunit expression changes in the human Alzheimer's disease hippocampus, subiculum, entorhinal cortex and superior temporal gyrus. J. Neurochem. 145, 374–392. doi: 10.1111/jnc.14325
Lancelot, S., and Zimmer, L. (2010). Small-animal positron emission tomography as a tool for neuropharmacology. Trends Pharmacol. Sci. 31, 411–417. doi: 10.1016/j.tips.2010.06.002
Lazic, S. E., Goodman, A. O., Grote, H. E., Blakemore, C., Morton, A. J., Hannan, A. J., et al. (2007). Olfactory abnormalities in Huntington's disease: decreased plasticity in the primary olfactory cortex of R6/1 transgenic mice and reduced olfactory discrimination in patients. Brain Res. 1151, 219–226. doi: 10.1016/j.brainres.2007.03.018
Lee, Y. H., Bak, Y., Park, C. H., Chung, S. J., Yoo, H. S., Baik, K., et al. (2020). Patterns of olfactory functional networks in Parkinson's disease dementia and Alzheimer's dementia. Neurobiol. Aging 89, 63–70. doi: 10.1016/j.neurobiolaging.2019.12.021
Lein, E. S., Hawrylycz, M. J., Ao, N., Ayres, M., Bensinger, A., Bernard, A., et al. (2007). Genome-wide atlas of gene expression in the adult mouse brain. Nature 445, 168–176. doi: 10.1038/nature05453
Leitner, F. C., Melzer, S., Lutcke, H., Pinna, R., Seeburg, P. H., Helmchen, F., et al. (2016). Spatially segregated feedforward and feedback neurons support differential odor processing in the lateral entorhinal cortex. Nat. Neurosci. 19, 935–944. doi: 10.1038/nn.4303
Li, Y., Huang, X. F., Deng, C., Meyer, B., Wu, A., Yu, Y., et al. (2010). Alterations in 5-HT2A receptor binding in various brain regions among 6-hydroxydopamine-induced Parkinsonian rats. Synapse 64, 224–230. doi: 10.1002/syn.20722
Linster, C., and Cleland, T. A. (2016). Neuromodulation of olfactory transformations. Curr. Opin. Neurobiol. 40, 170–177. doi: 10.1016/j.conb.2016.07.006
Luskin, M. B., and Price, J. L. (1983). The topographic organization of associational fibers of the olfactory system in the rat, including centrifugal fibers to the olfactory bulb. J. Comp. Neurol. 216, 264–291. doi: 10.1002/cne.902160305
Mann, E. O., Kohl, M. M., and Paulsen, O. (2009). Distinct roles of GABA(A) and GABA(B) receptors in balancing and terminating persistent cortical activity. J. Neurosci. 29, 7513–7518. doi: 10.1523/JNEUROSCI.6162-08.2009
Mason, D. M., Nouraei, N., Pant, D. B., Miner, K. M., Hutchison, D. F., Luk, K. C., et al. (2016). Transmission of α-synucleinopathy from olfactory structures deep into the temporal lobe. Mol. Neurodegener. 11:49. doi: 10.1186/s13024-016-0113-4
McGregor, I. S., Hargreaves, G. A., Apfelbach, R., and Hunt, G. E. (2004). Neural correlates of cat odor-induced anxiety in rats: region-specific effects of the benzodiazepine midazolam. J. Neurosci. 24, 4134–4144. doi: 10.1523/JNEUROSCI.0187-04.2004
McLean, J. H., Shipley, M. T., Nickell, W. T., Aston-Jones, G., and Reyher, C. K. (1989). Chemoanatomical organization of the noradrenergic input from locus coeruleus to the olfactory bulb of the adult rat. J. Comp. Neurol. 285, 339–349. doi: 10.1002/cne.902850305
McOmish, C. E., Demireva, E. Y., and Gingrich, J. A. (2016). Developmental expression of mGlu2 and mGlu3 in the mouse brain. Gene Expr. Patterns 22, 46–53. doi: 10.1016/j.gep.2016.10.001
Merker, B. (1983). Silver staining of cell bodies by means of physical development. J. Neurosci. Methods 9, 235–241. doi: 10.1016/0165-0270(83)90086-9
Mesholam, R. I., Moberg, P. J., Mahr, R. N., and Doty, R. L. (1998). Olfaction in neurodegenerative disease: a meta-analysis of olfactory functioning in Alzheimer's and Parkinson's diseases. Arch. Neurol. 55, 84–90. doi: 10.1001/archneur.55.1.84
Middleton, S., Jalics, J., Kispersky, T., Lebeau, F. E., Roopun, A. K., Kopell, N. J., et al. (2008). NMDA receptor-dependent switching between different gamma rhythm-generating microcircuits in entorhinal cortex. Proc. Natl. Acad. Sci. U.S.A. 105, 18572–18577. doi: 10.1073/pnas.0809302105
Mohrhardt, J., Nagel, M., Fleck, D., Ben-Shaul, Y., and Spehr, M. (2018). Signal detection and coding in the accessory olfactory system. Chem. Senses 43, 667–695. doi: 10.1093/chemse/bjy061
Mucignat-Caretta, C. (2010). The rodent accessory olfactory system. J. Comp. Physiol. A Neuroethol. Sens. Neural Behav. Physiol. 196, 767–777. doi: 10.1007/s00359-010-0555-z
Münster, A., Sommer, S., and Hauber, W. (2020). Dopamine D1 receptors in the medial orbitofrontal cortex support effort-related responding in rats. Eur. Neuropsychopharmacol. 32, 136–141. doi: 10.1016/j.euroneuro.2020.01.008
Murata, K. (2020). Hypothetical roles of the olfactory tubercle in odor-guided eating behavior. Front. Neural Circuits 14:577880. doi: 10.3389/fncir.2020.577880
Murata, K., Kanno, M., Ieki, N., Mori, K., and Yamaguchi, M. (2015). Mapping of learned odor-induced motivated behaviors in the mouse olfactory tubercle. J. Neurosci. 35, 10581–10599. doi: 10.1523/JNEUROSCI.0073-15.2015
Murata, K., Kinoshita, T., Fukazawa, Y., Kobayashi, K., Yamanaka, A., Hikida, T., et al. (2019). Opposing roles of dopamine receptor D1- and D2-expressing neurons in the anteromedial olfactory tubercle in acquisition of place preference in mice. Front. Behav. Neurosci. 13:50. doi: 10.3389/fnbeh.2019.00050
Murphy, G. J., Glickfeld, L. L., Balsen, Z., and Isaacson, J. S. (2004). Sensory neuron signaling to the brain: properties of transmitter release from olfactory nerve terminals. J. Neurosci. 24, 3023–3030. doi: 10.1523/JNEUROSCI.5745-03.2004
Nibber, A., Mann, E. O., Pettingill, P., Waters, P., Irani, S. R., Kullmann, D. M., et al. (2017). Pathogenic potential of antibodies to the GABA(B) receptor. Epilepsia Open 2, 355–359. doi: 10.1002/epi4.12067
Ohishi, H., Shigemoto, R., Nakanishi, S., and Mizuno, N. (1993). Distribution of the messenger RNA for a metabotropic glutamate receptor, mGluR2, in the central nervous system of the rat. Neuroscience 53, 1009–1018. doi: 10.1016/0306-4522(93)90485-X
Ohm, T. G., and Braak, H. (1987). Olfactory bulb changes in Alzheimer's disease. Acta Neuropathol. 73, 365–369. doi: 10.1007/BF00688261
Ottersen, O. P. (1982). Connections of the amygdala of the rat. IV: Corticoamygdaloid and intraamygdaloid connections as studied with axonal transport of horseradish peroxidase. J. Comp. Neurol. 205, 30–48. doi: 10.1002/cne.902050104
Palomero-Gallagher, N., Vogt, B. A., Schleicher, A., Mayberg, H. S., and Zilles, K. (2009). Receptor architecture of human cingulate cortex: evaluation of the four-region neurobiological model. Hum. Brain Mapp. 30, 2336–2355. doi: 10.1002/hbm.20667
Palomero-Gallagher, N., and Zilles, K. (2018). Cyto- and receptor architectonic mapping of the human brain. Handb. Clin. Neurol. 150, 355–387 doi: 10.1016/B978-0-444-63639-3.00024-4
Panzanelli, P., Perazzini, A., Fritschy, J.-M., and Sassoè-Pognetto, M. (2005). Heterogeneity of GABAA receptor subtypes in mitral and tufted cells of the rat main olfactory bulb. J. Comp. Neurol. 484, 121–131. doi: 10.1002/cne.20440
Pearce, R. K., Hawkes, C. H., and Daniel, S. E. (1995). The anterior olfactory nucleus in Parkinson's disease. Mov. Disord. 10, 283–287. doi: 10.1002/mds.870100309
Perez-Lloret, S., and Barrantes, F. J. (2016). Deficits in cholinergic neurotransmission and their clinical correlates in Parkinson's disease. NPJ Parkinsons Dis. 2:16001. doi: 10.1038/npjparkd.2016.1
Peters, J., Kalivas, P. W., and Quirk, G. J. (2009). Extinction circuits for fear and addiction overlap in prefrontal cortex. Learn. Mem. 16, 279–288. doi: 10.1101/lm.1041309
Petralia, R. S., Wang, Y. X., and Wenthold, R. J. (1994a). Histological and ultrastructural localization of the kainate receptor subunits, KA2 and GluR6/7, in the rat nervous system using selective antipeptide antibodies. J. Comp. Neurol. 349, 85–110. doi: 10.1002/cne.903490107
Petralia, R. S., and Wenthold, R. J. (1992). Light and electron immunocytochemical localization of AMPA-selective glutamate receptors in the rat brain. J. Comp. Neurol. 318, 329–354. doi: 10.1002/cne.903180309
Petralia, R. S., Yokotani, N., and Wenthold, R. J. (1994b). Light and electron microscope distribution of the NMDA receptor subunit NMDAR1 in the rat nervous system using a selective anti-peptide antibody. J. Neurosci. 14, 667–696. doi: 10.1523/JNEUROSCI.14-02-00667.1994
Pigache, R. M. (1970). The anatomy of “paleocortex”. A critical review. Ergeb. Anat. Entwicklungsgesch 43, 3–62. doi: 10.1007/978-3-642-65004-8
Reiner, D. J., Lofaro, O. M., Applebey, S. V., Korah, H., Venniro, M., Cifani, C., et al. (2020). Role of projections between piriform cortex and orbitofrontal cortex in relapse to fentanyl seeking after palatable food choice-induced voluntary abstinence. J. Neurosci. 40, 2485–2497. doi: 10.1523/JNEUROSCI.2693-19.2020
Richards, J. G., Schoch, P., Häring, P., Takacs, B., and Möhler, H. (1987). Resolving GABAA/benzodiazepine receptors: cellular and subcellular localization in the CNS with monoclonal antibodies. J. Neurosci. 7, 1866–1886. doi: 10.1523/JNEUROSCI.07-06-01866.1987
Salin, P. A., Lledo, P. M., Vincent, J. D., and Charpak, S. (2001). Dendritic glutamate autoreceptors modulate signal processing in rat mitral cells. J. Neurophysiol. 85, 1275–1282. doi: 10.1152/jn.2001.85.3.1275
Santana, N., Mengod, G., and Artigas, F. (2009). Quantitative analysis of the expression of dopamine D1 and D2 receptors in pyramidal and GABAergic neurons of the rat prefrontal cortex. Cereb. Cortex 19, 849–860. doi: 10.1093/cercor/bhn134
Santiago, A. C., and Shammah-Lagnado, S. J. (2005). Afferent connections of the amygdalopiriform transition area in the rat. J. Comp. Neurol. 489, 349–371. doi: 10.1002/cne.20637
Savasta, M., Dubois, A., and Scatton, B. (1986). Autoradiographic localization of D1 dopamine receptors in the rat brain with [3H]SCH 23390. Brain Res. 375, 291–301. doi: 10.1016/0006-8993(86)90749-3
Scheinin, M., Lomasney, J. W., Hayden-Hixson, D. M., Schambra, U. B., Caron, M. G., Lefkowitz, R. J., et al. (1994). Distribution of alpha 2-adrenergic receptor subtype gene expression in rat brain. Brain Res. Mol. Brain Res. 21, 133–149. doi: 10.1016/0169-328X(94)90386-7
Schlegel, J. R., and Kriegstein, A. R. (1987). Quantitative autoradiography of muscarinic and benzodiazepine receptors in the forebrain of the turtle, Pseudemys scripta. J. Comp. Neurol. 265, 521–529. doi: 10.1002/cne.902650406
Schleicher, A., Palomero-Gallagher, N., Morosan, P., Eickhoff, S. B., Kowalski, T., de Vos, K., et al. (2005). Quantitative architectural analysis: a new approach to cortical mapping. Anat. Embryol. 210, 373–386. doi: 10.1007/s00429-005-0028-2
Schoenbaum, G., Chiba, A. A., and Gallagher, M. (1999). Neural encoding in orbitofrontal cortex and basolateral amygdala during olfactory discrimination learning. J. Neurosci. 19, 1876–1884. doi: 10.1523/JNEUROSCI.19-05-01876.1999
Schwob, J. E., and Price, J. L. (1984a). The development of axonal connections in the central olfactory system of rats. J. Comp. Neurol. 223, 177–202. doi: 10.1002/cne.902230204
Schwob, J. E., and Price, J. L. (1984b). The development of lamination of afferent fibers to the olfactory cortex in rats, with additional observations in the adult. J. Comp. Neurol. 223, 203–222. doi: 10.1002/cne.902230205
Scott, J. W., McBride, R. L., and Schneider, S. P. (1980). The organization of projections from the olfactory bulb to the piriform cortex and olfactory tubercle in the rat. J. Comp. Neurol. 194, 519–534. doi: 10.1002/cne.901940304
Shepherd, G. M. (2004). The Synaptic Organization of the Brain. Oxford; New York, NY: Oxford University Press. doi: 10.1093/acprof:oso/9780195159561.001.1
Shiotani, K., Tanisumi, Y., Murata, K., Hirokawa, J., Sakurai, Y., and Manabe, H. (2020). Tuning of olfactory cortex ventral tenia tecta neurons to distinct task elements of goal-directed behavior. Elife 9:e57268. doi: 10.7554/eLife.57268.sa2
Smith, T. C., and Jahr, C. E. (2002). Self-inhibition of olfactory bulb neurons. Nat. Neurosci. 5, 760–766. doi: 10.1038/nn882
Sokolic, L., and McGregor, I. S. (2007). Benzodiazepines impair the acquisition and reversal of olfactory go/no-go discriminations in rats. Behav. Neurosci. 121, 527–534. doi: 10.1037/0735-7044.121.3.527
Song, C., and Leonard, B. E. (2005). The olfactory bulbectomised rat as a model of depression. Neurosci. Biobehav. Rev. 29, 627–647. doi: 10.1016/j.neubiorev.2005.03.010
Spencer, S. S., and Spencer, D. D. (1994). Entorhinal-hippocampal interactions in medial temporal lobe epilepsy. Epilepsia 35, 721–727. doi: 10.1111/j.1528-1157.1994.tb02502.x
Stäubli, U., Ivy, G., and Lynch, G. (1984). Hippocampal denervation causes rapid forgetting of olfactory information in rats. Proc. Natl. Acad. Sci. U.S.A. 81, 5885–5887. doi: 10.1073/pnas.81.18.5885
Staubli, U., Schottler, F., and Nejat-Bina, D. (1987). Role of dorsomedial thalamic nucleus and piriform cortex in processing olfactory information. Behav. Brain Res. 25, 117–129. doi: 10.1016/0166-4328(87)90005-2
Stefanits, H., Milenkovic, I., Mahr, N., Pataraia, E., Baumgartner, C., Hainfellner, J. A., et al. (2019). Alterations in GABAA Receptor Subunit Expression in the Amygdala and Entorhinal Cortex in Human Temporal Lobe Epilepsy. J. Neuropathol. Exp. Neurol. 78, 1022–1048. doi: 10.1093/jnen/nlz085
Sugai, T., Yamamoto, R., Yoshimura, H., and Kato, N. (2012). Multimodal cross-talk of olfactory and gustatory information in the endopiriform nucleus in rats. Chem. Senses 37, 681–688. doi: 10.1093/chemse/bjs046
Sulzer, D., Cragg, S. J., and Rice, M. E. (2016). Striatal dopamine neurotransmission: regulation of release and uptake. Basal Ganglia 6, 123–148. doi: 10.1016/j.baga.2016.02.001
Thompson, S. E., Ayman, G., Woodhall, G. L., and Jones, R. S. (2006). Depression of glutamate and GABA release by presynaptic GABAB receptors in the entorhinal cortex in normal and chronically epileptic rats. Neurosignals 15, 202–215. doi: 10.1159/000098515
Torigoe, M., Yamauchi, K., Zhu, Y., Kobayashi, H., and Murakami, F. (2015). Association of astrocytes with neurons and astrocytes derived from distinct progenitor domains in the subpallium. Sci. Rep. 5:12258. doi: 10.1038/srep12258
Ubeda-Bañon, I., Saiz-Sanchez, D., Flores-Cuadrado, A., Rioja-Corroto, E., Gonzalez-Rodriguez, M., Villar-Conde, S., et al. (2020). The human olfactory system in two proteinopathies: Alzheimer's and Parkinson's diseases. Transl. Neurodegener. 9:22. doi: 10.1186/s40035-020-00200-7
Unnerstall, J. R., Kopajtic, T. A., and Kuhar, M. J. (1984). Distribution of alpha 2 agonist binding sites in the rat and human central nervous system: analysis of some functional, anatomic correlates of the pharmacologic effects of clonidine and related adrenergic agents. Brain Res. 319, 69–101. doi: 10.1016/0165-0173(84)90030-4
Urban, N. N., and Sakmann, B. (2002). Reciprocal intraglomerular excitation and intra- and interglomerular lateral inhibition between mouse olfactory bulb mitral cells. J. Physiol. 542, 355–367. doi: 10.1113/jphysiol.2001.013491
Van Hoesen, G. W., Hyman, B. T., and Damasio, A. R. (1986). Cell-specific pathology in neural systems of the temporal lobe in Alzheimer's disease. Prog. Brain Res. 70, 321–335. doi: 10.1016/S0079-6123(08)64313-7
Wada, E., Shigemoto, R., Kinoshita, A., Ohishi, H., and Mizuno, N. (1998). Metabotropic glutamate receptor subtypes in axon terminals of projection fibers from the main and accessory olfactory bulbs: a light and electron microscopic immunohistochemical study in the rat. J. Comp. Neurol. 393, 493–504. doi: 10.1002/(SICI)1096-9861(19980420)393:4<493::AID-CNE8>3.0.CO
Wamsley, J. K., Hunt, M. E., McQuade, R. D., and Alburges, M. E. (1991). [3H]SCH39166, a D1 dopamine receptor antagonist: binding characteristics and localization. Exp. Neurol. 111, 145–151. doi: 10.1016/0014-4886(91)90001-S
Watson, C., and Puelles, L. (2017). Developmental gene expression in the mouse clarifies the organization of the claustrum and related endopiriform nuclei. J. Comp. Neurol. 525, 1499–1508 doi: 10.1002/cne.24034
Wesson, D. W., and Wilson, D. A. (2011). Sniffing out the contributions of the olfactory tubercle to the sense of smell: hedonics, sensory integration, and more? Neurosci. Biobehav. Rev. 35, 655–668. doi: 10.1016/j.neubiorev.2010.08.004
West, P. J., Dalpé-Charron, A., and Wilcox, K. S. (2007). Differential contribution of kainate receptors to excitatory postsynaptic currents in superficial layer neurons of the rat medial entorhinal cortex. Neuroscience 146, 1000–1012. doi: 10.1016/j.neuroscience.2007.02.035
Wilson, D. A., Chapuis, J., and Sullivan, R. M. (2015). “Chapter 10: cortical olfactory anatomy and physiology,” in Handbook of Olfaction and Gustation, ed R. L. Doty (John Wiley & Sons), 209–224. doi: 10.1002/9781118971758.ch10
Wisden, W., and Seeburg, P. H. (1993). A complex mosaic of high-affinity kainate receptors in rat brain. J. Neurosci. 13, 3582–3598. doi: 10.1523/JNEUROSCI.13-08-03582.1993
Wright, R. A., Johnson, B. G., Zhang, C., Salhoff, C., Kingston, A. E., Calligaro, D. O., et al. (2013). CNS distribution of metabotropic glutamate 2 and 3 receptors: transgenic mice and [3H]LY459477 autoradiography. Neuropharmacology 66, 89–98. doi: 10.1016/j.neuropharm.2012.01.019
Wyss, J. M., and Sripanidkulchai, K. (1983). The indusium griseum and anterior hippocampal continuation in the rat. J. Comp. Neurol. 219, 251–272. doi: 10.1002/cne.902190302
Xiong, A., and Wesson, D. W. (2016). Illustrated review of the ventral striatum's olfactory tubercle. Chem. Senses 41, 549–555. doi: 10.1093/chemse/bjw069
Xu, Y., Yan, J., Zhou, P., Li, J., Gao, H., Xia, Y., et al. (2012). Neurotransmitter receptors and cognitive dysfunction in Alzheimer's disease and Parkinson's disease. Prog Neurobiol. 97, 1–13. doi: 10.1016/j.pneurobio.2012.02.002
Yuan, T. F., and Slotnick, B. M. (2014). Roles of olfactory system dysfunction in depression. Prog. Neuropsychopharmacol. Biol. Psychiatry 54, 26–30. doi: 10.1016/j.pnpbp.2014.05.013
Zaborszky, L., Carlsen, J., Brashear, H. R., and Heimer, L. (1986). Cholinergic and GABAergic afferents to the olfactory bulb in the rat with special emphasis on the projection neurons in the nucleus of the horizontal limb of the diagonal band. J. Comp. Neurol. 243, 488–509. doi: 10.1002/cne.902430405
Zak, J. D., Whitesell, J. D., and Schoppa, N. E. (2015). Metabotropic glutamate receptors promote disinhibition of olfactory bulb glomeruli that scales with input strength. J. Neurophysiol. 113, 1907–1920. doi: 10.1152/jn.00222.2014
Zhang, J. H., Araki, T., Sato, M., and Tohyama, M. (1991). Distribution of GABAA-receptor alpha 1 subunit gene expression in the rat forebrain. Brain Res. Mol. Brain Res. 11, 239–247. doi: 10.1016/0169-328X(91)90032-S
Zhang, S., Xiao, Q., and Le, W. (2015). Olfactory dysfunction and neurotransmitter disturbance in olfactory bulb of transgenic mice expressing human A53T mutant α-synuclein. PLoS ONE 10:e0119928. doi: 10.1371/journal.pone.0119928
Zhang, Z., Liu, Q., Wen, P., Zhang, J., Rao, X., Zhou, Z., et al. (2017). Activation of the dopaminergic pathway from VTA to the medial olfactory tubercle generates odor-preference and reward. Elife 6:e25423. doi: 10.7554/eLife.25423.031
Zilles, K., Bacha-Trams, M., Palomero-Gallagher, N., Amunts, K., and Friederici, A. D. (2015). Common molecular basis of the sentence comprehension network revealed by neurotransmitter receptor fingerprints. Cortex 63, 79–89 doi: 10.1016/j.cortex.2014.07.007
Zilles, K., and Palomero-Gallagher, N. (2017). Multiple transmitter receptors in regions and layers of the human cerebral cortex. Front. Neuroanat. 11:78. doi: 10.3389/fnana.2017.00078
Zilles, K., Palomero-Gallagher, N., Grefkes, C., Scheperjans, F., Boy, C., Amunts, K., et al. (2002a). Architectonics of the human cerebral cortex and transmitter receptor fingerprints: reconciling functional neuroanatomy and neurochemistry. Eur. Neuropsychopharmacol. 12, 587–599. doi: 10.1016/S0924-977X(02)00108-6
Zilles, K., and Schleicher, A. (1995). “Correlative imaging of transmitter receptor distributions in human cortex,” in Autoradiography and Correlative Imaging (eds Stumpf W, Solomon H), (San Diego: Academic Press), 277–307.
Zilles, K., Schleicher, A., Palomero-Gallagher, N., and Amunts, K. (2002b). “Quantitative analysis of cyto- and receptor architecture of the human brain,” in Brain Mapping: The Methods, ed A. W. Toga (San Diego, CA), 573–602. doi: 10.1016/B978-012693019-1/50023-X
Keywords: receptor autoradiography, rodent, neurotransmitter receptors, olfactory cortex, taenia tecta, dorsal peduncular cortex, entorhinal cortex, orbitofrontal cortex
Citation: Lothmann K, Amunts K and Herold C (2021) The Neurotransmitter Receptor Architecture of the Mouse Olfactory System. Front. Neuroanat. 15:632549. doi: 10.3389/fnana.2021.632549
Received: 23 November 2020; Accepted: 03 March 2021;
Published: 23 April 2021.
Edited by:
Patrik Krieger, Ruhr University Bochum, GermanyReviewed by:
Carla Mucignat, University of Padua, ItalyKathryn A. Hamilton, Louisiana State University Health Shreveport, United States
Copyright © 2021 Lothmann, Amunts and Herold. This is an open-access article distributed under the terms of the Creative Commons Attribution License (CC BY). The use, distribution or reproduction in other forums is permitted, provided the original author(s) and the copyright owner(s) are credited and that the original publication in this journal is cited, in accordance with accepted academic practice. No use, distribution or reproduction is permitted which does not comply with these terms.
*Correspondence: Kimberley Lothmann, kimberley.lothmann@uni-duesseldorf.de