Independent effect of body mass index variation on amyloid-β positivity
 Sung Hoon Kang1,2,3†
  Jong Hyuk Kim4†
  Yoosoo Chang5 Bo Kyoung Cheon1,2,4
  Yeong Sim Choe1,2,6
  Hyemin Jang1,2
  Hee Jin Kim1,2 Seong-Beom Koh3 Duk L. Na1,2
  Kyunga Kim4,7,8*
  Sang Won Seo1,2,6,9,10*
- 1Department of Neurology, Samsung Medical Center, School of Medicine, Sungkyunkwan University, Seoul, South Korea
- 2Neuroscience Center, Samsung Medical Center, Seoul, South Korea
- 3Department of Neurology, Korea University Guro Hospital, Korea University College of Medicine, Seoul, South Korea
- 4Department of Digital Health, SAIHST, Sungkyunkwan University, Seoul, South Korea
- 5Center for Cohort Studies, Total Healthcare Center, Kangbuk Samsung Hospital, School of Medicine, Sungkyunkwan University, Seoul, South Korea
- 6Department of Health Sciences & Technology, SAIHST, Sungkyunkwan University, Seoul, South Korea
- 7Biomedical Statistics Center, Research Institute for Future Medicine, Samsung Medical Center, Seoul, South Korea
- 8Department of Data Convergence and Future Medicine, School of Medicine, Sungkyunkwan University, Seoul, South Korea
- 9Samsung Alzheimer Research Center, Center for Clinical Epidemiology Medical Center, Seoul, South Korea
- 10Department of Intelligent Precision Healthcare Convergence, SAIHST, Sungkyunkwan University, Seoul, South Korea
Objectives: The relationship of body mass index (BMI) changes and variability with amyloid-β (Aβ) deposition remained unclear, although there were growing evidence that BMI is associated with the risk of developing cognitive impairment or AD dementia. To determine whether BMI changes and BMI variability affected Aβ positivity, we investigated the association of BMI changes and BMI variability with Aβ positivity, as assessed by PET in a non-demented population.
Methods: We retrospectively recruited 1,035 non-demented participants ≥50 years of age who underwent Aβ PET and had at least three BMI measurements in the memory clinic at Samsung Medical Center. To investigate the association between BMI change and variability with Aβ deposition, we performed multivariable logistic regression. Further distinctive underlying features of BMI subgroups were examined by employing a cluster analysis model.
Results: Decreased (odds ratio [OR] = 1.68, 95% confidence interval [CI] 1.16–2.42) or increased BMI (OR = 1.60, 95% CI 1.11–2.32) was associated with a greater risk of Aβ positivity after controlling for age, sex, APOE e4 genotype, years of education, hypertension, diabetes, baseline BMI, and BMI variability. A greater BMI variability (OR = 1.73, 95% CI 1.07–2.80) was associated with a greater risk of Aβ positivity after controlling for age, sex, APOE e4 genotype, years of education, hypertension, diabetes, baseline BMI, and BMI change. We also identified BMI subgroups showing a greater risk of Aβ positivity.
Conclusion: Our findings suggest that participants with BMI change, especially those with greater BMI variability, are more vulnerable to Aβ deposition regardless of baseline BMI. Furthermore, our results may contribute to the design of strategies to prevent Aβ deposition with respect to weight control.
Introduction
A large amount of evidence suggests that body mass index (BMI) is associated with the risk of developing cognitive impairment. Specifically, mid-life obesity increases the risk of cognitive impairment (Kivipelto et al., 2005; Fitzpatrick et al., 2009; Tolppanen et al., 2014). Previous studies have also shown that being underweight in later life may be associated with an increased risk of dementia (Tolppanen et al., 2014; Bell et al., 2017), and the acceleration of cortical atrophy (Kim H. et al., 2015; Kim et al., 2019). Furthermore, larger BMI changes were also associated with a higher risk of conversion to dementia in patients with mild cognitive impairment (MCI), (Ye et al., 2016) and these changes had deleterious effects on the cognitive function in the non-demented elderly (Giudici et al., 2019).
Amyloid-β (Aβ) deposition in the brain is an important pathological hallmark of Alzheimer’s disease (AD), which is the most common cause of dementia. According to the Aβ cascade hypothesis, Aβ deposition in the brain occurs at a very early stage. In fact, Aβ deposition in the brain precedes the development of AD dementia by 10–20 years. Furthermore, non-demented participants with Aβ deposition were more converted to dementia than those without Aβ deposition (Villemagne et al., 2011; Rowe et al., 2013; Ye et al., 2018). Therefore, Aβ positivity is a crucial predictor of AD prognosis in non-demented individuals.
Recently, being underweight or obese in mid-life was found to be associated with an increased risk of Aβ deposition (Gottesman et al., 2017; Lee et al., 2020; Möllers et al., 2021), and individuals who are underweight in later life were also at an increased risk of Aβ deposition (Vidoni et al., 2011; Ewers et al., 2012; Hsu et al., 2016; Thirunavu et al., 2019). However, since previous studies investigated the association of BMI with Aβ deposition at a single time point, these studies could not evaluate the effects of BMI variability on Aβ deposition. Considering that BMI changes and variability is closely associated with a new onset of diabetes, cardiovascular disease, atrial fibrillation, and higher mortality Bangalore et al., 2017; Lim et al., 2019; Sponholtz et al., 2019), it is reasonable to expect that BMI changes and variability may be important risk factors for Aβ deposition. Therefore, by studying the association of BMI changes and variability with Aβ deposition, it could be identified whether BMI changes and variability is specifically related to AD, especially in the early stage of AD pathobiology. Furthermore, this study may provide the importance of rigorous strategies for weight maintenance to prevent Aβ deposition in non-demented individuals.
Thus, the goal of our study was to investigate the influence of BMI changes and BMI variability on Aβ positivity in a non-demented population. Furthermore, to determine the complex relationships among BMI changes, BMI variability, and Aβ positivity, we evaluated the distinguishable BMI subgroups classified by the cluster analysis model. We hypothesized that decreased BMI and greater BMI variability would have deleterious effects on Aβ deposition.
Materials and methods
Participants
Our study was designed as a retrospective cohort study. We recruited 1,546 non-demented participants ≥50 years of age [611 with normal cognition and 935 with mild cognitive impairment (MCI)] from the memory clinic in the Department of Neurology at Samsung Medical Center (SMC) in Seoul, Korea. The participants had undergone Aβ PET between August 2015 and August 2020. All participants underwent a comprehensive dementia work-up including the standardized cognitive assessment battery (Kang et al., 2019), APOE genotyping, and brain MRI. We excluded participants who had any of the following conditions: severe white matter hyperintensities based on the Fazekas scale; structural lesions such as brain tumor, large territorial infarct, and intracranial hemorrhage; other causes of neurodegenerative diseases including Lewy body dementia, Parkinson’s disease, cortico-basal syndrome, progressive supranuclear palsy, and frontotemporal dementia.
All participants with normal cognition fulfilled the following conditions: (1) no medical history that is likely to affect cognitive function based on Christensen’s criteria (Christensen et al., 1991); (2) no objective cognitive impairment from a comprehensive neuropsychological test battery on any cognitive domain (at least −1.0 SD above age-adjusted norms on any cognitive tests); and (3) independence in activities of daily living. All participants with MCI fulfilled Petersen’s criteria with the following modifications (Petersen, 2011; Jeong et al., 2020): (1) subjective cognitive complaints by the participants or caregiver; (2) objective memory impairment below −1.0 SD on verbal or visual memory tests; (3) no significant impairment in activities of daily living; (4) non-demented.
The institutional review board of the SMC approved this study. Written informed consent was obtained from all participants.
Amyloid-β PET acquisition
All participants underwent Aβ PET (18F-florbetaben [FBB] PET and 18F-flutemetamol [FMM] PET) scans at SMC using a Discovery STe PET/CT scanner (GE Medical Systems, Milwaukee, WI, United States). For FBB or FMM PET, a 20-min emission PET scan in dynamic mode (consisting of 4 min × 5 min frames) was performed 90 min after an injection of a mean dose of 311.5 MBq FBB and 197.7 MBq FMM, respectively. Three-dimensional PET images were reconstructed in a 128 × 128 × 48 matrix with a 2 mm × 2 mm × 3.27 mm voxel size using the ordered-subsets expectation maximization algorithm (FBB, iteration = 4 and subset = 20; FMM, iteration = 4 and subset = 20).
Amyloid-β PET assessment
Aβ positivity on PET scans was determined using visual reads in the primary analyses. Specifically, Aβ PET images were rated by two experienced doctors (one nuclear medicine physician and one neurologist) who were blinded to the clinical information, and the images were dichotomized as either Aβ-positive (Aβ+) or Aβ-negative (Aβ−) using visual reads. They discussed any discordant results regarding Aβ positivity to achieve consensus. The FBB PET scan was regarded as positive if the Aβ plaque load was visually rated as 2 or 3 on the brain amyloid plaque load scoring system, and the FMM PET scan was considered positive if one of five brain regions (frontal, parietal, posterior cingulate and precuneus, striatum, and lateral temporal lobes) systematically reviewed using FMM PET was positive in either hemisphere (Kang et al., 2021). Representative PET images in participants with Aβ+ and Aβ− were shown in Supplementary Figure 1. Inter-rater agreement of PET interpretation was excellent for Aβ positivity at the subject level (kappa score = 0.84). In addition, visual rating was highly concordant with a standardized uptake value ratio (SUVR) cutoff categorization for Aβ positivity (93.5% for FBB and 91.6% for FMM).
Amyloid-β PET quantification using Centiloid values
For the sensitivity analyses, Aβ positivity on PET scans was determined using Centiloid (CL) cutoff-based categorization. We used a CL method previously developed by our group (Cho et al., 2020) to standardize the quantification of Aβ PET images obtained using different ligands. The CL method for FBB and FMM PET enables the transformation of the SUVR of FBB and FMM PET to CL values directly without conversion to the 11C-labeled Pittsburgh compound SUVR.
There are three steps to obtain CL values (Cho et al., 2020): (1) preprocessing of PET images, (2) determination of CL global cortical target volume of interest (CTX VOI), and (3) conversion of SUVR to CL values. First, to preprocess the Aβ PET images, PET images were co-registered to each participant’s MR image and then normalized to a T1-weighted MNI-152 template using the SPM8 unified segmentation method (Klunk et al., 2015). We used T1-weighted MRI correction with the N3 algorithm only for intensity non-uniformities (Sled et al., 1998), without applying corrections to the PET images for brain atrophy or partial volume effects. Second, we used the FBB-FMM CTX VOI defined as areas of AD-specific brain Aβ deposition in our previous study (Cho et al., 2020). Briefly, to exclude areas of aging-related brain Aβ deposition, the FBB-FMM CTX VOI was generated by comparing SUVR parametric images (with the whole cerebellum as a reference area) between 20 typical patients with AD-related cognitive impairment (AD-CTX) and 16 healthy elderly participants (EH-CTX) who underwent both FBB and FMM PET scans. To generate the FBB-FMM CTX VOI, the average EH-CTX image was subtracted from the average AD-CTX image. We then defined the FBB-FMM CTX VOI as areas of AD-related brain Aβ accumulation common to both FBB and FMM PET. Finally, the SUVR values of the FBB-FMM CTX VOI were converted to CL units using the CL conversion equation. The CL equation was derived from the FBB-FMM CTX VOI separately for FBB and FMM PET and applied to FBB and FMM SUVR.
To determine the participants’ CL cutoff-based Aβ positivity, we applied the optimal cutoff value derived using a k-means cluster analysis in 527 independent samples of participants with normal cognition. The cutoff value was set at 27.08, representing the 95th percentile of the lower cluster (Villeneuve et al., 2015), and the whole cerebellum was used as a reference region (Kim et al., 2021).
Body mass index acquisition
For each participant, BMI data were obtained by backtracking their weight and height records in clinical data warehouse of SMC, which were measured at all visits within 3 years after inspecting Aβ PET until March 2000 (Supplementary Figure 2). We excluded 511 participants who did not have at least three BMI measurements. A total of 1,035 non-demented participants (409 with normal cognition and 626 with MCI) were included in the present study.
Body mass index assessment
Baseline BMIs was defined as the farthest past measurement from the Aβ PET scan (Supplementary Figure 3). Participants were then categorized into three subgroups according to their baseline BMI values based on the World Health Organization’s recommendations for Asian populations: underweight (BMI < 18.5 kg/m2), normal weight (18.5–24.9 kg/m2), obesity (BMI ≥ 25 kg/m2) (WHO Expert Consultation, 2004).
Follow-up BMI was defined as the closest measurement to the Aβ PET scan (Supplementary Figure 3). We calculated BMI change as the change rate by taking the difference between baseline and follow-up BMIs and dividing it by duration. Using the 1st and 3rd quantiles (Q1 and Q3) of BMI changes, we characterized participants as increased (≥Q3), stable, and decreased (≤Q1).
Bb: baseline BMI, Bf: follow-up BMI, Duration: period between Bb and Bf
BMI values at three or more time points were used to obtain BMI variability (Supplementary Figure 3). Six measures of variability were considered: standard deviation (SD), coefficient of variation (CV), variability independent of the mean (VIM), residual standard deviation (RSD), average real variability (ARV), and successive variability (SV). These variability measures have different characteristics, and their formulae are shown in Supplementary Table 1. While SD was known to suffer from the bias due to the correlation with the mean value, CV and VIM were developed to avoid this bias. RSD was designed to take the time effect into account when assessing variability among longitudinal measurements. ARV and SV were calculated based on the differences between the consecutive measurements. BMI variability values were obtained based on each of six variability measures. While we used VIM-based variability for the primary association analysis, we considered all six measures to identify underlying patterns in longitudinal BMI values via the cluster analysis. In the association analysis, participants were classified into subgroups with non-high variability versus with high variability according to the upper 15-percentile of BMI variability values as a threshold.
Statistical analyses
We used independent t-tests and chi-square tests to compare the demographic and clinical characteristics of Aβ+ and Aβ− groups. To investigate the association between BMI change and variability with Aβ deposition, we performed multivariable logistic regression using BMI change and variability as predictors after controlling for age, sex, APOE e4 genotype, years of education, hypertension, diabetes, and baseline BMI. To further validate the association between BMI change and variability with Aβ deposition, we performed multivariable logistic regression using CL cutoff-based Aβ positivity as an outcome rather than visually rated Aβ positivity.
Further distinctive underlying patterns in longitudinal BMI values were recognized by employing clustering algorithms including Gaussian mixture model (GMM), k-means clustering, and self-organizing map (Bilmes, 1998; Yang et al., 2012). First, we examined the correlations among BMI features, such as baseline BMI, BMI change and six BMI variability measures, to select features that would play complementary roles in clustering (Supplementary Figure 4). Second, the similarity between participants was assessed via the Euclidean distance after each selected feature was scaled through standardization. Finally, we used GMM to identify clusters, each of which consisted of participants with similar BMI patterns, because it can be used when more fine-grained workload characterization and analysis are required (Patel and Kushwaha, 2020). The optimal number of clusters was determined by validating clustering results with clinical interpretability as well as the silhouette index, Akaike information criterion (AIC) and Bayesian information criterion (BIC) measures. The identified clusters were further validated by examining the consistency with clustering results from the other algorithms. To investigate the association between the identified clusters (called as BMI subgroups) and Aβ deposition, we used multivariable logistic regression after controlling for age, sex, APOE e4 genotype, years of education, hypertension, and diabetes.
All reported p-values were two-sided, and the significance level was set at 0.05. All analyses were performed using SPSS version 25.0 and R version 4.3.0 (Institute for Statistics and Mathematics, Vienna, Austria1).
Data availability
Anonymized data for our analyses presented in the present report are available upon request from the corresponding authors.
Results
Clinical characteristics of participants
Among the 1,035 participants, 579 individuals were Aβ− and 456 were Aβ+ (Table 1). Participants who were Aβ+ were more likely to be older (age, 70.6 ± 7.4 years) than those who were Aβ− (age, 68.5 ± 8.6 years, p < 0.001). Participants who were Aβ+ had a higher frequency of APOE e4 genotype (62.7% vs. 48.5%, p < 0.001) but a lower frequency of hypertension (39.0% vs. 48.5%, p = 0.003) and diabetes (13.2% vs. 24.4%, p < 0.001) than those who were Aβ−.
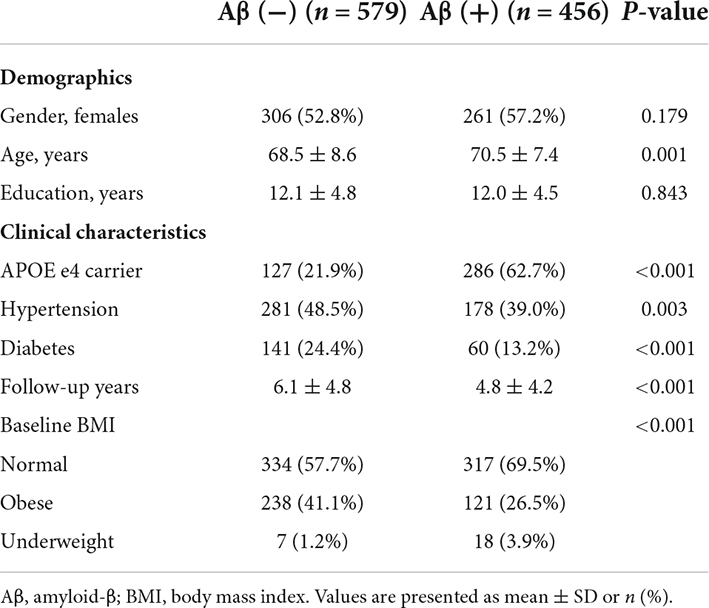
Table 1. Demographic and clinical characteristics of study participants.
Association of amyloid-β positivity with body mass index change and variability
Decreased BMI (odds ratio [OR] = 1.68, 95% confidence interval [CI] 1.16–2.42) was associated with a greater risk of Aβ positivity after controlling for age, sex, APOE e4 genotype, years of education, hypertension, diabetes, baseline BMI, and BMI variability (Table 2). Increased BMI (OR = 1.60, 95% CI 1.11–2.32) was also associated with a greater risk of Aβ positivity (Table 2).
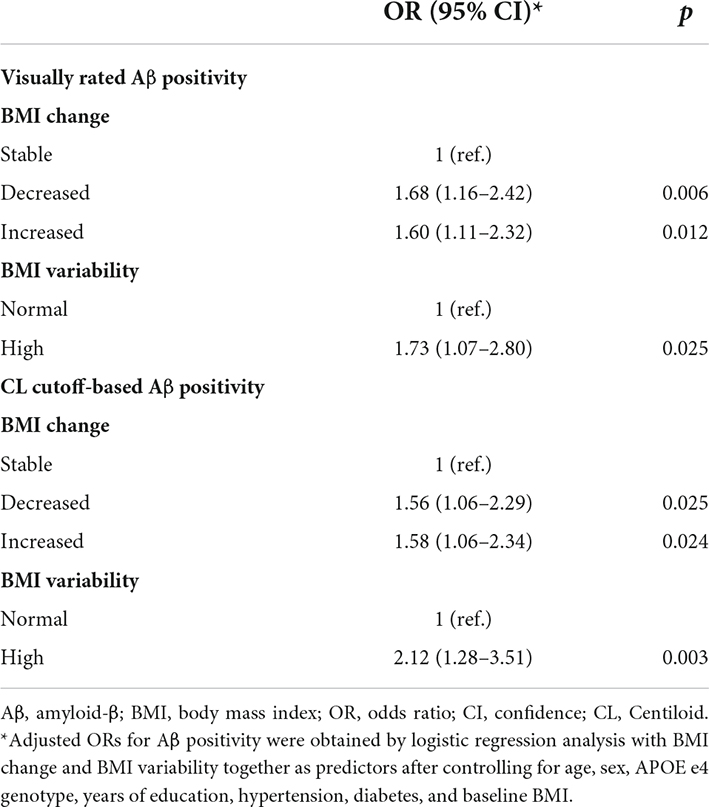
Table 2. Association of Aβ positivity with BMI change and variability.
A greater BMI variability (OR = 1.73, 95% CI 1.07–2.80) was associated with a greater risk of Aβ positivity after controlling for age, sex, APOE e4 genotype, years of education, hypertension, diabetes, baseline BMI, and BMI change (Table 2).
Body mass index subgroups using Gaussian mixture model cluster analysis
Based on BMI baseline, change, and variability measures, four subgroups were created by GMM and validated with the Silhouette index, AIC and BIC (Supplementary Figure 5). The BMI characteristics for each subgroup were summarized in Supplementary Table 2. While the BMI baselines were very similar across all subgroups, BMI change and variability measures were different between subgroups. Because the mean change and variability measures were relatively small in subgroup 1 compared to other subgroups, we characterized subgroup 1 as the stable subgroup. Likewise, subgroups 2, 3, and 4 were characterized, respectively, as the subgroup having stable change with some variability; the subgroup having slightly increased BMI with some variability; the subgroup having decreased BMI with more variability. Longitudinal BMI patterns of representative patients in each subgroup are shown in Figure 1.
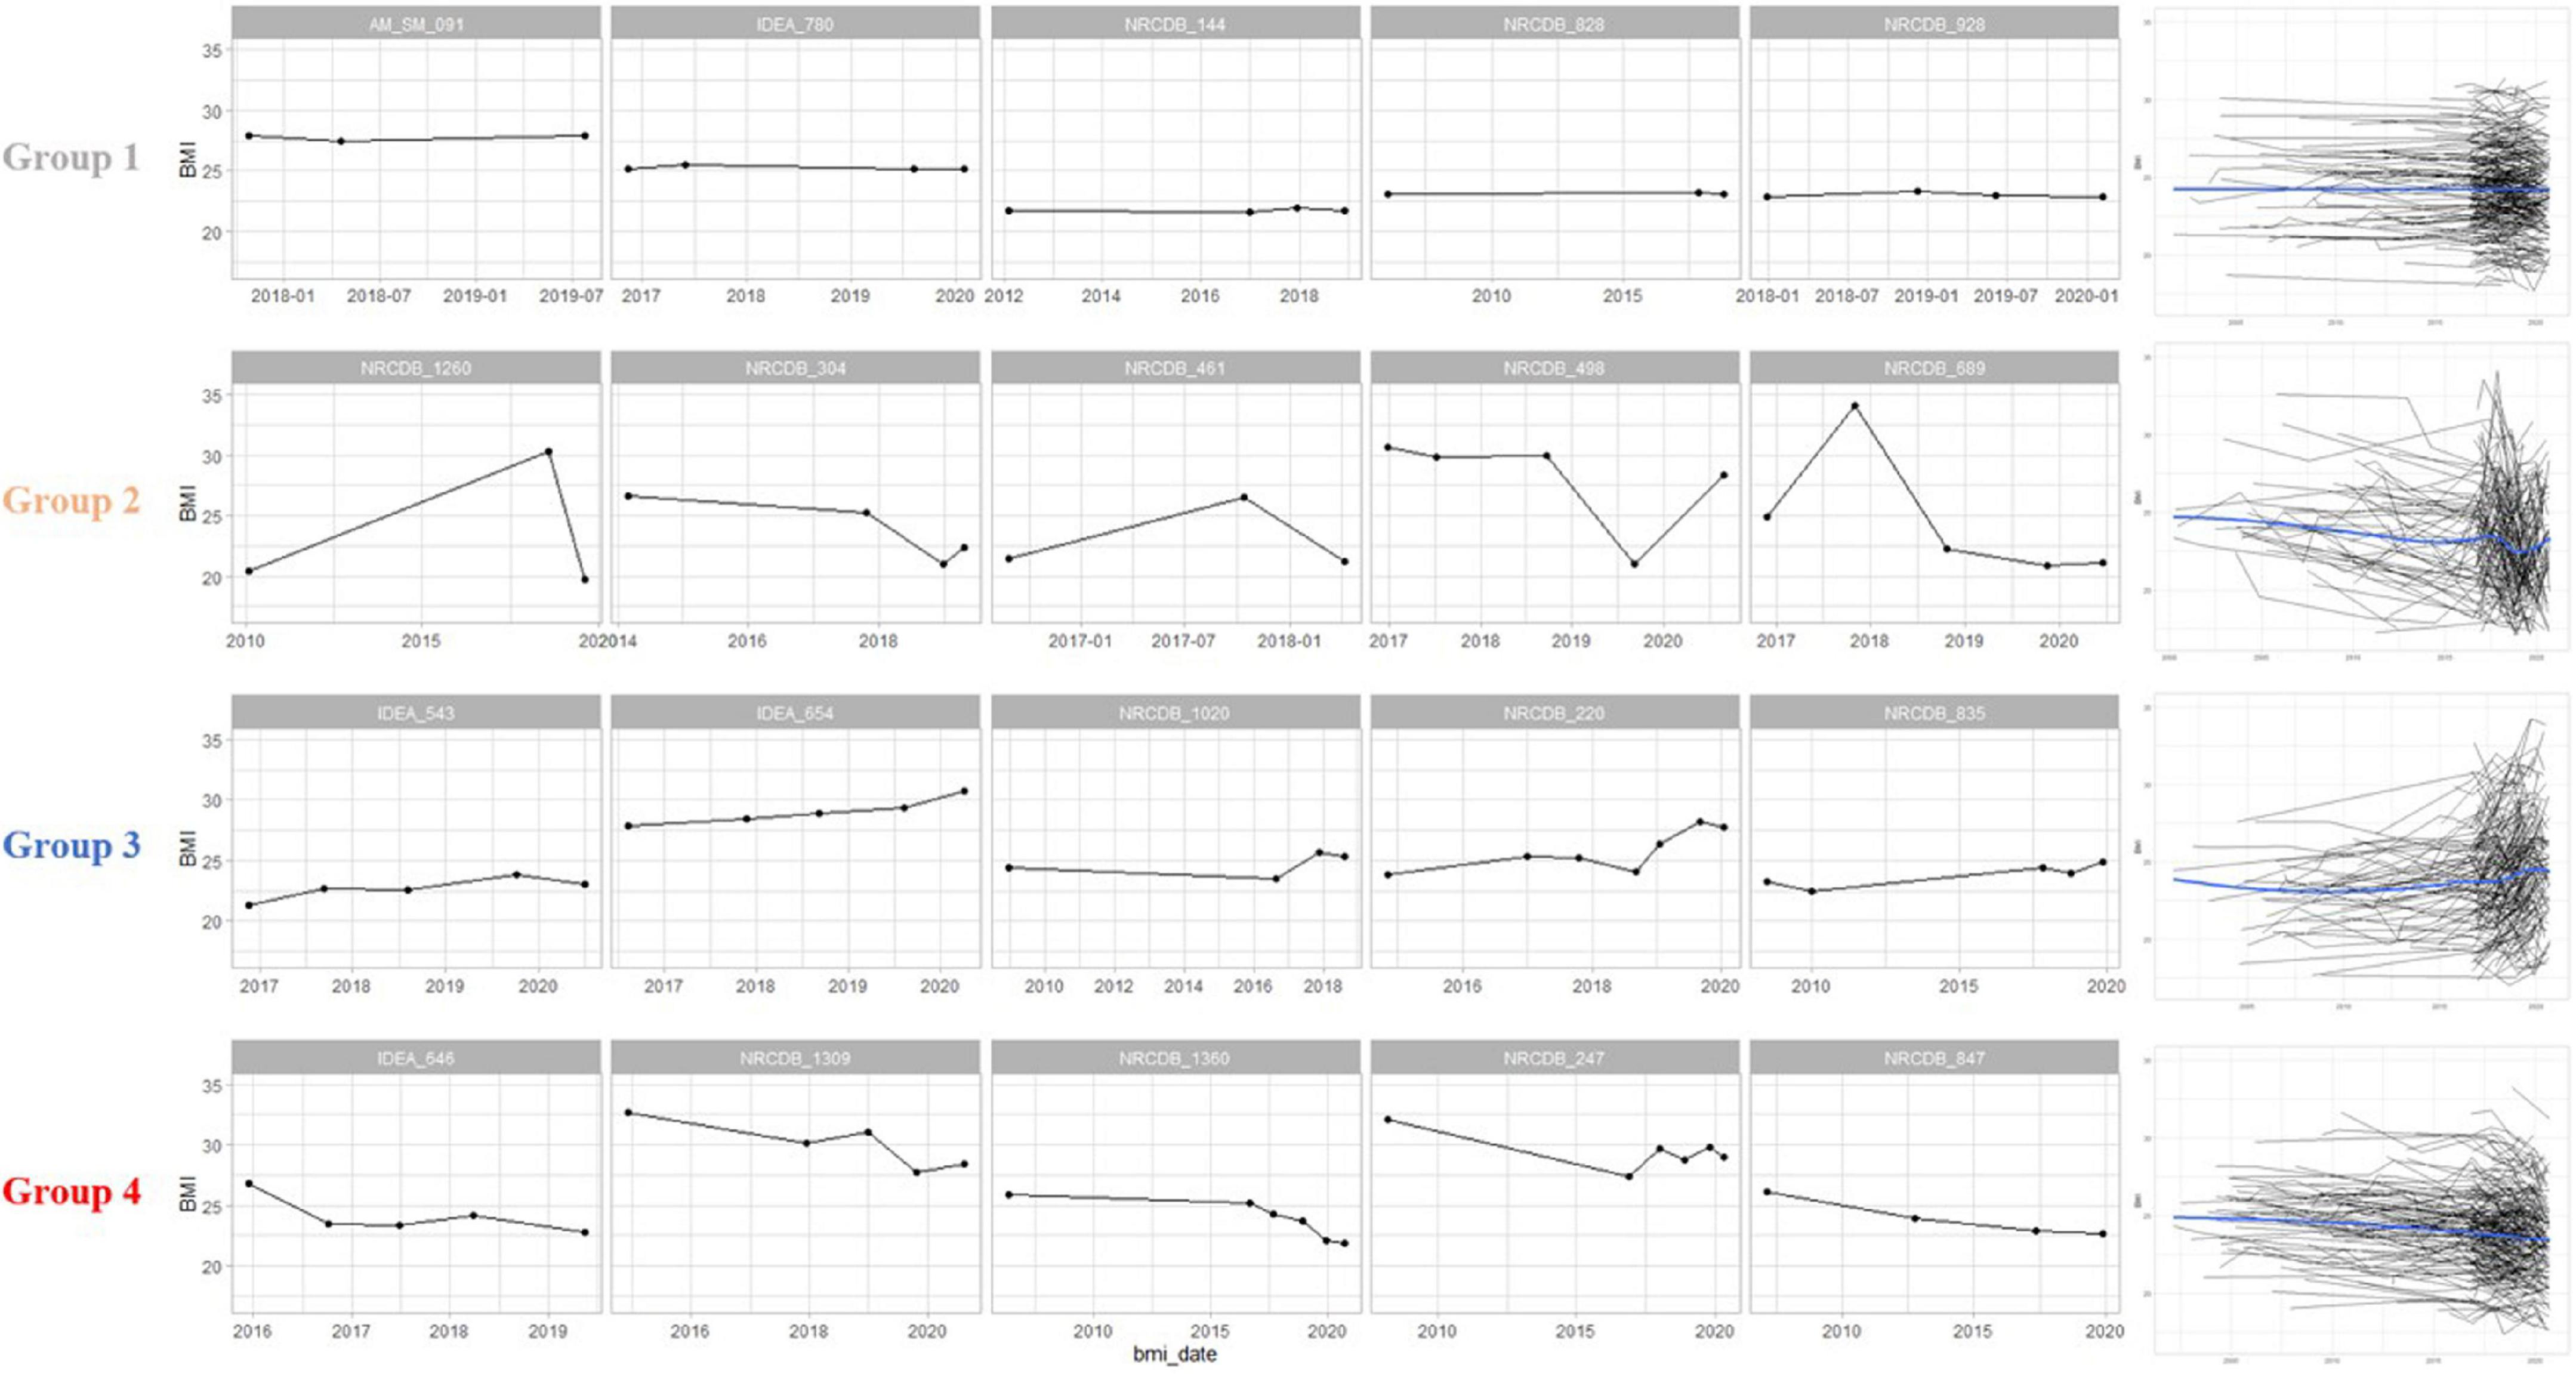
Figure 1. Body mass index (BMI) patterns of representative participants in each group. Group 1 had a constant pattern of both BMI change and variability. Group 2 showed a constant BMI change and some variability. Group 3 was a cluster with increasing BMI changes and high variability. Group 4 was a cluster with a decreasing BMI changes and high variability. The graphs on the right are spaghetti plots representing the BMI pattern of all patients in each group, and a blue line representing the trend of the group. BMI, body mass index.
Compared to the stable subgroup 1, the subgroups showing greater BMI variability had a greater risk of Aβ positivity, especially when BMI was decreasing: subgroup 2 (OR = 1.49, 95% CI 1.05–2.13), subgroup 3 (OR = 1.49, 95% CI 1.01–2.20), and subgroup 4 (OR = 2.39, 95% CI 1.37–4.16) (Table 3).
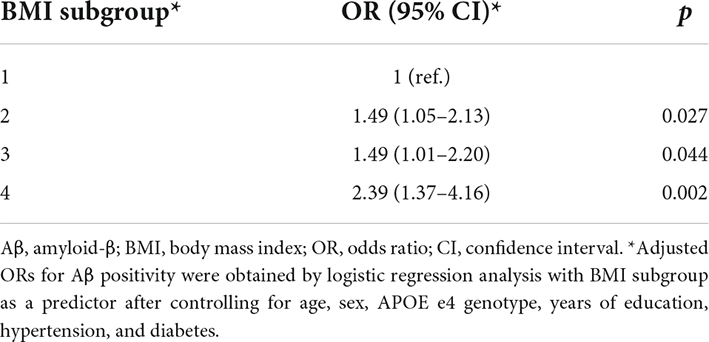
Table 3. Association of Aβ positivity with BMI subgroup.
Association of Centiloid cutoff-based amyloid-β positivity with body mass index change and variability
For CL cutoff-based Aβ positivity, decreased BMI (OR = 1.56, 95% CI 1.06–2.29) was associated with a greater risk of Aβ positivity after controlling for age, sex, APOE e4 genotype, years of education, hypertension, diabetes, baseline BMI, and BMI variability (Table 2). Increased BMI (OR = 1.58, 95% CI 1.06–2.34) was also associated with a greater risk of Aβ positivity (Table 2). Higher BMI variability (OR = 2.12, 95% CI 1.28–3.51) was associated with a greater risk of Aβ positivity after controlling for age, sex, APOE e4 genotype, years of education, hypertension, diabetes, baseline BMI, and BMI change (Table 2).
Discussion
We systematically investigated the association of Aβ positivity with BMI change and variability in a relatively large group of participants who did not have dementia. In the present study, we found that BMI change (increased or decreased) was associated with a greater risk of Aβ positivity, regardless of baseline BMI status. Furthermore, we noted that greater variability in BMI predicted a greater risk of Aβ positivity despite baseline BMI status and BMI change. Finally, our cluster analysis identified BMI subgroups with specific patterns of BMI change and variability, which eventually showed a greater risk of Aβ positivity. Taken together, our findings suggest that participants with BMI change, especially those with greater BMI variability, are more vulnerable to Aβ deposition regardless of baseline BMI. Furthermore, given the paucity of modifiable risk factors for the development of Aβ, our results may contribute to the design of strategies to prevent Aβ deposition with respect to weight control.
Our major finding was that BMI change (increased or decreased) was associated with a greater risk of Aβ positivity, regardless of baseline BMI status. Considering that Aβ deposition is associated with the development of dementia, our findings are supported by previous epidemiologic studies (Ye et al., 2016; Giudici et al., 2019). Specifically, a previous study suggested that patients with MCI who had larger BMI changes are more likely to convert to probable AD dementia regardless of baseline BMI status (Ye et al., 2016). In another study, cognitively unimpaired individuals with decreased BMI were also reported to be at an increased risk of cognitive decline over a 5-year follow-up (Giudici et al., 2019). Furthermore, in agreement with our finding, recent study identified that decreased BMI or unstable BMI was associated with Aβ positivity in non-demented individuals (Buchman et al., 2021; Lane et al., 2021). Altogether, there is no exact pathobiology to explain these associations. However, as the elderly age, there is a loss of muscle mass and gain in visceral fat (Al-Sofiani et al., 2019). Therefore, it is reasonable to expect that participants with decreased BMI and increased BMI might reflect decreased muscle mass and increased visceral fat, respectively. In fact, some studies have investigated the relationship between the progression of sarcopenia and Aβ deposition (Maltais et al., 2019). Aβ deposition was found to be associated with sarcopenia, which might be mediated by an increased systemic inflammatory reaction (Yaffe et al., 2004; Maltais et al., 2019). Alternatively, decreased BMI might be an early reflective symptom of Aβ pathology (Grundman et al., 1996). In fact, a recent study revealed that the Aβ burden was associated with a prospective BMI decline in individuals with normal cognition (Rabin et al., 2020). On the other hand, regarding increased BMI, increased visceral fat deposition might affect brain atrophy and Aβ deposition (Kim H. J. et al., 2015) through several potential mechanisms, including increased insulin resistance (Jack et al., 2013; Luchsinger et al., 2013), lower levels of adipose-derived hormones (Montague et al., 1998), and a larger pattern of proatherogenic gene expression (Yao et al., 2012). Further studies are needed to examine the independent effects of specific body composition on Aβ deposition.
Another major novel finding was that greater BMI variability was associated with a greater risk of Aβ positivity, regardless of baseline BMI status and BMI changes. For example, even if the BMI measured 5 years ago and the current BMI are at the same level, there is a higher possibility of Aβ deposition if there is a high variation in BMI within the 5 years. We reviewed the literature regarding between BMI and AD related outcome (Supplementary Table 3). To the best of our knowledge, the association between BMI variability and Aβ positivity has not been thoroughly investigated. These findings offer new insight into an important role of BMI change and variability in non-demented individuals, and evidence that unstable and higher variability in BMI may be early manifestation related to Aβ deposition before developing dementia. The exact pathobiology of why greater BMI variation is detrimental to Aβ deposition remains unclear. However, there has been growing evidence that greater BMI variation is closely associated with a new onset of diabetes, cardiovascular disease, atrial fibrillation, and higher mortality (Bangalore et al., 2017; Lim et al., 2019; Sponholtz et al., 2019). One possible mechanism of these findings might be gene alternation. Specifically, the anti-aging gene Sirtuin 1 repression is associated with the onset of diabetes, cardiovascular disease and sarcopenia (Martins, 2016, 2017, 2018), which in turn leads to BMI variation, eventually resulting in Aβ deposition. Another possible explanation is that these medical diseases might result in both greater BMI variation and Aβ positivity, although we excluded participants with severe medical diseases using Christensen’s criteria (Christensen et al., 1991). Alternatively, regarding the greater BMI variability without medical diseases, even though there is a repeated occurrence and recovery of sarcopenia and visceral obesity, the accumulation of the remaining detrimental effects might affect Aβ deposition through the possible mechanisms mentioned in the previous paragraph.
Finally, our cluster analysis identified BMI subgroups with specific patterns of BMI change and variability, which eventually showed a greater risk of Aβ positivity. Specifically, a subgroup with decreased BMI and a greater variability in BMI was predictive of a higher risk of Aβ positivity. This was again replicated in cluster analyses with various BMI measures and Aβ positivity, a prior finding suggestive of the importance of decreased BMI with greater variability in Aβ positivity.
The strength of this study is that we investigated the associations between Aβ positivity and BMI changes and BMI variability in a large cohort. However, our study has several limitations that need to be addressed. First, due to the inherent challenges of a retrospective cohort study, we did not provide information about the participants’ amyloid status at baseline. Thus, we were not able to show their causal relationships. However, a retrospective cohort study was considered a realistic alternative given that the change in amyloid appears very slowly and the cost of amyloid PET is very expensive. Second, because we used the Asia-Pacific BMI criteria for participants who are obese and underweight, caution should be taken when generalizing our findings to other races. Third, BMI values were collected from March 2020 until 3 years after the Aβ PET scan, and several BMI values were recorded at 3 years after the Aβ PET scan. This limitation might be mitigated to a certain extent with the existing findings that the annual rate of increasing Aβ deposition is very low (Ossenkoppele et al., 2012; Kemppainen et al., 2014; Kim et al., 2016). Fourth, we did not assess the body composition that might explain the associations we reported, such as muscle mass and fat mass. Fifth, we lacked information on whether the BMI change and fluctuations were intentional or unintentional, although these factors may have different effects on Aβ deposition. Sixth, we could not consider the alterations of dietary habit, although these factors might be associated with BMI change and Aβ positivity. Finally, because BMI data were retrospectively derived from the clinical data warehouse, there were differences in the duration of follow-up among participants despite controlling for the duration of follow-up in the process of calculating BMI changes. Instead, the results of the study with data from the clinical data warehouse could reflect the clinical situation in real-world settings, which were considered as real-world evidence for healthcare decisions.
Conclusion
We provide a comprehensive understanding of the marked influences of BMI change and variability on the risk of Aβ positivity in non-demented individuals. Furthermore, our findings suggest that rigorous strategies for weight maintenance are required to prevent Aβ deposition in non-demented individuals.
Data availability statement
The raw data supporting the conclusions of this article will be made available by the authors, without undue reservation.
Ethics statement
The studies involving human participants were reviewed and approved by the Institutional Review Board of the Samsung Medical Center. Written informed consent was obtained from all participants. The patients/participants provided their written informed consent to participate in this study.
Author contributions
SHK: writing – original draft, review and editing, formal analysis, and data curation. JHK: writing – review and editing, formal analysis, and data curation. YC: conceptualization. BKC, YSC, HJ, HJK, S-BK, and DLN: data curation. KK: methodology, formal analysis, writing – review and editing, and conceptualization. SWS: methodology, writing – review and editing, and conceptualization. All authors contributed to the article and approved the submitted version.
Funding
This research was supported by a grant of the Korean Health Technology R&D Project, Ministry of Health and Welfare, South Korea (HI19C1132); a grant of the Korea Health Technology R&D Project through the Korea Health Industry Development Institute (KHIDI), funded by the Ministry of Health and Welfare and Ministry of science and ICT, Republic of Korea (grant numbers: HU20C0111 and HU22C0170); the National Research Foundation of Korea (NRF) grant funded by the Korea government (MSIT) (NRF-2019R1A5A2027340); Institute of Information and communications Technology Planning and Evaluation (IITP) grant funded by the Korea government (MSIT) (No. 2021-0-02068, Artificial Intelligence Innovation Hub); Future Medicine 20*30 Project of the Samsung Medical Center (#SMX1220021); the “National Institute of Health” research project (2021-ER1002-01 and 2021-ER1006-01); Korea University Guro Hospital (KOREA RESEARCH-DRIVEN HOSPITAL) and grant funded by Korea University Medicine (K2210201); and Basic Science Research Program through the National Research Foundation of Korea (NRF) funded by the Ministry of Education (grant number: 2022R1I1A1A01056956).
Conflict of interest
The authors declare that the research was conducted in the absence of any commercial or financial relationships that could be construed as a potential conflict of interest.
Publisher’s note
All claims expressed in this article are solely those of the authors and do not necessarily represent those of their affiliated organizations, or those of the publisher, the editors and the reviewers. Any product that may be evaluated in this article, or claim that may be made by its manufacturer, is not guaranteed or endorsed by the publisher.
Supplementary material
The Supplementary Material for this article can be found online at: https://www.frontiersin.org/articles/10.3389/fnagi.2022.924550/full#supplementary-material
Footnotes
References
Al-Sofiani, M. E., Ganji, S. S., and Kalyani, R. R. (2019). Body composition changes in diabetes and aging. J. Diabetes Complications 33, 451–459. doi: 10.1016/j.jdiacomp.2019.03.007
Bangalore, S., Fayyad, R., Laskey, R., DeMicco, D. A., Messerli, F. H., and Waters, D. D. (2017). Body-weight fluctuations and outcomes in coronary disease. N. Engl. J. Med. 376, 1332–1340. doi: 10.1056/NEJMoa1606148
Bell, S. P., Liu, D., Samuels, L. R., Shah, A. S., Gifford, K. A., Hohman, T. J., et al. (2017). Late-life body mass index, rapid weight loss, apolipoprotein e ε4 and the risk of cognitive decline and incident dementia. J. Nutr. Health Aging 21, 1259–1267. doi: 10.1007/s12603-017-0906-3
Bilmes, J. (1998). A Gentle Tutorial of the EM Algorithm and its Application to Parameter Estimation for Gaussian Mixture and Hidden Markov Models.
Buchman, A. S., Capuano, A. W., VanderHorst, V., Wilson, R. S., Oveisgharan, S., Schneider, J. A., et al. (2021). Brain β-amyloid links the association of change in BMI with cognitive decline in community-dwelling older adults. J. Gerontol. A Biol. Sci. Med. Sci. Online ahead of print. doi: 10.1093/gerona/glab320
Cho, S. H., Choe, Y. S., Kim, H. J., Jang, H., Kim, Y., Kim, S. E., et al. (2020). A new Centiloid method for (18)F-florbetaben and (18)F-flutemetamol PET without conversion to PiB. Eur. J. Nucl. Med. Mol. Imaging 47, 1938–1948. doi: 10.1007/s00259-019-04596-x
Christensen, K. J., Multhaup, K. S., Nordstrom, S., and Voss, K. (1991). A cognitive battery for dementia: development and measurement characteristics. Psychol. Assessment J. Consulting Clin. Psychol. 3, 168–174. doi: 10.1037/1040-3590.3.2.168
Ewers, M., Schmitz, S., Hansson, O., Walsh, C., Fitzpatrick, A., Bennett, D., et al. (2012). Body mass index is associated with biological CSF markers of core brain pathology of Alzheimer’s disease. Neurobiol. Aging 33, 1599–1608. doi: 10.1016/j.neurobiolaging.2011.05.005
Fitzpatrick, A. L., Kuller, L. H., Lopez, O. L., Diehr, P., O’Meara, E. S., Longstreth, W. T., et al. (2009). Midlife and late-life obesity and the risk of dementia: cardiovascular health study. Arch. Neurol. 66, 336–342. doi: 10.1001/archneurol.2008.582
Giudici, K. V., Guyonnet, S., Rolland, Y., Vellas, B., de Souto Barreto, P., and Nourhashemi, F. (2019). Body weight variation patterns as predictors of cognitive decline over a 5 year follow-up among community-dwelling elderly (MAPT Study). Nutrients 11:1371. doi: 10.3390/nu11061371
Gottesman, R. F., Schneider, A. L., Zhou, Y., Coresh, J., Green, E., Gupta, N., et al. (2017). Association between midlife vascular risk factors and estimated brain amyloid deposition. JAMA 317, 1443–1450. doi: 10.1001/jama.2017.3090
Grundman, M., Corey-Bloom, J., Jernigan, T., Archibald, S., and Thal, L. J. (1996). Low body weight in Alzheimer’s disease is associated with mesial temporal cortex atrophy. Neurology 46, 1585–1591. doi: 10.1212/wnl.46.6.1585
Hsu, D. C., Mormino, E. C., Schultz, A. P., Amariglio, R. E., Donovan, N. J., Rentz, D. M., et al. (2016). Lower late-life body-mass index is associated with higher cortical amyloid burden in clinically normal elderly. J. Alzheimer’s Dis. 53, 1097–1105. doi: 10.3233/JAD-150987
Jack, C. R., Knopman, D. S., Jagust, W. J., Petersen, R. C., Weiner, M. W., Aisen, P. S., et al. (2013). Tracking pathophysiological processes in Alzheimer’s disease: an updated hypothetical model of dynamic biomarkers. Lancet Neurol. 12, 207–216. doi: 10.1016/S1474-4422(12)70291-0
Jeong, H. J., Lee, H., Lee, S.-Y., Seo, S., Park, K. H., Lee, Y.-B., et al. (2020). [18F]THK5351 PET imaging in patients with mild cognitive impairment. J. Clin. Neurol. 16, 202–214. doi: 10.3988/jcn.2020.16.2.202
Kang, S. H., Park, Y. H., Lee, D., Kim, J. P., Chin, J., Ahn, Y., et al. (2019). The cortical neuroanatomy related to specific neuropsychological deficits in alzheimer’s continuum. Dement. Neurocogn. Disord. 18, 77–95. doi: 10.12779/dnd.2019.18.3.77
Kang, S. H., Kim, M. E., Jang, H., Kwon, H., Lee, H., Kim, H. J., et al. (2021). Amyloid positivity in the Alzheimer/subcortical-vascular spectrum. Neurology 96, e2201–e2211. doi: 10.1212/WNL.0000000000011833
Kemppainen, N. M., Scheinin, N. M., Koivunen, J., Johansson, J., Toivonen, J. T., Någren, K., et al. (2014). Five-year follow-up of 11C-PIB uptake in Alzheimer’s disease and MCI. Eur. J. Nuclear Med. Mol. Imaging 41, 283–289. doi: 10.1007/s00259-013-2562-0
Kim, H., Kim, C., Seo, S. W., Na, D. L., Kim, H. J., Kang, M., et al. (2015). Association between body mass index and cortical thickness: among elderly cognitively normal men and women. Int. Psychogeriatrics 27, 121–130. doi: 10.1017/S1041610214001744
Kim, H. J., Kim, C., Jeon, S., Kang, M., Kim, Y. J., Lee, J. M., et al. (2015). Association of body fat percentage and waist-hip ratio with brain cortical thickness: a study among 1777 cognitively normal subjects. Alzheimer Dis. Assoc. Disorders 29, 279–286. doi: 10.1097/WAD.0000000000000079
Kim, H. J., Yang, J. J., Kwon, H., Kim, C., Lee, J. M., Chun, P., et al. (2016). Relative impact of amyloid-β, lacunes, and downstream imaging markers on cognitive trajectories. Brain J. Neurol. 139, 2516–2527. doi: 10.1093/brain/aww148
Kim, H. R., Choe, Y. S., Moon, S. H., Kim, H. J., Jang, H. L., Na, D., et al. (2021). Finding the optimal cutoff value for amyloid β positivity using the iterative outlier method and concordance rate. Precis. Future Med. 5, 83–89. doi: 10.23838/pfm.2021.00023
Kim, S. E., Lee, J. S., Woo, S., Kim, S., Kim, H. J., Park, S., et al. (2019). Sex-specific relationship of cardiometabolic syndrome with lower cortical thickness. Neurology 93, e1045–e1057. doi: 10.1212/WNL.0000000000008084
Kivipelto, M., Ngandu, T., Fratiglioni, L., Viitanen, M., Kåreholt, I., Winblad, B., et al. (2005). Obesity and vascular risk factors at midlife and the risk of dementia and Alzheimer disease. Arch. Neurol. 62, 1556–1560. doi: 10.1001/archneur.62.10.1556
Klunk, W. E., Koeppe, R. A., Price, J. C., Benzinger, T. L., Devous, M. D. Sr., Jagust, W. J., et al. (2015). The Centiloid Project: standardizing quantitative amyloid plaque estimation by PET. Alzheimers Dement. 11, 1–15.e4. doi: 10.1016/j.jalz.2014.07.003
Lane, C. A., Barnes, J., Nicholas, J. M., Baker, J. W., Sudre, C. H., Cash, D. M., et al. (2021). Investigating the relationship between BMI across adulthood and late life brain pathologies. Alzheimer’s Res. Therapy 13:91. doi: 10.1186/s13195-021-00830-7
Lee, S. H., Byun, M. S., Lee, J. H., Yi, D., Sohn, B. K., Lee, J. Y., et al. (2020). Sex-specific association of lifetime body mass index with Alzheimer’s disease neuroimaging biomarkers. J. Alzheimer’s Dis. 75, 767–777.
Lim, Y. M., Yang, P. S., Jang, E., Yu, H. T., Kim, T. H., Uhm, J. S., et al. (2019). Body mass index variability and long-term risk of new-onset atrial fibrillation in the general population: a Korean nationwide cohort study. Mayo Clin. Proc. 94, 225–235. doi: 10.1016/j.mayocp.2018.10.019
Luchsinger, J. A., Biggs, M. L., Kizer, J. R., Barzilay, J., Fitzpatrick, A., Newman, A., et al. (2013). Adiposity and cognitive decline in the cardiovascular health study. Neuroepidemiology 40, 274–281. doi: 10.1159/000345136
Maltais, M., De Souto Barreto, P., Hooper, C., Payoux, P., Rolland, Y., and Vellas, B. (2019). Association between brain β-Amyloid and frailty in older adults. J. Gerontology. Ser. A Biol. Sci. Med. Sci. 74, 1747–1752. doi: 10.1093/gerona/glz009
Martins, I. (2016). Anti-aging genes improve appetite regulation and reverse cell senescence and apoptosis in global populations. Adv. Aging Res. 5, 9–26. doi: 10.4236/aar.2016.51002
Martins, I. (2017). Single gene inactivation with implications to diabetes and multiple organ dysfunction syndrome. J. Clin. Epigenet. 3:24.
Martins, I. (2018). Appetite Regulation and the Peripheral Sink Amyloid Beta Clearance Pathway in Diabetes and Alzheimer’s Disease.
Möllers, T., Stocker, H., Perna, L., Nabers, A., Rujescu, D., Hartmann, A. M., et al. (2021). Aβ misfolding in blood plasma is inversely associated with body mass index even in middle adulthood. Alzheimer’s Res. Therapy 13:145. doi: 10.1186/s13195-021-00889-2
Montague, C. T., Prins, J. B., Sanders, L., Zhang, J., Sewter, C. P., Digby, J., et al. (1998). Depot-related gene expression in human subcutaneous and omental adipocytes. Diabetes 47, 1384–1391.
Ossenkoppele, R., Tolboom, N., Foster-Dingley, J. C., Adriaanse, S. F., Boellaard, R., Yaqub, M., et al. (2012). Longitudinal imaging of Alzheimer pathology using [11C]PIB, [18F]FDDNP and [18F]FDG PET. Eur. J. Nuclear Med. Mol. Imaging 39, 990–1000. doi: 10.1007/s00259-012-2102-3
Patel, E., and Kushwaha, D. S. J. P. C. S. (2020). Clustering cloud workloads: K-means vs gaussian mixture model. Proc. Comput. Sci. 171, 158–167.
Petersen, R. C. (2011). Clinical practice. mild cognitive impairment. N. Engl. J. Med. 364, 2227–2234.
Rabin, J. S., Shirzadi, Z., Swardfager, W., MacIntosh, B. J., Schultz, A., Yang, H. S., et al. (2020). Amyloid-beta burden predicts prospective decline in body mass index in clinically normal adults. Neurobiol. Aging 93, 124–130. doi: 10.1016/j.neurobiolaging.2020.03.002
Rowe, C. C., Bourgeat, P., Ellis, K. A., Brown, B., Lim, Y. Y., Mulligan, R., et al. (2013). Predicting Alzheimer disease with β-amyloid imaging: results from the Australian imaging, biomarkers, and lifestyle study of ageing. Ann. Neurol. 74, 905–913. doi: 10.1002/ana.24040
Sled, J. G., Zijdenbos, A. P., and Evans, A. C. (1998). A nonparametric method for automatic correction of intensity nonuniformity in MRI data. IEEE Trans. Med. Imaging 17, 87–97.
Sponholtz, T. R., van den Heuvel, E. R., Xanthakis, V., and Vasan, R. S. (2019). Association of Variability in body mass index and metabolic health with cardiometabolic disease risk. J. Am. Heart Assoc. 8:e010793.
Thirunavu, V., McCullough, A., Su, Y., Flores, S., Dincer, A., Morris, J. C., et al. (2019). Higher body mass index is associated with lower cortical Amyloid-β burden in cognitively normal individuals in late-life. J. Alzheimer’s Dis. 69, 817–827. doi: 10.3233/JAD-190154
Tolppanen, A. M., Ngandu, T., Kåreholt, I., Laatikainen, T., Rusanen, M., Soininen, H., et al. (2014). Midlife and late-life body mass index and late-life dementia: results from a prospective population-based cohort. J. Alzheimer’s Dis. 38, 201–209.
Vidoni, E. D., Townley, R. A., Honea, R. A., and Burns, J. M. (2011). Alzheimer disease biomarkers are associated with body mass index. Neurology 77, 1913–1920.
Villemagne, V. L., Pike, K. E., Chételat, G., Ellis, K. A., Mulligan, R. S., Bourgeat, P., et al. (2011). Longitudinal assessment of Aβ and cognition in aging and Alzheimer disease. Ann. Neurol. 69, 181–192.
Villeneuve, S., Rabinovici, G. D., Cohn-Sheehy, B. I., Madison, C., Ayakta, N., Ghosh, P. M., et al. (2015). Existing pittsburgh compound-B positron emission tomography thresholds are too high: statistical and pathological evaluation. Brain J. Neurol. 138, 2020–2033. doi: 10.1093/brain/awv112
WHO Expert Consultation (2004). Appropriate bodymass index for Asian populations and its implications for policy and intervention strategies. Lancet 363, 157–163. doi: 10.1016/S0140-6736(03)15268-3
Yaffe, K., Kanaya, A., Lindquist, K., Simonsick, E. M., Harris, T., Shorr, R. I., et al. (2004). The metabolic syndrome, inflammation, and risk of cognitive decline. JAMA 292, 2237–2242.
Yang, M.-S., Lai, C.-Y., and Lin, C.-Y. (2012). A robust EM clustering algorithm for Gaussian mixture models. Pattern Recognition 45, 3950–3961.
Yao, Z., Hu, B., Liang, C., Zhao, L., Jackson, M., and Alzheimer’s Disease, et al. (2012). A longitudinal study of atrophy in amnestic mild cognitive impairment and normal aging revealed by cortical thickness. PLoS One 7:e48973. doi: 10.1371/journal.pone.0048973
Ye, B. S., Jang, E. Y., Kim, S. Y., Kim, E. J., Park, S. A., Lee, Y., et al. (2016). Unstable body mass index and progression to probable Alzheimer’s disease dementia in patients with amnestic mild cognitive impairment. J. Alzheimer’s Dis. 49, 483–491. doi: 10.3233/JAD-150556
Keywords: amyloid-β (Aβ), body mass index (BMI), BMI change, BMI variability, Alzheimer’s disease
Citation: Kang SH, Kim JH, Chang Y, Cheon BK, Choe YS, Jang H, Kim HJ, Koh S-B, Na DL, Kim K and Seo SW (2022) Independent effect of body mass index variation on amyloid-β positivity. Front. Aging Neurosci. 14:924550. doi: 10.3389/fnagi.2022.924550
Received: 20 April 2022; Accepted: 04 July 2022;
Published: 22 July 2022.
Edited by:
Agustin Ibanez, Latin American Brain Health Institute (BrainLat), ChileReviewed by:
Gefei Chen, Karolinska Institutet (KI), SwedenIan James Martins, University of Western Australia, Australia
Copyright © 2022 Kang, Kim, Chang, Cheon, Choe, Jang, Kim, Koh, Na, Kim and Seo. This is an open-access article distributed under the terms of the Creative Commons Attribution License (CC BY). The use, distribution or reproduction in other forums is permitted, provided the original author(s) and the copyright owner(s) are credited and that the original publication in this journal is cited, in accordance with accepted academic practice. No use, distribution or reproduction is permitted which does not comply with these terms.
*Correspondence: Kyunga Kim, kyunga.j.kim@samsung.com; Sang Won Seo, sw72.seo@samsung.com
†These authors have contributed equally to this work