Preservation Analysis on Spatiotemporal Specific Co-expression Networks Suggests the Immunopathogenesis of Alzheimer’s Disease
 Liyuan Guo
 Yushan Liu3†
  Jing Wang
- 1CAS Key Laboratory of Mental Health, Institute of Psychology, Chinese Academy of Sciences, Beijing, China
- 2Department of Psychology, University of Chinese Academy of Sciences, Beijing, China
- 3College of Life Sciences, University of Chinese Academy of Sciences, Beijing, China
The occurrence and development of Alzheimer’s disease (AD) is a continuous clinical and pathophysiological process, molecular biological, and brain functional change often appear before clinical symptoms, but the detailed underlying mechanism is still unclear. The expression profiling of postmortem brain tissue from AD patients and controls provides evidence about AD etiopathogenesis. In the current study, we used published AD expression profiling data to construct spatiotemporal specific coexpression networks in AD and analyzed the network preservation features of each brain region in different disease stages to identify the most dramatically changed coexpression modules and obtained AD-related biological pathways, brain regions and circuits, cell types and key genes based on these modules. As result, we constructed 57 spatiotemporal specific networks (19 brain regions by three disease stages) in AD and observed universal expression changes in all 19 brain regions. The eight most dramatically changed coexpression modules were identified in seven brain regions. Genes in these modules are mostly involved in immune response-related pathways and non-neuron cells, and this supports the immune pathology of AD and suggests the role of blood brain barrier (BBB) injuries. Differentially expressed genes (DEGs) meta-analysis and protein–protein interaction (PPI) network analysis suggested potential key genes involved in AD development that might be therapeutic targets. In conclusion, our systematical network analysis on published AD expression profiling data suggests the immunopathogenesis of AD and identifies key brain regions and genes.
Introduction
As the most common form of dementia, Alzheimer’s disease (AD) is a major public health concern. The occurrence and development of AD is a continuous clinical and pathophysiological process, and the National Institute of Aging and Alzheimer’s Association (NIA-AA) research framework categorizes AD into three continuous stages: preclinical, mild cognitive impairment (MCI), and dementia (Albert et al., 2011; McKhann et al., 2011; Sperling et al., 2011). A large number of studies have pointed out that in AD, changes in molecular biological processes and brain function networks often appear before clinical symptoms, brain metabolic homeostasis, such as nerve growth factor metabolic pathway is impaired before clinical AD; a substantial proportion of nondemented older adults have amyloid-beta accumulation and amyloid plaque; lower functional connectivity was observed before cognitive changes by using resting-state MRI (Price et al., 2009; Sperling et al., 2011; Buckley et al., 2017; Pentz et al., 2020), but the detailed underlying mechanism is still unclear.
Brain transcriptome analysis is considered a powerful method for studying AD mechanisms, and many studies conducted to date have focused on the expression profiling of postmortem brain tissue from AD patients and controls (Blalock et al., 2004; Mirnics et al., 2005; Haroutunian et al., 2009; Kim et al., 2012; Zhang et al., 2013). In addition to finding differentially expressed genes (DEGs) that are significantly changed in AD patients, expression profiling can also provide more evidence about the systematic molecular processes underlying the etio-pathogenesis of AD. Based upon the associations between coexpressed gene modules and AD traits, several previous studies identified AD-related gene modules, which suggests that the biological processes that these genes contribute to may be affected in AD (Wang et al., 2016; Tang and Liu, 2019; Hu et al., 2020; Kelly et al., 2020). By using spatial-temporal expression pattern analysis, transcriptome data can also provide evidence about specific brain regions and cell types that are possibly related to AD (Wang et al., 2016). It has been reported that the spatial-temporal pattern of gene expression in the brain shows strong correspondence with brain function (Richiardi et al., 2015; Anderson et al., 2018), so expression profiling of AD patients may provide more information about brain functional changes during AD development.
In the current study, we used published AD expression profiling data to construct 57 spatiotemporal specific (19 brain regions by three disease stages) coexpression networks in AD. By analysing the network preservation features of each brain region in different disease stages, the most dramatically changed coexpression modules were identified. Based on these modules, AD-related biological pathways, brain regions and circuits, cell types and key genes were analyzed.
Data and Methods
Gene Expression Profiling and Data Normalization
Dataset GSE84422 was downloaded from the National Biotechnology Information Center (NCBI) comprehensive gene expression database.1 This dataset contains the expression data of 1,054 brain tissue samples distributed in 19 brain regions of 125 subjects (Wang et al., 2016). Based on their Clinical Dementia Rate (CDR) score, subjects in GSE84422 were divided into three groups: control group, CDR 0–0.5; mild group, CDR 1–2, severe group, CDR 3–5 (as shown in Table 1). The raw microarray data were preprocessed by using RMA with quantile normalization (Irizarry et al., 2003). According to different platforms, hgu133a.db, hgu133b.db, and hgu133plus2.db are used for ID conversion. The average expression value of the probe set for each gene was used as its expression value.
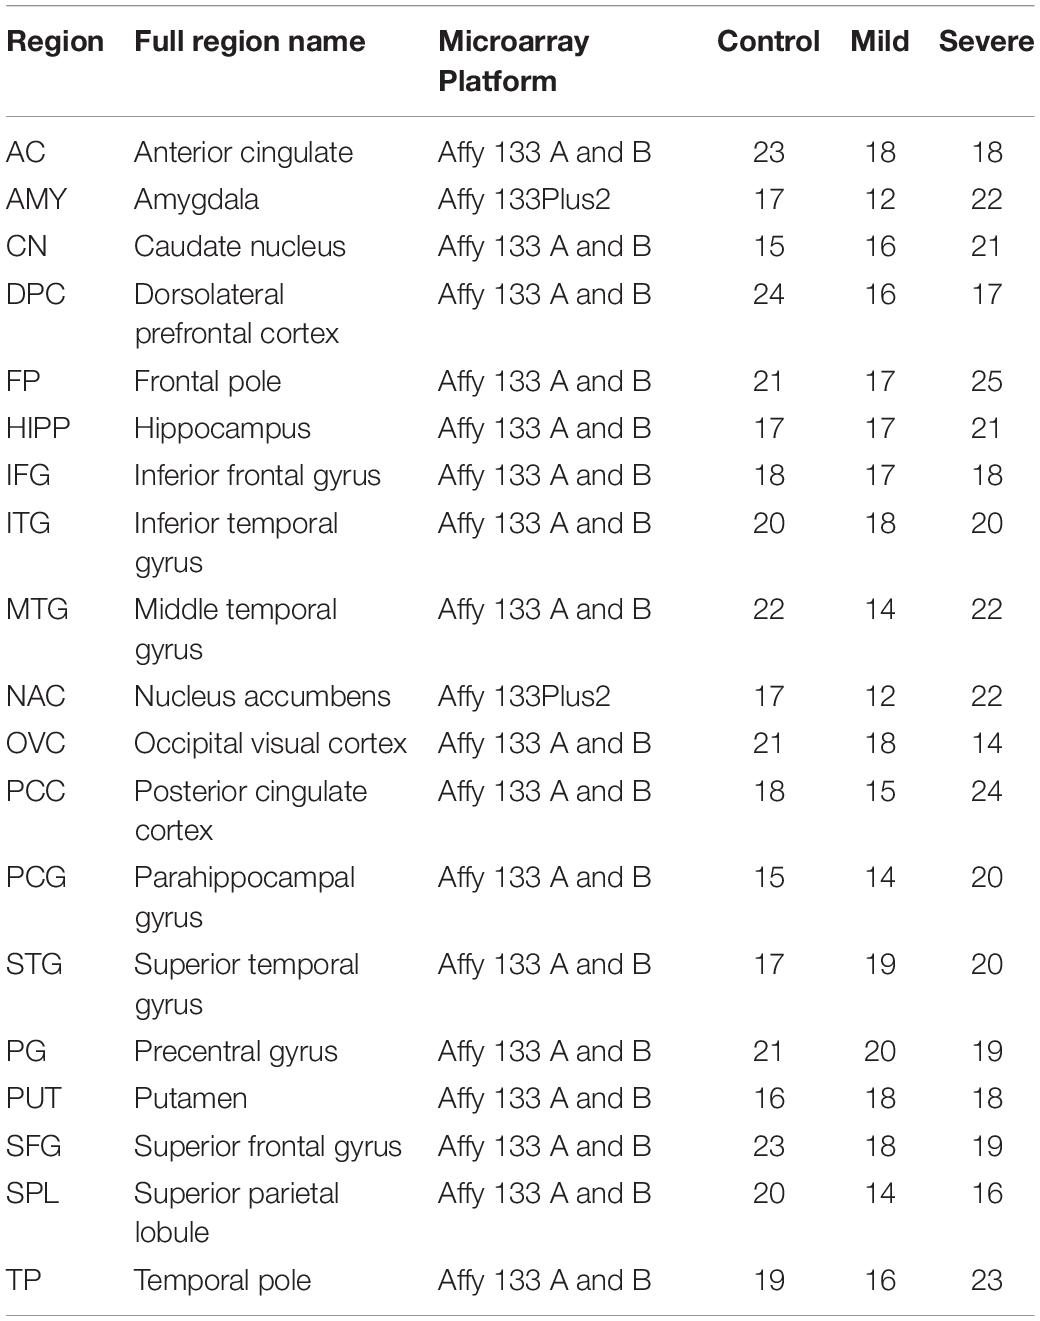
Table 1. Brain regions and disease groups information of samples used in co-expression analysis.
Coexpression Network in Different Brain Regions
Weighted gene coexpression network analysis (WGCNA) was performed on dataset GSE84422 to identify the gene modules with coordinated expression patterns for each brain region in different disease severities (Zhang and Horvath, 2005). After data normalization, the top 25% of the expressed genes in each brain region at each disease stage were taken as input genes, and coexpression networks were constructed using the R package WGCNA (Langfelder and Horvath, 2008). Briefly, Pearson’s correlation coefficients were calculated between all pairs of genes after microarray data normalization. Next, the correlation matrix was converted into an adjacency matrix using a power function f(x) = xβ, where x was the element of the correlation matrix and parameter β was determined such that the resulting adjacency matrix was approximately scale-free (Zhang and Horvath, 2005). The appropriate power value was estimated by a gradient test (power value ranging from 1 to 20) and determined when the scale independence value was equal to 0.85. The adjacency matrix was subsequently transformed into a topological overlap matrix (TOM), which captured both the direct and indirect interactions between each pair of genes (Ravasz et al., 2002). Average linkage hierarchical clustering was then employed to cluster the genes based on the TOM. Finally, a tree cutting algorithm was used to dynamically cut the hierarchical clustering dendrogram branches into highly connected modules, each of which was assigned a distinct colour code.
Module Preservation Analysis
For each brain region, the preservation of coexpression modules across different disease stages was analyzed by using the R package NetRep (Ritchie et al., 2016). Coexpression networks of the control group were used as the discovery dataset, networks of the mild and severe groups were regarded as the tested datasets, and 10,000 permutations were performed. The NetRep statistics module preservation using seven statistical test methods, as recommended by the software, was applied. Modules whose P-value was less than 0.0001 in all seven methods were identified as strong preservation modules; those with P-values less 0.0001 in 1–6 methods were identified as weak preservation methods; and those with P-values not less than 0.0001 in any method were identified as non-preservation modules(NPMs).
Functional Enrichment Analysis
To identify the biological processes in which NPM genes are involved, the Cytoscape plug-in ClueGO genes were used to provide a system-wide view (Bindea et al., 2009). The set including all NPM genes was used as the input gene set, and the ClueGo parameters were set as indicated: GO biological process, cellular component, and molecular function terms; display pathways with P-values ≤0.05; GO tree interval, three min level and eight max level; GO term minimum # genes, 5; threshold of 10% of genes per pathway; and a kappa score of 0.9. Pathway P-values were adjusted with Benjamini-Hochberg to 0.0100. The pathways were then represented, taking advantage of Cytoscape’s complex visualization environment as kappa score-based functional groups and named by the most significant term of each group. For each NPM, a specific pathway cluster enrichment analysis was performed by using the online analysis tool DAVID (Huang da et al., 2009). As recommended in DAVID, the cut-off for pathway cluster enrichment was set at a score > 1.3. The representative biological terms associated with significant clusters were manually selected.
3-D Brain Region Module
3-D modules for brain regions affected by NPMs were formulated by using Mango image processing software (Lancaster, Martinez).2 The labels of brain regions were obtained from the Talairach Atlas3 (Lancaster et al., 2000).
Cell-Type Enrichment Analysis
Cell-type enrichment analyses of NPM genes were performed with the web-based tool Brain Expression Spatio-Temporal pattern (BEST) in http://best.psych.ac.cn (Guo et al., 2019). Cell type-specific expression profiles, which provide specific expression gene sets for astrocytes, endothelial cells, microglia, neurons, and oligodendrocytes, were obtained from http://www.brainrnaseq.org (Zhang et al., 2016). Fisher exact tests (FETs) were performed between each NPM and cell type, and the negative logarithm of the FET P-value was defined as the enrichment score.
Meta-Analysis of DEGs
Gene expression studies of AD that utilized tissue samples from the middle temporal gyrus (MTG) and total temporal cortex (TC) were searched in GEO by keyword searches and manual selection. In total, six datasets were selected for meta-analysis: GSE132903, GSE5281, and GSE84422 for MTG; GSE131617, GSE36980, and GSE118553 for TC. Sample statuses in different studies are heterogeneous, so only data of defined controls and AD patients were used, and data from patients with probable AD and other diseases were excluded. The sample information is summarized in Table 3. Data quality control and meta-analysis were performed with the online tool ImaGEO4 (Toro-Dominguez et al., 2019). The maximum P-value method was selected, allowed missing values (%) was set at 10, and the adjusted P-value threshold was set at 0.05.
Protein–Protein Interaction Analysis
DEGs and NPM genes in MTG were combined in the MTG gene set; DEGs in TC and NPM genes in ITG, MTG, and STG were combined in the TC gene set. The two gene sets were used as input data to perform protein–protein interaction (PPI) analysis in the online PPI network analysis platform STRING (Szklarczyk et al., 2019). The full STRING network was used to generate the MTG and TC networks by adding evidence edges between the input genes, and the minimum required interaction score of edges was 0.4. The generated networks were imported into Cytoscape, and the topological properties of the nodes were calculated using the plug-in “Network Analyzer” (Shannon et al., 2003; Assenov et al., 2008).
Results
57 Coexpression Gene Networks of 19 Brain Regions in Three Different Disease Stages
According to the topological structure of the coexpression network, the differences in networks with different organizations can be compared to analyze the spatial distribution of a disease. Therefore, we divided the gene set selected from 19 brain regions into 57 expression matrices according to the different brain regions and disease degrees, an unbiased gene coexpression network of expression matrices was constructed, and coexpression modules were identified. The selection of the soft threshold and clustering results of each coexpression network can be seen in Supplementary Figure 1. The numbers of coexpression modules in each network are shown in Figure 1.
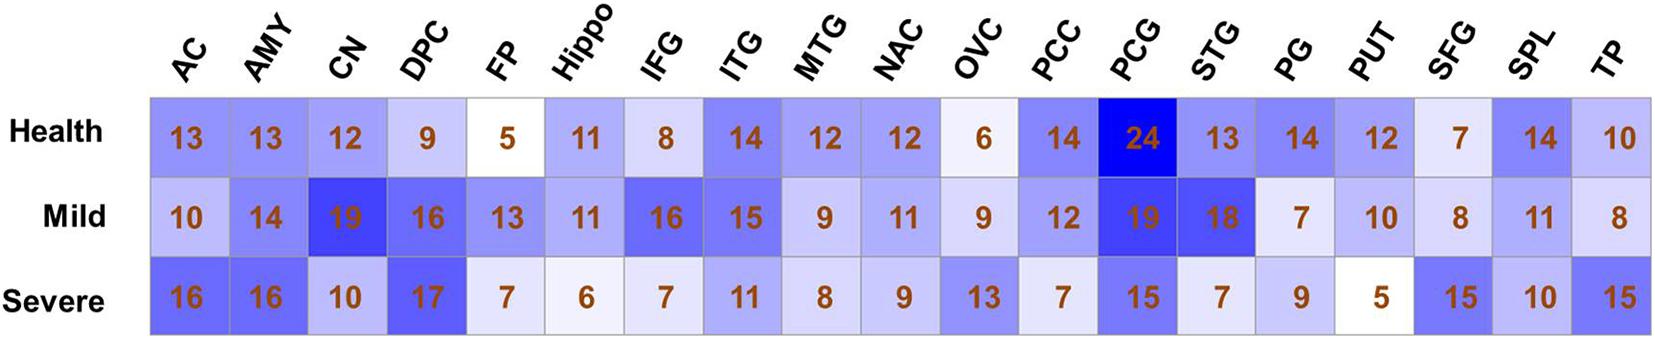
Figure 1. Modules number of co-expression networks in different sample sets. The number of co-expression modules that identified by Weighted gene coexpression network analysis analysis is shown for each sample set.
Evidence of Preservation of the Coexpression Network in 19 Brain Regions
As shown in Figure 2, in the control groups, there were 233 coexpression modules in 19 brain regions; among them, 164 were less preserved in the process of AD, accounting for 73.54% of the total. Furthermore, eight modules in seven brain regions were identified as not preserved. Three modules were non-preserved in mild AD: the 12th in ITG (ITG-12), the 13th in SPL (SPL-13), and the 13th in STG (STG-13). Three modules were not preserved in severe AD: the 11th module in MTG (MTG-11), the 8th module in PUT (PUT-8) and the 9th module in PG (PG-9). Two modules are non-preserved in both mild and severe AD cases: the 12th module of the PUT brain regions (PUT-12) and the 22nd module of the PCG brain regions (PCG-22). Detailed gene lists of each NPM are shown in Supplementary Table 1.
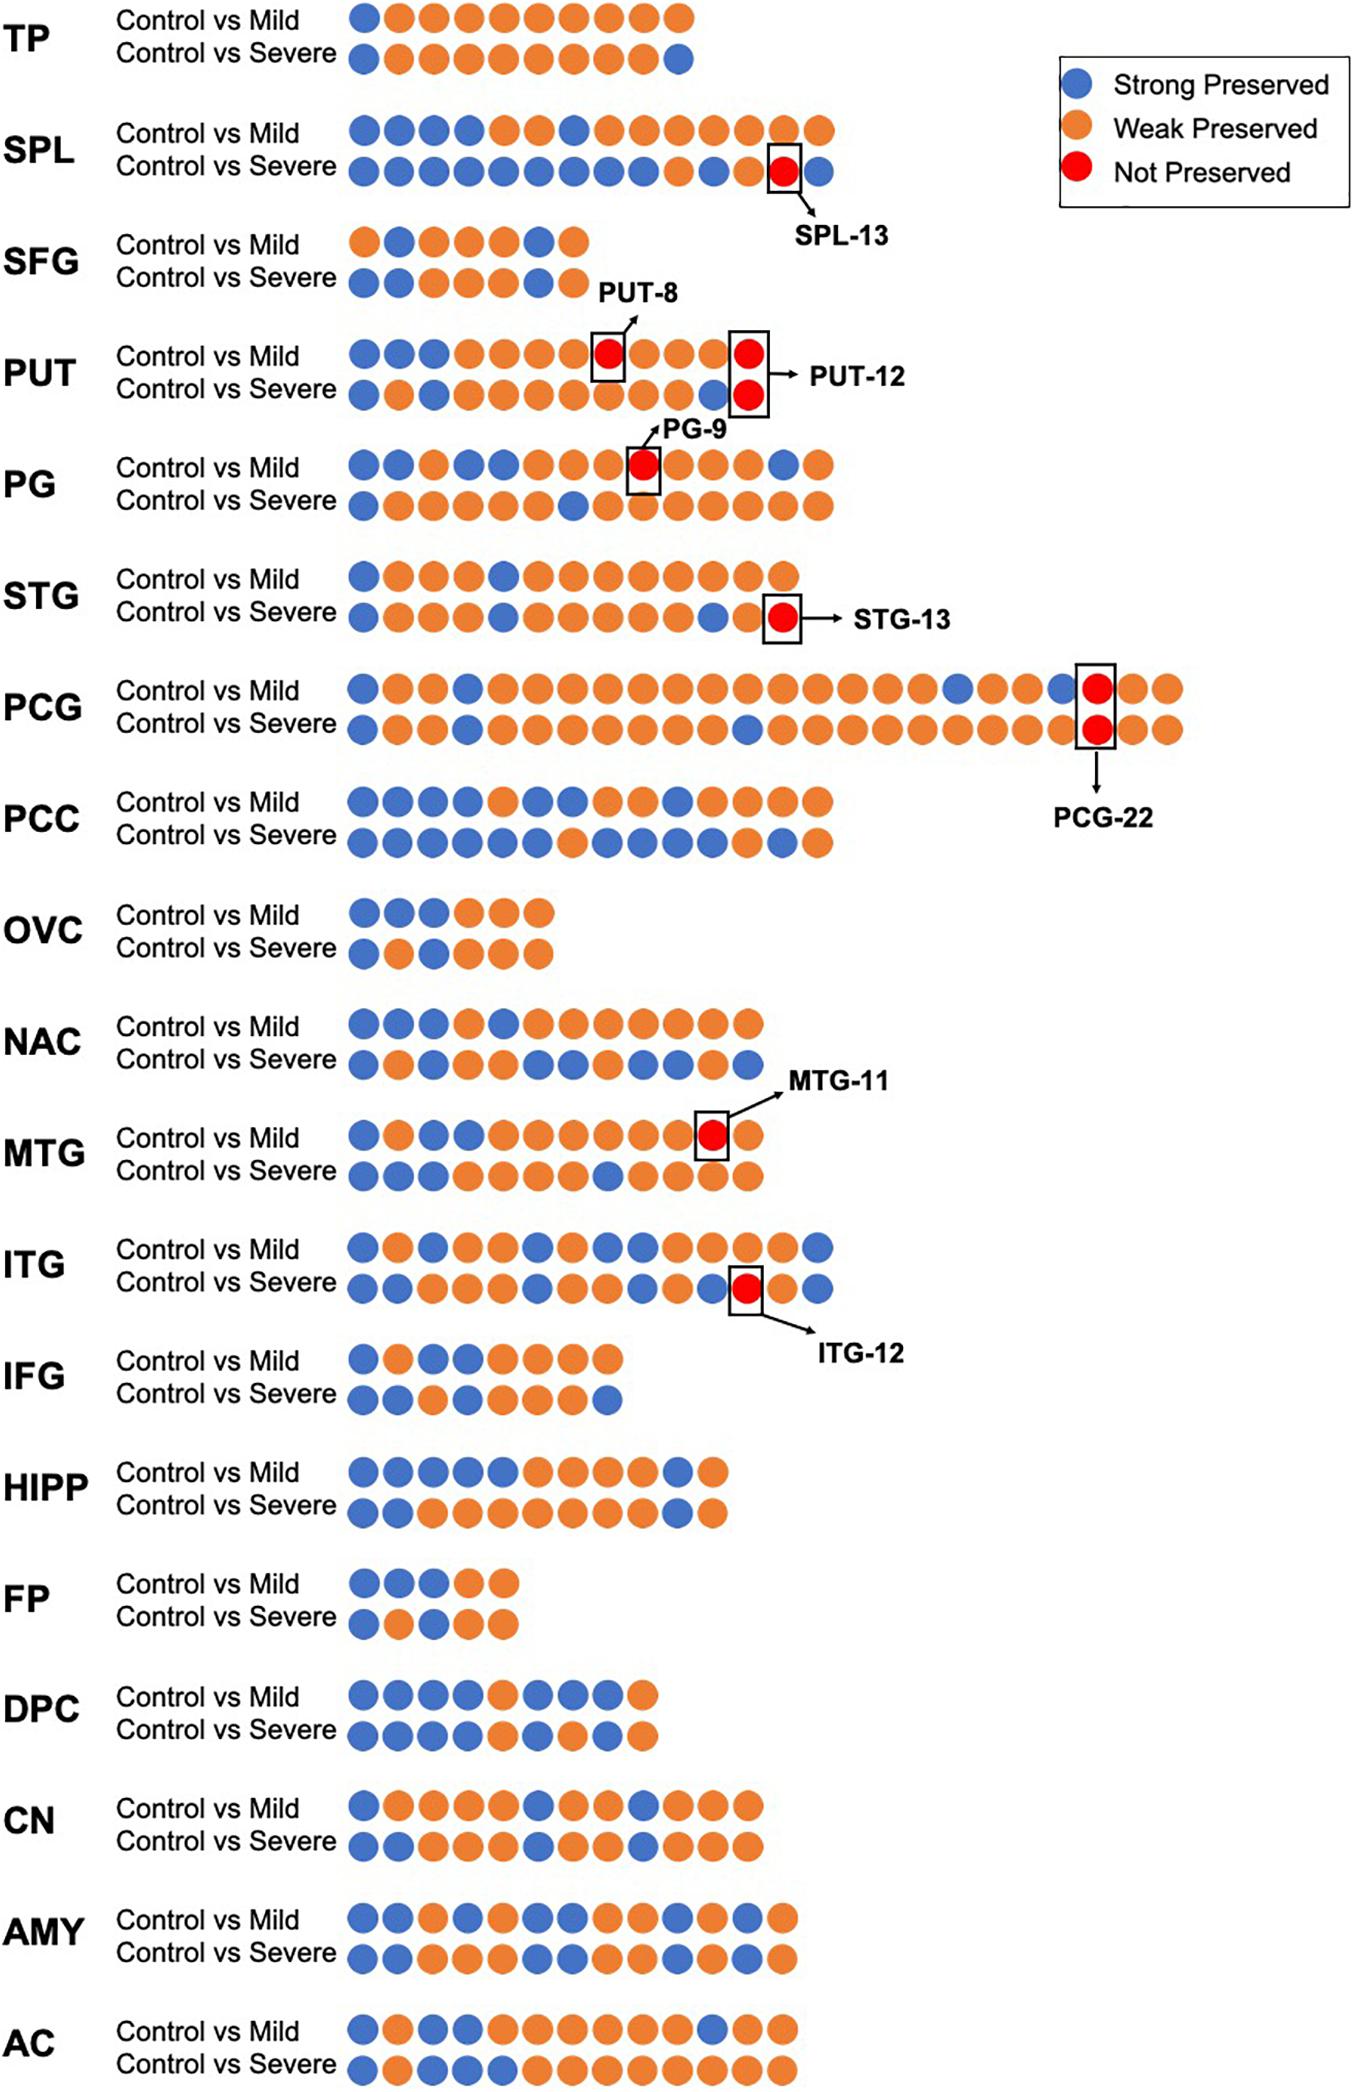
Figure 2. The preservation evidence of control co-expression modules in different disease stages and different brain regions. For each brain region, co-expression networks in control group was compared with networks in mild and severe groups, co-expression modules are show as dots, which are sorted according to module size and colored according to their preservation evidence. Blue: strong preservation evidence; yellow: weak preservation evidence; red: none preservation evidence.
Functional Enrichment of the NPM Genes
We observed the functional distribution of the NPM genes by GO term network analysis using ClueGo. Finally, these genes were found to be enriched in 44 GO term groups (constructed by 85 GO terms). As shown in Figure 3, most of the enriched GO groups were related to the immune response, and functions related to cell differentiation, vesicle transport, and lipid metabolism were also involved. Functional enrichment analyses were also performed for genes in each NPM, as shown in Table 2. Genes in four NPMs were significantly enriched in the functional pathway clusters, and the enriched clusters were mainly related to the immune response.
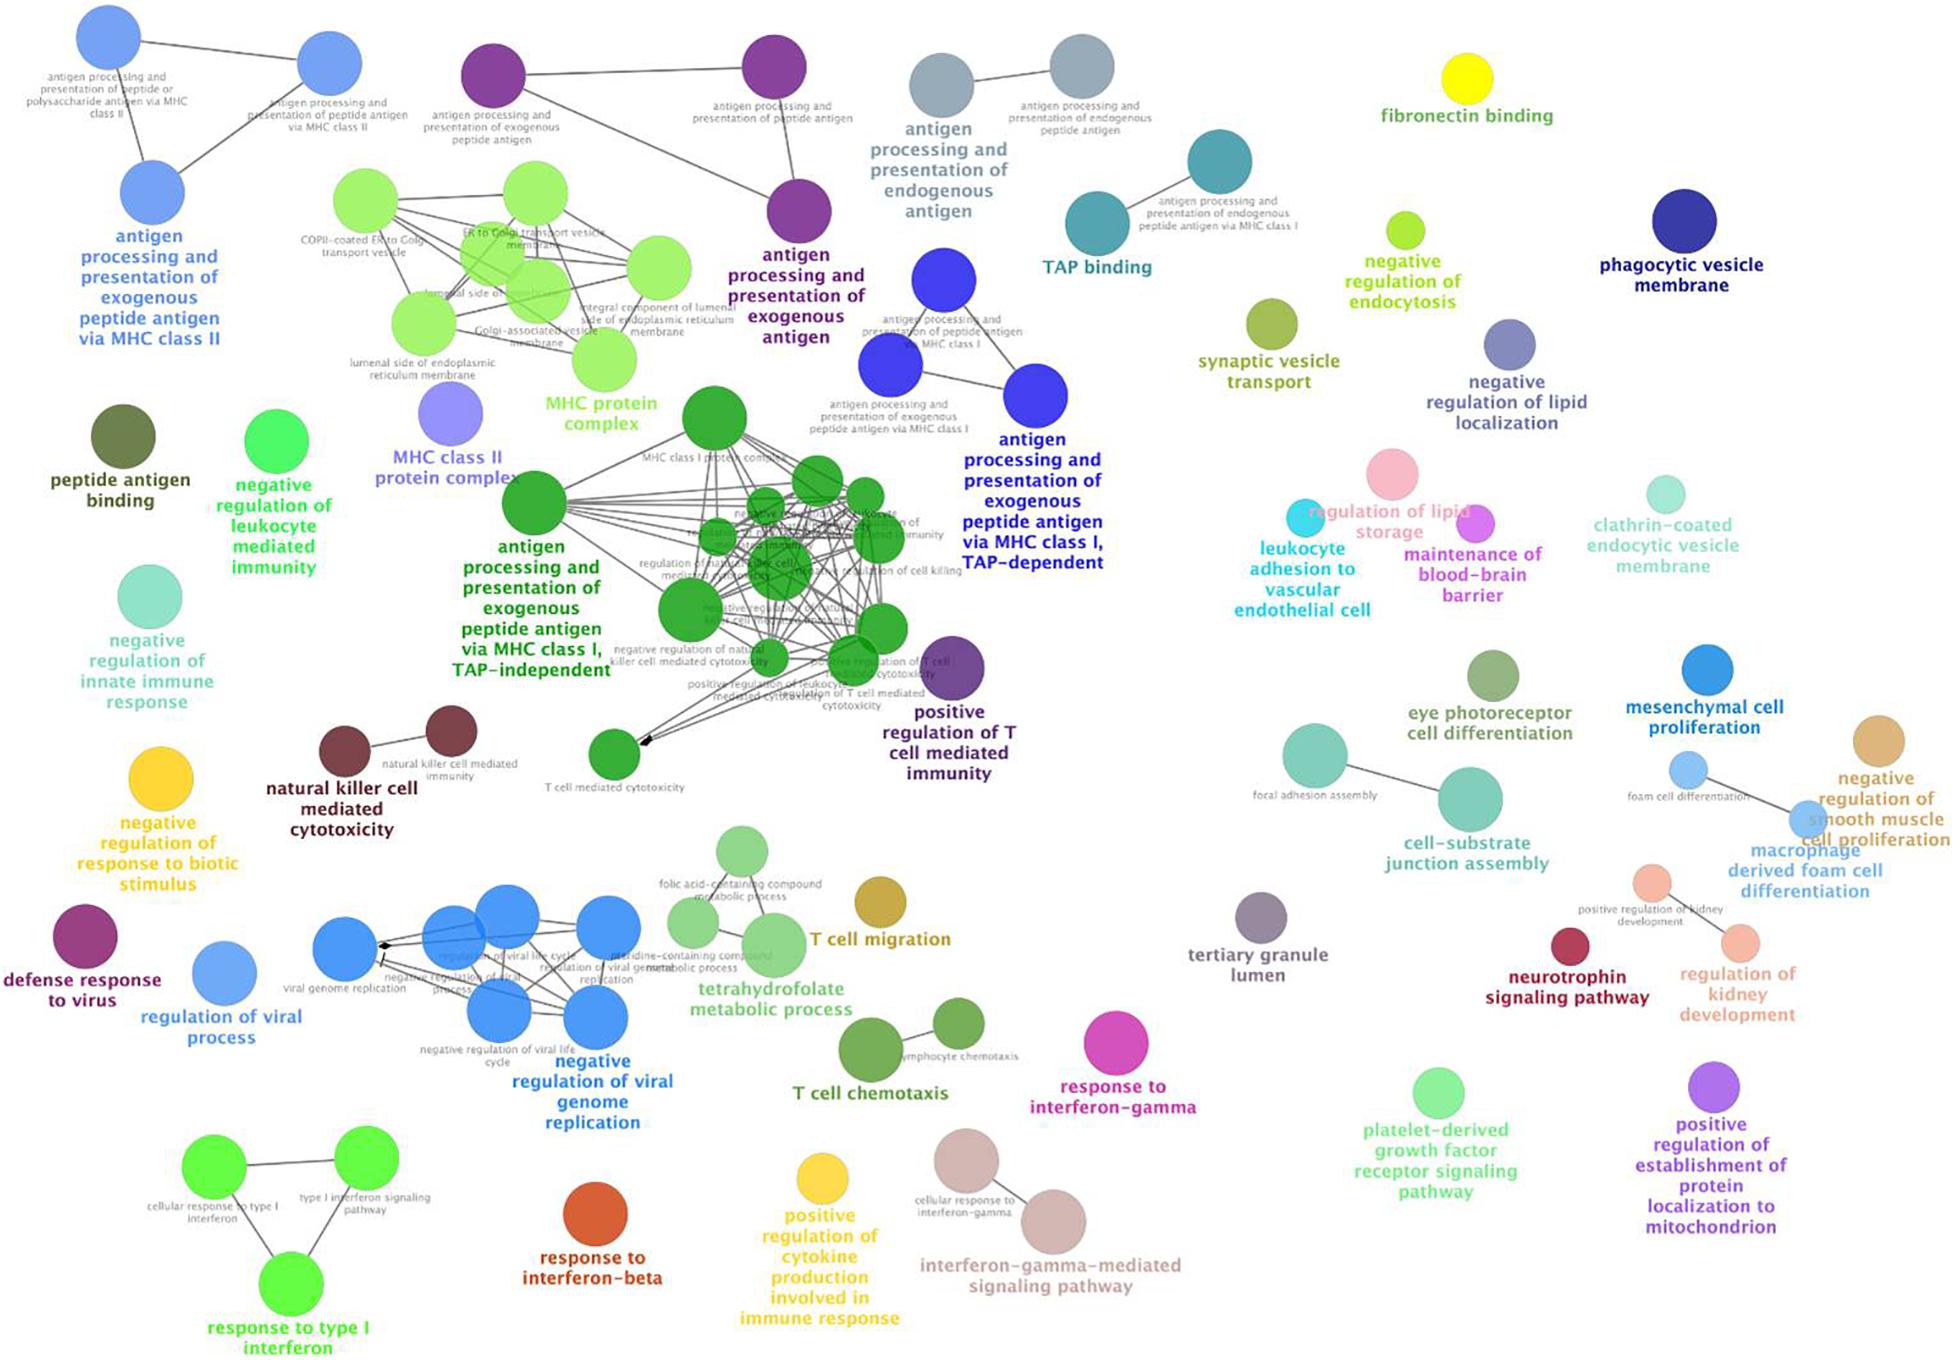
Figure 3. Functional GO groups enriched by genes in non-preserved co-expression modules. This figure illustrates the functionally grouped network that constructed by GO terms (nodes) that associated to non-preserved co-expression module genes. The size of the nodes reflects the statistical significance of the terms. The degree of connectivity between terms (edges) is calculated using kappa statistic and functional groups are defined using the kappa score. The name of the group is given by the most significant term in the group and nodes in the same group are represented with same color.
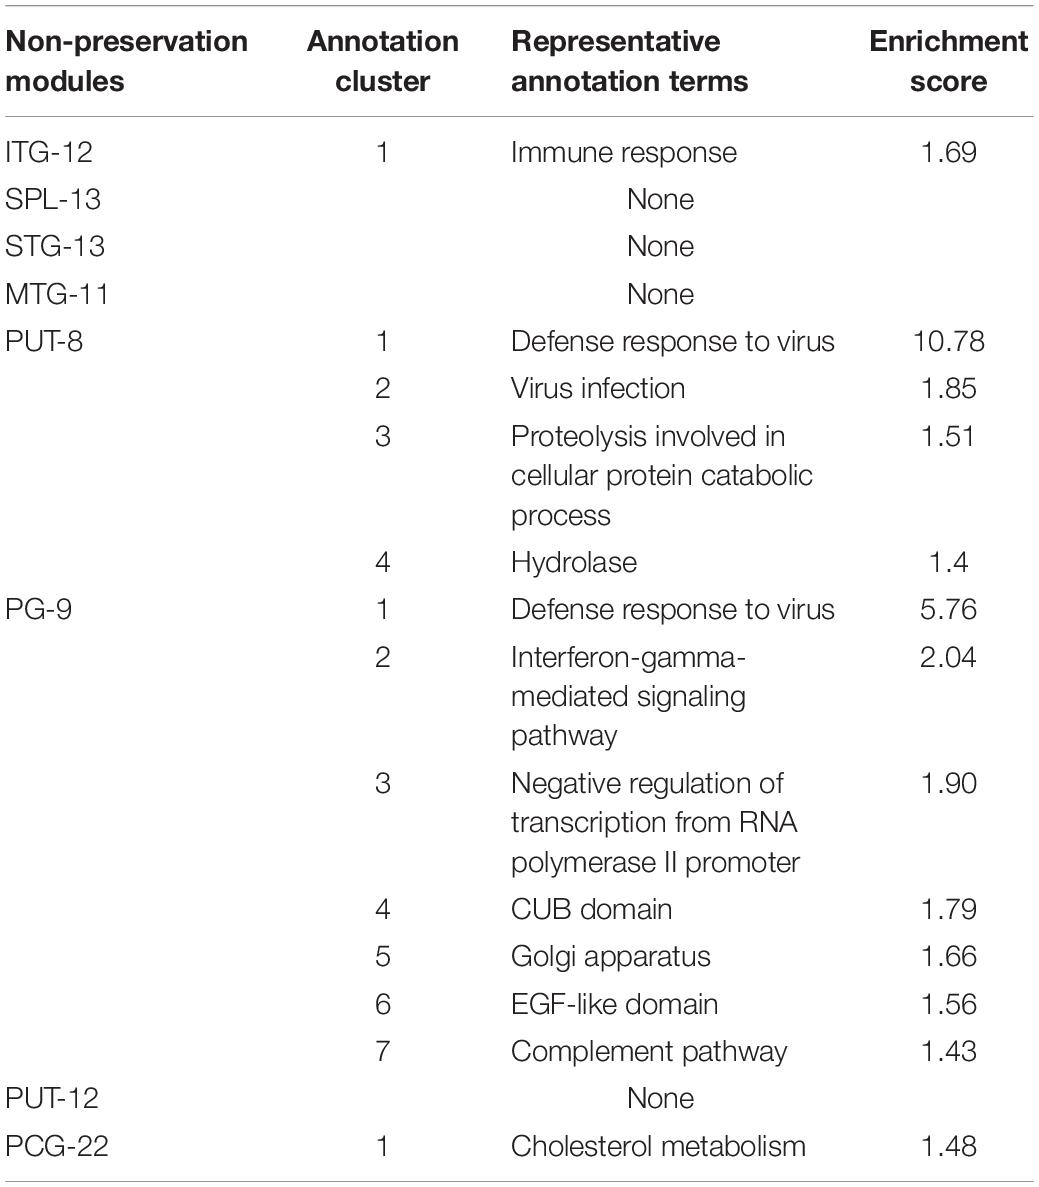
Table 2. Pathway clusters significantly enriched by genes of non-preservation modules (enrichment score > 1.3).
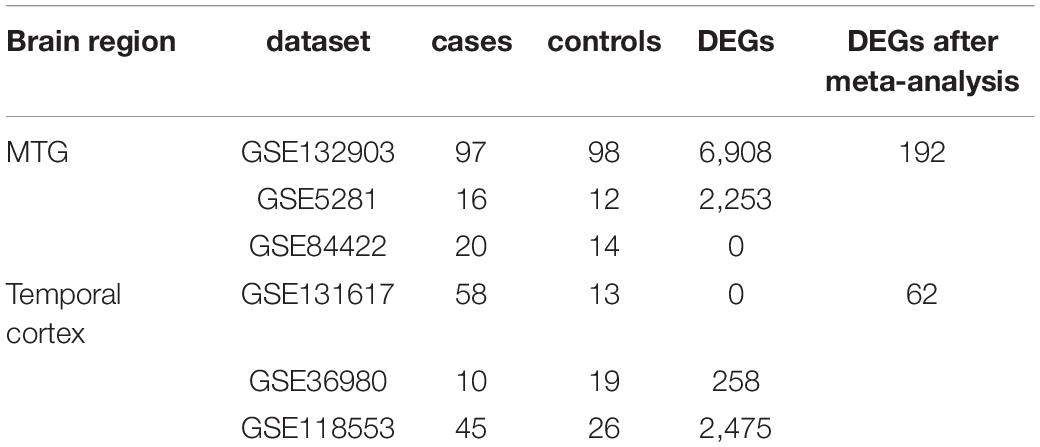
Table 3. Datasets used in the meta-analysis.
Brain Region Distribution of Non-preservation
Figure 4 shows the brain region distribution of the NPMs in different disease stages. NPMs in mild stages are located in two gyri of the temporal cortex (superior temporal gyrus, inferior temporal gyrus) and a lobule of the parietal cortex (superior parietal lobule). NPMs in the severe stage are located in the temporal cortex (middle temporal gyrus), primary motor cortex (precentral gyrus), and basal nuclei (putamen). NPMs in both disease stages are located in the basal nuclei (putamen) and limbic system (parahippocampal gyrus).
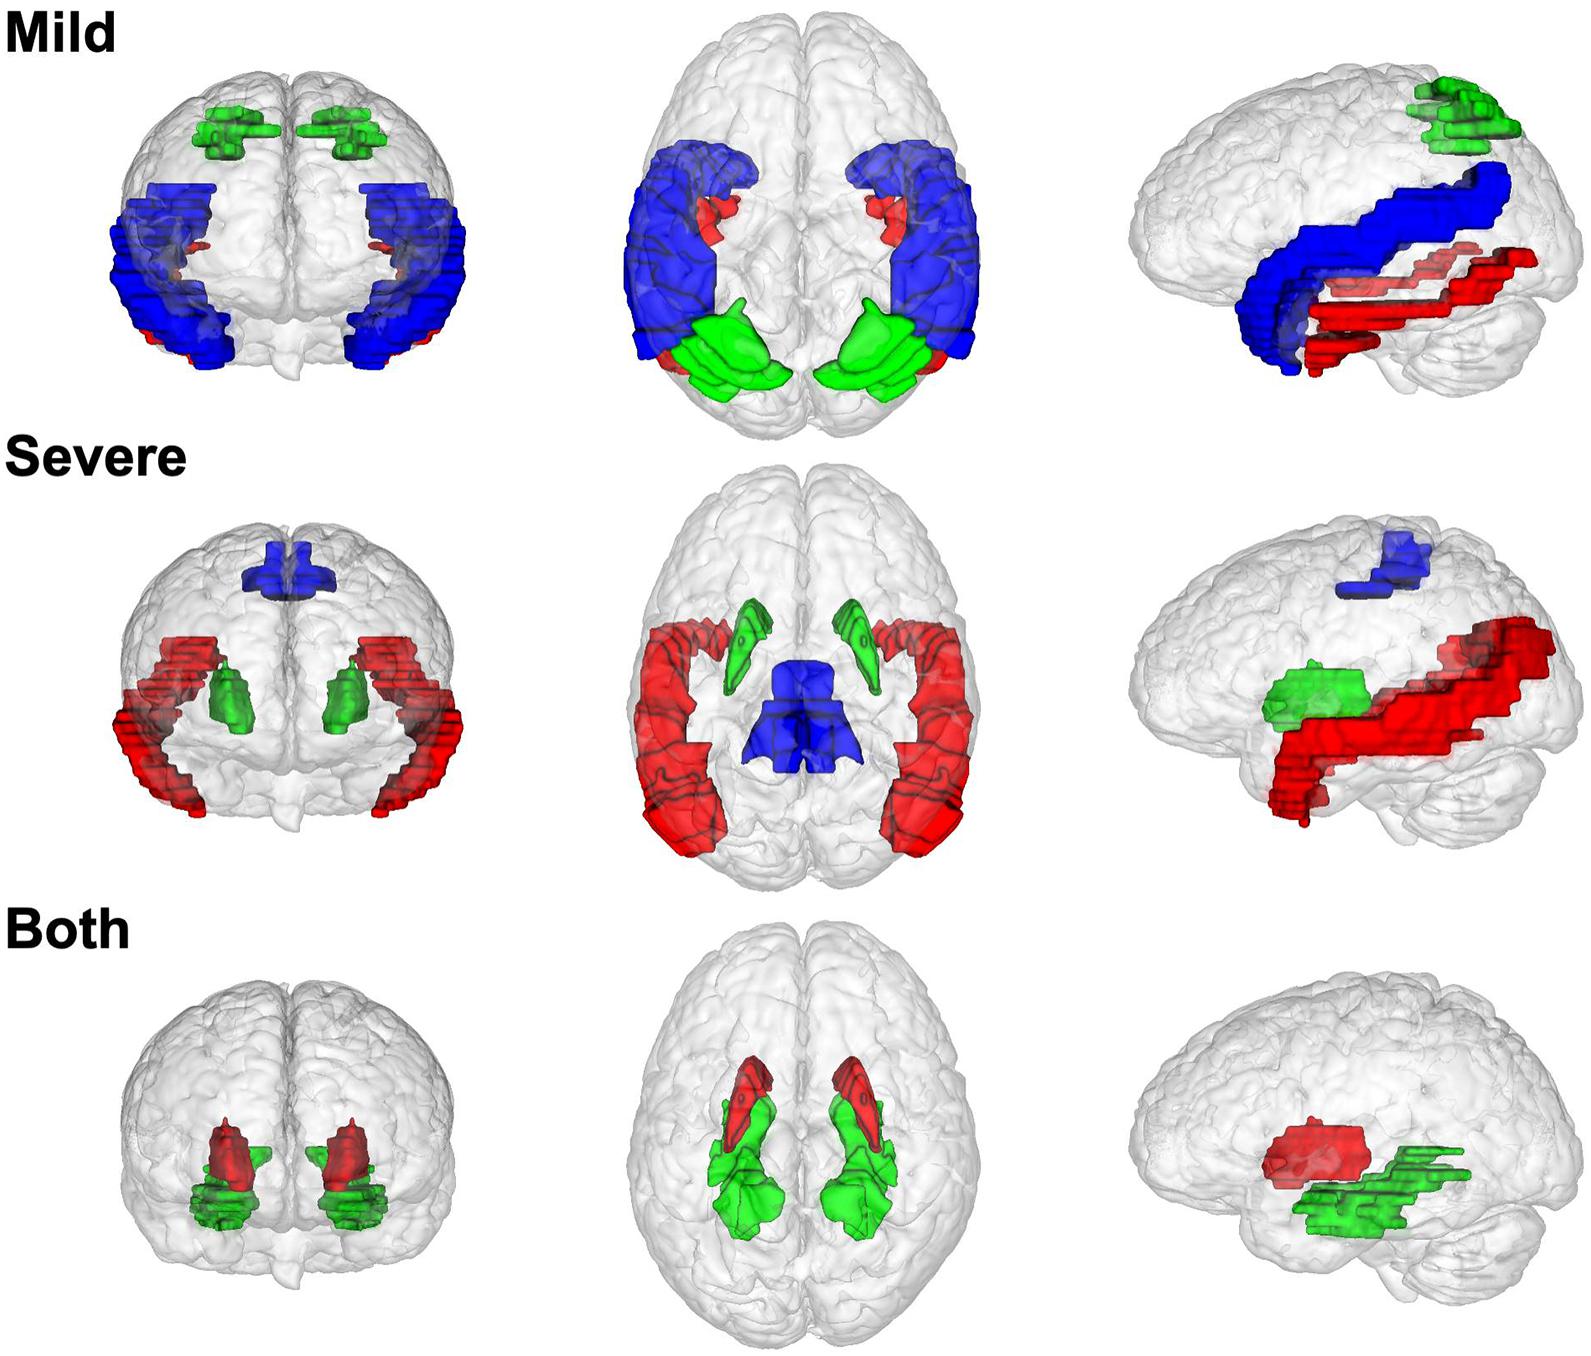
Figure 4. The brain region distribution of non-preserved modules in different Alzheimer’s disease stages. Modules that non-preserved in mild stages are located in superior temporal gyrus (blue), inferior temporal gyrus (red), and superior parietal lobule (red). Modules that non-preserved in severe stage are located in middle temporal gyrus (red), putamen (green), precentral gyrus (blue). Modules that non-preserved in both two disease stages are located in putamen (red) and parahippocampal gyrus (green).
Cell-Type Enrichment of NPM Genes
Gene sets associated with five kinds of brain cells were used in enrichment analysis of genes in each NPM. Figure 5 shows the enrichment scores of the NPMs in different cell types. According to the cut-off of 1.3 (equivalent to a P-value of 0.05 in FET), 2 modules were significantly enriched in astrocytes, 5 in endothelial cells, 4 in microglia, 2 in neurons, and 3 in oligodendrocytes. Strong significance appears in astrocytes, endothelial cells, microglia, and oligodendrocytes.
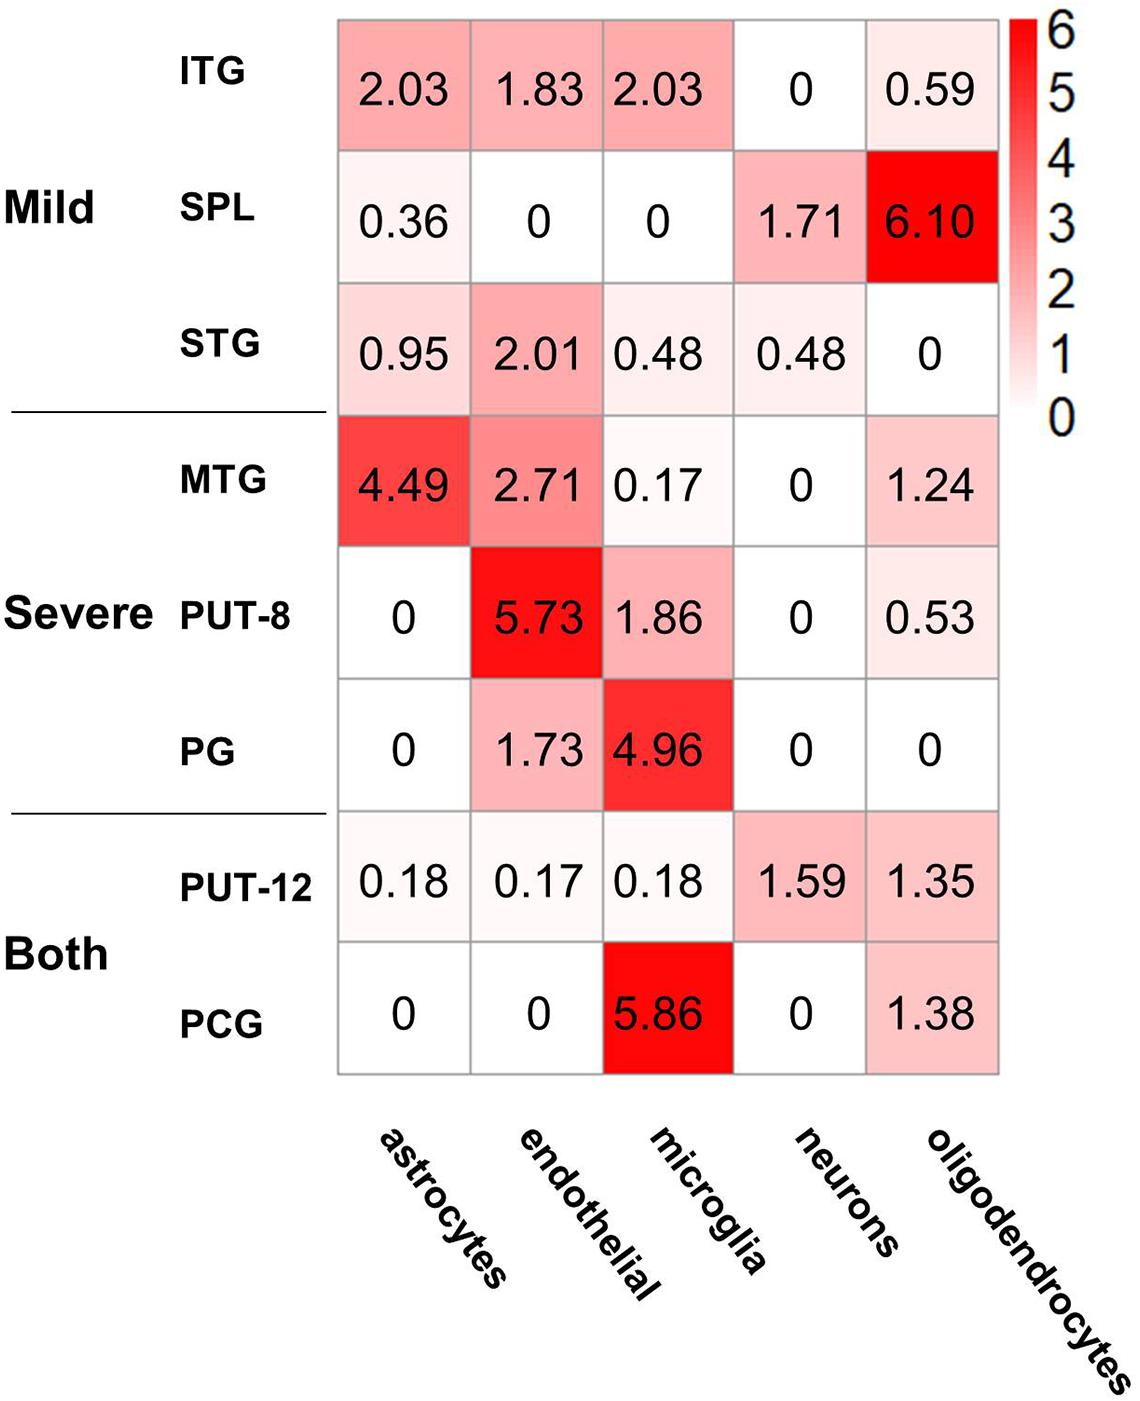
Figure 5. Cell type enrichment of non-preserved modules in different brain regions. The heatmap shows the enrichment results of five kinds of cell type-specific genes in the eight non-preserved modules, the color in heatmap illustrated the negative logarithm of P-value of the enrichment, from white (-log(P-value) = 0) to red (-log(P-value) > 6). The significant cutoff is defined as 1.3, which is equivalent to P-value 0.05.
PPI Network of DEGs and NPM Genes in MTG and TC
Since all three temporal gyri are involved in disease development, meta-analyses were performed to identify DEGs in the temporal cortex or specific temporal gyrus. Finally, six data sets were selected, and the results of the meta-analyses are summarized in Table 3. Detailed information on the meta-analysis is shown in Supplementary Tables 2, 3 and Supplementary Figures 2–5. No overlap was observed between the DEGs and NPM genes, but there were universal PPIs among them (as shown in Figures 6A,B). As shown in Table 4, 177 of 241 MTG genes (including DEGs and NPM genes) can be found in STRING, 342 interactions between them can be found, significantly (P = 2.83E-14) higher than the predicted interaction number 222, predicted by the average interaction number in the STRING network. A total of 141 of 207 TC genes were found in STRING, and 262 interactions were found among them, which was significantly (P = 0.00145) higher than the predicted number of 216. The average degree, degree distribution, and high degree genes (degree ≥ 10) are shown in Table 4 and Figure 6C.
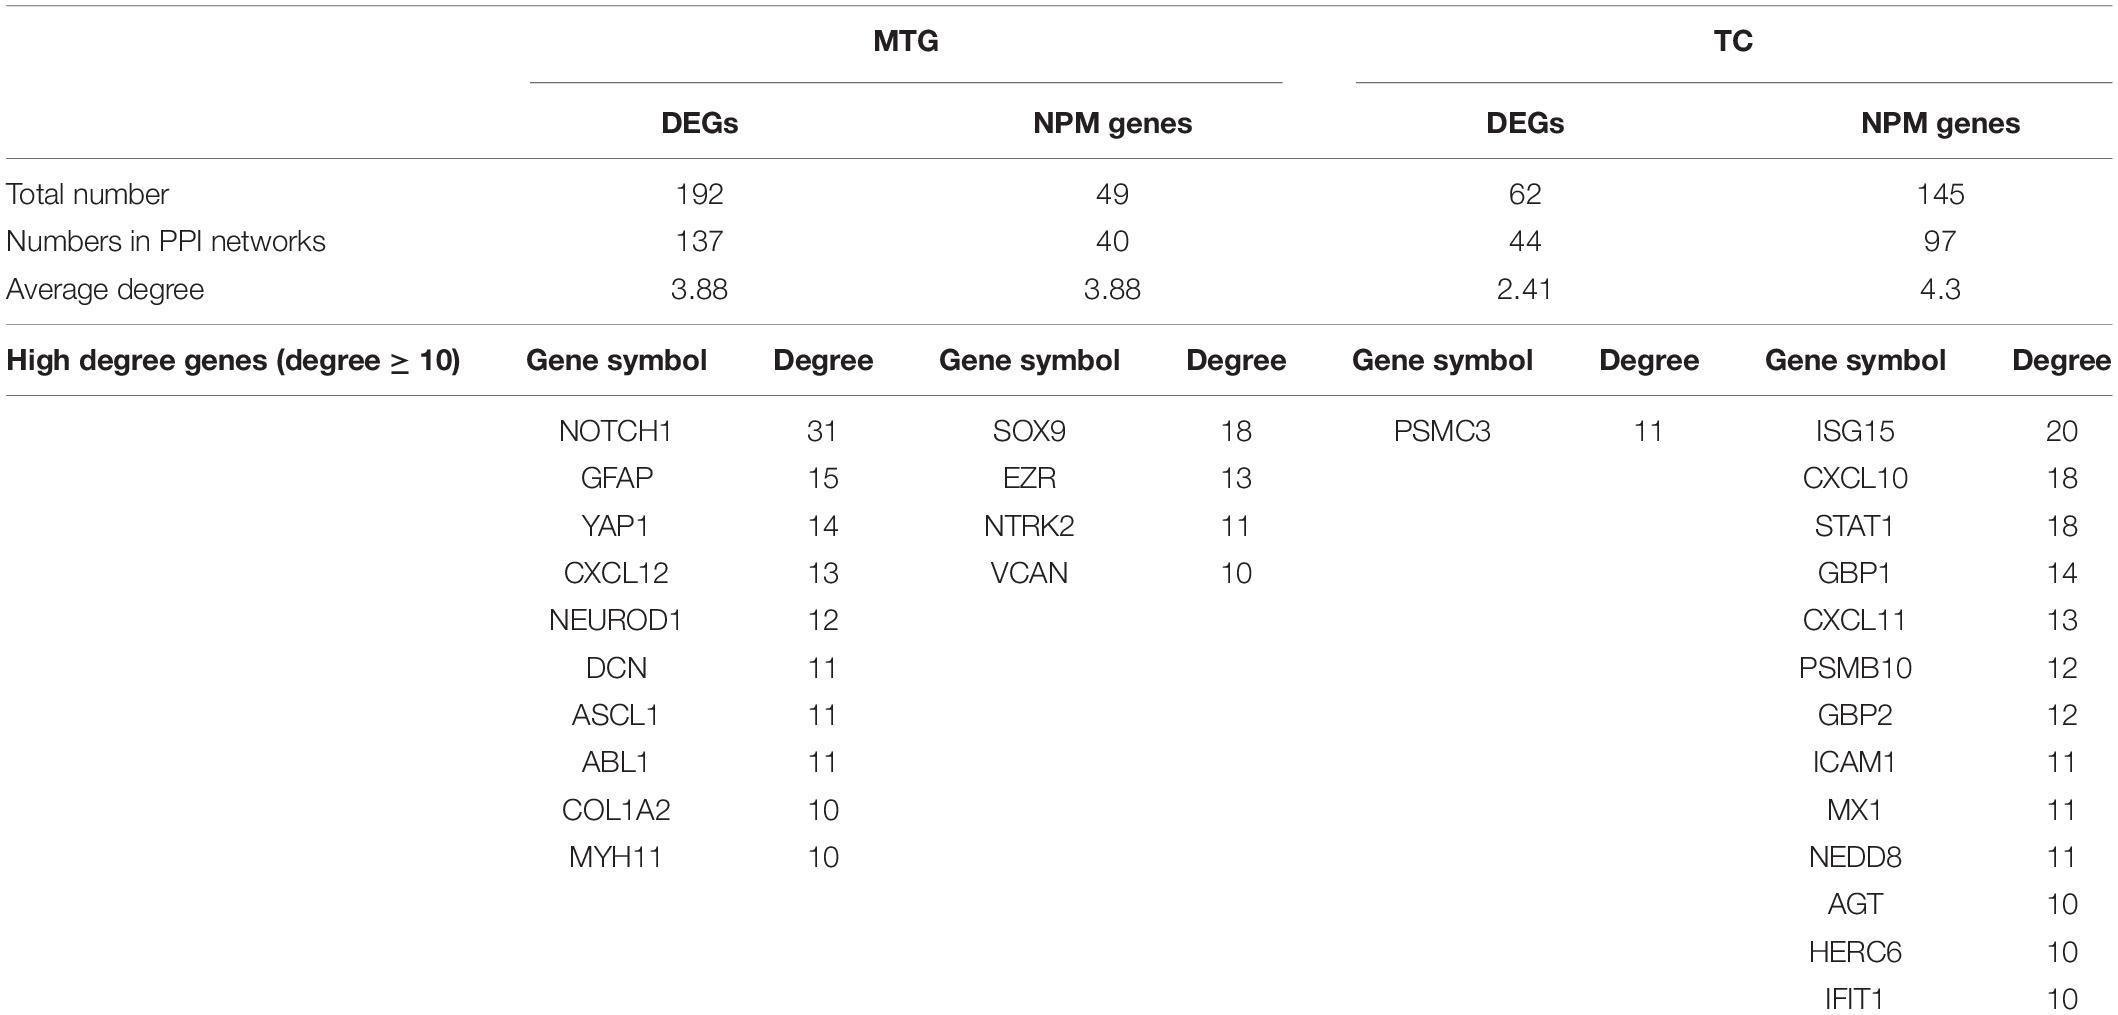
Table 4. Summary of nodes in the PPI networks of MTG and TC.
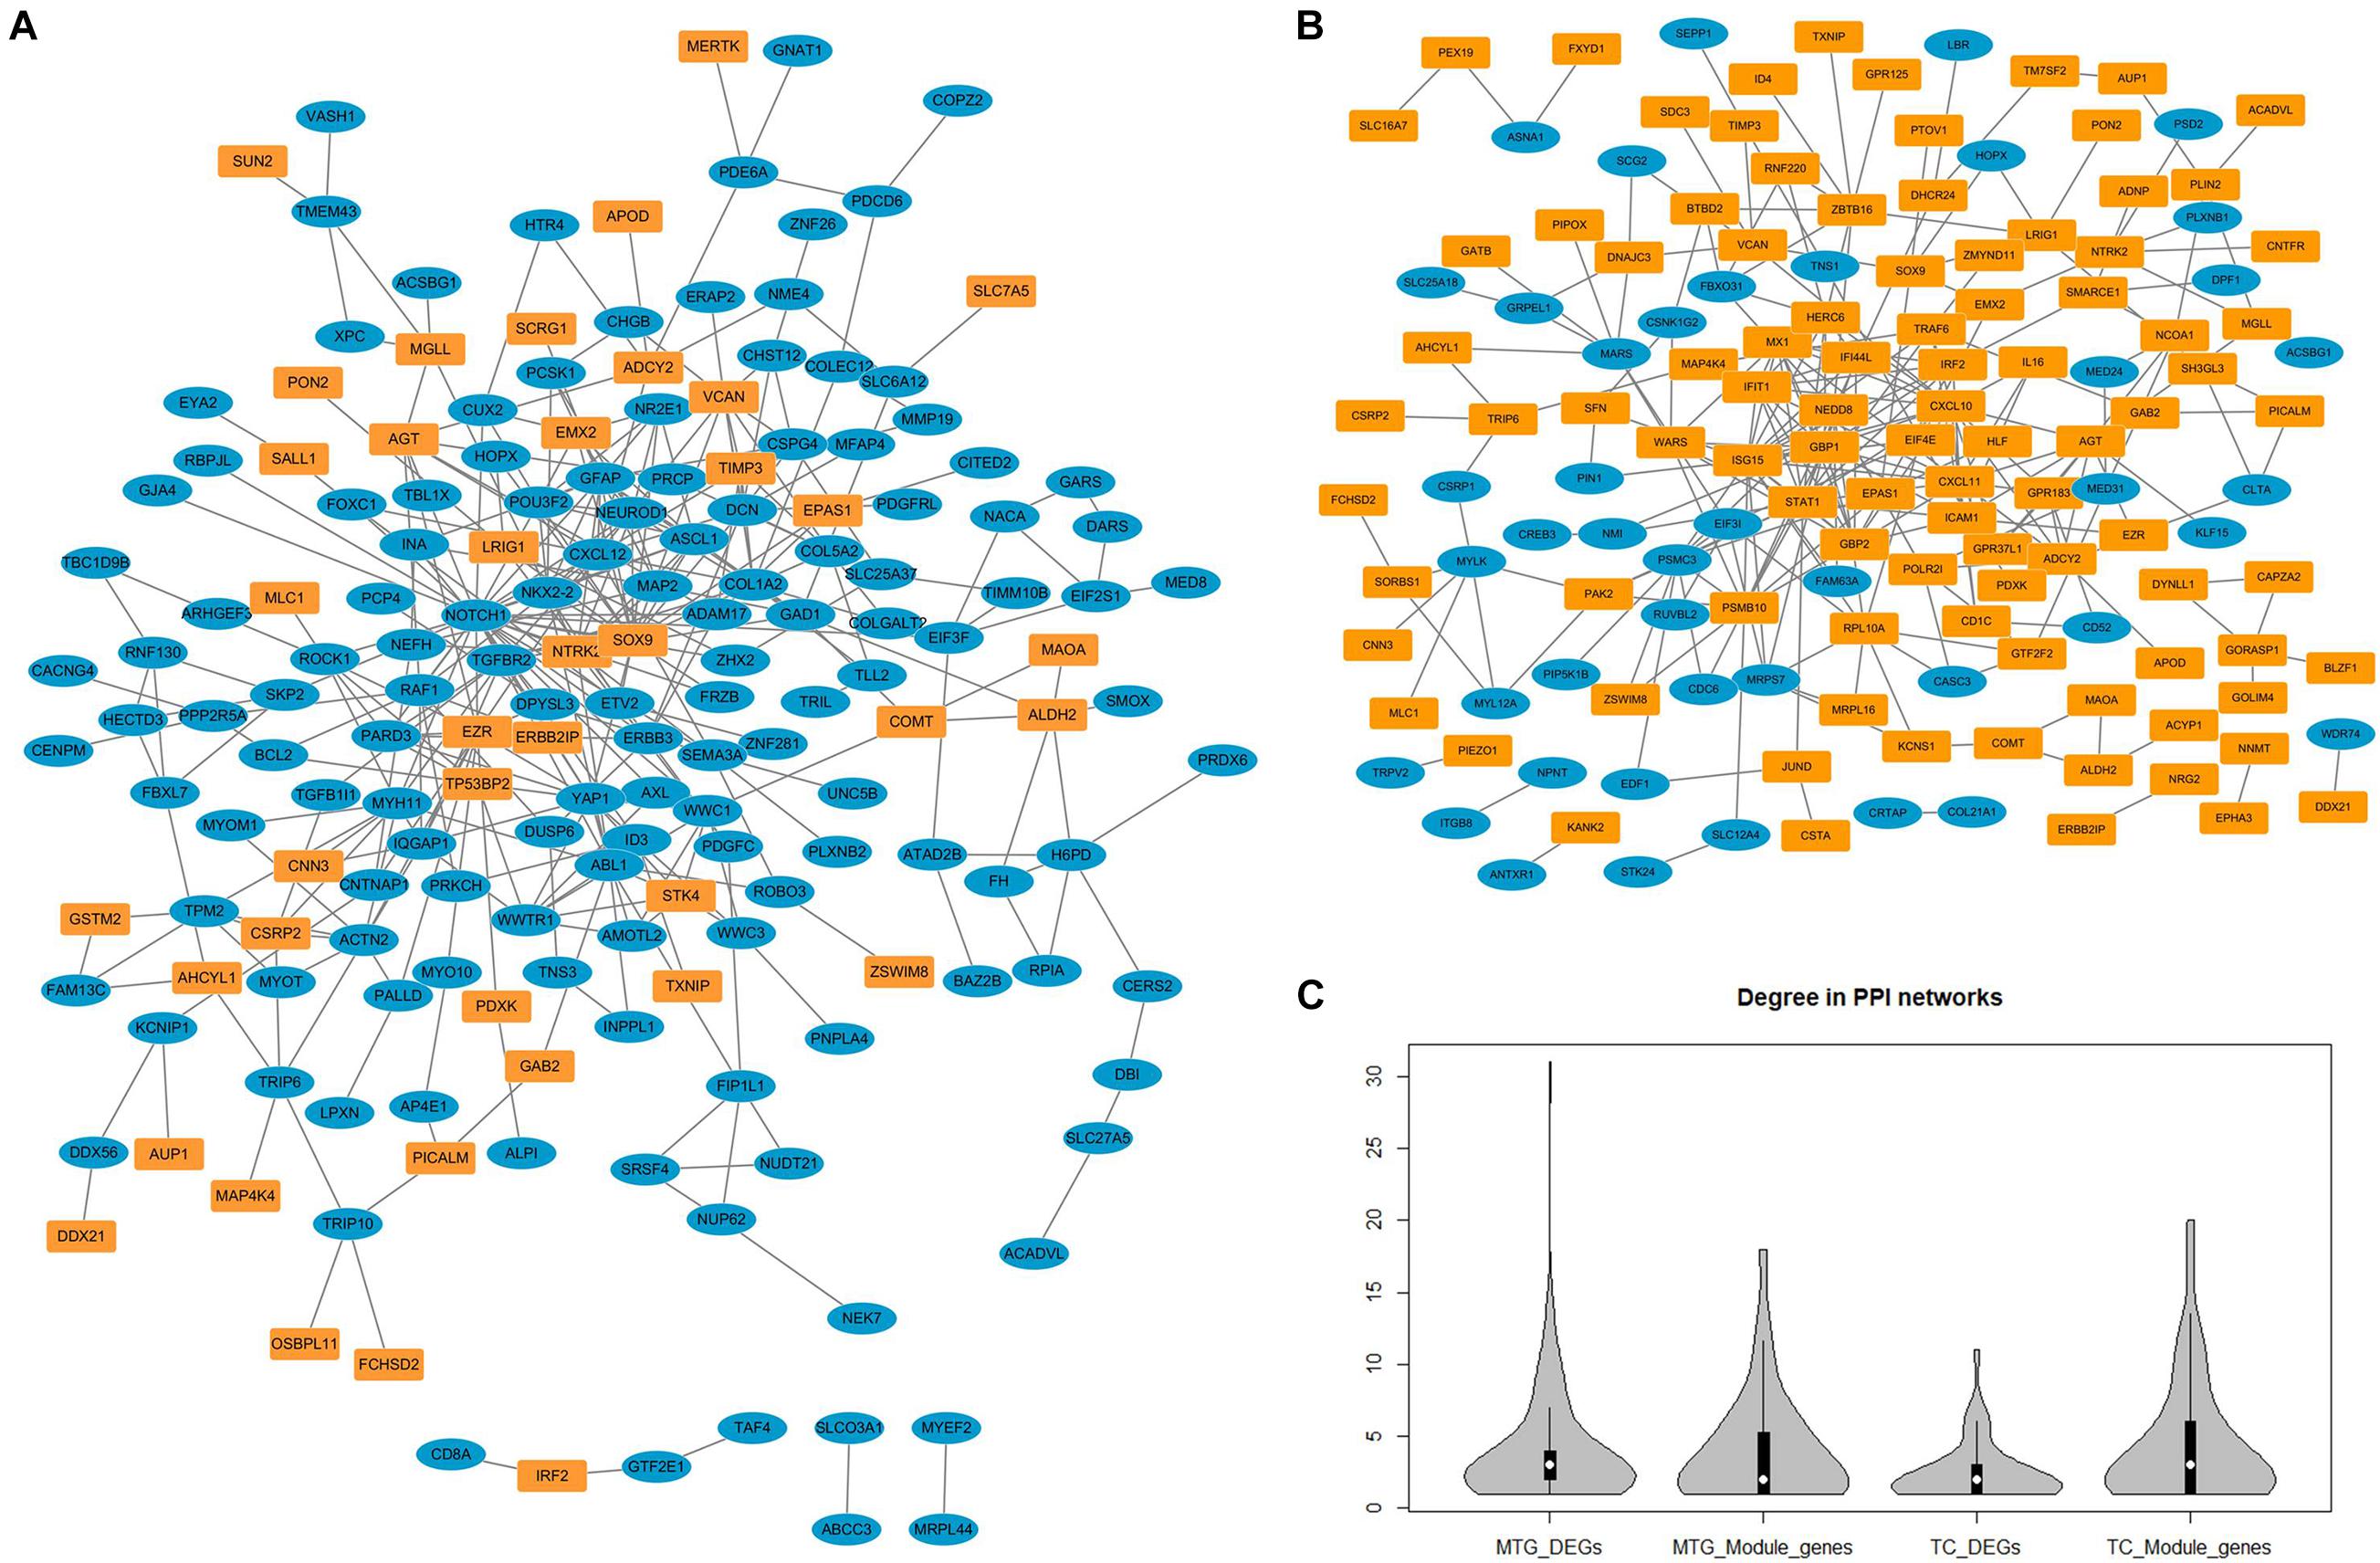
Figure 6. The protein–protein interaction networks constructed by differentially expressed genes and genes in non-preserved modules. (A) Protein-protein interaction network constructed by middle temporal gyrus differentially expressed genes (blue nodes) and non-preserved module genes (yellow nodes). (B) Protein–protein interaction network constructed by temporal cortex differentially expressed genes (blue nodes) and non-preserved module genes (yellow nodes). (C) The degree distribution of different types of genes in protein-protein interaction network.
Discussion
In the current study, we explored AD-related biological processes by analysing the coexpression gene modules of different brain regions in different disease stages. The coexpression network features and key genes of AD peripheral blood or brain have been reported in several previous studies (Seyfried et al., 2017; Liang et al., 2018; Sweeney et al., 2018; Zhang et al., 2018; Hu et al., 2020; Kelly et al., 2020; Soleimani Zakeri et al., 2020). Among these studies, Wang et al. performed a pan-cortical brain region genomic analysis, obtained and ranked 44,692 gene probesets, 1,558 coexpressed gene modules and 19 brain regions based upon their association with AD; through these analyses temporal lobe gyri were identified as sites associated with the greatest and earliest gene expression abnormalities, abnormal expression was specific to cell type of oligodendrocytes, astrocytes, and neurons, and neurobiological pathways (included actin cytoskeleton, axon guidance, and nervous system development) were enriched by abnormally expressed genes and modules (Wang et al., 2016); however, the changes in coexpression modules in sub-brain regions during AD development have not been fully studied. We constructed 57 coexpression networks by using this expression dataset from 1,053 postmortem brain samples across 19 cortical regions, evaluated network conservation during disease pathology (from healthy to mild and severe AD stages) in each brain region, and deduced disease-related biological processes based on the network features.
As we expected, in the development of AD, there is a wide range of coexpression pattern changes in the whole brain. This suggested that dysfunctions of expression appear in multiple brain regions, not only in brain regions that are traditionally associated with memory. We focused on the eight most dramatically changed coexpression modules. Functional pathway analysis suggested that genes in these modules are mainly involved in the immune response instead of transmitters or other pathways that directly affect neuronal function. These results supported the neuroimmunopathogenesis of AD. In recent years, AD has no longer been considered a neural-centric disease, and the critical role played by neuroinflammation in the pathogenesis of AD has been implicated in many genetic, functional, and neuroimaging studies (Cao and Zheng, 2018; Jansen et al., 2019; Kunkle et al., 2019; Passamonti et al., 2019; Bis et al., 2020; Burgaletto et al., 2020).
The most dramatic coexpression pattern changes occurred in seven brain regions. These results are consistent with previous brain structure or functional studies. Coexpression patterns in five regions began to change dramatically in the mild stage, including two subregions of the temporal cortex, one lobule of the parietal cortex, part of the dorsal striatum, and the parahippocampal gyrus in the limbic system. The associations of structural or functional changes in such brain regions and early AD pathology have been widely reported. It has been reported that tau pathology spreads hierarchically from the inferior temporal lobe throughout the cortex (Franzmeier et al., 2019), and neural activity increases in the superior parietal lobule of patients with MCI (Jacobs et al., 2012). Associations between dysfunction of the limbic system or basal ganglia and early AD have also been reported (Hopper and Vogel, 1976; Nestor et al., 2003; de Jong et al., 2008; Botzung et al., 2019). In severe AD, dysfunction spreads to the middle temporal gyrus and precentral gyrus. The relationship between the middle temporal gyrus and AD has been emphasized in many studies (Galton et al., 2001b; Dong et al., 2021). Although it has not been fully studied, the relationship between the precentral gyrus and AD has been reported in several studies (Peters et al., 2009).
Considering the correlation between brain expression patterns and brain functional connections (Richiardi et al., 2015; Anderson et al., 2018), the expression changes suggested potential connectivity changes in AD, and the evidence in the current study corresponds to previous reports. Regional tau PET levels within major functional networks showed a medial temporal limbic network-specific distribution (Franzmeier et al., 2019), and limbic network and striatal connectivity alternated in patients with AD and MCI (Badhwar et al., 2017), and an increased effectiveness of temporoparietal connectivity has been reported in AD patients (Jacobs et al., 2012).
In addition to brain region distribution features, violent coexpression pattern changes present a cell type-specific distribution. In general, all NPM genes were most significantly enriched in non-neuron cells (astrocytes, endothelial cells, microglia, and oligodendrocytes), and only NPM genes in the SPL and putamen showed an enrichment trend in neurons. Considering the roles of glia in AD and the immune response (Gonzalez-Reyes et al., 2017; Fakhoury, 2018; Leng and Edison, 2021), the enrichment of astrocytes and microglia may highlight the immunopathology in AD. Oligodendrocytes are located in the white matter, recent neuroimaging studies have implicated micro- and macrostructural abnormalities in white matter in the risk and progression of AD (Nasrabady et al., 2018), it’s reported that age and severity of dementia were significantly associated with white matter changes in AD patients (Kao et al., 2019), and white matter may also play an important role in the pathogenesis and diagnosis of AD, besides of intact with gray matter, demyelination of the white matter is reported to occur prior to the presence of amyloid-β plaques and neurofibrillary tangles in the presymptomatic stages of AD (Sachdev et al., 2013). Oligodendrocytes may affect AD pathogenesis in both neuropathological and immunopathological manners, oligodendrocytes are regulated by Aβ oligomers in differentiation and maturation (Quintela-Lopez et al., 2019), oligodendrocyte precursor cells present antigens and may be involved in perpetuating the autoimmune response (Kirby et al., 2019). Endothelial cells participate in the formation of the blood brain barrier (BBB), and Aβ influences endothelial mitochondrial dysfunction pathways and contributes to the progression of neurovascular dysfunction in AD. The enrichment results in the current study also support BBB-related pathology in AD (Parodi-Rullan et al., 2019). Additionally, the functional enrichment analysis also suggested that the dysfunction of NPM genes influences the maintenance of the BBB.
The temporal lobe, especially the MTG, is an important brain area involved in cognition and memory (Kornblith et al., 2017; Naya et al., 2017; Vaz et al., 2019) and has been a focus in AD pathology (Galton et al., 2001a; Visser et al., 2002; Dickerson and Sperling, 2008; de Flores et al., 2020). Several genes have been reported to be differentially expressed in the temporal lobe between patients with AD and healthy controls, but the results of different studies are heterogeneous (Patel et al., 2019). In the current study, we searched transcriptomics data of MTG or TC and performed a meta-analysis. As shown in Table 3, articles in both groups presented high heterogeneity. When the cut-off of DEGs was set as a P-value less than 0.05 and a fold change of more than two or less than 0.5, both meta-analyses failed to identify DEGs. This may be due to the high degree of heterogeneity among the studies. When the cut-off was adjusted to a P-value less than 0.05, some stable but not violent DEGs were identified. None of these DEGs were in NPMs, but they were extensively connected to NPM genes in PPI networks. This suggests that AD pathology is not caused by drastic changes in a few genes but is related to changes in the entire expression pattern. A large number of genes were involved in the pattern change, but for a single gene, the change was not dramatic.
Network topology analysis showed that the degree of NPM genes was higher than that of DEGs, but this trend was not significant. According to the hypothesis that disease genes tend to have higher degrees in the network (Jonsson and Bates, 2006; Sun et al., 2010), high degree genes were identified and may play more important roles in the functional network and AD pathology. Several high degree genes have been reported to participate AD pathology related pathways or related to AD, ABL1,SOX9, STAT1, PSMB10, NEDD8, HERC6, and IFIT1 have been reported as participants of amyloid- or Tau-signaling (Jing et al., 2009; Chen et al., 2012; Orre et al., 2013; Woodling et al., 2014; Li et al., 2019; Vong et al., 2021); DCN, CXCL10, CXCL11, and ICAM1 play roles in amyloid plaque formation (Frohman et al., 1991; Snow et al., 1992; Krauthausen et al., 2015); NOTCH1, GFAP, YAP1, CXCL10,CXCL12, ASCL1, STAT1, GBP1, GBP2, and AGT are altered expression in plasma, CSF, or brain of AD patients (Kitamura et al., 1997; Galimberti et al., 2006; Laske et al., 2008; Mateos et al., 2011; Xu et al., 2018; Cho et al., 2019; Meyer et al., 2019; Oeckl et al., 2019; Kuan et al., 2021); AD association of variants in or surrounding MYH11, NTRK2, PSMC3 and ISG15 have been detected (Chen et al., 2008; Roy et al., 2020; Blue et al., 2021; Novikova et al., 2021). Relationships between AD and high degree genes COL1A2, EZR, and VCAN haven’t been reported, their roles in AD pathology need further study.
In conclusion, in the current study, we constructed 57 spatiotemporal specific coexpression networks in AD. By using network preservation analysis, we observed universal expression changes in all 19 brain regions. The eight most dramatically changed coexpression modules were identified in seven brain regions. Genes in these modules are mostly involved in immune response-related pathways, this supports the immune pathology of AD. The distribution of NPMs provides evidence of the brain functional mechanism of AD. The cell type distribution of NPMs also suggests the role played by the immune response and BBB injuries. In addition to revealing information about the potential etiopathogenesis of AD, our analysis suggested potential key genes involved in AD development that might be therapeutic targets.
Comprehensive analysis in this study provides new evidence for the immunopathological mechanism of AD, reveals the potential key brain regions, cells and molecular pathways in the development of AD. It provides new clues for the mechanism and intervention study of AD. In spite of above results, this study also has some limitations. Analysis in this study is based on public data, and the new results have not been verified in new samples or animal models, subsequent studies are needed to validate their stability. Our analyses only use expression data, genetic factors (such as APOE genotype) and demographic factors (such as gender and age) have not been considered, so the results should be further validated in more diverse populations. Although several high degree genes we identified have been reported altered expression in AD patients, more systematic validation and consequence functional researches should be performed to confirm their value.
Data Availability Statement
The original contributions presented in the study are included in the article/Supplementary Material, further inquiries can be directed to the corresponding authors.
Author Contributions
JW and LG designed the study and drafted the manuscript. LG and YL performed the analysis. All authors have read and approved the final manuscript.
Funding
This work was also supported by CAS Key Laboratory of Mental Health, Institute of Psychology, Chinese Academy of Sciences.
Conflict of Interest
The authors declare that the research was conducted in the absence of any commercial or financial relationships that could be construed as a potential conflict of interest.
Publisher’s Note
All claims expressed in this article are solely those of the authors and do not necessarily represent those of their affiliated organizations, or those of the publisher, the editors and the reviewers. Any product that may be evaluated in this article, or claim that may be made by its manufacturer, is not guaranteed or endorsed by the publisher.
Acknowledgments
We acknowledge the funding support from the CAS Key Laboratory of Mental Health, Institute of Psychology, Chinese Academy of Sciences.
Supplementary Material
The Supplementary Material for this article can be found online at: https://www.frontiersin.org/articles/10.3389/fnagi.2021.727928/full#supplementary-material
Footnotes
- ^ https://www.ncbi.nlm.nih.gov/geo/
- ^ http://ric.uthscsa.edu/mango
- ^ http://www.talairach.org/
- ^ http://bioinfo.genyo.es/imageo/
References
Albert, M. S., Dekosky, S. T., Dickson, D., Dubois, B., Feldman, H. H., Fox, N. C., et al. (2011). The diagnosis of mild cognitive impairment due to Alzheimer’s disease: recommendations from the National Institute on Aging-Alzheimer’s Association workgroups on diagnostic guidelines for Alzheimer’s disease. Alzheimers Dement 7, 270–279.
Anderson, K. M., Krienen, F. M., Choi, E. Y., Reinen, J. M., Yeo, B. T. T., and Holmes, A. J. (2018). Gene expression links functional networks across cortex and striatum. Nat. Commun. 9:1428.
Assenov, Y., Ramirez, F., Schelhorn, S. E., Lengauer, T., and Albrecht, M. (2008). Computing topological parameters of biological networks. Bioinformatics 24, 282–284. doi: 10.1093/bioinformatics/btm554
Badhwar, A., Tam, A., Dansereau, C., Orban, P., Hoffstaedter, F., and Bellec, P. (2017). Resting-state network dysfunction in Alzheimer’s disease: a systematic review and meta-analysis. Alzheimers Dement (Amst) 8, 73–85. doi: 10.1016/j.dadm.2017.03.007
Bindea, G., Mlecnik, B., Hackl, H., Charoentong, P., Tosolini, M., Kirilovsky, A., et al. (2009). ClueGO: a Cytoscape plug-in to decipher functionally grouped gene ontology and pathway annotation networks. Bioinformatics 25, 1091–1093. doi: 10.1093/bioinformatics/btp101
Bis, J. C., Jian, X., Kunkle, B. W., Chen, Y., Hamilton-Nelson, K. L., Bush, W. S., et al. (2020). Whole exome sequencing study identifies novel rare and common Alzheimer’s-Associated variants involved in immune response and transcriptional regulation. Mol. Psychiatry 25, 1859–1875.
Blalock, E. M., Geddes, J. W., Chen, K. C., Porter, N. M., Markesbery, W. R., and Landfield, P. W. (2004). Incipient Alzheimer’s disease: microarray correlation analyses reveal major transcriptional and tumor suppressor responses. Proc. Natl. Acad. Sci. U.S.A. 101, 2173–2178. doi: 10.1073/pnas.0308512100
Blue, E. E., Thornton, T. A., Kooperberg, C., Liu, S., Wactawski-Wende, J., Manson, J., et al. (2021). Non-coding variants in MYH11, FZD3, and SORCS3 are associated with dementia in women. Alzheimers Dement 17, 215–225. doi: 10.1002/alz.12181
Botzung, A., Philippi, N., Noblet, V., Loureiro De Sousa, P., and Blanc, F. (2019). Pay attention to the basal ganglia: a volumetric study in early dementia with Lewy bodies. Alzheimers Res. Ther. 11:108.
Buckley, R. F., Schultz, A. P., Hedden, T., Papp, K. V., Hanseeuw, B. J., Marshall, G., et al. (2017). Functional network integrity presages cognitive decline in preclinical Alzheimer disease. Neurology 89, 29–37. doi: 10.1212/wnl.0000000000004059
Burgaletto, C., Munafo, A., Di Benedetto, G., De Francisci, C., Caraci, F., Di Mauro, R., et al. (2020). The immune system on the TRAIL of Alzheimer’s disease. J. Neuroinflammation 17:298.
Cao, W., and Zheng, H. (2018). Peripheral immune system in aging and Alzheimer’s disease. Mol. Neurodegener. 13:51.
Chen, Y., Neve, R. L., and Liu, H. (2012). Neddylation dysfunction in Alzheimer’s disease. J. Cell Mol. Med. 16, 2583–2591.
Chen, Z., Simmons, M. S., Perry, R. T., Wiener, H. W., Harrell, L. E., and Go, R. C. (2008). Genetic association of neurotrophic tyrosine kinase receptor type 2 (NTRK2) With Alzheimer’s disease. Am. J. Med. Genet. B Neuropsychiatr. Genet. 147, 363–369.
Cho, S. J., Yun, S. M., Jo, C., Jeong, J., Park, M. H., Han, C., et al. (2019). Altered expression of Notch1 in Alzheimer’s disease. PLoS One 14:e0224941. doi: 10.1371/journal.pone.0224941
de Flores, R., Wisse, L. E. M., Das, S. R., Xie, L., Mcmillan, C. T., Trojanowski, J. Q., et al. (2020). Contribution of mixed pathology to medial temporal lobe atrophy in Alzheimer’s disease. Alzheimers Dement 16, 843–852. doi: 10.1002/alz.12079
de Jong, L. W., Van Der Hiele, K., Veer, I. M., Houwing, J. J., Westendorp, R. G., Bollen, E. L., et al. (2008). Strongly reduced volumes of putamen and thalamus in Alzheimer’s disease: an MRI study. Brain 131, 3277–3285. doi: 10.1093/brain/awn278
Dickerson, B. C., and Sperling, R. A. (2008). Functional abnormalities of the medial temporal lobe memory system in mild cognitive impairment and Alzheimer’s disease: insights from functional MRI studies. Neuropsychologia 46, 1624–1635. doi: 10.1016/j.neuropsychologia.2007.11.030
Dong, Q. Y., Li, T. R., Jiang, X. Y., Wang, X. N., Han, Y., and Jiang, J. H. (2021). Glucose metabolism in the right middle temporal gyrus could be a potential biomarker for subjective cognitive decline: a study of a Han population. Alzheimers Res. Ther. 13:74.
Fakhoury, M. (2018). Microglia and astrocytes in Alzheimer’s disease: implications for therapy. Curr. Neuropharmacol. 16, 508–518. doi: 10.2174/1570159x15666170720095240
Franzmeier, N., Rubinski, A., Neitzel, J., Kim, Y., Damm, A., Na, D. L., et al. (2019). Functional connectivity associated with tau levels in ageing, Alzheimer’s, and small vessel disease. Brain 142, 1093–1107. doi: 10.1093/brain/awz026
Frohman, E. M., Frohman, T. C., Gupta, S., De Fougerolles, A., and Van Den Noort, S. (1991). Expression of intercellular adhesion molecule 1 (ICAM-1) in Alzheimer’s disease. J. Neurol Sci. 106, 105–111. doi: 10.1007/978-3-211-79280-3_574
Galimberti, D., Schoonenboom, N., Scheltens, P., Fenoglio, C., Bouwman, F., Venturelli, E., et al. (2006). Intrathecal chemokine synthesis in mild cognitive impairment and Alzheimer disease. Arch. Neurol. 63, 538–543. doi: 10.1001/archneur.63.4.538
Galton, C. J., Gomez-Anson, B., Antoun, N., Scheltens, P., Patterson, K., Graves, M., et al. (2001a). Temporal lobe rating scale: application to Alzheimer’s disease and frontotemporal dementia. J. Neurol. Neurosurg. Psychiatry 70, 165–173. doi: 10.1136/jnnp.70.2.165
Galton, C. J., Patterson, K., Graham, K., Lambon-Ralph, M. A., Williams, G., Antoun, N., et al. (2001b). Differing patterns of temporal atrophy in Alzheimer’s disease and semantic dementia. Neurology 57, 216–225. doi: 10.1212/wnl.57.2.216
Gonzalez-Reyes, R. E., Nava-Mesa, M. O., Vargas-Sanchez, K., Ariza-Salamanca, D., and Mora-Munoz, L. (2017). Involvement of astrocytes in Alzheimer’s Disease from a neuroinflammatory and oxidative stress perspective. Front. Mol. Neurosci. 10:427. doi: 10.3389/fnmol.2017.00427
Guo, L., Lin, W., Zhang, Y., Li, W., and Wang, J. (2019). BEST: a web server for brain expression Spatio-temporal pattern analysis. BMC Bioinformatics 20:632. doi: 10.1186/s12859-019-3222-6
Haroutunian, V., Katsel, P., and Schmeidler, J. (2009). Transcriptional vulnerability of brain regions in Alzheimer’s disease and dementia. Neurobiol. Aging 30, 561–573. doi: 10.1016/j.neurobiolaging.2007.07.021
Hopper, M. W., and Vogel, F. S. (1976). The limbic system in Alzheimer’s disease. A neuropathologic investigation. Am. J. Pathol. 85, 1–20.
Hu, R. T., Yu, Q., Zhou, S. D., Yin, Y. X., Hu, R. G., Lu, H. P., et al. (2020). Co-expression network analysis reveals novel genes underlying Alzheimer’s disease pathogenesis. Front. Aging Neurosci. 12:605961. doi: 10.3389/fnagi.2020.605961
Huang da, W., Sherman, B. T., and Lempicki, R. A. (2009). Systematic and integrative analysis of large gene lists using DAVID bioinformatics resources. Nat. Protoc. 4, 44–57. doi: 10.1038/nprot.2008.211
Irizarry, R. A., Hobbs, B., Collin, F., Beazer-Barclay, Y. D., Antonellis, K. J., Scherf, U., et al. (2003). Exploration, normalization, and summaries of high density oligonucleotide array probe level data. Biostatistics 4, 249–264. doi: 10.1093/biostatistics/4.2.249
Jacobs, H. I., Van Boxtel, M. P., Heinecke, A., Gronenschild, E. H., Backes, W. H., Ramakers, I. H., et al. (2012). Functional integration of parietal lobe activity in early Alzheimer disease. Neurology 78, 352–360. doi: 10.1212/wnl.0b013e318245287d
Jansen, I. E., Savage, J. E., Watanabe, K., Bryois, J., Williams, D. M., Steinberg, S., et al. (2019). Genome-wide meta-analysis identifies new loci and functional pathways influencing Alzheimer’s disease risk. Nat. Genet. 51, 404–413.
Jing, Z., Caltagarone, J., and Bowser, R. (2009). Altered subcellular distribution of c-Abl in Alzheimer’s disease. J. Alzheimers Dis. 17, 409–422. doi: 10.3233/jad-2009-1062
Jonsson, P. F., and Bates, P. A. (2006). Global topological features of cancer proteins in the human interactome. Bioinformatics 22, 2291–2297. doi: 10.1093/bioinformatics/btl390
Kao, Y. H., Chou, M. C., Chen, C. H., and Yang, Y. H. (2019). White matter changes in patients with Alzheimer’s Disease and associated factors. J. Clin. Med. 8:167.
Kelly, J., Moyeed, R., Carroll, C., Luo, S., and Li, X. (2020). Genetic networks in Parkinson’s and Alzheimer’s disease. Aging (Albany NY) 12, 5221–5243.
Kim, K. H., Moon, M., Yu, S. B., Mook-Jung, I., and Kim, J. I. (2012). RNA-Seq analysis of frontal cortex and cerebellum from 5XFAD mice at early stage of disease pathology. J. Alzheimers Dis. 29, 793–808. doi: 10.3233/jad-2012-111793
Kirby, L., Jin, J., Cardona, J. G., Smith, M. D., Martin, K. A., Wang, J., et al. (2019). Oligodendrocyte precursor cells present antigen and are cytotoxic targets in inflammatory demyelination. Nat. Commun. 10:3887.
Kitamura, Y., Shimohama, S., Ota, T., Matsuoka, Y., Nomura, Y., and Taniguchi, T. (1997). Alteration of transcription factors NF-kappaB and STAT1 in Alzheimer’s disease brains. Neurosci. Lett. 237, 17–20. doi: 10.1016/s0304-3940(97)00797-0
Kornblith, S., Quian Quiroga, R., Koch, C., Fried, I., and Mormann, F. (2017). Persistent single-neuron activity during working memory in the human medial temporal lobe. Curr. Biol. 27, 1026–1032. doi: 10.1016/j.cub.2017.02.013
Krauthausen, M., Kummer, M. P., Zimmermann, J., Reyes-Irisarri, E., Terwel, D., Bulic, B., et al. (2015). CXCR3 promotes plaque formation and behavioral deficits in an Alzheimer’s disease model. J. Clin. Invest. 125, 365–378. doi: 10.1172/jci66771
Kuan, P. F., Clouston, S., Yang, X., Che, C., Gandy, S., Kotov, R., et al. (2021). Single-cell transcriptomics analysis of mild cognitive impairment in World Trade Center disaster responders. Alzheimers Dement (Amst) 13, e12154.
Kunkle, B. W., Grenier-Boley, B., Sims, R., Bis, J. C., Damotte, V., Naj, A. C., et al. (2019). Genetic meta-analysis of diagnosed Alzheimer’s disease identifies new risk loci and implicates Abeta, tau, immunity and lipid processing. Nat. Genet. 51, 414–430.
Lancaster, J. L., Woldorff, M. G., Parsons, L. M., Liotti, M., Freitas, C. S., Rainey, L., et al. (2000). Automated Talairach atlas labels for functional brain mapping. Hum. Brain Mapp. 10, 120–131. doi: 10.1002/1097-0193(200007)10:3<120::aid-hbm30>3.0.co;2-8
Langfelder, P., and Horvath, S. (2008). WGCNA: an R package for weighted correlation network analysis. BMC Bioinformatics 9:559. doi: 10.1186/1471-2105-9-559
Laske, C., Stellos, K., Eschweiler, G. W., Leyhe, T., and Gawaz, M. (2008). Decreased CXCL12 (SDF-1) plasma levels in early Alzheimer’s disease: a contribution to a deficient hematopoietic brain support? J. Alzheimers Dis 15, 83–95. doi: 10.3233/jad-2008-15107
Leng, F., and Edison, P. (2021). Neuroinflammation and microglial activation in Alzheimer disease: where do we go from here? Nat. Rev. Neurol. 17, 157–172. doi: 10.1038/s41582-020-00435-y
Li, X. G., Hong, X. Y., Wang, Y. L., Zhang, S. J., Zhang, J. F., Li, X. C., et al. (2019). Tau accumulation triggers STAT1-dependent memory deficits by suppressing NMDA receptor expression. EMBO Rep. 20:e47202.
Liang, J. W., Fang, Z. Y., Huang, Y., Liuyang, Z. Y., Zhang, X. L., Wang, J. L., et al. (2018). Application of weighted gene co-expression network analysis to explore the key genes in Alzheimer’s Disease. J. Alzheimers Dis. 65, 1353–1364. doi: 10.3233/jad-180400
Mateos, L., Ismail, M. A., Gil-Bea, F. J., Leoni, V., Winblad, B., Bjorkhem, I., et al. (2011). Upregulation of brain renin angiotensin system by 27-hydroxycholesterol in Alzheimer’s disease. J. Alzheimers Dis. 24, 669–679. doi: 10.3233/jad-2011-101512
McKhann, G. M., Knopman, D. S., Chertkow, H., Hyman, B. T., Jack, C. R. Jr., Kawas, C. H., et al. (2011). The diagnosis of dementia due to Alzheimer’s disease: recommendations from the National Institute on Aging-Alzheimer’s Association workgroups on diagnostic guidelines for Alzheimer’s disease. Alzheimers Dement 7, 263–269.
Meyer, K., Feldman, H. M., Lu, T., Drake, D., Lim, E. T., Ling, K. H., et al. (2019). REST and neural gene network dysregulation in ipsc models of Alzheimer’s Disease. Cell Rep 26, 1112–1127 e1119.
Mirnics, K., Korade, Z., Arion, D., Lazarov, O., Unger, T., Macioce, M., et al. (2005). Presenilin-1-dependent transcriptome changes. J. Neurosci. 25, 1571–1578. doi: 10.1523/jneurosci.4145-04.2005
Nasrabady, S. E., Rizvi, B., Goldman, J. E., and Brickman, A. M. (2018). White matter changes in Alzheimer’s disease: a focus on myelin and oligodendrocytes. Acta Neuropathol. Commun. 6:22.
Naya, Y., Chen, H., Yang, C., and Suzuki, W. A. (2017). Contributions of primate prefrontal cortex and medial temporal lobe to temporal-order memory. Proc. Natl. Acad. Sci. U.S.A. 114, 13555–13560. doi: 10.1073/pnas.1712711114
Nestor, P. J., Fryer, T. D., Smielewski, P., and Hodges, J. R. (2003). Limbic hypometabolism in Alzheimer’s disease and mild cognitive impairment. Ann. Neurol. 54, 343–351. doi: 10.1002/ana.10669
Novikova, G., Kapoor, M., Tcw, J., Abud, E. M., Efthymiou, A. G., Chen, S. X., et al. (2021). Integration of Alzheimer’s disease genetics and myeloid genomics identifies disease risk regulatory elements and genes. Nat. Commun. 12:1610.
Oeckl, P., Halbgebauer, S., Anderl-Straub, S., Steinacker, P., Huss, A. M., Neugebauer, H., et al. (2019). Glial fibrillary acidic protein in serum is increased in Alzheimer’s Disease and correlates with cognitive impairment. J. Alzheimers Dis. 67, 481–488. doi: 10.3233/jad-180325
Orre, M., Kamphuis, W., Dooves, S., Kooijman, L., Chan, E. T., Kirk, C. J., et al. (2013). Reactive glia show increased immunoproteasome activity in Alzheimer’s disease. Brain 136, 1415–1431. doi: 10.1093/brain/awt083
Parodi-Rullan, R., Sone, J. Y., and Fossati, S. (2019). Endothelial mitochondrial dysfunction in cerebral amyloid angiopathy and Alzheimer’s Disease. J. Alzheimers Dis. 72, 1019–1039. doi: 10.3233/jad-190357
Passamonti, L., Tsvetanov, K. A., Jones, P. S., Bevan-Jones, W. R., Arnold, R., Borchert, R. J., et al. (2019). Neuroinflammation and functional connectivity in Alzheimer’s Disease: interactive influences on cognitive performance. J. Neurosci. 39, 7218–7226. doi: 10.1523/jneurosci.2574-18.2019
Patel, H., Dobson, R. J. B., and Newhouse, S. J. (2019). A meta-analysis of alzheimer’s disease brain transcriptomic data. J. Alzheimers Dis. 68, 1635–1656. doi: 10.3233/jad-181085
Pentz, R., Iulita, M. F., Ducatenzeiler, A., Bennett, D. A., and Cuello, A. C. (2020). The human brain NGF metabolic pathway is impaired in the pre-clinical and clinical continuum of Alzheimers disease. Mol. Psychiatry. doi: 10.1038/s41380-020-0797-2 [Epub ahead of print].
Peters, F., Collette, F., Degueldre, C., Sterpenich, V., Majerus, S., and Salmon, E. (2009). The neural correlates of verbal short-term memory in Alzheimer’s disease: an fMRI study. Brain 132, 1833–1846. doi: 10.1093/brain/awp075
Price, J. L., Mckeel, D. W. Jr., Buckles, V. D., Roe, C. M., Xiong, C., Grundman, M., et al. (2009). Neuropathology of nondemented aging: presumptive evidence for preclinical Alzheimer disease. Neurobiol. Aging 30, 1026–1036. doi: 10.1016/j.neurobiolaging.2009.04.002
Quintela-Lopez, T., Ortiz-Sanz, C., Serrano-Regal, M. P., Gaminde-Blasco, A., Valero, J., Baleriola, J., et al. (2019). Abeta oligomers promote oligodendrocyte differentiation and maturation via integrin beta1 and Fyn kinase signaling. Cell Death Dis. 10:445.
Ravasz, E., Somera, A. L., Mongru, D. A., Oltvai, Z. N., and Barabasi, A. L. (2002). Hierarchical organization of modularity in metabolic networks. Science 297, 1551–1555. doi: 10.1126/science.1073374
Richiardi, J., Altmann, A., Milazzo, A. C., Chang, C., Chakravarty, M. M., Banaschewski, T., et al. (2015). BRAIN NETWORKS. Correlated gene expression supports synchronous activity in brain networks. Science 348, 1241–1244.
Ritchie, S. C., Watts, S., Fearnley, L. G., Holt, K. E., Abraham, G., and Inouye, M. (2016). A scalable permutation approach reveals replication and preservation patterns of network modules in large datasets. Cell Syst. 3, 71–82. doi: 10.1016/j.cels.2016.06.012
Roy, E. R., Wang, B., Wan, Y. W., Chiu, G., Cole, A., Yin, Z., et al. (2020). Type I interferon response drives neuroinflammation and synapse loss in Alzheimer disease. J. Clin. Invest. 130, 1912–1930. doi: 10.1172/jci133737
Sachdev, P. S., Zhuang, L., Braidy, N., and Wen, W. (2013). Is Alzheimer’s a disease of the white matter? Curr. Opin. Psychiatry 26, 244–251.
Seyfried, N. T., Dammer, E. B., Swarup, V., Nandakumar, D., Duong, D. M., Yin, L., et al. (2017). A Multi-network approach identifies protein-specific co-expression in asymptomatic and symptomatic Alzheimer’s Disease. Cell Syst. 4, 60–72 e64.
Shannon, P., Markiel, A., Ozier, O., Baliga, N. S., Wang, J. T., Ramage, D., et al. (2003). Cytoscape: a software environment for integrated models of biomolecular interaction networks. Genome Res. 13, 2498–2504. doi: 10.1101/gr.1239303
Snow, A. D., Mar, H., Nochlin, D., Kresse, H., and Wight, T. N. (1992). Peripheral distribution of dermatan sulfate proteoglycans (decorin) in amyloid-containing plaques and their presence in neurofibrillary tangles of Alzheimer’s disease. J. Histochem. Cytochem. 40, 105–113. doi: 10.1177/40.1.1370306
Soleimani Zakeri, N. S., Pashazadeh, S., and Motieghader, H. (2020). Gene biomarker discovery at different stages of Alzheimer using gene co-expression network approach. Sci. Rep. 10:12210.
Sperling, R. A., Aisen, P. S., Beckett, L. A., Bennett, D. A., Craft, S., Fagan, A. M., et al. (2011). Toward defining the preclinical stages of Alzheimer’s disease: recommendations from the National Institute on Aging-Alzheimer’s Association workgroups on diagnostic guidelines for Alzheimer’s disease. Alzheimers Dement 7, 280–292.
Sun, J., Jia, P., Fanous, A. H., Van Den Oord, E., Chen, X., Riley, B. P., et al. (2010). Schizophrenia gene networks and pathways and their applications for novel candidate gene selection. PLoS One 5:e11351. doi: 10.1371/journal.pone.0011351
Sweeney, M. D., Sagare, A. P., and Zlokovic, B. V. (2018). Blood-brain barrier breakdown in Alzheimer disease and other neurodegenerative disorders. Nat. Rev. Neurol. 14, 133–150. doi: 10.1038/nrneurol.2017.188
Szklarczyk, D., Gable, A. L., Lyon, D., Junge, A., Wyder, S., Huerta-Cepas, J., et al. (2019). STRING v11: protein-protein association networks with increased coverage, supporting functional discovery in genome-wide experimental datasets. Nucleic Acids Res. 47, D607–D613.
Tang, R., and Liu, H. (2019). Identification of temporal characteristic networks of peripheral blood changes in Alzheimer’s Disease based on weighted gene co-expression network analysis. Front. Aging Neurosci. 11:83. doi: 10.3389/fnagi.2019.00083
Toro-Dominguez, D., Martorell-Marugan, J., Lopez-Dominguez, R., Garcia-Moreno, A., Gonzalez-Rumayor, V., Alarcon-Riquelme, M. E., et al. (2019). ImaGEO: integrative gene expression meta-analysis from GEO database. Bioinformatics 35, 880–882. doi: 10.1093/bioinformatics/bty721
Vaz, A. P., Inati, S. K., Brunel, N., and Zaghloul, K. A. (2019). Coupled ripple oscillations between the medial temporal lobe and neocortex retrieve human memory. Science 363, 975–978. doi: 10.1126/science.aau8956
Visser, P. J., Verhey, F. R., Hofman, P. A., Scheltens, P., and Jolles, J. (2002). Medial temporal lobe atrophy predicts Alzheimer’s disease in patients with minor cognitive impairment. J. Neurol. Neurosurg. Psychiatry 72, 491–497.
Vong, K. I., Ma, T. C., Li, B., Leung, T. C. N., Nong, W., Ngai, S. M., et al. (2021). SOX9-COL9A3-dependent regulation of choroid plexus epithelial polarity governs blood-cerebrospinal fluid barrier integrity. Proc. Natl. Acad. Sci. U.S.A. 118:e2009568118. doi: 10.1073/pnas.2009568118
Wang, M., Roussos, P., Mckenzie, A., Zhou, X., Kajiwara, Y., Brennand, K. J., et al. (2016). Integrative network analysis of nineteen brain regions identifies molecular signatures and networks underlying selective regional vulnerability to Alzheimer’s disease. Genome Med. 8:104.
Woodling, N. S., Wang, Q., Priyam, P. G., Larkin, P., Shi, J., Johansson, J. U., et al. (2014). Suppression of Alzheimer-associated inflammation by microglial prostaglandin-E2 EP4 receptor signaling. J. Neurosci. 34, 5882–5894. doi: 10.1523/jneurosci.0410-14.2014
Xu, M., Zhang, D. F., Luo, R., Wu, Y., Zhou, H., Kong, L. L., et al. (2018). A systematic integrated analysis of brain expression profiles reveals YAP1 and other prioritized hub genes as important upstream regulators in Alzheimer’s disease. Alzheimers Dement 14, 215–229. doi: 10.1016/j.jalz.2017.08.012
Zhang, B., and Horvath, S. (2005). A general framework for weighted gene co-expression network analysis. Stat. Appl. Genet. Mol. Biol. 4:17.
Zhang, B., Gaiteri, C., Bodea, L. G., Wang, Z., Mcelwee, J., Podtelezhnikov, A. A., et al. (2013). Integrated systems approach identifies genetic nodes and networks in late-onset Alzheimer’s disease. Cell 153, 707–720.
Zhang, Q., Ma, C., Gearing, M., Wang, P. G., Chin, L. S., and Li, L. (2018). Integrated proteomics and network analysis identifies protein hubs and network alterations in Alzheimer’s disease. Acta Neuropathol. Commun. 6:19.
Keywords: Alzheimer’s disease, spatiotemporal specific coexpression networks, network preservation analysis, immune response-related pathways, non-neuron cells, key genes
Citation: Guo L, Liu Y and Wang J (2021) Preservation Analysis on Spatiotemporal Specific Co-expression Networks Suggests the Immunopathogenesis of Alzheimer’s Disease. Front. Aging Neurosci. 13:727928. doi: 10.3389/fnagi.2021.727928
Received: 20 June 2021; Accepted: 12 August 2021;
Published: 03 September 2021.
Edited by:
Guanghui Wang, Soochow University, ChinaReviewed by:
Aarti Mishra, AbbVie, United StatesGang Zuo, The First People’s Hospital of Taicang, China
Copyright © 2021 Guo, Liu and Wang. This is an open-access article distributed under the terms of the Creative Commons Attribution License (CC BY). The use, distribution or reproduction in other forums is permitted, provided the original author(s) and the copyright owner(s) are credited and that the original publication in this journal is cited, in accordance with accepted academic practice. No use, distribution or reproduction is permitted which does not comply with these terms.
*Correspondence: Jing Wang, wangjing@psych.ac.cn; Liyuan Guo, guoly@psych.ac.cn
†These authors have contributed equally to this work and share first authorship