Molecular Pathobiology of the Cerebrovasculature in Aging and in Alzheimers Disease Cases With Cerebral Amyloid Angiopathy
 Joseph O. Ojo1,2,3*
  Jon M. Reed1,4 Gogce Crynen1 Prashanthi Vallabhaneni1 James Evans1 Benjamin Shackleton1,3 Maximillian Eisenbaum1,3 Charis Ringland1,3 Anastasia Edsell1 Michael Mullan1,3 Fiona Crawford1,2,3 Corbin Bachmeier1,3,5
- 1Roskamp Institute, Sarasota, FL, United States
- 2James A. Haley Veterans' Hospital, Tampa, FL, United States
- 3The Open University, Milton Keynes, United Kingdom
- 4Boehringer Ingelheim Pharmaceuticals, Inc., Ridgefield, CT, United States
- 5Bay Pines VA Healthcare System, Bay Pines, FL, United States
Cerebrovascular dysfunction and cerebral amyloid angiopathy (CAA) are hallmark features of Alzheimer's disease (AD). Molecular damage to cerebrovessels in AD may result in alterations in vascular clearance mechanisms leading to amyloid deposition around blood vessels and diminished neurovascular-coupling. The sequelae of molecular events leading to these early pathogenic changes remains elusive. To address this, we conducted a comprehensive in-depth molecular characterization of the proteomic changes in enriched cerebrovessel fractions isolated from the inferior frontal gyrus of autopsy AD cases with low (85.5 ± 2.9 yrs) vs. high (81 ± 4.4 yrs) CAA score, aged-matched control (87.4 ± 1.5 yrs) and young healthy control (47 ± 3.3 yrs) cases. We employed a 10-plex tandem isobaric mass tag approach in combination with our ultra-high pressure liquid chromatography MS/MS (Q-Exactive) method. Enriched cerebrovascular fractions showed very high expression levels of proteins specific to endothelial cells, mural cells (pericytes and smooth muscle cells), and astrocytes. We observed 150 significantly regulated proteins in young vs. aged control cerebrovessels. The top pathways significantly modulated with aging included chemokine, reelin, HIF1α and synaptogenesis signaling pathways. There were 213 proteins significantly regulated in aged-matched control vs. high CAA cerebrovessels. The top three pathways significantly altered from this comparison were oxidative phosphorylation, Sirtuin signaling pathway and TCA cycle II. Comparison between low vs. high CAA cerebrovessels identified 84 significantly regulated proteins. Top three pathways significantly altered between low vs. high CAA cerebrovessels included TCA Cycle II, Oxidative phosphorylation and mitochondrial dysfunction. Notably, high CAA cases included more advanced AD pathology thus cerebrovascular effects may be driven by the severity of amyloid and Tangle pathology. These descriptive proteomic changes provide novel insights to explain the age-related and AD-related cerebrovascular changes contributing to AD pathogenesis. Particularly, disturbances in energy bioenergetics and mitochondrial biology rank among the top AD pathways altered in cerebrovessels. Targeting these failed mechanisms in endothelia and mural cells may provide novel disease modifying targets for developing therapeutic strategies against cerebrovascular deterioration and promoting cerebral perfusion in AD. Our future work will focus on interrogating and validating these novel targets and pathways and their functional significance.
Introduction
Alzheimer's disease (AD) is a chronic age-related neurodegenerative disorder and the predominant type of dementia, marked by deposits of amyloid plaques and neurofibrillary tangles composed of hyperphosphorylated tau (Holtzman et al., 2012). To date AD remains untreatable, with very few disease modifying therapeutic approaches advancing into human clinical trials. There is thus an urgent need to identify new biological perspectives behind the neurological dysfunction and underlying etiology of AD.
One of the most common pathological features of AD is vascular dysfunction (De La Torre, 2010). Neuroimaging abnormalities have demonstrated early preclinical features such as cerebral perfusion and metabolic deficits (De la Torre and Mussivand, 1993; de la Torre, 2018), and diminished cortical blood flow beginning many years prior to the onset of neurological symptoms (Binnewijzend et al., 2016; Hays et al., 2016). One of the most common vascular associated lesions in AD is cerebral amyloid angiopathy (CAA), typified by the accumulation of Aβ in leptomeninges and along cerebral blood vessels. Seminal findings from the Nun study also reported lacunar infarcts as a prominent vascular lesion that reduces the neuropathological threshold required for defining the staging of AD neuropathology (Snowdon, 1997). Similar large cohort aging studies have likewise confirmed the presence of underlying cerebrovascular abnormalities such as cerebrovascular small vessel disease (CSVD) lesions as a strong predictor of clinical presentation or cognitive deficits in AD patients (Nagy et al., 1997). Moreover, vascular dementia and AD related dementia both share a significant degree of overlap in their clinical and neuropathological profiles (Kalaria and Ballard, 1999; Kalaria, 2003; Erkinjuntti et al., 2004; Custodio et al., 2017).
At autopsy, other vascular associated morphological lesions can be observed in aging and AD brains such as degeneration of arterioles and leptomeningeal vessels (Vinters et al., 1994; Kalaria, 1996; Farkas and Luiten, 2001), capillaries and mural cells (Miyakawa and Kuramoto, 1989; Hashimura et al., 1991; Kimura et al., 1991; Farkas et al., 2000; Østergaard et al., 2013); mitochondria abnormalities and deposition of phagolysosomes and lipofuscin in cerebrovascular cells (Miyakawa and Kuramoto, 1989); degeneration of the blood brain barrier (Deane and Zlokovic, 2007), arteriolar wall thickening or arteriolosclerosis (Neltner et al., 2014; Blevins et al., 2021), propensity for plaque build up in cerebral arteries(Roher et al., 2004; Beach et al., 2007; Yarchoan et al., 2012), immune cell recruitment and influx of blood borne proteins (Itagaki et al., 1988; Rogers et al., 1988; Togo et al., 2002; Grammas et al., 2006; Di Marco et al., 2015; Merlini et al., 2018).
The consequences of these early vascular changes may significantly impact amyloid clearance and ultimately neuronal metabolism and cerebral brain function (Mosconi, 2005; Mawuenyega et al., 2010). Likewise, amyloid deposition on vascular walls can also induce changes contributing to narrowing and weakening of the vascular wall leading to increased cerebral blood pressure (Kalback et al., 2004; Tian et al., 2004). Whether vascular dysfunction is a prelude to AD pathogenesis or a consequence remains elusive (Govindpani et al., 2019). Understanding the molecular response of the cerebrovasculature during the sequelae of normal aging and AD pathogenesis may provide clues as to the etiology of vascular dysfunction in AD.
Advances in omic approaches has enabled interrogation of different brain regions of AD cases across the neuropathological staging of the disease and age matched healthy controls (Johnson et al., 2018, 2020; Bai et al., 2020). Unbiased proteomic analysis is an extremely powerful tool which can provide a very expansive interrogation of the molecular response in neurodegenerative diseases and can lead to identification of pathogenic mechanisms and novel molecular targets for therapeutic exploration (Zhang et al., 2008). However, very few studies have explored the molecular integrity of the cerebrovasculature in aging and AD.
To address this, we will use our state-of-the-art unbiased proteomic (mass spectrometry) based platform to conduct a detailed characterization and assessment of molecular changes in protein expression levels, cellular origin of proteomic changes, molecular pathways and biofunctions significantly altered in the cerebrovasculature isolated from AD patients compared to aged matched control cases. To further understand the contribution of age, we will also interrogate cases from young (40-50's) compared to aged (70's-90's) control cases.
We utilize a novel protein extraction protocol, separating isolated cerebrovascular samples into cytosolic, membrane and nuclear fractions to increase the depth of the protein mining process, and coupled this with a 10-plex tandem isobaric mass tag (TMT) approach for interrogation with an ultra-high pressure liquid chromatography MS/MS (Q-Exactive) method. We detail the unique and common molecular profiles and pathogenic mechanisms driving cerebrovascular changes in the inferior frontal gyrus of young vs. aged brains, and CAA staged AD vs. age-matched control cases.
Methods
Human Tissue and Patient Demographics
Frozen human cortex tissue samples (from the inferior frontal gyrus) were provided mainly from Dr. Thomas Beach, Director of the Brain and Body Donation Program at Sun Health Research Institute (Sun City, AZ) in accordance with the institutional bioethics guidelines. Additional samples were requested from the NIH BrainBank repository (University of Maryland and Ican school of medicine, Mount Sinai, NY). The donors and their respective families provided hand written informed consent for autopsy and the subsequent use of brain tissue for research purposes. For this study, no further ethical approval was required as samples were obtained from deceased, de-identified, and consenting individuals. Neuropathological post-mortem diagnosis of AD (i.e., amyloid plaque and Tangle pathology) was determined using the Consortium to Establish a Registry for Alzheimer's Disease (CERAD) diagnostic criteria and the consensus recommendation by the National Institute for Aging/Reagan Institute Working Group. Braak staging was used to characterize the geographic spread of neurofibrillary tangle pathology (NFT). The severity of CAA was performed according to Vonsattel et al. (1991), and the stage of topographical expansion of CAA was assessed as previously described by Thal et al. (2003) based on a four point numerical conversion per region. Global scores for amyloid, tangle and CAA burden from the microscopic lesion densities were calculated based on the sums of the scores from all regions interrogated. A summary of patient demographics, and clinical information of brain donors used in this proteomic study is provided in Table 1.
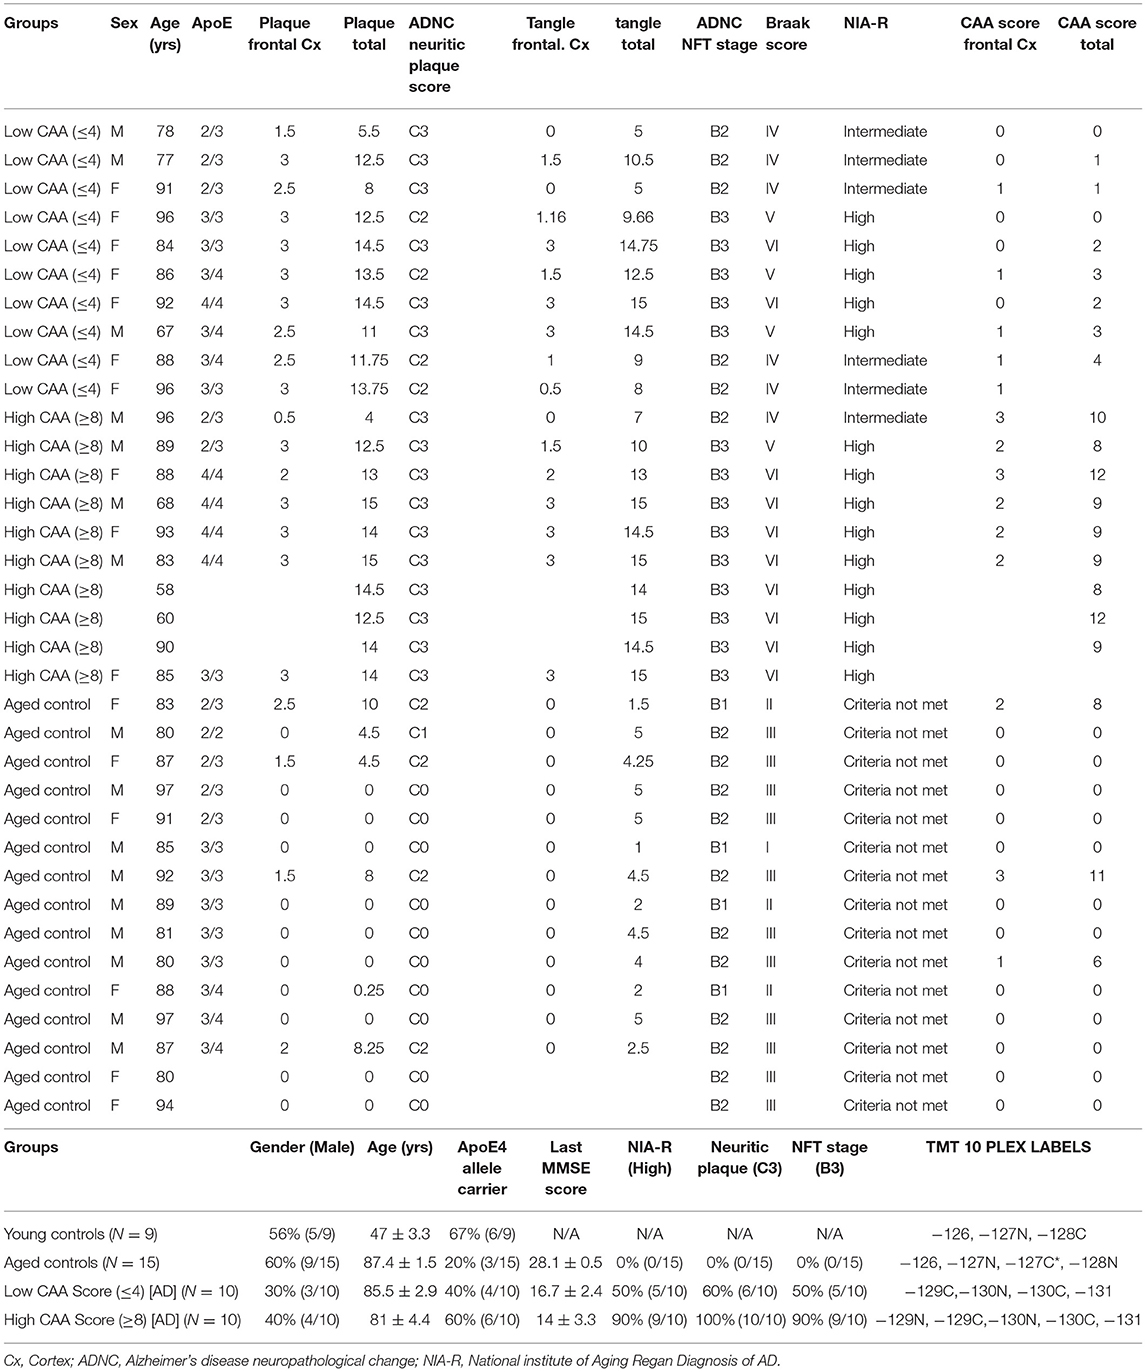
Table 1. List of control and Alzheimer's disease cases, their demographics, clinical background, APOE genotype, neuropathological score, and randomization of samples for Tandem Mass Tag isobaric 10-plex multiplexing.
Isolation of Enriched Cerebrovessel Fractions
The enriched cerebrovasculature was isolated from the inferior frontal gyrus brain tissue as previously characterized and described by our group (Alonzo et al., 1998; Ojo et al., 2021). Briefly, frozen blocks of brain tissue (500 mg) from the inferior frontal gyrus was homogenized in ice-cold Hanks Buffered salt solution (HBBS) in a glass dounce homogenizer, using 6-8 passes of a Teflon pestle tissue grinder. Forty percent dextran solution was added to the brain homogenate at an equal volume in a 15 ml falcon tube, to generate a final concentration of 20% dextran, which was subsequently centrifuged at 6,000 g for 15 mins at 4°C. Three visible layers were produced in the 15 ml falcon tube after centrifugation; the top layer consisted of a compact mass (i.e., paraenchyma fraction), the bottom layer consisted of a tissue pellet (i.e., the cerebrovasculature fraction), and this was separated by a middle layer of translucent dextran interface (i.e., non-cell associated soluble fraction). For subsequent analyses we used the bottom layer consisting of the whole cerebrovascular fraction, containing vessels of a variety of sizes (microvessels, arterioles, etc.). This fraction is highly enriched in endothelial and mural cells (i.e., pericytes and smooth muscle cells) and other perivascular cell types (e.g., astrocytes etc.).
Subcellular Protein Extraction From Vascular Homogenates
Two hundred and fifty microliters of ice cold phosphate buffered saline (PBS) was added to each cerebrovascular pellet, followed by homogenization using a probe sonicator and subsequent centrifugation at 20,000 g for 5 mins at 4°C. Supernatant was collected in a different Eppendorf tube to obtain the PBS-fraction. Pelleted samples were re-suspended in 250 ul of ice cold PBS containing 1M sodium chloride, further sonicated and centrifuged at 20,000 g for 5 mins at 4°C. Supernatant was collected in a different Eppendorf tube and labeled as PBS-high salt fraction. The precipitant was resuspended in 250 ul of ice cold 20 mM Triethylamonium bicarbonate (TEAB) and 2% lithium dodecylsulphate anionic detergent, sonicated, and also followed by centrifugation at 20,000 g for 5 mins at 4°C. Final supernatant was transferred to a new Eppendorf tube and labeled as the membrane protein pellet fraction. PBS, PBS-high salt and membrane fractions (i.e., cytosolic, nuclear and membrane proteins) were used in the entire study to enhance the proteomic mining process.
Trypsin Digestion
Twelve and a half microliters of 21x proteinase inhibitor cocktail was added to 250 ul of the PBS, PBS-high salt and membrane protein fractions, followed by BCA analyses to determine protein concentration. For the PBS fraction, 30 ug protein was added to 3x volume of acetone, and left to incubate at −20°C for 1 h. Following centrifugation at 14,000 g for 1.5 mins at room temperature, pelleted samples were brought up in 2 0ul modified reduction alkylation buffer (MRAB) consisting of 20 mM TEAB at pH 8, 1% w/v sodium deoxycholate (SDC), 1 mM tris (2-carboxyethyl) phosphine (TCEP), and 2.5 mM 2-chloroacetamide (CAM). For the PBS-high salt fraction, 30u g protein was added to 1 in 5 parts of 20% w/v Trichloroacetic acid (TCA) and 3x volume of acetone, and left to incubate on ice for 1 h. Following centrifugation at 14,000 g for 1.5 mins at room temperature, pelleted samples were washed with 200 ul of acetone and pelleted material brought up in 20 ul MRAB. For the membrane protein pellet fraction, 30 ug protein was added to 20% of 100% w/v Trichloroacetic acid (TCA), and left to incubate on ice for 1 h. Following centrifugation at 14,000 g for 1.5 mins at room temperature, pelleted samples were also washed with 200 ul of acetone and pelleted material resolubilized in 20 ul of MRAB. Validation of protein separation in all three protein fractions was conducted using sypro-red and Coomassie staining for total protein after polyacrylamide gel electrophoresis. Seven and a half microliters of all three protein fractions underwent trypsin digestion at a 1:100 enzymatic concentration. Firstly, re-suspended samples in MRAB were incubated at 37°C for 30 min; 7.5 ul of prepared activated trypsin solution (Promega, WI, USA) was added to re-suspended samples, and further incubated overnight at 37°C while shaking mildly. Digested samples were stored at −80°C prior to TMT labeling.
Tandem Mass Tag (TMT) Labeling Strategy
We used a multiplexed isobaric labeling approach to allow for simultaneous identification and quantification of proteins from multiple biological samples. A 10-plex TMT labeling kit (ThermoScientific, NJ, USA) was used for analyses of protein samples from AD/controls and Aged/Young and an aged-matched control sample was used as a reference sample per plex for normalization of data and as a reference point for the different runs. This labeling strategy allowed for all different groups to be randomized and analyzed within the same batch. All samples and isobaric label tags were handled blind to the experimenter. Twenty microliter aliquots of each label (dissolved in 20 ul of acetonitrile solution) were dried down in the speed vacuum and re-suspended in 25 mM TEAB made up in acetonitrile solution. Re-suspended labels were subsequently added to 10 ul of dried digested protein samples, and allowed to incubate for 1 h at room temperature, after which 1 ul of formic acid solution was added to stop the reaction. Labeled samples were pooled together in entire batches and subsequently dried in the speed vacuum.
Sodium Deoxycholate (SDC) and Tetraethylammonium Bromide (TEAB) Clean Up
To remove traces of SDC and TEAB, protein samples were re-suspended in 100 ul of 1% formic acid solution and centrifuged at 15,000 rpm for 1 min to allow separation into different phases. Supernatants were collected in new Eppendorf tubes, and 200 ul of ethyl acetate was added, and centrifuged at 15,000 rpm with the upper organic layer discarded. This process was repeated three separate times, with the final lower phase taken to dryness in the speed vacuum. The resultant dried samples were re-solubilized in 100 ul of 0.1% formic acid.
Purification and Concentration of Peptides
Prior to ultra-high pressure liquid chromatography (UHPLC), single step desalting, concentration and purification of peptides were conducted using 0.6ul C18 resin Ziptips (ThermoScientific, NJ, USA). Briefly, ziptips pipette tips were used to remove contaminants by aspirating and dispensing in a solution of 0.1% formic acid made up in 50% acetonitrile (i.e., wetting buffer), and afterwards in a solution containing 0.1% formic acid (i.e., binding buffer). Ziptips were used for sample binding, by aspirating and dispensing through the samples multiple times. The resultant concentrated and purified labeled samples were aspirated in a solution of 5% methanol and 0.1% formic acid (i.e., washing buffer), followed by elution in a solvent containing 10 ul of 0.1% formic acid made up in 50% acetonitrile (wetting buffer). After desalting and concentrating peptides, final samples were dried and re-suspended in 20 ul of 0.1% formic acid and subsequently transferred into an auto-sampler vial, and analyzed by nano-Ultra-Performance Liquid Chromatography (UPLC) MS on a Q-Exactive Orbitrap instrument (ThermoScientific, NJ, USA).
Chromatography and Mass Spectrometry (LC-MS/MS) Methods
Protein samples were analyzed using LC-MS/MS (Q-Exactive). Data dependent acquisition (DDA) settings for these MS experiments followed our previous work (Ojo et al., 2020; Pearson et al., 2020). DDA settings were as follows: full-scan MS resolution = 140 000 full width at half maximum at 200 m/z, full-scan range = 380–1250 m/z, isolation width = 1.2 m/z, higher energy C-trap dissociation relative collision energy = 29, a minimum m/z setting of 100 m/z was used for all MS2 spectra, MS2 resolution = 17 500, dynamic exclusion = 180 s, and a Top 15 high/low duty cycle was used for precursor ion selection. We used a narrow isolation window and an ultra-long gradient setting to minimize the deleterious effects on quantitative accuracy that typically result from co-isolation of isobaric precursors without resorting to MS3-based method.
Data Processing and Statistical Analysis of Proteomics Data
We surveyed our amalgamated data-files and added other modifications to our search criteria if deemed necessary, using the PMi preview software. Preview results were used to choose the precursor and fragment ion mass tolerances (4-ppm, 0.02-Da, respectively) and dynamic modifications. We used the following settings to search the data using SEQUEST and BYONIC as the search algorithms, and Uniprot human database (FEB/2018). Dynamic modifications –Oxidation/+15.995 Da (M), Methyl/+14.016 Da (E), Deamidated/+0.984 Da (N, Q), static modifications of TMT10plex/+229.163 Da (N-Terminus, K), Carbamidomethyl +57.021 (C). Only unique peptides were considered for our final quantification. We used the Percolator feature of Proteome Discoverer for SEQUEST, and used the target-decoy feature, to set a false discovery rate (FDR) of 0.01 for Byonic. The peptides passing this stringent cutoff FDR rate were subsequently exported for data cleaning and statistical analysis. Master proteins only underwent quantitative analysis if they were identified in at least 50% of the total number of plexes. Log2 fold change and expression p-value between the two groups of interest after log transformation and parametric analyses were subsequently uploaded into ingenuity pathway analyses (IPA) where molecules and pathways, diseases and biofunctions, associated networks and upstream regulators unique to each group comparison(s) were identified. Only master proteins with a significant non-adjusted p-value (cut-off <0.05) were uploaded into IPA. We have deposited the mass spectrometry proteomic data into the ProteomeXchange Consortium via the PRIDE partner repository (Vizcaíno et al., 2016). Our datasets can be located with the unique identifier—PXD023340.
Ingenuity Pathway Analysis
All datasets of significantly modulated proteins from our group comparisons were uploaded into the Ingenuity Pathway Analysis software [IPA, Ingenuity® Systems (Krämer et al., 2014)] to map them onto known networks of protein interactions in the knowledgebase. We further used the IPA knowledgebase to further determine the significantly regulated Canonical pathways/disease and biofunctions and biological significance of CAA/AD and age dependent changes in the cerebrovasculature. Our core analysis settings involved the following—Ingenuity Knowledge base as reference set, maximum number of 35 molecules per network, and a maximum number of 25 networks for analysis. Only experimentally observed knowledge was considered in our analyses. We controlled for data sources, species, and tissue type/cell lines at the time of analysis in IPA. Core analysis identified canonical pathways shown to be significantly altered in response to age and CAA/AD pathogenesis as a result of significantly regulated proteins represented in those pathways/biofunctions. Statistical significance of the relationship between uploaded dataset and the identified pathways/biofunctions was measured using two methods: 1) Ratio of the number of molecules from the data set that map to a pathway/biofunction divided by the total number of molecules in that pathway/ biofunction knowledgebase in IPA. 2) Fisher's exact test, to calculate a p-value determining the probability that the association between the proteins in the dataset and the pathway/biofunctions are explained by chance alone. P-values were considered to be significant in these studies when P < 0.01. Upstream regulator analysis was used to predict the upstream transcriptional master regulators in our proteomic dataset, and this was generated using the Ingenuity® Knowledge Base. An overlap P*value was generated based on analyses of the significant overlap between proteins/genes in our dataset and known targets modulated by the transcriptional regulator or Upstream master regulator. The activation z-score algorithm was used to make predictions. For the network analysis, a p-score [–log10 (p-value)] according to the fit of the set of supplied proteins and a list of biological functions stored in the Ingenuity Knowledge Base were generated. An experimentally set confidence with only the inclusion of human data and a size constraint of 35 focus molecules per network was applied as described above. We considered both direct and indirect relationships for the network analysis.
Results
Demographics and Clinical Background of Patient Population
In this study, we used 44 total brain cerebrovascular specimens from the inferior frontal gyrus obtained from young healthy controls (9 cases), aged non-demented controls (15 cases) and Alzheimer's disease (AD) patients (20 cases; 10 cases each with Low or High CAA score) — (Table 1).
Most of the AD cases and matched aged non-demented control cases comprised of septuagenarians and octogenarians (Table 1). On average, aged non-demented control cases (87.4 ± 1.5 yrs) were older than both AD cases with low (85.5 ± 2.9 yrs) and high (81 ± 4.4 yrs) CAA scores. While, the young control group had an average age of 45.83 ± 4.39 yrs. Each group consisted of mixed genders, and on average, there were more female in the AD cases (30-40% males) than the control cases (56-60% males)—(Table 1).
AD cases with low or high CAA scores consisted of 40% or 67% APOE4 allele carriers, respectively; while only 20% of aged non-demented control cases were APOE4 allele carriers. The young healthy control cohort consisted of 60% APOE4 allele carriers (Table 1).
No statistical difference was observed in CAA score for AD cases with low CAA staging compared to their age matched counterparts (Figure 1A). However, there was a significant reduction in brain weight (Figure 1B), and a significant increase in Amyloid Plaque and Tangle pathology in low CAA [AD] cases compared to matched controls (Figures 1C–F).
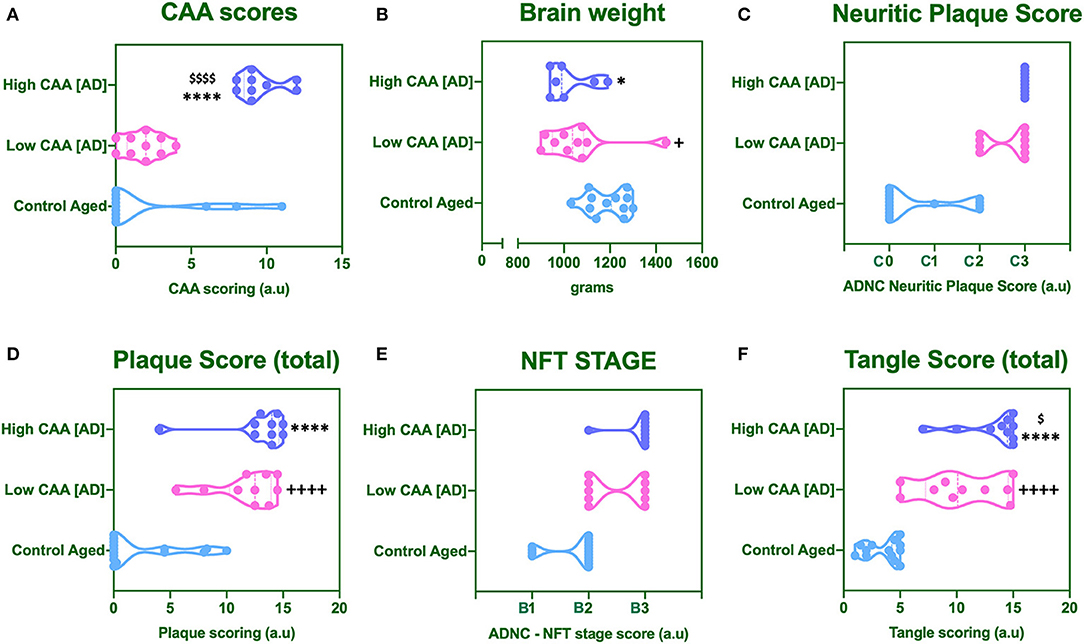
Figure 1. Cerebral amyloid angiopathy [CAA] (A), mean brain weight in grams (B) and neuropathological scores for Neuritic Plaque (C), Total Amyloid plaque score (D), NFT staging (E), and total tangle pathology score (F). Data was analyzed by one way ANOVA with Holm-Sidak post-hoc test. *P < 0.05 and ****P < 0.0001 (for Control Aged vs. High CAA group); +P < 0.05 and ++++P < 0.0001 (for Control Aged vs. Low CAA group); $P < 0.05, and $$$$P < 0.0001 (for Low vs. High CAA group).
There was a significant reduction in the brain weight of high CAA compared to aged matched controls (Figure 1B). There was also a significant increase in Amyloid plaque and Tangle pathology (Figures 1C–F), accompanied by the lowest performances in the last MMSE scores (see Table 1).
Only Tangle pathology was found to be statistically significant between low vs. high CAA Alzheimer's disease cases (Figure 1F).
Proteomic Profiles, Cell Type Specific Changes, Altered Canonical Pathways and Upstream Regulators Between Young vs. Aged Control Cerebrovascular Tissue
A Ten multiplex TMT isobaric tag approach was used to study the proteomic profiles of brain cerebrovascular tissue from the inferior frontal gyrus of AD and non-demented young and aged-matched control cases. We identified a total of 13,760 total peptide spectrum matches and 1,271 non-redundant master protein groups (Figure 2A). To determine the cell type constituents of our enriched cerebrovascular tissue we identified cell specific protein markers in our proteomic dataset using the single cell sequencing resource from the PanglaoDB omic database. We measured the relative protein expression levels of these specific markers associated with these different cell types in control cases, and observed that there was a relatively high expression of markers associated with pericytes (AOC3, COL1A1, MYO1B) and endothelia (CLEC14A, VWF, Cav1, PLEC) in our enriched cerebrovascular fractions (Figures 2B,C). In rank order, this was followed by smooth muscle cells (EHD2, ITGA1, MTL9), astrocyte (GFAP, AQP4, S100β, APOE) and oligodendrocytes (CNP, PLP1, MBP)–Figure 2C. Neurons and microglia specific markers were also observed but showed very low expression levels relative to the other cell types above (Figure 2C).
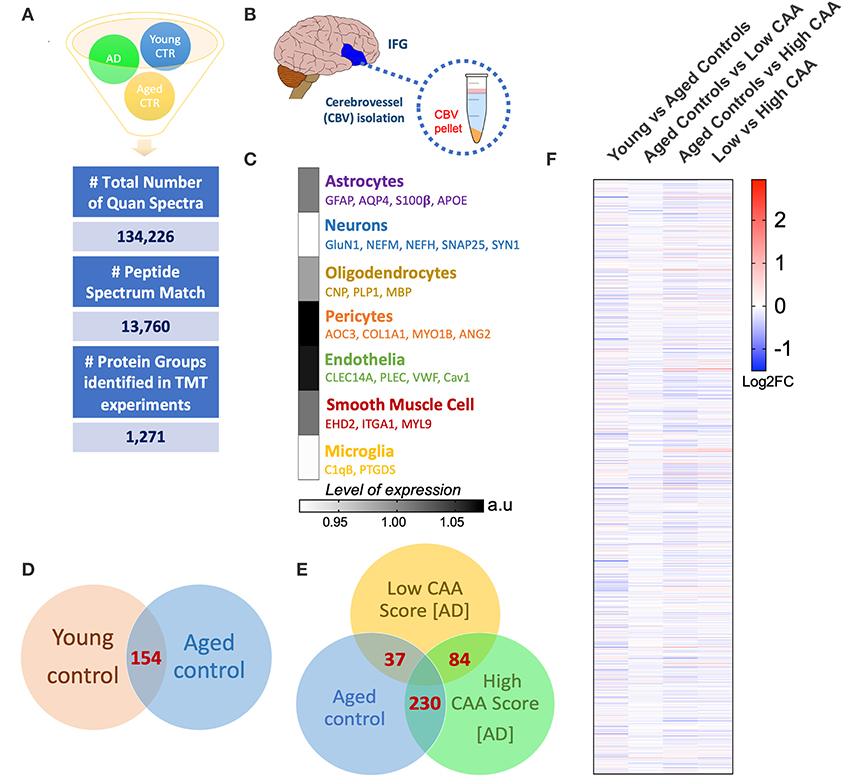
Figure 2. Summary of liquid chromatography/mass spectrometry (LC/MS) and proteomic analyses of isolated cerebrovascular tissue from the inferior frontal gyrus in Alzheimer's disease (AD) and young/aged matched control cases. (A) Shows identified total number of quantified spectra, peptide spectrum matches and non-redundant master protein groups from all plexes used for quantitative proteomic analyses of (B) isolated cerebrovascular tissue from the inferior frontal gyrus [IFG]. (C) Data shows expression levels of distinct genes associated with specific cell types identified from our proteomic analyses of the isolated cerebrovasculature. Data represent abundant ratio expressed in arbitrary units. Venn diagram in (D,E) shows overlapping significantly regulated proteins by t-test in the comparisons between young vs. aged healthy controls cases and Low CAA vs. High CAA vs. Age-matched controls, respectively. (F) Shows heat map of proteins identified from our proteomic analyses between young vs. aged controls, aged control vs. low CAA, aged controls vs. high CAA and low vs. high CAA groups (data represent Log2 fold change).
Statistical analyses of the proteomic datasets first involved comparing significant changes in master proteins between young vs. aged control cases. We noted 154 significant proteins out of 1,271 that were significantly altered between young vs. aged control cases (see Venn diagram in Figures 2D,F). Volcano plot in Figure 3A depicts the correlation between Log2 fold change and negative Log10 p-value of the (total and significantly regulated) master proteins identified in our proteomic analyses; 81 proteins were significantly upregulated while 73 proteins were significantly downregulated (Figure 3A; see pie chart inset). The List of the Top 20 proteins significantly altered between young vs. aged control cases is shown in Table 2. For a complete list of all proteins, see Supplementary Table 1, corresponding protein network interaction can also be found in Supplementary Figure 1.
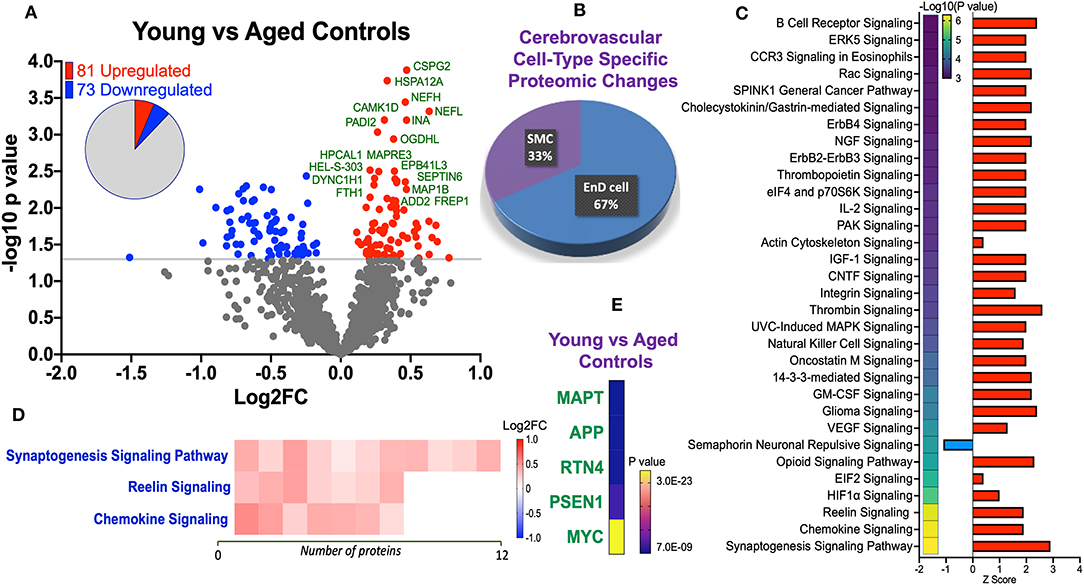
Figure 3. Proteomic changes, cell origin, signaling pathways, upstream regulator factors observed in the cerebrovasculature isolated from the inferior frontal gyrus of young and aged controls. (A) Volcano plot of differentially expressed proteins in young and aged controls (pie chart inset shows up/down-regulated proteins, significant cut off set at 1.3 and red and blue points indicated up- or down-regulated significant proteins, respectively). (B) Pie Chart show origin of cell types where significant proteins from the comparisons between young and aged controls are observed. Data are generated from the number of significantly regulated proteins per specific cell type (from the PanglaoDB omic database), expressed as a percentage. (C) Canonical pathways identified from ingenuity pathway analyses [data depict –log10 (P-value) and Z score generated from Fischer test of an overlap with the IPA knowledgebase; blue—downregulated and red—upregulated], and (D) shows heat map of the top 3 pathways and the corresponding number of significantly regulated proteins altered per pathway and their Log2 fold change expression level. (E) Shows Top 5 identified upstream regulators from the ingenuity pathway analyses of differentially regulated proteins in young vs. aged control cases.
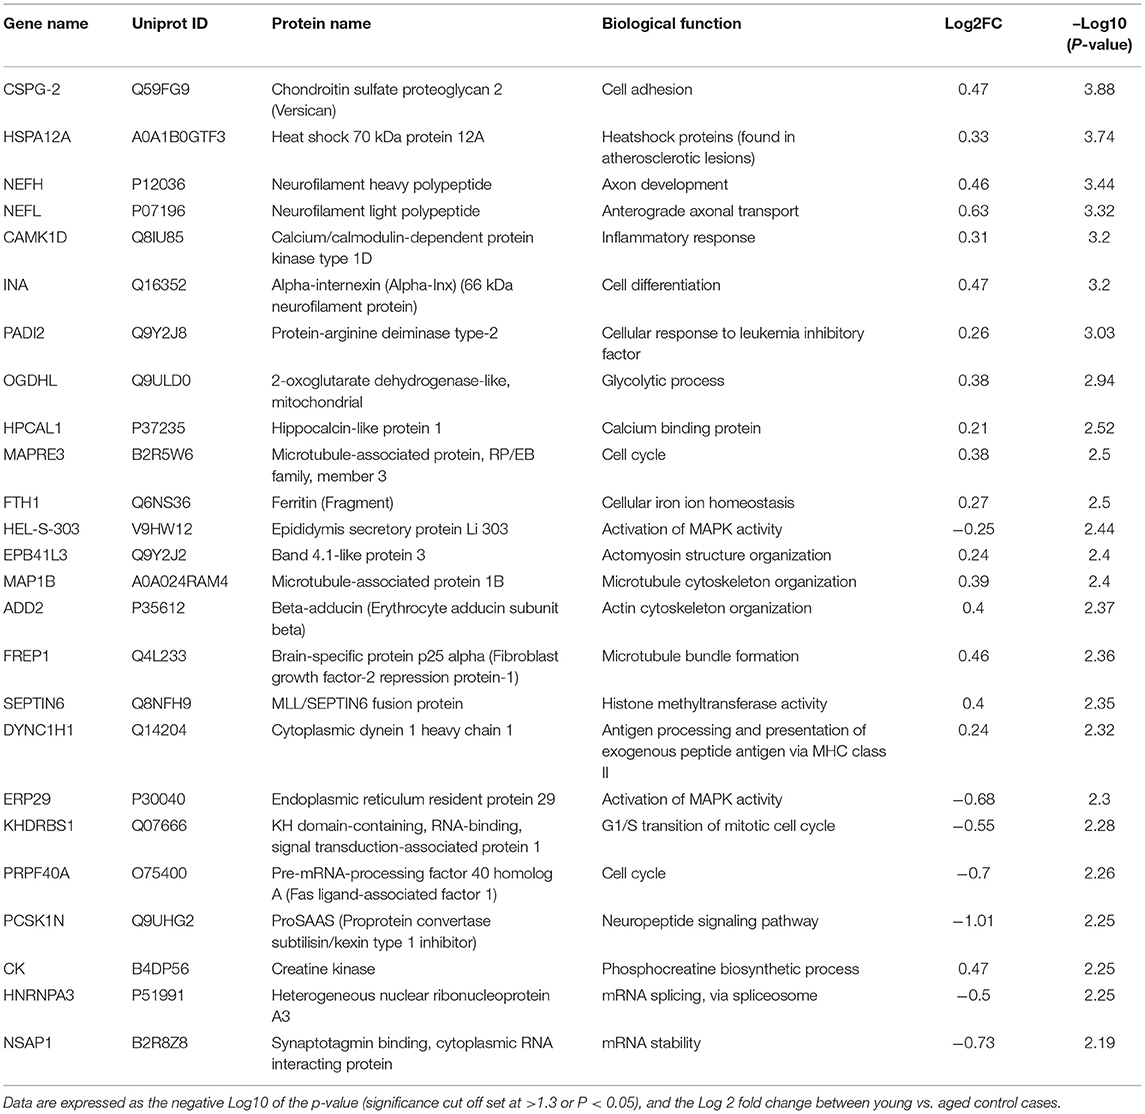
Table 2. List of Top 25 proteins significantly regulated in the inferior frontal gyrus cerebrovasculature of young and aged control cases.
The majority of these proteomic changes were attributed to cytoskeletal, cytosolic, nuclear and extracellular cell membrane proteins, including proteins associated with mitochondrial bioenergetics (Figure 4A).

Figure 4. Ratio of significantly regulated proteins per subcellular localization or biological function and Cell specific proteins expression levels identified in cerebrovasculature of young and aged controls, and AD cases staged by low vs. high CAA score. (A) Data shows percentage of significantly altered proteins associated with a biological function or subcellular localization. ECM—Extracellular matrix protein, CAM—cellular adhesion molecule. (B) Data shows cell specific proteins expression levels. Proteins in red represents smooth muscle cell markers, purple (astrocytes), yellow (microglia), pericytes (green), blue (endothelial cells). Data shows Log2 fold change (note: not all cell specific proteins depicted passed the set cut-off value of P < 0.05).
From the list of 154 proteins significantly regulated, we identified the number of proteins that were known to specifically originate from a particular cerebrovascular cell type, and expressed this as a percentage, to capture the specific contribution of each cerebrovascular cell type in our proteomic findings. We observed that most of the significant changes (P < 0.05) in our proteomic datasets between young vs. aged control cases were associated with endothelial cell specific markers (67%) and smooth muscle cell markers (33%) (Figures 3B, 4B).
Ingenuity pathway analyses (IPA) identified 32 pathways significantly impacted between young vs. aged control cases (Figure 3C). The top 3 pathways include downregulation of synaptogenesis signaling pathways, Reelin signaling and Chemokine signaling. Heat map in Figure 3D, shows the number of proteins associated with these Top three pathways, and their directionality of change.
We interrogated the Top 5 Upstream Regulators mediating the changes observed in significantly regulated proteins identified from our analyses (Figure 3E). IPA analyses identified a significant overlap in our dataset and known targets regulated by these five Upstream regulators, namely (in rank order of significance)–MAPT (microtubule associated protein tau), APP (amyloid precursor protein), RTN4 (Reticulon 4 or Nogo), PSEN1 (Presenilin 1), and MYC (Proto-Oncogene, BHLH Transcription Factor).
Proteomic Profiles, Cell Type Specific Changes, Altered Canonical Pathways, and Upstream Regulators Between AD (Low CAA Score) vs. Aged-Matched Control Cerebrovascular Tissue
Despite the profound clinicopathological differences observed between AD cases with low CAA compared to their age-matched counterparts, at the vascular level, we only observed 37 significant proteins out of 1,271 that were significantly altered (see Venn diagram in Figures 2E,F). Volcano plot in Figure 5A depicts the correlation between Log2 fold change and negative Log10 p-value of the (total and significantly regulated) master proteins identified in our proteomic analyses; seven proteins were significantly upregulated while 30 proteins were significantly downregulated (Figure 5A; see pie chart inset). The List of the Top 20 proteins significantly altered between Low CAA [AD] vs. age-matched control is shown in Table 3. For a complete list of all proteins, see Supplementary Table 2, corresponding protein network interaction can also be found in Supplementary Figure 2.
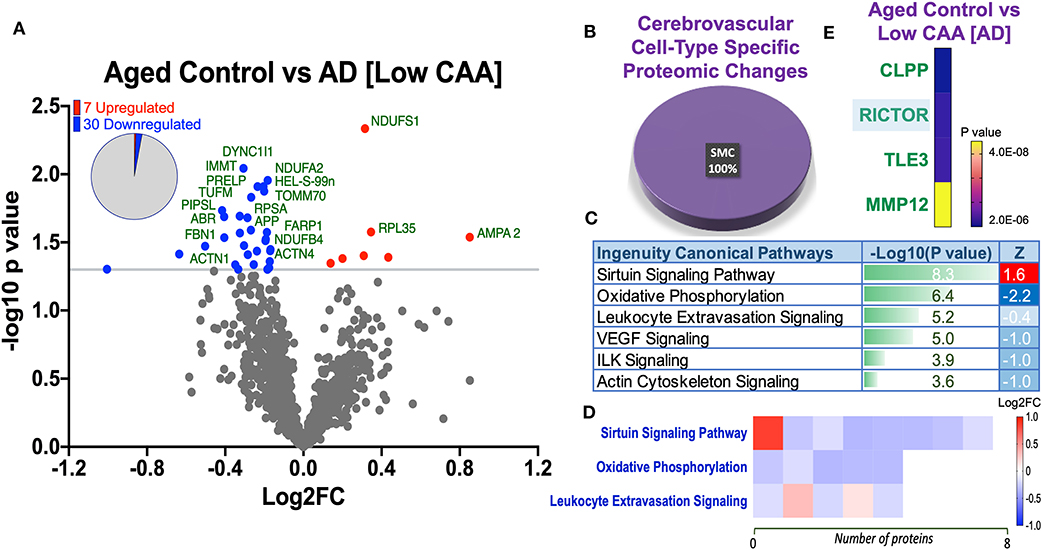
Figure 5. Proteomic changes, cell origin, signaling pathways, upstream regulator factors observed from the cerebrovasculature isolated from the inferior frontal gyrus of low CAA vs. aged-matched control cases. (A) Volcano plot of differentially expressed proteins in low CAA vs. aged-matched control cases (pie chart inset shows up/down-regulated proteins, significant cut off set at 1.3 and red and blue points indicated up- or down-regulated significant proteins, respectively). (B) Pie Chart show origin of cell types where significant proteins from the comparisons between low CAA vs. aged-matched control cases are observed. Data are generated from the number of significantly regulated proteins per specific cell type (from the PanglaoDB omic database), expressed as a percentage. (C) Canonical pathways identified from ingenuity pathway analyses [data depict –log10 [P-value] and Z score generated from Fischer test of an overlap with the IPA knowledgebase; blue—downregulated and red—upregulated], and (D) shows heat map of the top 3 pathways and the corresponding number of significantly regulated proteins altered per pathway and their Log2 fold change expression level. (E) Shows Top 4 identified upstream regulators from the ingenuity pathway analyses of differentially regulated proteins in low CAA vs. aged-matched control cases (light blue highlighted text indicates that the upstream regulator is predicted to be activated).
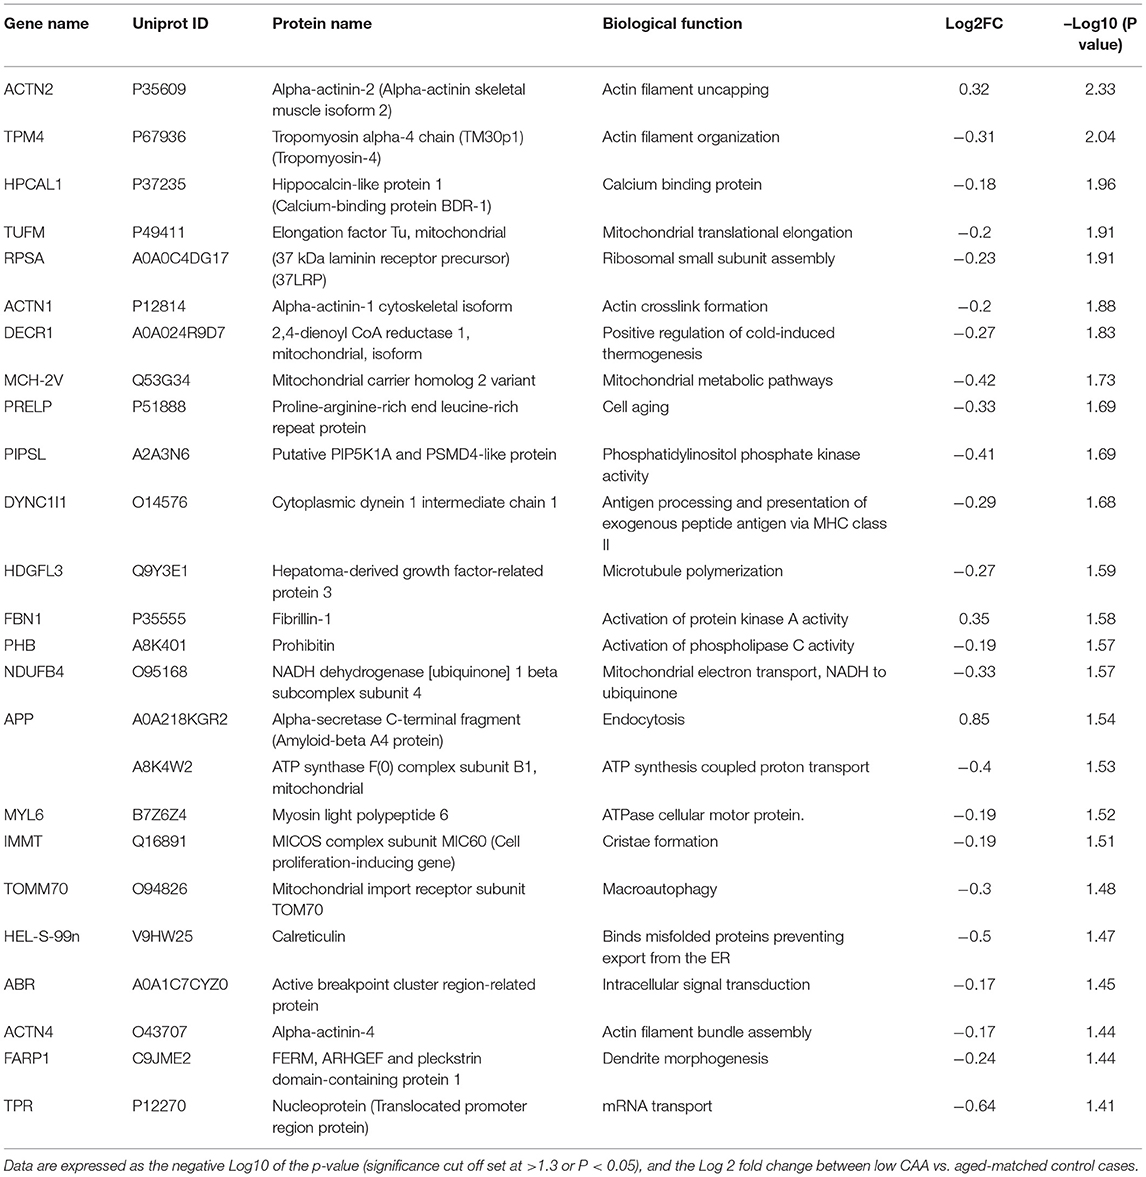
Table 3. List of Top 25 proteins significantly regulated in the inferior frontal gyrus cerebrovasculature of low CAA vs. aged-matched control cases.
The majority of these proteomic changes were also attributed to cytoskeletal, cytosolic and extracellular cell membrane proteins, including proteins associated with mitochondrial bioenergetics (Figure 4A).
From the list of 37 proteins significantly regulated between AD (low CAA score) vs. aged-matched controls, we observed that most of the significant changes (P < 0.05) were associated primarily with smooth muscle cell specific markers (Figures 4B, 5B).
Ingenuity pathway analyses (IPA) identified 6 pathways significantly impacted between AD (low CAA score) vs. aged-matched controls (Figure 5C). The top 3 pathways include alteration in sirtuin signaling, oxidative phosphorylation and leukocyte extravasation signaling. Heat map in Figure 5D, shows the number of proteins associated with these Top three pathways, and their corresponding fold-change.
IPA analyses identified CLPP (Caseinolytic Mitochondrial Matrix Peptidase Proteolytic Subunit), RICTOR (rapamycin-insensitive companion of mammalian target of rapamycin), TLE3 (Transducin-like enhancer protein 3), and MMP12 (matrix metalloproteinase protein 12) as the top four Upstream Regulators driving the proteomic changes between AD (low CAA score) vs. aged-matched controls (Figure 5E).
Proteomic Profiles, Cell Type Specific Changes, Altered Canonical Pathways, and Upstream Regulators Between AD (High CAA Score) vs. Aged-Matched Control Cerebrovascular Tissue
We noted 230 significant proteins out of 1,271 were significantly altered between AD (high CAA score) vs. aged-matched control (see Venn diagram in Figures 2E,F). Volcano plot in Figure 6A depicts the correlation between Log2 fold change and negative Log10 p-value of the (total and significantly regulated) master proteins identified in our proteomic analyses; 21 proteins were significantly upregulated while 209 proteins were significantly downregulated (Figure 6A; see pie chart inset). The List of the Top 20 proteins significantly altered between high CAA [AD] vs. age-matched control is shown in Table 4. For a complete list of all proteins, see Supplementary Table 3, corresponding protein network interaction can also be found in Supplementary Figure 3.
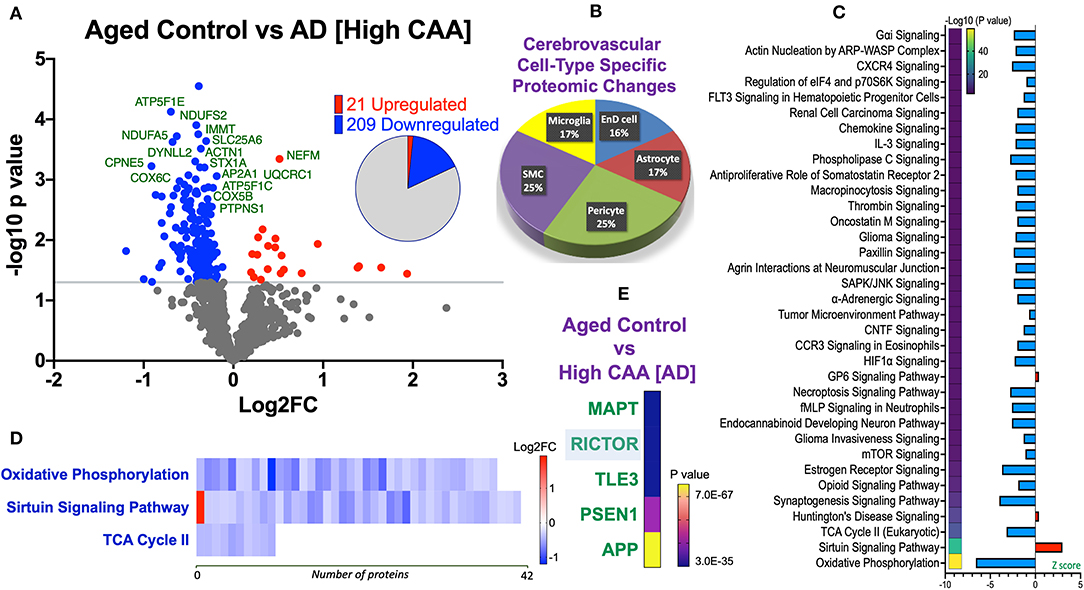
Figure 6. Proteomic changes, cell origin, signaling pathways, upstream regulator factors observed from the cerebrovasculature isolated from the inferior frontal gyrus of high CAA vs. aged-matched control cases. (A) Volcano plot of differentially expressed proteins in high CAA vs. aged-matched control cases (pie chart inset shows up/down-regulated proteins, significant cut off set at 1.3 and red and blue points indicated up- or down-regulated significant proteins, respectively). (B) Pie Chart show origin of cell types where significant proteins from the comparisons between high CAA vs. aged-matched control cases are observed. Data are generated from the number of significantly regulated proteins per specific cell type (from the PanglaoDB omic database), expressed as a percentage. (C) Canonical pathways identified from ingenuity pathway analyses [data depict –log10 (P-value) and Z score generated from Fischer test of an overlap with the IPA knowledgebase; blue—downregulated and red—upregulated], and (D) shows heat map of the top 3 pathways and the corresponding number of significantly regulated proteins altered per pathway and their Log2 fold change expression level. (E) Shows Top 5 identified upstream regulators from the ingenuity pathway analyses of differentially regulated proteins in high CAA vs. aged-matched control cases (light blue highlighted text indicates that the upstream regulator is predicted to be activated).
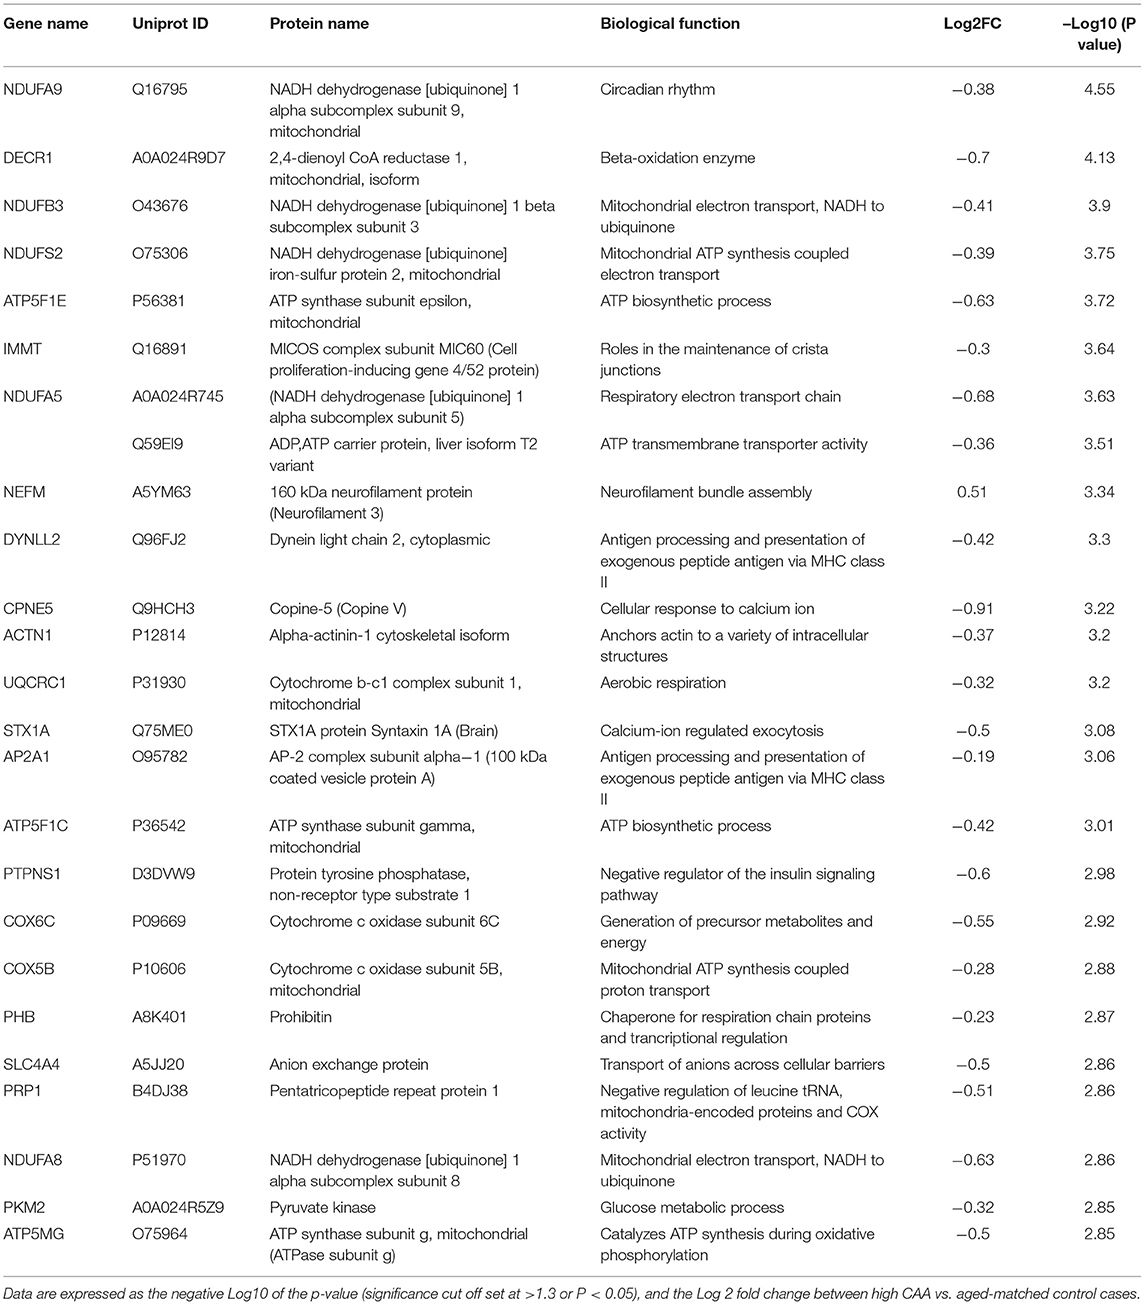
Table 4. List of Top 25 proteins significantly regulated in the inferior frontal gyrus cerebrovasculature of high CAA vs. aged-matched control cases.
The majority of these proteomic changes were also attributed to cytoskeletal, cytosolic and extracellular cell membrane proteins, including also modest involvement of proteins associated with cell adhesion molecules and mitochondrial bioenergetics, and nuclear proteins (Figure 4A).
From the list of 230 proteins significantly regulated between AD (high CAA score) vs. aged-matched controls, we observed that most of the significant changes (P < 0.05) were associated with pericytes and smooth muscle cells (both 25%), perivascular astrocytes and microglia/macrophage (both 17%) and endothelial cell specific markers (16%) (Figures 4B, 6B).
Ingenuity pathway analyses (IPA) identified 35 pathways significantly impacted between AD (high CAA score) vs. aged-matched controls (Figure 6C). The top 3 pathways include alterations in oxidative phosphorylation, Sirtuin signaling and TCA cycle II. Heat map in Figure 6D, shows the number of proteins associated with these top 3 pathways, and their corresponding fold-change.
IPA analyses identified MAPT (microtubule associated protein tau), RICTOR (rapamycin-insensitive companion of mammalian target of rapamycin), TLE3 (Transducin-like enhancer protein 3), PSEN1 (Presenilin 1) and APP (amyloid precursor protein) as the top five Upstream Regulators driving the proteomic changes between AD (high CAA score) vs. aged-matched controls (Figure 6E).
Proteomic Profiles, Cell Type Specific Changes, Altered Canonical Pathways, and Upstream Regulators Between Low vs. High CAA Alzheimer's Disease Cerebrovascular Tissue
Eighty four significant proteins out of 1,271 were significantly altered between low vs. high CAA Alzheimer's disease cerebrovascular tissue (see Venn diagram in Figures 2E,F). Volcano plot in Figure 7A depicts the correlation between Log2 fold change and negative Log10 p-value of the (total and significantly regulated) master proteins identified in our proteomic analyses; 16 proteins were significantly upregulated while 68 proteins were significantly downregulated (Figure 7A; see pie chart inset). The List of the Top 20 proteins significantly altered between low vs. high CAA Alzheimer's disease cerebrovascular tissue is shown in Table 5. For a complete list of all proteins, see Supplementary Table 4, corresponding protein network interaction can also be found in Supplementary Figure 4.
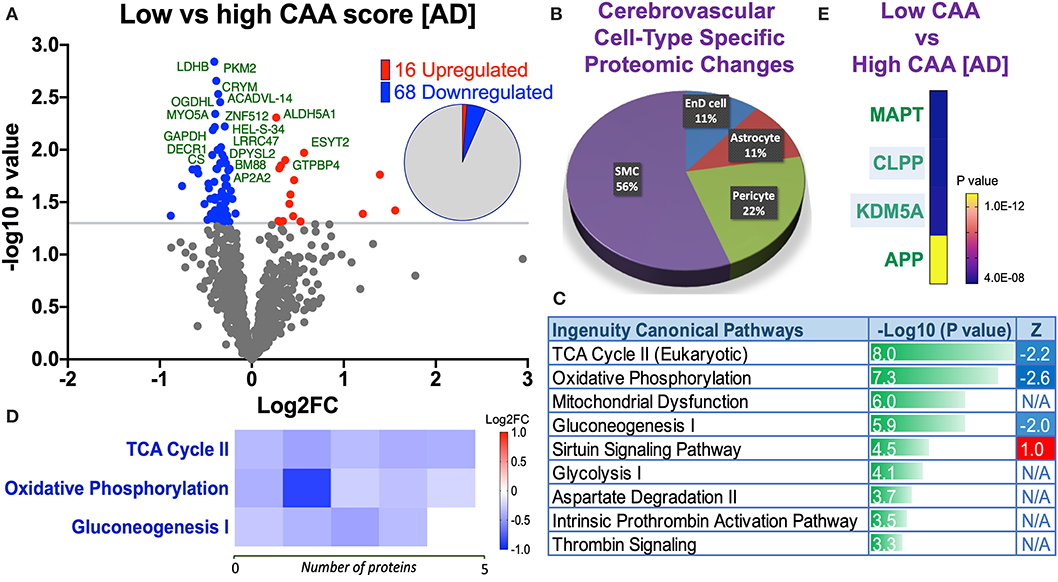
Figure 7. Proteomic changes, cell origin, signaling pathways, upstream regulator factors observed from the cerebrovasculature isolated from the inferior frontal gyrus of low and high CAA [AD] cases. (A) Volcano plot of differentially expressed proteins in low vs. high CAA [AD] cases (pie chart inset shows up/down-regulated proteins, significant cut off set at 1.3 and red and blue points indicated up- or down-regulated significant proteins, respectively). (B) Pie Chart show origin of cell types where significant proteins from the comparisons between low and high CAA [AD] cases are observed. Data are generated from the number of significantly regulated proteins per specific cell type (from the PanglaoDB omic database), expressed as a percentage. (C) Canonical pathways identified from ingenuity pathway analyses (data depict –log10 [P-value] and Z score generated from Fischer test of an overlap with the IPA knowledgebase; blue—downregulated and red—upregulated), and (D) shows heat map of the top 3 pathways and the corresponding number of significantly regulated proteins altered per pathway and their Log2 fold change expression level. (E) Shows Top 4 identified upstream regulators from the ingenuity pathway analyses of differentially regulated proteins in low and high CAA [AD] cases (light blue highlighted text indicates that the upstream regulator is predicted to be activated).
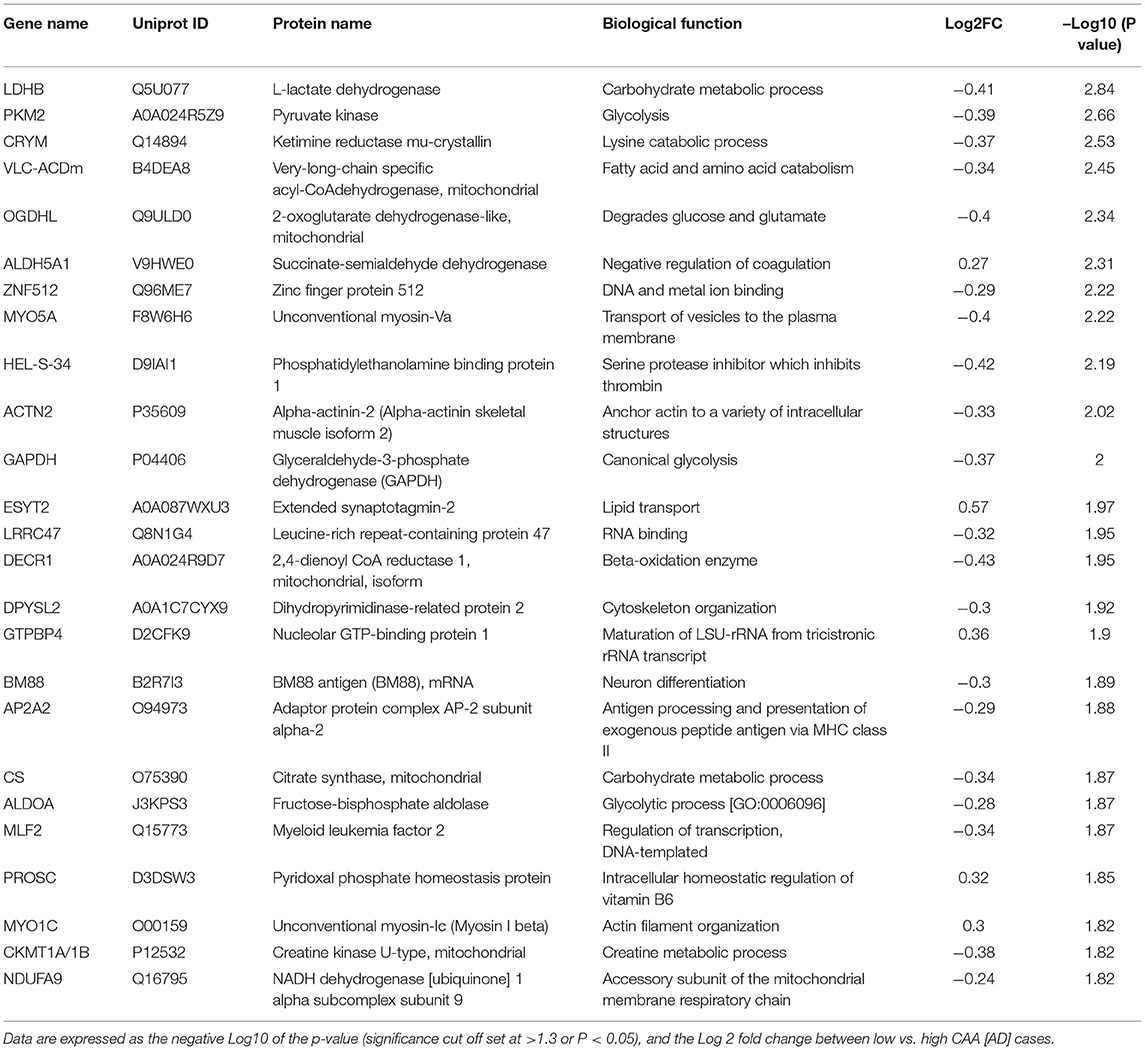
Table 5. List of Top 25 proteins significantly regulated in the inferior frontal gyrus cerebrovasculature of low vs. high CAA [AD] cases.
The majority of these proteomic changes were also attributed to cytoskeletal, cytosolic and extracellular cell membrane proteins, including also involvement of proteins associated with cell adhesion molecules and mitochondrial bioenergetics, and nuclear proteins (Figure 4A).
From the list of 84 proteins significantly regulated between low vs. high CAA Alzheimer's disease cerebrovascular tissue, we observed that most differentially significant changes (P < 0.05) were associated with smooth muscle cells (56%), followed by pericytes (22%), and astrocytes/endothelial cell specific markers (each 11%) (Figures 4B, 7B).
Ingenuity pathway analyses (IPA) identified 9 pathways significantly between low vs. high CAA Alzheimer's disease cerebrovascular tissue (Figure 7C). The top 3 pathways include alterations in TCA cycle II oxidative phosphorylation and mitochondrial dysfunction/gluconeogenesis. Heat map in Figure 7D, shows the number of proteins associated with these top 3 pathways, and their corresponding fold-change.
IPA analyses identified MAPT (microtubule associated protein tau), CLPP (Caseinolytic Mitochondrial Matrix Peptidase Proteolytic Subunit), KDM5A (Lysine-specific demethylase 5A) and APP (amyloid precursor protein) as the top four Upstream Regulators driving the proteomic changes between low vs. high CAA Alzheimer's disease cerebrovascular tissue (Figure 7E).
Discussion
We employed our state-of-the-art proteomic platform to conduct a detailed unbiased characterization of changes in protein expression levels, and molecular pathways significantly altered from cerebrovascular tissue isolated from the inferior frontal gyrus of young and aged controls and AD brains staged by CAA severity. Endothelial and mural cells, supported by other perivascular cell types (e.g., perivascular astrocytes), predominantly comprise the cerebrovascular fraction isolated from these autopsy specimens. Our analyses revealed unique proteomic changes and molecular pathways driven by age and CAA severity in the sequelae of AD pathogenesis.
Specifically, we observed 150 significantly regulated proteins in young vs. aged control cerebrovessels. With respect to the cell specific markers identified from this group comparison, we noted that significant changes were mainly associated with smooth muscle and endothelial cells. Chemokine and reelin signaling, synaptogenesis signaling, hypoxia inducible factor 2α (HIF2α) and Eukaryotic initiation factor 2 (EIF2) signaling pathways were the top 5 pathways significantly upregulated with age, thus indicating that inflammation, alteration in cell to cell communication, protein-synthesis and oxidative stress may be prominent features of cerebrovessel aging. It is worthy of note that synaptogenesis was identified as one of the top signaling pathways altered. The reason behind this change remains unknown. Neuronal end-feet processes are known to connect with endothelial cells to regulate neurovascular coupling, however, our initial analyses showed very low expression levels of neuronal specific markers in the cerebrovascular fractions compared to endothelial and mural cell specific markers. An alternative explanation is that other enriched cell types such as astrocytes (Farhy-Tselnicker and Allen, 2018) or endothelial cells (Wu et al., 2019) could be the mediators of these synaptogenesis signaling pathways.
We also report unique proteomic changes in cerebrovessels of AD patients compared to age-matched control counterparts. Firstly, we stratified AD cases into two distinct groups based on low (<4) and high CAA (>8) scores. Generally, AD patients with high CAA staging had the worst MMSE results, the smallest brain weight, and most severe amyloid plaque and tau pathology compared to AD cases with low CAA staging and age-matched controls. From our analyses, we observed a significantly greater proteomic response in cerebrovessels between AD cases with high CAA staging vs. age-matched controls (230 significantly regulated protein), compared to AD cases with low CAA staging vs. age-matched counterparts (37 significantly regulated protein). The latter appeared to indicate an upregulation in Sirtuin signaling and downregulation in oxidative phosphorylation, leukocyte extravasation, vascular endothelial growth factor (VEGF) signaling and integrin linked kinase (ILK) signaling. While the former also indicated an upregulation in Sirtuin signaling and downregulation in oxidative phosphorylation, but also a host of different pathways such as down regulation of the TCA cycle II, mammalian target of rapamycin (mTOR), hypoxia inducible factor 1α (HIF1α), Ciliary neurotrophic factor (CNTF), and N-Formylmethionyl-leucyl-phenylalanine (fMLP), interleukin 3 (IL3), chemokine receptor type 3 (CCR3), CXC chemokine receptor type 4 (CXCR4), thrombin and necroptosis signaling pathways. Thus suggesting an alteration in energy bioenergetic, oxidative damage, chemotactic and inflammatory signaling, BBB damage and cell death with increasing CAA severity.
With respect to the cell-type specific proteomic changes, we only noted significant changes in smooth muscle cell specific markers in AD cases with a low CAA score compared to their age- matched controls, possibly indicating an early involvement of arteriolar smooth muscle cells in CAA pathogenesis as amyloid deposits form around arteriole vessels. Significant changes in pericyte, smooth muscle cell, microglia, astrocyte and endothelial cell specific markers were observed in AD cases with a high CAA score compared to their age-matched controls, thus signifying the involvement of multiple cerebrovascular/perivascular cell types in the late degenerative stages of CAA.
To further delineate the differences between AD cases with low vs. high CAA scores, we also compared proteomic changes between their cerebrovessels and observed 84 significantly regulated proteins. Some of the main pathways identified involved downregulation of TCA cycle II, oxidative phosphorylation, mitochondrial dysfunction, and gluconeogenesis, further supporting the role of deficits in energy bioenergetics within cerebrovessels with CAA severity. With respect to changes in cell-type specific markers, we again revealed that smooth muscle cell specific markers played the greatest influence across the neuropathological staging of CAA in AD cases, followed by pericytes, and endothelial cells/astrocytes.
The role of the cerebrovasculature in driving AD pathogenesis has long been discussed. The vascular hypothesis was described a few decades ago to provide a vascular preclinical etiology for AD. Early evidence showed that cerebral perfusion, cortical blood flow and metabolic deficits were observed in MCI patients and those who go on to develop AD (De la Torre and Mussivand, 1993; Binnewijzend et al., 2016; Hays et al., 2016; de la Torre, 2018), beginning many years prior to the onset of their neurological symptoms. Seminal findings from the Nun dementia study (Snowdon, 1997) involving catholic sisters between 75 to 107yrs also demonstrated a prominent role for vascular lesions such as lacunar infarcts at autopsy, with these lesions serving as a protagonist for reducing the neuropathological threshold required for defining the staging of AD dementia (Nagy et al., 1997). Other vascular related morphological lesions have also been observed at autopsy in demented and non-demented elderly patients such as degeneration of small blood vessels, capillaries and perivascular end-feet processes (Miyakawa and Kuramoto, 1989; Hashimura et al., 1991; Kimura et al., 1991; Vinters et al., 1994; Kalaria, 1996; Farkas et al., 2000; Farkas and Luiten, 2001; Hauw et al., 2002; Zekry et al., 2002; Fernando and Ince, 2004; Østergaard et al., 2013); mitochondrial abnormalities and deposition of phagolysosomes and lipofuscin in cerebrovascular cells (Terry et al., 1964; Miyakawa and Kuramoto, 1989), blood brain barrier damage (Deane and Zlokovic, 2007) and immune cell extravasation (Itagaki et al., 1988; Rogers et al., 1988; Togo et al., 2002; Di Marco et al., 2015; Merlini et al., 2018). Moreover, vascular factors such as cardiovascular diseases, atherosclerosis, diabetes mellitus, hyperhomocysteinhemia, obesity and hypertension also increase the risk for AD in later life (Breteler, 2000; Kivipelto et al., 2001; Duron and Hanon, 2008; Ouldred and Bryant, 2010; de Bruijn and Ikram, 2014; O'Brien and Markus, 2014), alogether suggesting that vascular dysfunction may play a role in contributing to AD pathogenesis as we age. However, whether these vascular issues are a direct prelude to AD pathogenesis or a consequence remains elusive.
Vascular dysfunction manifested as brain hypoperfusion, hypoxia and hypometabolism are known among the modulators of cerebral amyloidogenesis and amyloid clearance (Mosconi, 2005; Zhang et al., 2007; Mawuenyega et al., 2010; Govindpani et al., 2019). In turn, deposition of amyloid-beta toxic species on vascular walls can also lead to changes typified by impairment in vascular hemodynamics and vessel rigidity leading to arterial and arteriole narrowing, increased cerebral blood pressure and further weakening of the vascular walls contributing to hypoperfusion and hypometabolism (Kalback et al., 2004; Tian et al., 2004). We partly observed this in our study in the form of changes to basement membrane proteins (implicating age-related arteriolosclerosis), activation of hypoxia inducible factor HIF1α, deficits in cerebrovessel energy bioenergetics and also from the strong correlation between CAA severity and the extent of proteomic changes in cerebrovessels. Our previous work has also confirmed a reduction in mural cell markers such as PDGFRβ and αSMA by ELISA method in the same batch of control and AD cerebrovessels used in this study (Ojo et al., 2021), signaling a possible degeneration of these cells in AD. These direct toxic effects of amyloid species have been confirmed in isolated cerebral tissue, in transgenic mouse models with CAA and cerebrovascular cell culture models after exposure to toxic amyloid species (Paris et al., 2003; Park et al., 2004; Tong et al., 2005; Nortley et al., 2019). As our proteomic study design focused on the end-stage analyses of cerebrovessels, we are unable to definitively determine whether the proteomic changes reported herein precede amyloid or tau pathologies, or are a consequence of these pathogenic protein species activating the molecular cascades of cerebrovascular events. Our study comparisons of young vs. aged control cases, and also AD cases stratified based on their CAA staging, does seem to point toward early cerebrovascular changes involving disturbances in energy metabolisms, oxidative stress and inflammation, which could have significant ramifications for brain and cerebrovascular physiology later in life.
To date, only few proteomic studies have been conducted to investigate brain vascular abnormalities in AD. Manousopoulou et al. (2017) used global quantitative proteomic analysis to interrogate endophenotypic profiles in large leptomeningeal arteries from patients with CAA (82.9 ± 7.5 yrs) compared to young (45.4 ± 3.9 yrs) and elderly controls (88.3 ± 8.6 yrs). Authors reported similar findings with our study demonstrating significant alterations in immune response and classical complement and extracellular matrix remodeling pathways in arteries affected by CAA compared to young and elderly controls. Clusterin (apolipoprotein J) and tissue inhibitor of metalloproteinases-3 (TIMP3) were the top significantly regulated proteins to be upregulated in CAA compared to young and elderly controls, and they were found to co-localize with amyloid-beta from CAA lesions. In our study, we also saw changes in clusterins in young vs. aged cerebrovessels, and early changes in matrix metalloproteinases such as MMP12 in CAA pathogenesis, suggesting a role for these proteins in driving the molecular damage in CAA pathogenesis.
Another study using laser dissection microscopy assisted quantitative mass spectrometry analysis was used to interrogate post-mortem human brain tissue of AD lesions with amyloid deposits in the brain parenchyma, predominant severe capillary CAA, and non-demented controls without amyloid deposits (Hondius et al., 2018). The authors identified 29 CAA-selective proteins. Notably increased levels of clusterin (CLU), apolipoprotein E (APOE) and serum amyloid P-component (APCS) were observed in AD brains with CAA, and collagen alpha-2(VI) (COL6A2) as highly selective markers unique to only CAA but absent in cases with parenchymal amyloid. Collagen makes up 50% of basement membrane proteins, and we also found increased levels of COL1A1 protein subunit in AD cases with low vs. high CAA scores, suggesting that extracellular remodeling is a key protective mechanisms against CAA pathogenesis, to combat weakening of vascular basement membrane integrity.
Animal studies have also been used to explore changes to the cerebrovascular proteome in AD pathogenesis. A prior study used gel-free and gel-based mass spectrometry to interrogate cerebrovascular proteome in 6.5 month old mice overexpressing APP compared to non-transgenic controls, and demonstrated over 190 proteins significantly regulated (Badhwar et al., 2017). The molecular changes identified included changes such as RNA/DNA damage, vascular cytoskeleton alterations, deregulation of the oxidoreductase system, oxidative stress, alterations in cerebrovascular vasocontractile tone, and vascular compliance, which were all in line with the outcomes reported in our current study. Some of these effects were rescued by treatment with pioglitazone, which acts through nuclear hormone receptor PPARγ to regulate lipid and glucose metabolism, mitochondrial bioenergetics, and inflammation. In our studies alterations in TCA cycle II, gluconeogenesis, sirtuin signaling, oxidative phosphorylation and mitochondrial dysfunction were observed in cerebrovessels with aging and AD pathogenesis, indicating that mitochondrial bioenergetics is a major event implicated in cerebrovascular dysfunction and diminished cerebral perfusion. Collectively these findings provide evidence for targeting energy metabolism and mitochondrial pathobiology in the cerebrovasculature as a potential therapeutic approach in the early stages of AD pathology.
We noted that AD cases with low or high CAA scores consisted of 40 or 67% APOE4 allele carriers, respectively, while only 20% of aged non-demented control cases were APOE4 allele carriers, suggesting that APOE4 genotype may be a driver of the events we reported in this study. APOE is thought to play a role in regulating the metabolism and perivascular drainage of Aβ and other soluble metabolites in extracellular fluids of the brain (Kim et al., 2009; Castellano et al., 2011; Cramer et al., 2012; Verghese et al., 2013; Kanekiyo et al., 2014). Early clues linking APOE with vascular degeneration was demonstrated in studies showing a link between APOE4 and increased toxic amyloid deposition around blood vessels in CAA (Greenberg et al., 1995; McCarron and Nicoll, 2000; Nelson et al., 2013; Rannikmäe et al., 2014). This has now been corroborated in transgenic models where an isoform specific (E4>E2 and/or E3) shift in Aβ from the brain parenchyma to arterioles was observed in the form of CAA and increased incidence of microhemorrhages (Greenberg et al., 1995; Holtzman et al., 2000; Fryer et al., 2003, 2005; Sullivan et al., 2008; Tai et al., 2011). APOE4 has also been shown to impact BBB permeability at the level of endothelial cells as demonstrated by an isoform specific (E4>E3) increase in the mRNA levels of influx Aβ transporters, RAGE (by seven-fold) (Donahue and Johanson, 2008). The APOE4 isoform has also been shown to negatively impact MMP9 induced (efflux transporter) LRP-1 shedding and its subsequent transport of APOE-Aβ complexes (Alonzo et al., 1998). Reductions in LRP1 levels were observed in this study, in corroboration with our previous work using the same batch of control and AD cerbrovessel samples and ELISA analyses (Alonzo et al., 1998).
Other studies have implicated a role for APOE4 in non-amyloidogenic mechanisms involving direct damage to the vasculature in AD. For example, a significant correlation between APOE4 allele and cerebral small-vascular diseases (CSVD) has been reported in cross-sectional studies involving AD and age-matched control cases (Utter et al., 2008; Schilling et al., 2013; Luo et al., 2017). APOE4 has also been linked with increased risk for fat or cholesterol build up in the middle cerebral artery in elderly patients (Kosunen et al., 1995; Zhang et al., 2018), and could lead to stenosis and the decrease in cerebral perfusion by smaller penetrating blood vessels. Moreover, CAA patients in the amyloid antibody trials who are APOE4 carriers typically show an increased propensity for microhemorrhages (Roher et al., 2011; Hanson et al., 2014; Salloway et al., 2014). Recent work has also confirmed the link between APOE4 and the accelerated breakdown of the BBB as an early event in AD (Zipser et al., 2007; Dickstein et al., 2010; Bell et al., 2012; Montagne et al., 2020). This appears to be driven by an APOE4 effect on the LRP1-Cyclophilin-NF-κB-MMP9 pathway in pericytes (Bell et al., 2012; Halliday et al., 2016; Montagne et al., 2020). Damage to mural cells could impact on the vasoconstrictive properties of cerebral microvessels leading to diminished blood flow and impaired cerebrovascular clearance (Hamilton, 2010; Khennouf et al., 2018; Nortley et al., 2019). While damage to the BBB can result in leukocyte extravasation and influx of blood borne proteins (such as fibrinogen and ferritin), which were both observed in this current study between control and AD cases.
One of the limitations of our study is the inability to detect the specific cellular origins of all the differentially expressed proteins in the cerebrovasculature, which constitutes a mixed cell population. Therefore, in future studies, we propose interrogating these omic changes at the single cell level using tools such as single cell RNAseq, RNAscope, single cell proteomic analyses and double-immunofluorescent staining. Another limitation of this work, is the bias in gender distribution across the different groups, with more females in the AD cases (60-70%) compared to the controls (~40%). Moreover, our young healthy control cohort coincidentally consisted of 60% APOE4 allele carriers, while the aged-matched control cases consisted of 20%. Thus our findings must be interpreted based on the bias across these groups as sex may serve as a biological variable driving our outcomes, while APOE4 genotype in the young cases may also mask some of the age-related effects observed in the study.
Conclusion
We hypothesized that age-related and CAA dependent changes to the cerebrovascular proteome may explain the vascular contribution of aging and CAA in AD-related pathogenesis. We have observed that chemokine signaling, neurovascular signaling, hypoxia and oxidative damage and cell to cell signaling pathways were some of the prominent features of early age-related changes to cerebrovessels and this was driven by upstream regulators such as pro-survival and growth factor regulator RICTOR, transcriptional co-repressor TLE3, tau gene MAPT, amyloid precursor protein APP, and amyloidolytic enzyme subunit PSEN1.
We also revealed that proteomic changes to cerebrovessels across the neuropathological staging of CAA in AD brains appeared to be influenced early on by changes in energy bioenergetic, cellular homeostasis, BBB disturbances and immune cell infiltration. This was found to be driven by upstream regulators such as matrix metalloproteinase enzyme MMP12, endopeptidase enzyme CLPP, RICTOR and TLE3. The most common denominator in AD cerebrovessels from this study is the failure of mitochondrial function and energy bioenergetics. We hypothesize that mitochondrial failure in cerebrovessels may be a novel target in AD pathogenesis, and thus serve as a potential therapeutic target for rejuvenating cerebrovascular function and mitigating its negative consequences in AD.
It is worthy of note that low CAA groups represented cases with 50% high “NIA-R” AD diagnosis; while high CAA groups represented cases with 90%, suggesting that the effects observed are not absolutely driven by CAA score, but can be influenced by advanced amyloid plaque and NFT stage. Future studies exploring the differences in low and high CAA cases within a population with high NIA-R or ADNC diagnosis may help to determine the proteomic changes attributed primarily to CAA severity.
The findings nonetheless have provided a valuable molecular library of cerebrovascular pathobiological changes in aging and AD pathogenesis. The cerebrovasculature is crucial for maintaining neurovascular coupling and homeostatic equilibrium of the brain, providing adequate oxygen and glucose supply to cells to carry out their normal physiological functions. The proteomic changes we have identified may provide novel cerebrovascular based targets in developing therapeutic strategies to mitigate the damage to cerebrovessels early in the sequelae of AD pathogenesis. Our findings may also provide markers to aid in stratifying CAA patients during clinical trial studies for anti-amyloid immunotherapies that have an increased risk for microhemorrhages (Racke et al., 2005; Wilcock and Colton, 2009; Wilcock et al., 2011). Our future work will focus on interrogating and validating these novel targets and pathways and their functional significance in a larger cohorts of human samples and in controlled preclinical and in vitro studies.
Data Availability Statement
The datasets presented in this study can be found in an online repository. The name of the repository and accession number can be found in the Methods section.
Ethics Statement
Frozen human cortex tissue samples (from the inferior frontal gyrus) were provided mainly from Dr. Thomas Beach, Director of the Brain and Body Donation Program at Sun Health Research Institute (Sun City, AZ) in accordance with the institutional bioethics guidelines. Additional samples were requested from the NIH BrainBank repository (University of Maryland and Ican school of medicine, Mount Sinai, NY). The donors and their respective families provided hand written informed consent for autopsy and the subsequent use of brain tissue for research purposes. For this study, no further ethical approval was required as samples were obtained from deceased, de-identified, and consenting individuals.
Disclosure
Dr. Bachmeier is a Research Scientist at the Bay Pines VA Healthcare System, Bay Pines, FL. Dr. Crawford is a Research Career Scientist at the James A. Haley Veterans Hospital, Tampa, FL. The content is solely the responsibility of the authors and does not necessarily represent the official views of the National Institutes of Health, the Department of Veterans Affairs, or the United States Government.
Author Contributions
CB and JO conceived and directed the project. JO, GC, JR, and JE analyzed the results. JO, PV, BS, ME, and AE carried out the experiments. JO, CB, and FC drafted the manuscript. FC and MM were consultants on the project and provided their expertise and interpretation of the data. All authors contributed to the article and approved the submitted version.
Funding
This work was supported by the National Institute on Aging of the National Institutes of Health under award number R01AG041971. We are grateful to the Banner Sun Health Research Institute Brain and Body Donation Program of Sun City, Arizona for providing the human brain specimens. The Brain and Body Donation Program was supported by the National Institute of Neurological Disorders and Stroke (U24 NS072026 National Brain and Tissue Resource for Parkinson's Disease and Related Disorders), the National Institute on Aging (P30 AG19610 Arizona Alzheimer's Disease Core Center), the Arizona Department of Health Services (contract 211002, Arizona Alzheimer's Research Center), the Arizona Biomedical Research Commission (contracts 4001, 0011, 05-901 and 1001 to the Arizona Parkinson's Disease Consortium) and the Michael J. Fox Foundation for Parkinson's Research. Human brain tissue specimens were also obtained from the University of Maryland Brain and Tissue Bank which is a Brain and Tissue Repository of the NIH NeuroBioBank (Baltimore, MD) and the Mount Sinai NIH Brain and Tissue Repository (New York, NY). Finally, we extend our appreciation to the Roskamp Institute for their generosity in helping to make this work possible.
Conflict of Interest
JR was employed by company Boehringer Ingelheim Pharmaceuticals, Inc.
The remaining authors declare that the research was conducted in the absence of any commercial or financial relationships that could be construed as a potential conflict of interest.
Supplementary Material
The Supplementary Material for this article can be found online at: https://www.frontiersin.org/articles/10.3389/fnagi.2021.658605/full#supplementary-material
Supplementary Figure 1. Network functions identified in young vs. aged control cerebrovascular tissue from the inferior frontal gyrus. Top Table shows associated network functions score identified from the ingenuity pathway analyses of significantly regulated proteins in young vs. aged controls. Network score was generated using IPA network generation algorithm that calculates the probability of finding the significantly regulated focus genes in a set of genes randomly selected from the relevant global molecular network. Network score cut off was set at >40. Schematic representation shows subcellular localization of proteins from each identified networks. Red—downregulated and Green—upregulated.
Supplementary Figure 2. Network functions identified in low CAA vs. aged-matched control cerebrovascular tissue from the inferior frontal gyrus. Top Table shows associated network functions score identified from the ingenuity pathway analyses of significantly regulated proteins in low CAA vs. aged-matched control cases. Network score was generated using IPA network generation algorithm that calculates the probability of finding the significantly regulated focus genes in a set of genes randomly selected from the relevant global molecular network. Network score cut off was set at >40. Schematic representation shows subcellular localization of proteins from each identified networks. Red—downregulated and Green—upregulated.
Supplementary Figure 3. Network functions identified in high CAA vs. aged-matched control cerebrovascular tissue from the inferior frontal gyrus. Top Table shows associated network functions score identified from the ingenuity pathway analyses of significantly regulated proteins in high CAA vs. aged-matched control cases. Network score was generated using IPA network generation algorithm that calculates the probability of finding the significantly regulated focus genes in a set of genes randomly selected from the relevant global molecular network. Network score cut off was set at >40. Schematic representation shows subcellular localization of proteins from each identified networks. Red—downregulated and Green—upregulated.
Supplementary Figure 4. Network functions identified in low vs. high CAA[AD] cerebrovascular tissue from the inferior frontal gyrus. Top Table shows associated network functions score identified from the ingenuity pathway analyses of significantly regulated proteins in low vs. high CAA [AD] cases. Network score was generated using IPA network generation algorithm that calculates the probability of finding the significantly regulated focus genes in a set of genes randomly selected from the relevant global molecular network. Network score cut off was set at >40. Schematic representation shows subcellular localization of proteins from each identified networks. Red—downregulated and Green—upregulated.
Supplementary Table 1. List of significantly regulated proteins in the cerebrovasculature of the inferior frontal gyrus of young vs. aged control cases. Data are expressed as the negative Log10 of the p-value (green horizontal bars–significance cut off set at >1.3), and the Log2 fold change between young vs. aged control cases. Heat map indicates downregulated (Red box) or upregulated (Blue box) proteins. Statistical analyses was performed using t-test after logarithmic transformation. Red text highlights indicate 124 significantly proteins identified that were unique to only this comparison in our entire study.
Supplementary Table 2. List of significantly regulated proteins in the cerebrovasculature of the inferior frontal gyrus of low CAA+ Alzheimer's disease and aged-matched control cases. Data are expressed as the negative Log10 of the p-value (green horizontal bars–significance cut off set at >1.3), and the Log2 fold change between low CAA [AD] vs. age-matched control cases. Heat map indicates downregulated (Red box) or upregulated (Blue box) proteins. Statistical analyses was performed using t-test after logarithmic transformation. Red text highlights indicate 17 significantly proteins identified that were unique to only this comparison in our entire study.
Supplementary Table 3. List of significantly regulated proteins in the cerebrovasculature of the inferior frontal gyrus in high CAA [AD] vs. age-matched control cases. Data are expressed as the negative Log10 of the p-value (green horizontal bars–significance cut off set at >1.3), and the Log2 fold change between high CAA [AD] vs. age-matched control cases. Heat map indicates downregulated (Red box) or upregulated (Blue box) proteins. Statistical analyses was performed using t-test after logarithmic transformation. Red text highlights indicate 155 significantly proteins identified that were unique to only this comparison in our entire study.
Supplementary Table 4. List of significantly regulated proteins in the cerebrovasculature of the inferior frontal gyrus in low vs. high CAA [AD] cases. Data are expressed as the negative Log10 of the p value (green horizontal bars–significance cut off set at >1.3), and the Log2 fold change between low vs. high CAA [AD] cases. Heat map indicates downregulated (Red box) or upregulated (Blue box) proteins. Statistical analyses was performed using t-test after logarithmic transformation. Red text highlights indicate 36 significantly proteins identified that were unique to only this comparison in our entire study.
References
Alonzo, N. C., Hyman, B. T., Rebeck, G. W., and Greenberg, S. M. (1998). Progression of cerebral amyloid angiopathy: accumulation of amyloid- β40 in affected vessels. J. Neuropathol. Exp. Neurol. 57, 353–359. doi: 10.1097/00005072-199804000-00008
Badhwar, A., Brown, R., Stanimirovic, D. B., Haqqani, A. S., and Hamel, E. (2017). Proteomic differences in brain vessels of Alzheimer's disease mice: normalization by PPARI 3 agonist pioglitazone. J. Cereb. Blood Flow Metab. 37, 1120–1136. doi: 10.1177/0271678X16655172
Bai, B., Wang, X., Li, Y., Chen, P. C., Yu, K., Dey, K. K., et al. (2020). Deep multilayer brain proteomics identifies molecular networks in Alzheimer's disease progression. Neuron 105, 975–991.e7. doi: 10.1016/j.neuron.2019.12.015
Beach, T. G., Wilson, J. R., Sue, L. I., Newell, A., Poston, M., Cisneros, R., et al. (2007). Circle of Willis atherosclerosis: association with Alzheimer's disease, neuritic plaques and neurofibrillary tangles. Acta Neuropathol. 113, 13–21. doi: 10.1007/s00401-006-0136-y
Bell, R. D., Winkler, E. A., Singh, I., Sagare, A. P., Deane, R., Wu, Z., et al. (2012). Apolipoprotein e controls cerebrovascular integrity via cyclophilin A. Nature 485, 512–516. doi: 10.1038/nature11087
Binnewijzend, M. A. A., Benedictus, M. R., Kuijer, J. P. A., van der Flier, W. M., Teunissen, C. E., Prins, N. D., et al. (2016). Cerebral perfusion in the predementia stages of Alzheimer's disease. Eur. Radiol. 26, 506–514. doi: 10.1007/s00330-015-3834-9
Blevins, B. L., Vinters, H. V., Love, S., Wilcock, D. M., Grinberg, L. T., Schneider, J. A., et al. (2021). Brain arteriolosclerosis. Acta Neuropathol. 141, 1–24. doi: 10.1007/s00401-020-02235-6
Breteler, M. M. B. (2000). Vascular risk factors for Alzheimer's disease: an epidemiologic perspective. Neurobiol. Aging 21, 153–160. doi: 10.1016/S0197-4580(99)00110-4
Castellano, J. M., Kim, J., Stewart, F. R., Jiang, H., DeMattos, R. B., Patterson, B. W., et al. (2011). Human apoE isoforms differentially regulate brain amyloid-β peptide clearance. Sci. Transl. Med. 3:89ra57. doi: 10.1126/scitranslmed.3002156
Cramer, P. E., Cirrito, J. R., Wesson, D. W., Lee, C. Y. D., Karlo, J. C., Zinn, A. E., et al. (2012). ApoE-directed therapeutics rapidly clear β-amyloid and reverse deficits in AD mouse models. Science 335, 1503–1506. doi: 10.1126/science.1217697
Custodio, N., Montesinos, R., Lira, D., Herrera-Pérez, E., Bardales, Y., and Valeriano-Lorenzo, L. (2017). Demência mista: revisão das evidências. Dement. e Neuropsychol. 11, 364–370. doi: 10.1590/1980-57642016dn11-040005
de Bruijn, R. F. A. G., and Ikram, M. A. (2014). Cardiovascular risk factors and future risk of Alzheimer's disease. BMC Med. 12:130. doi: 10.1186/s12916-014-0130-5
de la Torre, J. (2018). The vascular hypothesis of Alzheimer's disease: a key to preclinical prediction of dementia using neuroimaging. J. Alzheimers. Dis. 63, 35–52. doi: 10.3233/JAD-180004
De La Torre, J. C. (2010). The vascular hypothesis of Alzheimer's disease: bench to bedside and beyond. Neurodegener. Dis. 7, 116–121. doi: 10.1159/000285520
De la Torre, J. C., and Mussivand, T. (1993). Can disturbed brain microcirculation cause Alzheimer's disease? Neurol. Res. 15, 146–153. doi: 10.1080/01616412.1993.11740127
Deane, R., and Zlokovic, B. (2007). Role of the blood-brain barrier in the pathogenesis of Alzheimers Disease. Curr. Alzheimer Res. 4, 191–197. doi: 10.2174/156720507780362245
Di Marco, L. Y., Venneri, A., Farkas, E., Evans, P. C., Marzo, A., and Frangi, A. F. (2015). Vascular dysfunction in the pathogenesis of Alzheimer's disease–A review of endothelium-mediated mechanisms and ensuing vicious circles. Neurobiol. Dis. 82, 593–606. doi: 10.1016/j.nbd.2015.08.014
Dickstein, D. L., Walsh, J., Brautigam, H., Stockton, S. D., Gandy, S., and Hof, P. R. (2010). Role of vascular risk factors and vascular dysfunction in Alzheimer's disease. Mt. Sinai J. Med. 77, 82–102. doi: 10.1002/msj.20155
Donahue, J. E., and Johanson, C. E. (2008). Apolipoprotein E, amyloid-β, and blood-brain barrier permeability in Alzheimer disease. J. Neuropathol. Exp. Neurol. 67, 261–270. doi: 10.1097/NEN.0b013e31816a0dc8
Duron, E., and Hanon, O. (2008). Vascular risk factors, cognitve decline, and dementia. Vasc. Health Risk Manag. 4, 363–381. doi: 10.2147/VHRM.S1839
Erkinjuntti, T., Román, G., Gauthier, S., Feldman, H., and Rockwood, K. (2004). Emerging therapies for vascular dementia and vascular cognitive impairment. Stroke 35, 1010–1017. doi: 10.1161/01.STR.0000120731.88236.33
Farhy-Tselnicker, I., and Allen, N. J. (2018). Astrocytes, neurons, synapses: a tripartite view on cortical circuit development. Neural Dev. 13, 7. doi: 10.1186/s13064-018-0104-y
Farkas, E., De Jong, G. I., De Vos, R. A. I., Jansen Steur, E. N. H., and Luiten, P. G. M. (2000). Pathological features of cerebral cortical capillaries are doubled in Alzheimer's disease and Parkinson's disease. Acta Neuropathol. 100, 395–402. doi: 10.1007/s004010000195
Farkas, E., and Luiten, P. G. M. (2001). Cerebral microvascular pathology in aging and Alzheimer's disease. Prog. Neurobiol. 64, 575–611. doi: 10.1016/S0301-0082(00)00068-X
Fernando, M. S., and Ince, P. G. (2004). Vascular pathologies and cognition in a population-based cohort of elderly people. J. Neurol. Sci. 15, 13–17. doi: 10.1016/j.jns.2004.09.004
Fryer, J. D., Simmons, K., Parsadanian, M., Bales, K. R., Paul, S. M., Sullivan, P. M., et al. (2005). Human apolipoprotein E4 alters the amyloid-β 40:42 ratio and promotes the formation of cerebral amyloid angiopathy in an amyloid precursor protein transgenic model. J. Neurosci. 25, 2803–2810. doi: 10.1523/JNEUROSCI.5170-04.2005
Fryer, J. D., Taylor, J. W., DeMattos, R. B., Bales, K. R., Paul, S. M., Parsadanian, M., et al. (2003). Apolipoprotein E markedly facilitates age-dependent cerebral amyloid angiopathy and spontaneous hemorrhage in amyloid precursor protein transgenic mice. J. Neurosci. 23, 7889–7896. doi: 10.1523/JNEUROSCI.23-21-07889.2003
Govindpani, K., McNamara, L. G., Smith, N. R., Vinnakota, C., Waldvogel, H. J., Faull, R. L., et al. (2019). Vascular dysfunction in Alzheimer's disease: a prelude to the pathological process or a consequence of it? J. Clin. Med. 8:651. doi: 10.3390/jcm8050651
Grammas, P., Samany, P. G., and Thirumangalakudi, L. (2006). Thrombin and inflammatory proteins are elevated in Alzheimer's disease microvessels: implications for disease pathogenesis. J. Alzheimer's Dis. 9, 51–58. doi: 10.3233/JAD-2006-9105
Greenberg, S. M., William Rebeck, G., Vonsattel, J. P. G., Gomez-Isla, T., and Hyman, B. T. (1995). Apolipoprotein E ϵ4 and cerebral hemorrhage associated with amyloid angiopathy. Ann. Neurol. 38, 254–259. doi: 10.1002/ana.410380219
Halliday, M. R., Rege, S. V., Ma, Q., Zhao, Z., Miller, C. A., Winkler, E. A., et al. (2016). Accelerated pericyte degeneration and blood-brain barrier breakdown in apolipoprotein E4 carriers with Alzheimer's disease. J. Cereb. Blood Flow Metab. 36, 216–227. doi: 10.1038/jcbfm.2015.44
Hamilton, N. B. (2010). Pericyte-mediated regulation of capillary diameter: a component of neurovascular coupling in health and disease. Front. Neuroenergetics 2, 1–14. doi: 10.3389/fnene.2010.00005
Hanson, A., Craft, S., and Banks, W. (2014). The APOE genotype: modification of therapeutic responses in Alzheimer's disease. Curr. Pharm. Des. 21, 114–120. doi: 10.2174/1381612820666141020164222
Hashimura, T., Kimura, T., and Miyakawa, T. (1991). Morphological changes of blood vessels in the brain with Alzheimer's disease. Psychiatry Clin. Neurosci. 45, 661–665. doi: 10.1111/j.1440-1819.1991.tb01187.x
Hauw, J. J., Zekry, D., Seilhean, D., Forette, B., Gallinari, C., Laurent, M., et al. (2002). [Neuropathology of the cerebral vessels of centenarians]. J. Mal. Vasc. 27, S13–S18.
Hays, C. C., Zlatar, Z. Z., and Wierenga, C. E. (2016). The utility of cerebral blood flow as a biomarker of preclinical Alzheimer's disease. Cell. Mol. Neurobiol. 36, 167–179. doi: 10.1007/s10571-015-0261-z
Holtzman, D. M., Fagan, A. M., Mackey, B., Tenkova, T., Sartorius, L., Paul, S. M., et al. (2000). Apolipoprotein E facilitates neuritic and cerebrovascular plaque formation in an Alzheimer's disease model. Ann. Neurol. 47, 739–747. doi: 10.1002/1531-8249(200006)47:6<739::AID-ANA6>3.0.CO;2-8
Holtzman, D. M., Mandelkow, E., and Selkoe, D. J. (2012). Alzheimer disease in 2020. Cold Spring Harb. Perspect. Med. 2:a011585. doi: 10.1101/cshperspect.a011585
Hondius, D. C., Eigenhuis, K. N., Morrema, T. H. J., van der Schors, R. C., van Nierop, P., Bugiani, M., et al. (2018). Proteomics analysis identifies new markers associated with capillary cerebral amyloid angiopathy in Alzheimer's disease. Acta Neuropathol. Commun. 6:46. doi: 10.1186/s40478-018-0540-2
Itagaki, S., McGeer, P. L., and Akiyama, H. (1988). Presence of T-cytotoxic suppressor and leucocyte common antigen positive cells in Alzheimer's disease brain tissue. Neurosci. Lett. 91, 259–264. doi: 10.1016/0304-3940(88)90690-8
Johnson, E. C. B., Dammer, E. B., Duong, D. M., Yin, L., Thambisetty, M., Troncoso, J. C., et al. (2018). Deep proteomic network analysis of Alzheimer's disease brain reveals alterations in RNA binding proteins and RNA splicing associated with disease. Mol. Neurodegener. 13, 1–22. doi: 10.1186/s13024-018-0282-4
Johnson, E. C. B., Dammer, E. B., Duong, D. M., Ping, L., Zhou, M., Yin, L., et al. (2020). Large-scale proteomic analysis of Alzheimer's disease brain and cerebrospinal fluid reveals early changes in energy metabolism associated with microglia and astrocyte activation. Nat. Med. 26, 769–780. doi: 10.1038/s41591-020-0815-6
Kalaria, R. N. (1996). Cerebral vessels in ageing and Alzheimer's disease. Pharmacol. Ther. 72, 193–214. doi: 10.1016/S0163-7258(96)00116-7
Kalaria, R. N. (2003). Comparison between Alzheimer's disease and vascular dementia: implications for treatment. Neurol. Res. 25, 661–664. doi: 10.1179/016164103101201968
Kalaria, R. N., and Ballard, C. (1999). Overlap between pathology of Alzheimer disease and vascular dementia. Alzheimer Dis. Assoc. Disord. 13, S115–S123. doi: 10.1097/00002093-199912003-00017
Kalback, W., Esh, C., Castaño, E. M., Rahman, A., Kokjohn, T., Luehrs, D. C., et al. (2004). Atherosclerosis, vascular amyloidosis and brain hypoperfusion in the pathogenesis of sporadic Alzheimer's disease. Neurol. Res. 26, 525–539. doi: 10.1179/016164104225017668
Kanekiyo, T., Xu, H., and Bu, G. (2014). ApoE and Aβ in Alzheimer's disease: accidental encounters or partners? Neuron 81, 740–754. doi: 10.1016/j.neuron.2014.01.045
Khennouf, L., Gesslein, B., Brazhe, A., Octeau, J. C., Kutuzov, N., Khakh, B. S., et al. (2018). Active role of capillary pericytes during stimulation-induced activity and spreading depolarization. Brain 141, 2032–2046. doi: 10.1093/brain/awy143
Kim, J., Basak, J. M., and Holtzman, D. M. (2009). The role of apolipoprotein E in Alzheimer's disease. Neuron 63, 287–303. doi: 10.1016/j.neuron.2009.06.026
Kimura, T., Hashimura, T., and Miyakawa, T. (1991). Observations of microvessels in the brain with Alzheimer's disease by the scanning electron microscopy. Psychiatry Clin. Neurosci. 45, 671–676. doi: 10.1111/j.1440-1819.1991.tb01189.x
Kivipelto, M., Helkala, E. L., Laakso, M. P., Hänninen, T., Hallikainen, M., Alhainen, K., et al. (2001). Midlife vascular risk factors and Alzheimer's disease in later life: longitudinal, population based study. Br. Med. J. 322, 1447–1451. doi: 10.1136/bmj.322.7300.1447
Kosunen, O., Talasniemi, S., Lehtovirta, M., Heinonen, O., Helisalmi, S. M., Mannermaa, A. M., et al. (1995). Relation of coronary atherosclerosis and apolipoprotein e genotypes in alzheimer patients. Stroke 26, 743–748. doi: 10.1161/01.STR.26.5.743
Krämer, A., Green, J., Pollard, J., and Tugendreich, S. (2014). Causal analysis approaches in ingenuity pathway analysis. Bioinformatics 30, 523–530. doi: 10.1093/bioinformatics/btt703
Luo, X., Jiaerken, Y., Yu, X., Huang, P., Qiu, T., Jia, Y., et al. (2017). Associations between APOE genotype and cerebral small-vessel disease: a longitudinal study. Oncotarget 8, 44477–44489. doi: 10.18632/oncotarget.17724
Manousopoulou, A., Gatherer, M., Smith, C., Nicoll, J. A. R., Woelk, C. H., Johnson, M., et al. (2017). Systems proteomic analysis reveals that clusterin and tissue inhibitor of metalloproteinases 3 increase in leptomeningeal arteries affected by cerebral amyloid angiopathy. Neuropathol. Appl. Neurobiol. 43, 492–504. doi: 10.1111/nan.12342
Mawuenyega, K. G., Sigurdson, W., Ovod, V., Munsell, L., Kasten, T., Morris, J. C., et al. (2010). Decreased clearance of CNS β-amyloid in Alzheimer's disease. Science 330:1774. doi: 10.1126/science.1197623
McCarron, M. O., and Nicoll, J. A. R. (2000). Apolipoprotein E genotype and cerebral amyloid angiopathy-related hemorrhage. Annals N. Y. Acad. Sci. 903, 176–179. doi: 10.1111/j.1749-6632.2000.tb06366.x
Merlini, M., Kirabali, T., Kulic, L., Nitsch, R. M., and Ferretti, M. T. (2018). Extravascular CD3+ T cells in brains of Alzheimer disease patients correlate with tau but not with amyloid pathology: an immunohistochemical study. Neurodegener. Dis. 18, 49–56. doi: 10.1159/000486200
Miyakawa, T., and Kuramoto, R. (1989). Ultrastructural study of senile plaques and microvessels in the brain with Alzheimer's disease and Down's syndrome. Ann. Med. 21, 99–102. doi: 10.3109/07853898909149193
Montagne, A., Nation, D. A., Sagare, A. P., Barisano, G., Sweeney, M. D., Chakhoyan, A., et al. (2020). APOE4 leads to blood–brain barrier dysfunction predicting cognitive decline. Nature 581, 71–76. doi: 10.1038/s41586-020-2247-3
Mosconi, L. (2005). Brain glucose metabolism in the early and specific diagnosis of Alzheimer's disease: FDG-PET studies in MCI and AD. Eur. J. Nucl. Med. Mol. Imaging 32, 486–510. doi: 10.1007/s00259-005-1762-7
Nagy, Z., Esiri, M. M., Jobst, K. A., Morris, J. H., King, E. M. F., Mcdonald, B., et al. (1997). The effects of additional pathology on the cognitive deficit in Alzheimer disease. J. Neuropathol. Exp. Neurol. 56, 165–170. doi: 10.1097/00005072-199702000-00007
Nelson, P. T., Pious, N. M., Jicha, G. A., Wilcock, D. M., Fardo, D. W., Estus, S., et al. (2013). APOE-ε2 and APOE ε4 correlate with increased amyloid accumulation in cerebral vasculature. J. Neuropathol. Exp. Neurol. 72, 708–715. doi: 10.1097/NEN.0b013e31829a25b9
Neltner, J. H., Abner, E. L., Baker, S., Schmitt, F. A., Kryscio, R. J., Jicha, G. A., et al. (2014). Arteriolosclerosis that affects multiple brain regions is linked to hippocampal sclerosis of ageing. Brain 137, 255–267. doi: 10.1093/brain/awt318
Nortley, R., Korte, N., Izquierdo, P., Hirunpattarasilp, C., Mishra, A., Jaunmuktane, Z., et al. (2019). Amyloid b oligomers constrict human capillaries in Alzheimer's disease via signaling to pericytes. Science 365:eaav9518. doi: 10.1126/science.aav9518
O'Brien, J. T., and Markus, H. S. (2014). Vascular risk factors and Alzheimer's disease. BMC Med. 12:218. doi: 10.1186/s12916-014-0218-y
Ojo, J., Eisenbaum, M., Shackleton, B., Lynch, C., Joshi, U., Saltiel, N., et al. (2021). Mural cell dysfunction leads to altered cerebrovascular tau uptake following repetitive head trauma. Neurobiol. Dis. 150:105237. doi: 10.1016/j.nbd.2020.105237
Ojo, J. O., Crynen, G., Algamal, M., Vallabhaneni, P., Leary, P., Mouzon, B., et al. (2020). Unbiased Proteomic Approach Identifies Pathobiological Profiles in the Brains of Preclinical Models of Repetitive Mild Traumatic Brain Injury, Tauopathy, and Amyloidosis. ASN Neuro 12, 1759091420914768. doi: 10.1177/1759091420914768
Østergaard, L., Aamand, R., Gutiérrez-Jiménez, E., Ho, Y. C. L., Blicher, J. U., Madsen, S. M., et al. (2013). The capillary dysfunction hypothesis of Alzheimer's disease. Neurobiol. Aging 34, 1018–1031. doi: 10.1016/j.neurobiolaging.2012.09.011
Ouldred, E., and Bryant, C. (2010). Vascular risk factors and dementia. Br. J. Card. Nurs. 10, 8–13. doi: 10.12968/bjca.2010.5.5.47882
Paris, D., Humphrey, J., Quadros, A., Patel, N., Crescentini, R., Crawford, F., et al. (2003). Vasoactive effects of Aβ in isolated human cerebrovessels and in a transgenic mouse model of Alzheimer's disease: role of inflammation. Neurol. Res. 25, 642–651. doi: 10.1179/016164103101201940
Park, L., Anrather, J., Forster, C., Kazama, K., Carlson, G. A., and Iadecola, C. (2004). Aβ-induced vascular oxidative stress and attenuation of functional hyperemia in mouse somatosensory cortex. J. Cereb. Blood Flow Metab. 24, 334–342. doi: 10.1097/01.WCB.0000105800.49957.1E
Pearson, A., Ajoy, R., Crynen, G., Reed, J. M., Algamal, M., Mullan, M., et al. (2020). Molecular abnormalities in autopsied brain tissue from the inferior horn of the lateral ventricles of nonagenarians and Alzheimer disease patients. BMC Neurol. 20:317. doi: 10.1186/s12883-020-01849-3
Racke, M. M., Boone, L. I., Hepburn, D. L., Parsadainian, M., Bryan, M. T., Ness, D. K., et al. (2005). Exacerbation of cerebral amyloid angiopathy-associated microhemorrhage in amyloid precursor protein transgenic mice by immunotherapy is dependent on antibody recognition of deposited forms of amyloid β. J. Neurosci. 25, 629–636. doi: 10.1523/JNEUROSCI.4337-04.2005
Rannikmäe, K., Kalaria, R. N., Greenberg, S. M., Chui, H. C., Schmitt, F. A., Samarasekera, N., et al. (2014). APOE associations with severe CAA-associated vasculopathic changes: collaborative meta-analysis. J. Neurol. Neurosurg. Psychiatry 85, 300–305. doi: 10.1136/jnnp-2013-306485
Rogers, J., Luber-Narod, J., Styren, S. D., and Civin, W. H. (1988). Expression of immune system-associated antigens by cells of the human central nervous system: relationship to the pathology of Alzheimer's disease. Neurobiol. Aging 9, 339–349. doi: 10.1016/S0197-4580(88)80079-4
Roher, A. E., Esh, C., Rahman, A., Kokjohn, T. A., and Beach, T. G. (2004). Atherosclerosis of cerebral arteries in Alzheimer disease. Stroke 35, 2623–2627. doi: 10.1161/01.STR.0000143317.70478.b3
Roher, A. E., Maarouf, C. L., Daugs, I. D., Kokjohn, T. A., Hunter, J. M., Sabbagh, M. N., et al. (2011). Neuropathology and amyloid-β spectrum in a bapineuzumab immunotherapy recipient. J. Alzheimer's Dis. 24, 315–325. doi: 10.3233/JAD-2011-101809
Salloway, S., Sperling, R., Fox, N. C., Blennow, K., Klunk, W., Raskind, M., et al. (2014). Two phase 3 trials of bapineuzumab in mild-to-moderate Alzheimer's disease. N. Engl. J. Med. 370, 322–333. doi: 10.1056/NEJMoa1304839
Schilling, S., DeStefano, A. L., Sachdev, P. S., Choi, S. H., Mather, K. A., DeCarli, C. D., et al. (2013). APOE genotype and MRI markers of cerebrovascular disease. Neurology 81, 292–300. doi: 10.1212/WNL.0b013e31829bfda4
Snowdon, D. A. (1997). Brain infarction and the clinical expression of Alzheimer disease: the nun study. JAMA J. Am. Med. Assoc. 277, 813–817. doi: 10.1001/jama.1997.03540340047031
Sullivan, P. M., Mace, B. E., Estrada, J. C., Schmechel, D. E., and Alberts, M. J. (2008). Human apolipoprotein E4 targeted replacement mice show increased prevalence of intracerebral hemorrhage associated with vascular amyloid deposition. J. Stroke Cerebrovasc. Dis. 17, 303–311. doi: 10.1016/j.jstrokecerebrovasdis.2008.03.011
Tai, L. M., Youmans, K. L., Jungbauer, L., Yu, C., and LaDu, M. J. (2011). Introducing human APOE into Aβ transgenic mouse models. Int. J. Alzheimers. Dis. 2011, 1–9. doi,: 10.4061/2011/810981
Terry, R. D., Gonatas, N. K., and Weiss, M. (1964). Ultrastructural studies in Alzheimer'S presenile dementia. Am. J. Pathol. 44, 269–297.
Thal, D. R., Ghebremedhin, E., Orantes, M., and Wiestler, O. D. (2003). Vascular pathology in Alzheimer disease: correlation of cerebral amyloid angiopathy and arteriosclerosis/lipohyalinosis with cognitive decline. J. Neuropathol. Exp. Neurol. 62, 1287–1301. doi: 10.1093/jnen/62.12.1287
Tian, J., Shi, J., Bailey, K., and Mann, D. M. A. (2004). Relationships between arteriosclerosis, cerebral amyloid angiopathy and myelin loss from cerebral cortical white matter in Alzheimer's disease. Neuropathol. Appl. Neurobiol. 30, 46–56. doi: 10.1046/j.0305-1846.2003.00510.x
Togo, T., Akiyama, H., Iseki, E., Kondo, H., Ikeda, K., Kato, M., et al. (2002). Occurrence of T cells in the brain of Alzheimer's disease and other neurological diseases. J. Neuroimmunol. 124, 83–92. doi: 10.1016/S0165-5728(01)00496-9
Tong, X. K., Nicolakakis, N., Kocharyan, A., and Hamel, E. (2005). Vascular remodeling versus amyloid β-induced oxidative stress in the cerebrovascular dysfunctions associated with alzheimer's disease. J. Neurosci. 25, 11165–11174. doi: 10.1523/JNEUROSCI.4031-05.2005
Utter, S., Tamboli, I. Y., Walter, J., Upadhaya, A. R., Birkenmeier, G., Pietrzik, C. U., et al. (2008). Cerebral small vessel disease-induced apolipoprotein e leakage is associated with alzheimer disease and the accumulation of amyloid β-protein in perivascular astrocytes. J. Neuropathol. Exp. Neurol. 67, 842–856. doi: 10.1097/NEN.0b013e3181836a71
Verghese, P. B., Castellano, J. M., Garai, K., Wang, Y., Jiang, H., Shah, A., et al. (2013). ApoE influences amyloid-β (Aβ) clearance despite minimal apoE/Aβ association in physiological conditions. Proc. Natl. Acad. Sci. U.S A. 110, E1807–E1816. doi: 10.1073/pnas.1220484110
Vinters, H. V., Secor, D. L., Read, S. L., Frazee, J. G., Tomiyasu, U., Stanley, T. M., et al. (1994). Microvasculature in brain biopsy specimens from patients with alzheimer's disease: an immunohistochemical and ultrastructural study. Ultrastruct. Pathol. 18, 333–348. doi: 10.3109/01913129409023202
Vizcaíno, J. A., Csordas, A., Del-Toro, N., Dianes, J. A., Griss, J., Lavidas, I., et al. (2016). 2016 update of the PRIDE database and its related tools. Nucleic Acids Res. 44, D447–D456. doi: 10.1093/nar/gkw880
Vonsattel, J. P. G., Myers, R. H., Tessa Hedley-Whyte, E., Ropper, A. H., Bird, E. D., and Richardson, E. P. (1991). Cerebral amyloid angiopathy without and with cerebral hemorrhages: A comparative histological study. Ann. Neurol. 30, 637–649. doi: 10.1002/ana.410300503
Wilcock, D., and Colton, C. (2009). Immunotherapy, Vascular Pathology, and Microhemorrhages in Transgenic Mice. CNS Neurol. Disord. Drug Targets 8, 50–64. doi: 10.2174/187152709787601858
Wilcock, D. M., Morgan, D., Gordon, M. N., Taylor, T. L., Ridnour, L. A., Wink, D. A., et al. (2011). Activation of matrix metalloproteinases following anti-Aβ immunotherapy; implications for microhemorrhage occurrence. J. Neuroinflammation 8:115. doi: 10.1186/1742-2094-8-115
Wu, K. W., Lv, L. L., Lei, Y., Qian, C., and Sun, F. Y. (2019). Endothelial cells promote excitatory synaptogenesis and improve ischemia-induced motor deficits in neonatal mice. Neurobiol. Dis. 121, 230–239. doi: 10.1016/j.nbd.2018.10.006
Yarchoan, M., Xie, S. X., Kling, M. A., Toledo, J. B., Wolk, D. A., Lee, E. B., et al. (2012). Cerebrovascular atherosclerosis correlates with Alzheimer pathology in neurodegenerative dementias. Brain 135, 3749–3756. doi: 10.1093/brain/aws271
Zekry, D., Duyckaerts, C., Moulias, R., Belmin, J., Geoffre, C., Herrmann, F., et al. (2002). Degenerative and vascular lesions of the brain have synergistic effects in dementia of the elderly. Acta Neuropathol. 103, 481–487. doi: 10.1007/s00401-001-0493-5
Zhang, J., Keene, C. D., Pan, C., Montine, K. S., and Montine, T. J. (2008). Proteomics of human neurodegenerative diseases. J. Neuropathol. Exp. Neurol. 67, 923–932. doi: 10.1097/NEN.0b013e318187a832
Zhang, X., Zhou, K., Wang, R., Cui, J., Lipton, S. A., Liao, F. F., et al. (2007). Hypoxia-inducible factor 1α (HIF-1α)-mediated hypoxia increases BACE1 expression and β-amyloid generation. J. Biol. Chem. 282, 10873–10880. doi: 10.1074/jbc.M608856200
Zhang, Z., Chen, X. Y., Baum, L., Ng, H. K., Mok, V., and Wong, K. S. (2018). Association between the apolipoprotein e gene polymorphism and atherosclerotic middle cerebral artery stenosis. Neurologist 23, 47–50. doi: 10.1097/NRL.0000000000000164
Keywords: cerebrovasculature, Alzheimers disease, cerebral amyloid angiopathy, endothelial cells, mural cells, proteomics, mass spectrometry, perivascular cells
Citation: Ojo JO, Reed JM, Crynen G, Vallabhaneni P, Evans J, Shackleton B, Eisenbaum M, Ringland C, Edsell A, Mullan M, Crawford F and Bachmeier C (2021) Molecular Pathobiology of the Cerebrovasculature in Aging and in Alzheimers Disease Cases With Cerebral Amyloid Angiopathy. Front. Aging Neurosci. 13:658605. doi: 10.3389/fnagi.2021.658605
Received: 26 January 2021; Accepted: 10 March 2021;
Published: 17 May 2021.
Edited by:
Eszter Farkas, University of Szeged, HungaryReviewed by:
Stefan Prokop, University of Florida, United StatesRoxana Octavia Carare, University of Southampton, United Kingdom
Copyright © 2021 Ojo, Reed, Crynen, Vallabhaneni, Evans, Shackleton, Eisenbaum, Ringland, Edsell, Mullan, Crawford and Bachmeier. This is an open-access article distributed under the terms of the Creative Commons Attribution License (CC BY). The use, distribution or reproduction in other forums is permitted, provided the original author(s) and the copyright owner(s) are credited and that the original publication in this journal is cited, in accordance with accepted academic practice. No use, distribution or reproduction is permitted which does not comply with these terms.
*Correspondence: Joseph O. Ojo, jojo@roskampinstitute.org