Transcriptome Analyses in BV2 Microglial Cells Following Treatment With Amino-Terminal Fragments of Apolipoprotein E
 Tanner B. Pollock1
  Giovan N. Cholico1
  Noail F. Isho2
  Ryan J. Day2
  Tarun Suresh1 Erica S. Stewart1
  Madyson M. McCarthy1
  Troy T. Rohn1*
- 1Department of Biological Sciences, Boise State University, Boise, ID, United States
- 2Health Sciences Department, University of Washington School of Medicine, Seattle, WA, United States
Despite the fact that harboring the apolipoprotein E4 (APOE4) allele represents the single greatest risk factor for late-onset Alzheimer’s disease (AD), the exact mechanism by which ApoE4 contributes to disease progression remains unknown. Recently, we demonstrated that a 151 amino-terminal fragment of ApoE4 (nApoE41–151) localizes within the nucleus of microglia in the human AD brain and traffics to the nucleus causing toxicity in BV2 microglia cells. In the present study, we examined in detail what genes may be affected following treatment by nApoE41–151. Transcriptome analyses in BV2 microglial cells following sublethal treatment with nApoE41–151 revealed the upregulation of almost 4,000 genes, with 20 of these genes upregulated 182- to 715-fold compared to untreated control cells. The majority of these 20 genes play a role in the immune response and polarization toward microglial M1 activation. As a control, an identical nApoE31–151 fragment that differed by a single amino acid at position 112 (Cys→Arg) was tested and produced a similar albeit lower level of upregulation of an identical set of genes. In this manner, enriched pathways upregulated by nApoE31–151 and nApoE41–151 following exogenous treatment included Toll receptor signaling, chemokine/cytokine signaling and apoptosis signaling. There were unique genes differentially expressed by at least two-fold for either fragment. For nApoE31–151, these included 16 times as many genes, many of which are involved in physiological functions within microglia. For nApoE41–151, on the other hand the number genes uniquely upregulated was significantly lower, with many of the top upregulated genes having unknown functions. Taken together, our results suggest that while nApoE31–151 may serve a more physiological role in microglia, nApoE41–151 may activate genes that contribute to disease inflammation associated with AD. These data support the hypothesis that the link between harboring the APOE4 allele and dementia risk could be enhanced inflammation through activation of microglia.
Introduction
Alzheimer’s disease (AD) is the most common form of dementia and is classified as a progressive, neurodegenerative disease whose symptoms include loss of memory and higher executive functioning (DeTure and Dickson, 2019). A prominent factor for late-onset AD is apolipoprotein E (ApoE), a lipoprotein transporter encoded by a single gene with three alleles (APOE2, E3, and E4). The APOE4 allele is found in approximately 40% of AD patients and represents the greatest genetic risk factor for late-onset AD (Raber et al., 2004). In contrast, harboring the APOE3 allele is neutral in dementia risk even though this version differs by only a single amino acid from ApoE4, having a cysteine at position 112 instead of arginine (Raber et al., 2004). A central question is how does this single amino acid difference account for dementia risk on a molecular level?
Studies have suggested that the key could be enhanced proteolysis of ApoE4 into fragments that have a toxic-gain of function (Rohn, 2013). Thus, ApoE4 is proteolyzed more readily than ApoE3, and fragments of ApoE4 are more prevalent in the brains of AD patients (Huang et al., 2001; Rohn et al., 2012; Rohn, 2013). Recently, we extended these findings by demonstrating that an amino-terminal fragment of ApoE4 (nApoE41–151) generated following cleavage of full-length ApoE4 by extracellular cellular proteases including MMP-9 is taken up by microglia, targets to the nucleus, and can induce cytotoxicity (Love et al., 2017). We also found the presence of this fragment in the nucleus of microglia in both E4/E4 and E3/E3 cases of postmortem AD brain sections (Love et al., 2017). Our hypothesis is that nApoE41–151 acts as a transcription factor leading to the expression of genes that promote microglia activation (Pollock et al., 2019). In the present study we examined this possibility by utilizing BV2 microglia cells and demonstrated that sublethal concentrations of nApoE41–151 promoted upregulation of thousands of genes, many linked to the functioning of the immune system and microglia activation. Surprisingly an identical nApoE31–151 fragment (differing by one amino acid at position 112, C→R) also led to an upregulation of many of the same genes as nApoE41–151. These results suggest a novel role for ApoE and further, potentially link harboring the APOE4 allele to inflammation and degeneration that has long been associated with AD (Streit, 2005; Graeber and Streit, 2010; Heneka et al., 2014; Das and Chinnathambi, 2019).
Materials and Methods
Materials
Construction and purification of the amino-terminal fragments 1–151 for ApoE4 (nApoE41–151) or ApoE3 (nApoE31–151) was contracted out to GenScript (Piscataway, NJ, United States). For both fragments, a 6X-His tag was coupled to the fragments to facilitate purification. Mouse CXCL2 or IL-12β quantikine ELISA kits were purchased from R&D Systems (Minneapolis, MN, United States).
Cell Culture of BV2 Cells
BV2, murine microglial cells, were maintained at 37°C and 6% CO2 in a humidified incubator. Cells were maintained in RPMI 1640 Media (Hyclone) supplemented with 10% standard fetal bovine serum (Hyclone), 10% Cellgro MEM Non-essential Amino Acid (Corning) and 10% Penicillin streptomycin (Hyclone). Cells were cultured in 50 mL T25 Flasks. All supplies were purchased from ThermoFisher Scientific Inc. (Waltham, MA, United States). Treatment of BV2 cells was undertaken by incubation with nApoE31–151 or nApoE41–151 fragments diluted in conditioned media at a concentration of 25 μg/ml for 5 h to assess mRNA expression. Control cells (untreated) had an equivalent amount of conditioned media added to the wells.
Total RNA Extraction and cDNA Synthesis in BV2 Microglia Cells
Total RNA was extracted from cells with the Direct-zol RNA MicroPrep Kit (Zymo Research Corp., CA, United States) according to manufacturer’s instructions. Genomic DNA was eliminated using TURBO DNAse as described by the manufacturer (Life Technologies, CA, United States). RNA quality was assessed using spectrophotometry and gel electrophoresis. Total cDNA was generated from 1 (μg of total RNA using qScript cDNA SuperMix (QuantaBio, MA, United States). Prior to use in qPCR, cDNA was diluted 1:2 with water.
CXCl2 and IL-12b Quantitative PCR
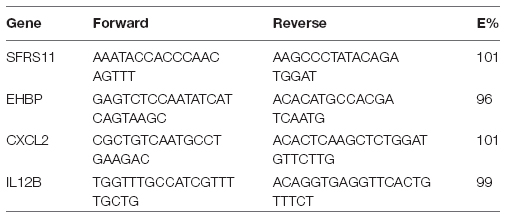
Primers were designed to specifically amplify a portion of either the IL-12β or CXCL2 genes. Serine/arginine-rich splicing factor 11 (SFRS11) and EH domain-binding protein 1 (EHBP), two ultraconserved elements that have invariant copy number in mice, were used as reference genes. All primers were synthesized by Integrated DNA Technologies (Coralville, IA). For Il12β, the forward sequence was TGGTTTGCCATCGTTTTGCTG and the reverse was ACAGGTGAGGTTCACTGTTTCT. For CXCL2, the forward sequence was CGCTGTCAATGCCTGAAGAC and the reverse was ACACTCAAGCTCTGGATGTTCTTG. Primer efficiencies (E%) were confirmed to be between 90 and 110%. Primers were confirmed to be specific based upon melting profiles:
The total volume for each reaction was 20 μl and included 10 μl Forget-Me-Not EvaGreen qPCR Master Mix (Biotium Inc., Ca, United States), 1 μl of each appropriate primer (10 μM), 4 μl of nuclease free water, and 4 μl of template cDNA. Each PCR reaction also included a reverse transcription negative control to confirm the absence of genomic DNA in triplicate and a non-template negative control to confirm the absence of primer dimerization in triplicate. Real-time qPCR was run on a LightCycler 96 (Roche, Basel, Switzerland). The cycling conditions were 1 cycle of denaturation at 95°C for 2 min, followed by 40 cycles of amplification (95°C for 5 s, 55°C for 10 s, and 72°C for 15 s) and one cycle of product melting (95°C for 10 s, 65°C for 60 s, and 97°C for 1 s). All samples were amplified in triplicate, and the Cq value for each reaction was determined by the LightCycler 96 SW1.1. Relative differences in expression between treatments were determined by the LightCycler 96 SW1.1 and confirmed with the ΔΔCt method.
RNA-Sequencing, Mapping, and Analysis
RNA-Sequencing
RNA-sequencing was performed by the Molecular Research Core Facility at Idaho State University (Pocatello, ID). All samples were sequenced using an Illumina HiSeq4000 Sequencer. Reads of 1 × 75 bp were demultiplexed and adapter sequences were removed using Trim Galore v0.5.01. Trimmed reads were then assessed for quality using FASTQC v0.11.82. Reads were then mapped to a mouse reference genome (version GRCm38.p6) using Hisat2 v2.1.0 (Kim et al., 2015). Gene counts were determined using HTSeq v0.11.0 (Anders et al., 2015) after which, counts were normalized using the median-of-ratios method with Deseq2 v1.22.2 (Love et al., 2014). Deseq2 was then used to calculate p-values using a Wald test with a Benjamini-Hochberg post hoc correction. Genes with an adjusted p-value < 0.05 and a fold-change >2 were considered to be differentially expressed. Differentially expressed genes (DEGs) were enriched for gene ontologies (GO) using PANTHER3. Analyses were conducted to assess biological processes, molecular functions, and cellular components.
The data discussed in this publication have been deposited in NCBI’s Gene Expression Omnibus and are accessible through GEO Series accession number GSE1534544.
Gene Ontology Analysis
A list of every influenced gene and their respective fold changes was imputed into the PANTHER classification system (Shannon et al., 2003; Bindea et al., 2009). Statistical enrichment tests were performed against the musculus genome, and the Bonferroni correction was used. This process was performed for biological processes and pathways (Mi et al., 2019a), and the respective outputs were used. All data were statistically significant with a corrected p-value < 0.05. In addition, raw data was used to create a list of all genes upregulated by either nApoE31–151 or nApoE41–151 and a separate list of all genes downregulated by nApoE1–151 fragments was imputed into the PANTHER classification system (Mi and Thomas, 2009; Mi et al., 2019b) and a functional classification analysis was performed.
Statistical Analysis
Transcriptome data was used for analysis by averaging three independent measurements. Treatment group data was then referenced as a percent fold change increase from controls. Data was segregated and organized by gene and treatment group. The organization of data was to utilize the nApoE41–151 (E4 group) as a standard, organizing the data by highest to lowest change for the E4 treatment group and aligning the fold change for the nApoE31–151 (E3 group) to those values for a matched pairs system. Data was then pulled into the statistical analysis program, R, as a.csv file and checked for normality assumptions using a Shapiro-Wilks Normality test on each treatment group. Data failed to conform to normality. A Spearman Rank Correlation was used as opposed to Pearson’s Correlation due to the lack of normality in data and extreme values. The Spearman Rank Correlation was then run on the top 500 highest fold change genes for the E4 group in comparison to the matched genes in the E3 group to identify similarities in trends. The resulting rho value was then referenced alongside data to generate Figure 6.
Confocal Microscopy
Following treatment studies, BV2 cells were fixed by incubating cells in 4% paraformaldehyde for 23 min. For antibody labeling, cells were washed with 0.1 M Tris–buffered saline (TBS), pH 7.4, and pretreated with 3% hydrogen peroxide in 10% methanol to block endogenous peroxidase activity. Slides were subsequently washed in TBS with 0.1% Triton X-100 (TBS-A) and then blocked for 30 min in TBS-A with 3% bovine serum albumin (TBS-B). Slides were further incubated overnight at room temperature with the anti-His rabbit antibody (1:5,000). Following two washes with TBS-A and a wash in TBS-B, slides were incubated with the anti-rabbit HRP-conjugated secondary antibody. Visualization was accomplished by using a tyramide signal amplification kit (Molecular Probes, Eugene, OR, United States) consisting of Alexa Fluor 488-labeled tyramide (green, Ex/Em = 495/519). Slides were mounted using ProLong Gold Antifade Mountant with DAPI (Molecular Probes). Images were taken with a Zeiss LSM 510 Meta system combined with the Zeiss Axiovert Observer Z1 inverted microscope and ZEN 2009 imaging software (Carl Zeiss, Inc., Thornwood, NY, United States). Confocal Z-stack and single plane images were acquired with an Argon (488 nm) and a HeNe (543 nm) laser source. Z-stack images were acquired utilizing the Plan-Apochromat 63 × /NA 1.4 and alpha Plan-Fluar 100 × /NA1.45 Oil objectives and with the diode (405 nm) and Argon (488 nm) laser sources, emission band passes of 505–550 nm for the detection of the nApoE1–151 (green channel, Alexa Fluor 488). Orthogonal projection images were constructed from Z-stacks in order to demonstrate the staining is nuclear.
Results
Confirmation of Nuclear Localization of Amino-Terminal Fragments of apoE in BV2 Microglial Cells
Our previous findings have demonstrated the nuclear localization of amino-terminal fragments of apoE4 within microglia both in vivo, in the AD brain and in vitro following exogenous treatment of BV2 microglia cells (Love et al., 2017). To confirm and extend these findings, we exogenously treated BV2 microglia cells with both nApoE31–151 and nApoE41–151 fragments, which differ by a single amino acid (C→R). As shown in Figure 1, uptake and trafficking to the nucleus was apparent for both fragments, based on orthogonal projections taken from Z-stack images (Figure 1, crosshairs, panels B and G). These results are consistent with our previous findings (Love et al., 2017).
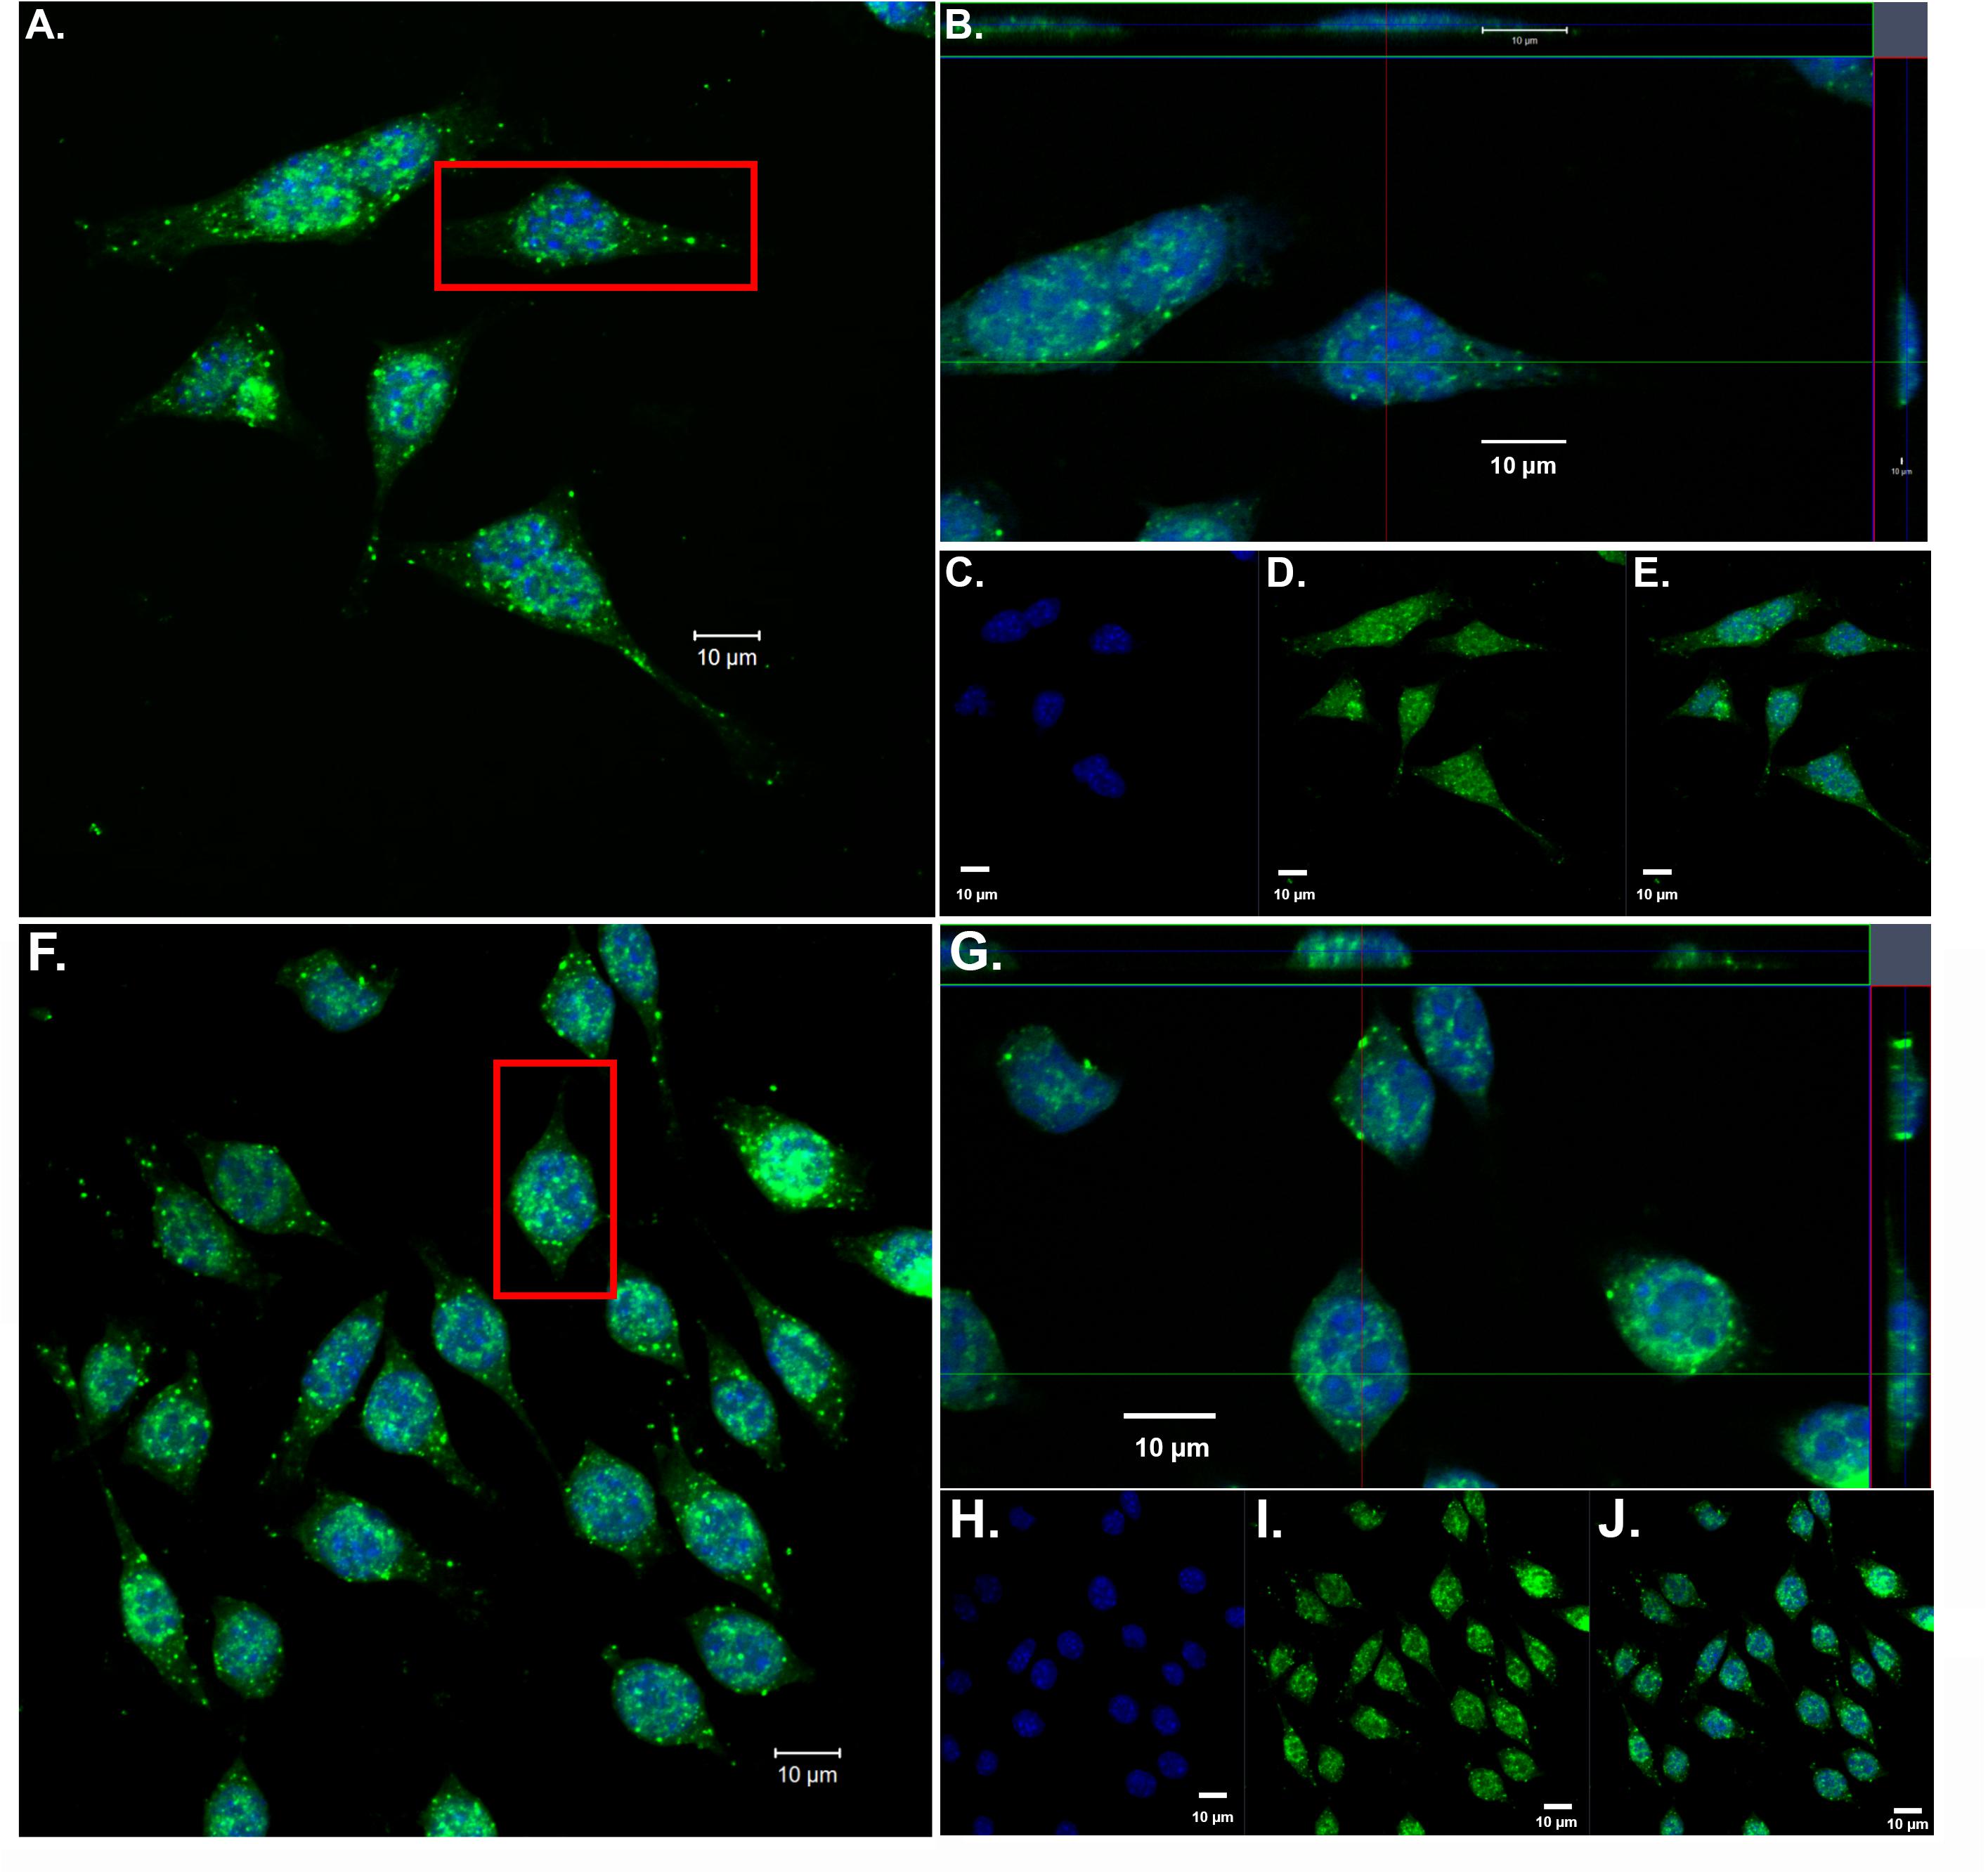
Figure 1. Orthogonal projections of confocal Z-stacks show nuclear localization of amino-terminal fragments of nApoE3 and E4 following exogenous treatment in BV2 microglia cells. BV2 microglia cells were treated with either 25 μg/ml of nApoE31–151 (A–E) or with nApoE41–151 (F–J) for 24 h, fixed, and immunostained with anti-His antibody to detect the localization of the apoE fragments. Confocal images were captured and Z-stacks were constructed showing the subcellular localization of nApoE fragments. (A) High magnification merged image depicting nApoE31–151 in green and DAPI nuclear staining in blue. (B) Inset orthogonal projection from red rectangle in panel A demonstrating nuclear localization of nApoE31–151 in a single BV2 microglia cell (crosshair). (C–E) Low magnification of nApoE31–151 labeling with DAPI (blue, C), nApoE31–151 (green, D), and the overlapped image (E). All scale bars represent 10 μm. (F–J): Identical to panels A–E except staining is representative of nApoE41–151 labeling. As with nApoE31–151, orthogonal images clearly demonstrate the nuclear labeling of nApoE41–151 (crosshair, G). Data are representative of five individual experiments.
Transcriptome Analysis of BV2 Microglia Cells Following Treatment With ApoE41–151
We hypothesize the nApoE41–151 fragment is taken up by microglia cells, traffics to the nucleus and may act as a transcription factor leading to the change in gene expression. For example, we have recently demonstrated that treatment of BV2 cells with nApoE41–151 led to an increase in the expression and release of the inflammatory cytokine, TNFα, a key trigger of microglia activation (Pollock et al., 2019). In addition, we demonstrated a specific binding interaction of nApoE41–151 with the TNFα promoter region (Pollock et al., 2019). In the current study, to test whether nApoE41–151 leads to the induction of a broader array of inflammatory genes or other pertinent genes, we performed a transcriptome analysis following treatment of BV2 microglia cells with a sublethal concentration of nApoE41–151. In this regard, a concentration of 25 μg/ml showed no toxic effects following morphological examination and LDH measurements. Cells were viable, healthy, and displayed no indication of degeneration. LDH values for controls (relative units) were 0.34 ± 0.096 SEM and 0.370 ± 104 SEM for treated cells (N = 3, p-value = 0.80). In comparison to untreated control BV2 cells nearly 8000 genes were determined to be differentially expressed in the presence of nApoE41–151. The raw data file can be accessed through Supplementary Data File S1. In addition, files containing the raw data are available in the GEO repository (GEO accession number, GSE153454). Although there were a similar number of up-regulated and down-regulated genes, the up-regulated genes had an average of a 6.6-fold change and the down-regulated genes had an average of a 2.2-fold change. Of the twenty most up-regulated genes, thirteen are known to be involved in the inflammatory immune response (Table 1). Biological processes, cellular components, molecular functions, and pathways for each gene were assigned by the PANTHER classification system (Figure 2). Involved cellular components included the cell, the extracellular region, the membrane etc. For each cellular component, there were many more associated genes that were upregulated than downregulated. The biological processes associated with genes differentially expressed in the presence of nApoE41–151 included “cellular processes,” “biological regulation,” “response to stimulus,” and “immune system processes.” Each given biological process contained more up-regulated genes than down-regulated genes, with “cellular component organization” and “reproduction” being the least up-regulated.
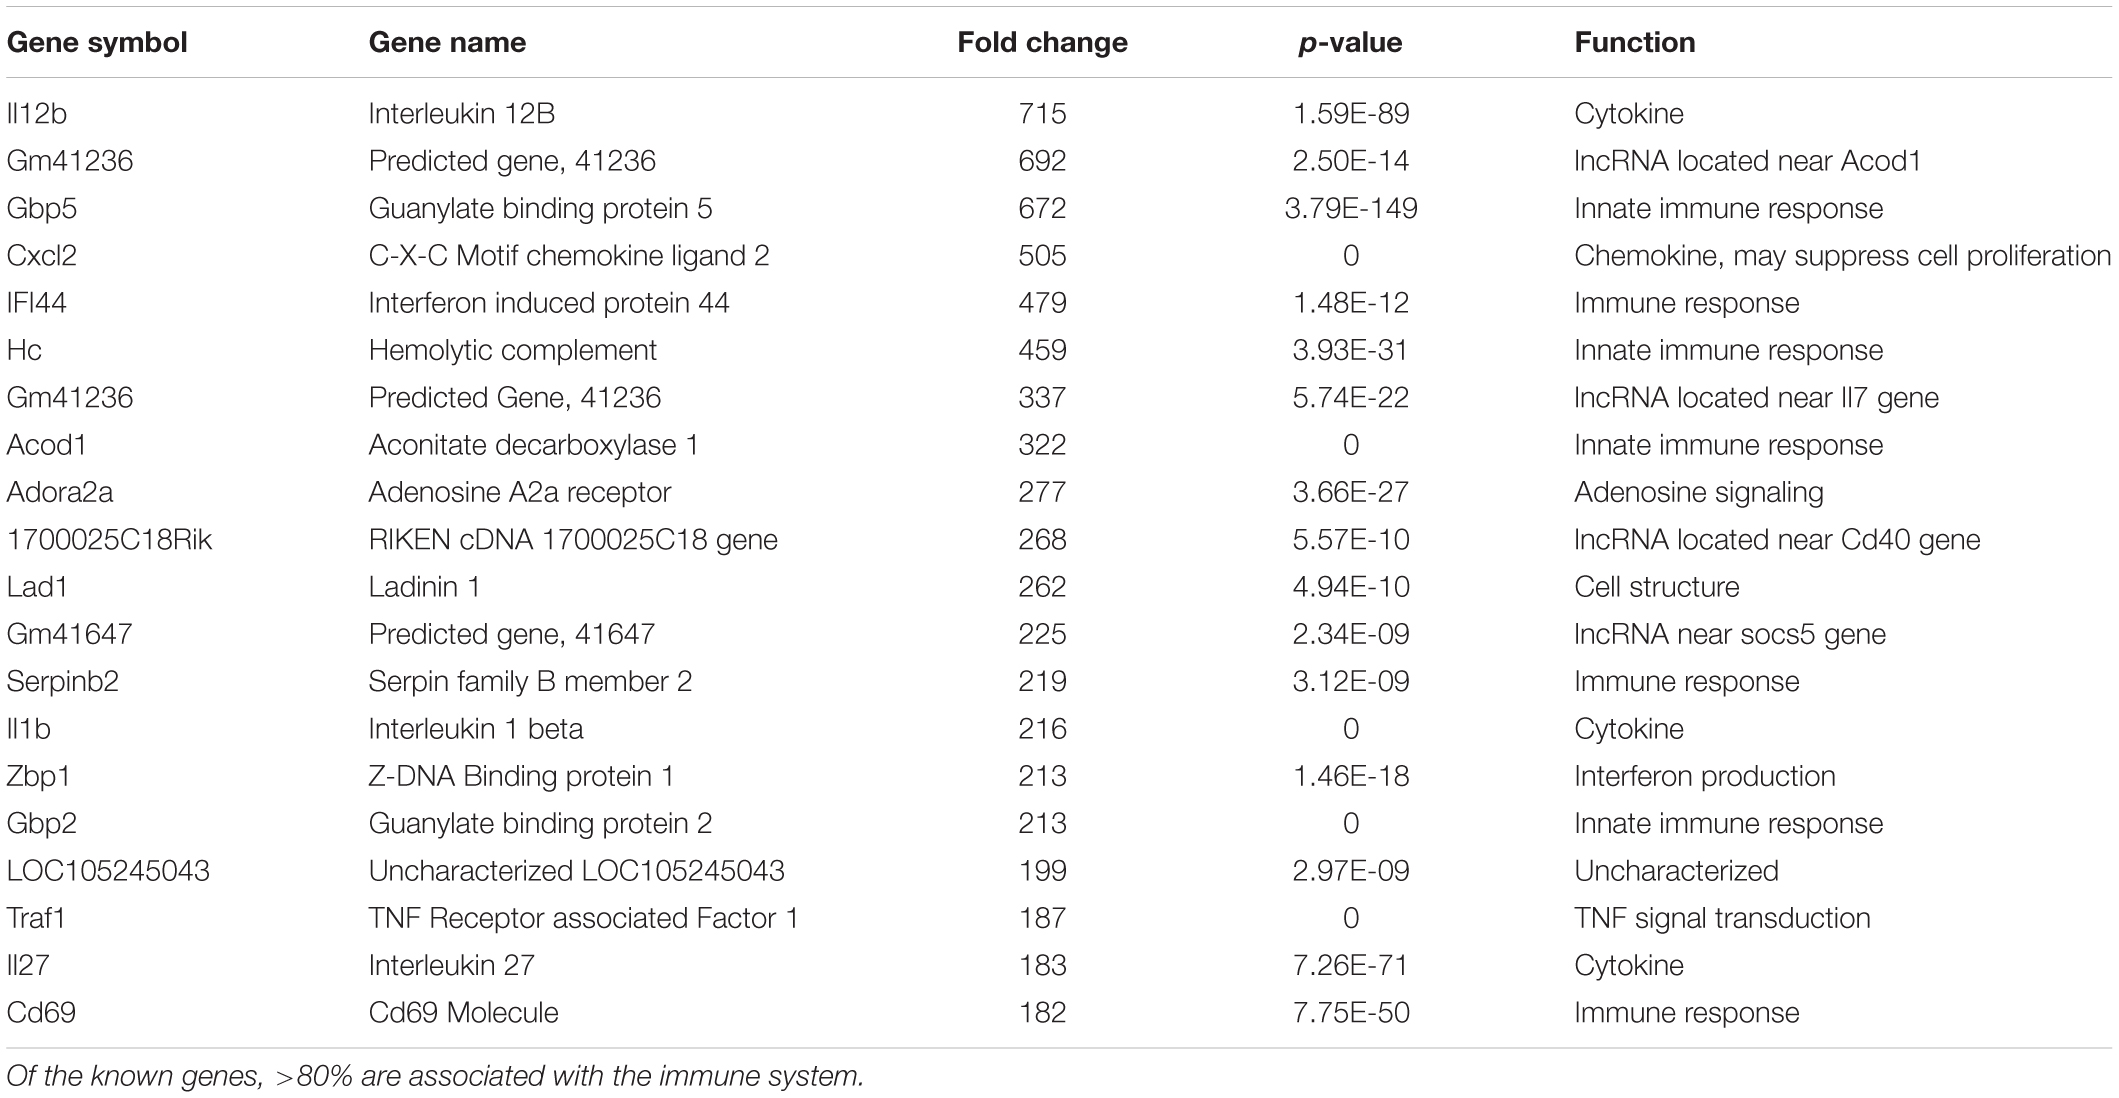
Table 1. The twenty most up-regulated genes and their functions following treatment of BV2 microglia cells with nApoE41–151.
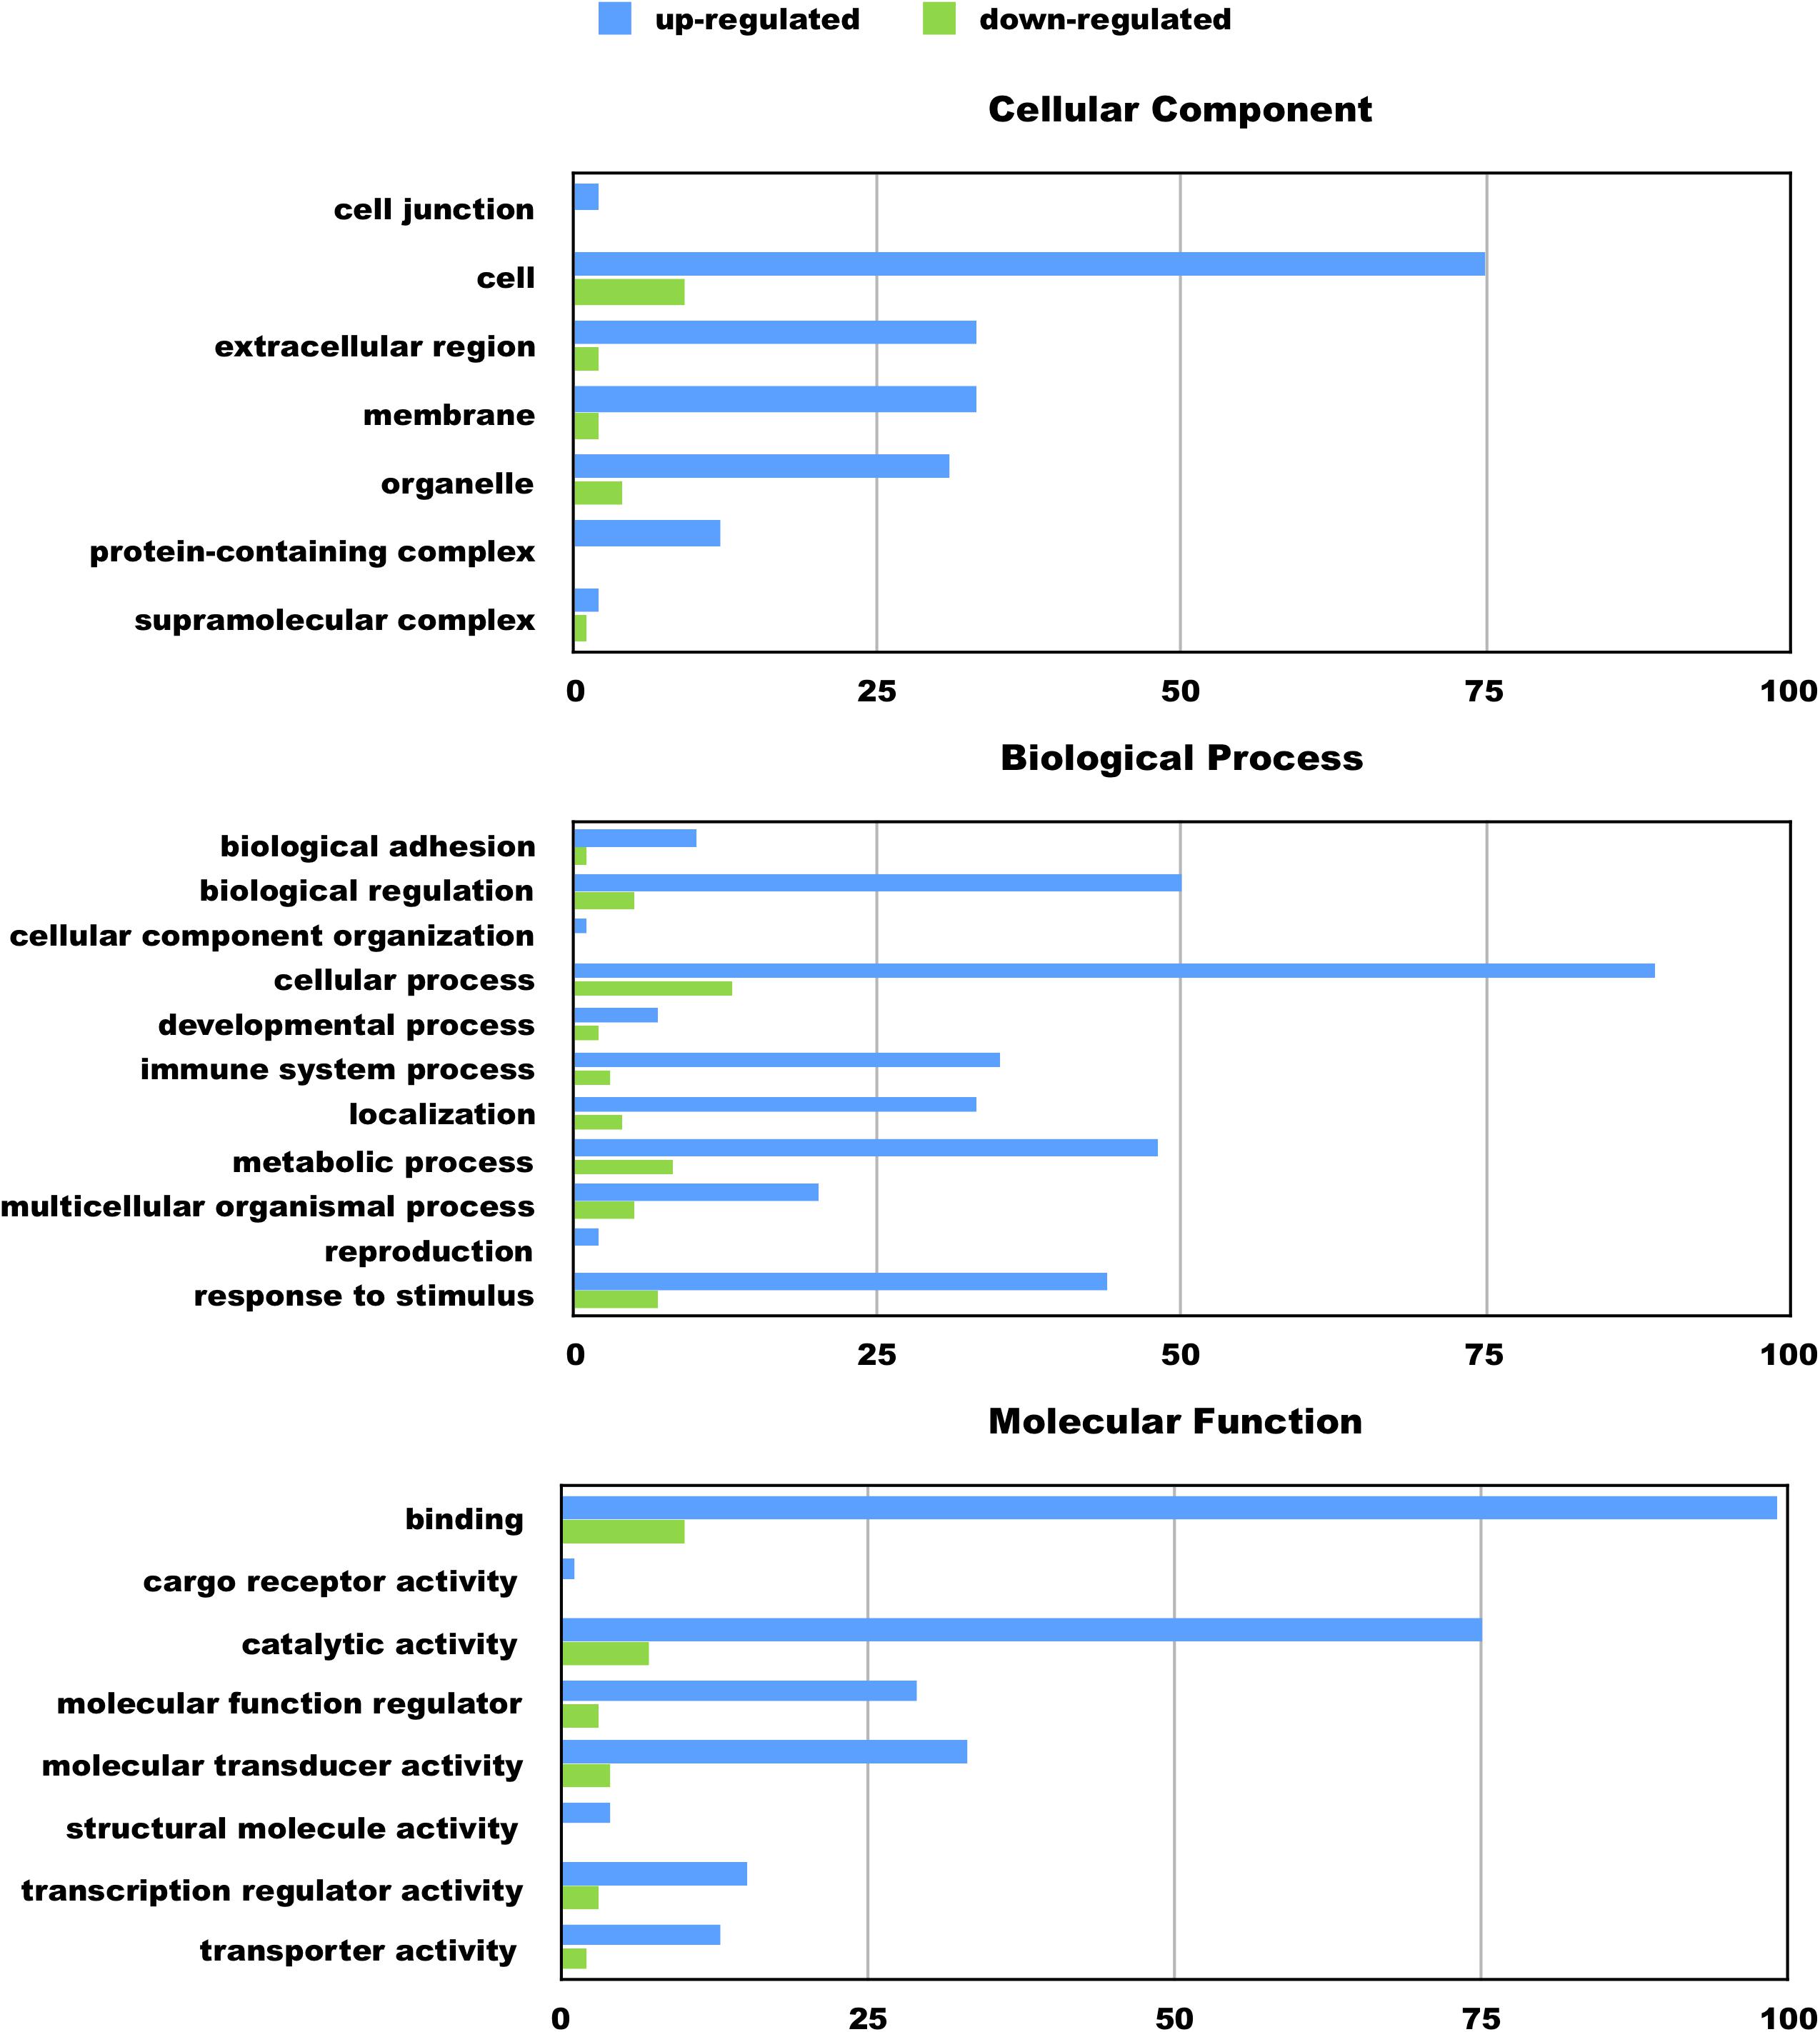
Figure 2. Functional categorization of up- and downregulated genes in BV2 microglia cells treated with an amino-terminal fragment of apoE4. BV2 cells were left untreated or treated for 5 h with nApoE41–151 followed by total RNA purification and transcriptome analyses. The x-axis reflects the number of genes included for each component, process, or function. For example, there were a total of 75 upregulated genes categorized as being a part of the cellular component. Functional characterization was based on gene ontology (GO) annotations. Detailed information is shown in Supplementary Data File S1.
To verify transcriptome results, two genes were chosen and independently verified by both RT-qPCR and ELISA assays. In comparison to untreated controls, the differential expression of two genes, CXCL2 and IL-12B, and their corresponding proteins were confirmed with qPCR and ELISA (Figure 3). In this regard following treatment of BV2 microglia cells with nApoE41–151, both CXCL2 and IL-12B showed large increases in the fold mRNA levels (Figures 3A,C) as well as in the secreted protein in conditioned media (Figures 3B,D).
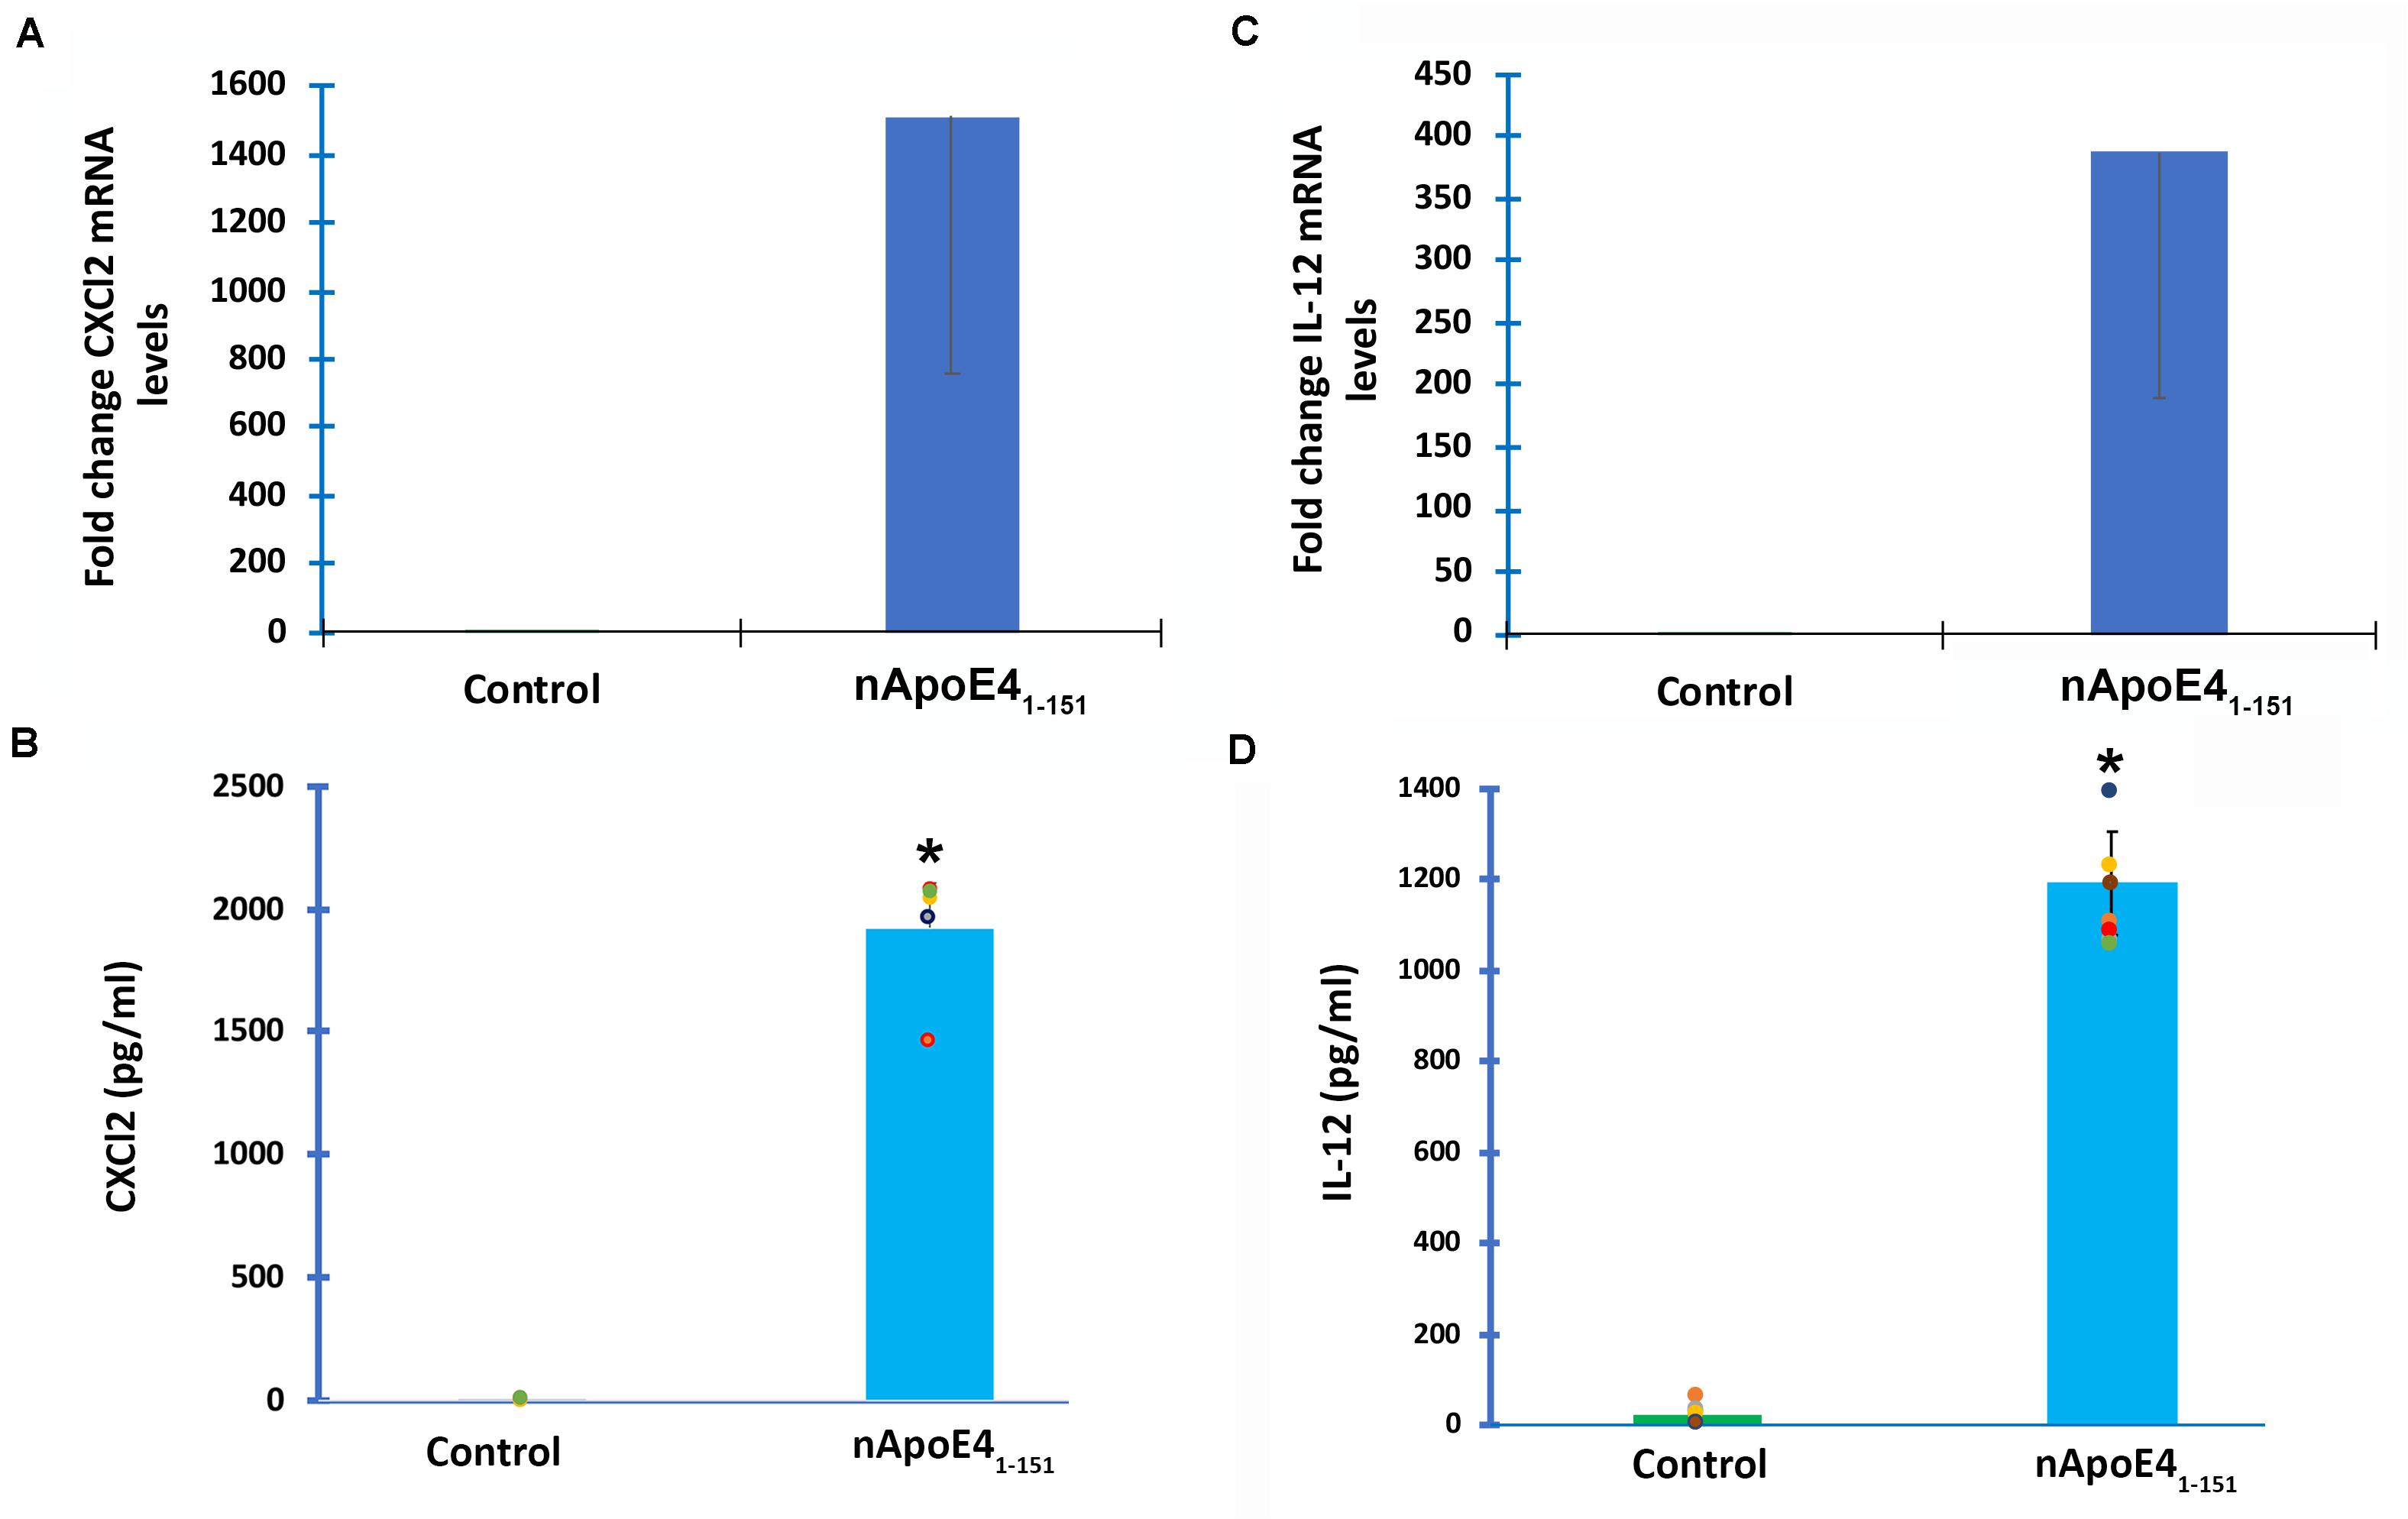
Figure 3. Validation of transcriptome analysis by RT-PCR and ELISA of two identified upregulated genes. Two genes (CXCL2 and IL12B) identified by transcriptome analyses to be significantly upregulated in BV2 cells following treatment with 25 μg/ml apoE41–151 (Table 1) were independently tested by RT-PCR (A,C) or ELISA (B,D) in order to validate transcriptome findings. (A) BV2 cells were left untreated (control, green bar) or treated for 5 h with 25 μg/ml nApoE41–151 (blue bar), and RNA was extracted. RT-PCR analysis indicated a ∼1,500-fold increase in the expression of the inflammatory chemokine, CXCl2. Data are representative of two independent experiments. (B) Secreted CXCl2 levels are significantly elevated following treatment of BV2 cells with nApoE41–151 (blue bar) as compared to untreated controls (green bar). Data are representative of five independent experiments ± SEM *denotes p-value is <0.0001 between control and nApoE41–151. (C) BV2 cells were left untreated (control, green bar) or treated for 5 h with 25 μg/ml nApoE41–151 (blue bar), and RNA was extracted. RT-PCR analysis indicated a ∼388-fold increase in the expression of the inflammatory cytokine, IL-12b. Data are representative of two independent experiments. (D) Secreted IL-12b levels are significantly elevated following treatment of BV2 cells with nApoE41–151 (blue bar) as compared to untreated controls (green bar). Data are representative of eight independent experiments ± SEM *denotes p-value is < 0.00001 between control and nApoE41–151.
Many biological processes involved in the inflammatory immune response were enriched by the nApoE41–151 fragment, while many processes involved in cell division were down regulated (Figure 4A). The molecular functions of regulated genes included binding, catalytic activity and molecular transducer activity. Each molecular function contained more related up-regulated genes than down-regulated genes. Numerous pathways related to the inflammatory immune response were also enriched, including the apoptosis signaling pathway (Figure 4B). Of the 72 genes in the apoptosis signaling pathway (P00006), 66 were differentially expressed following the introduction of nApoE41–151.
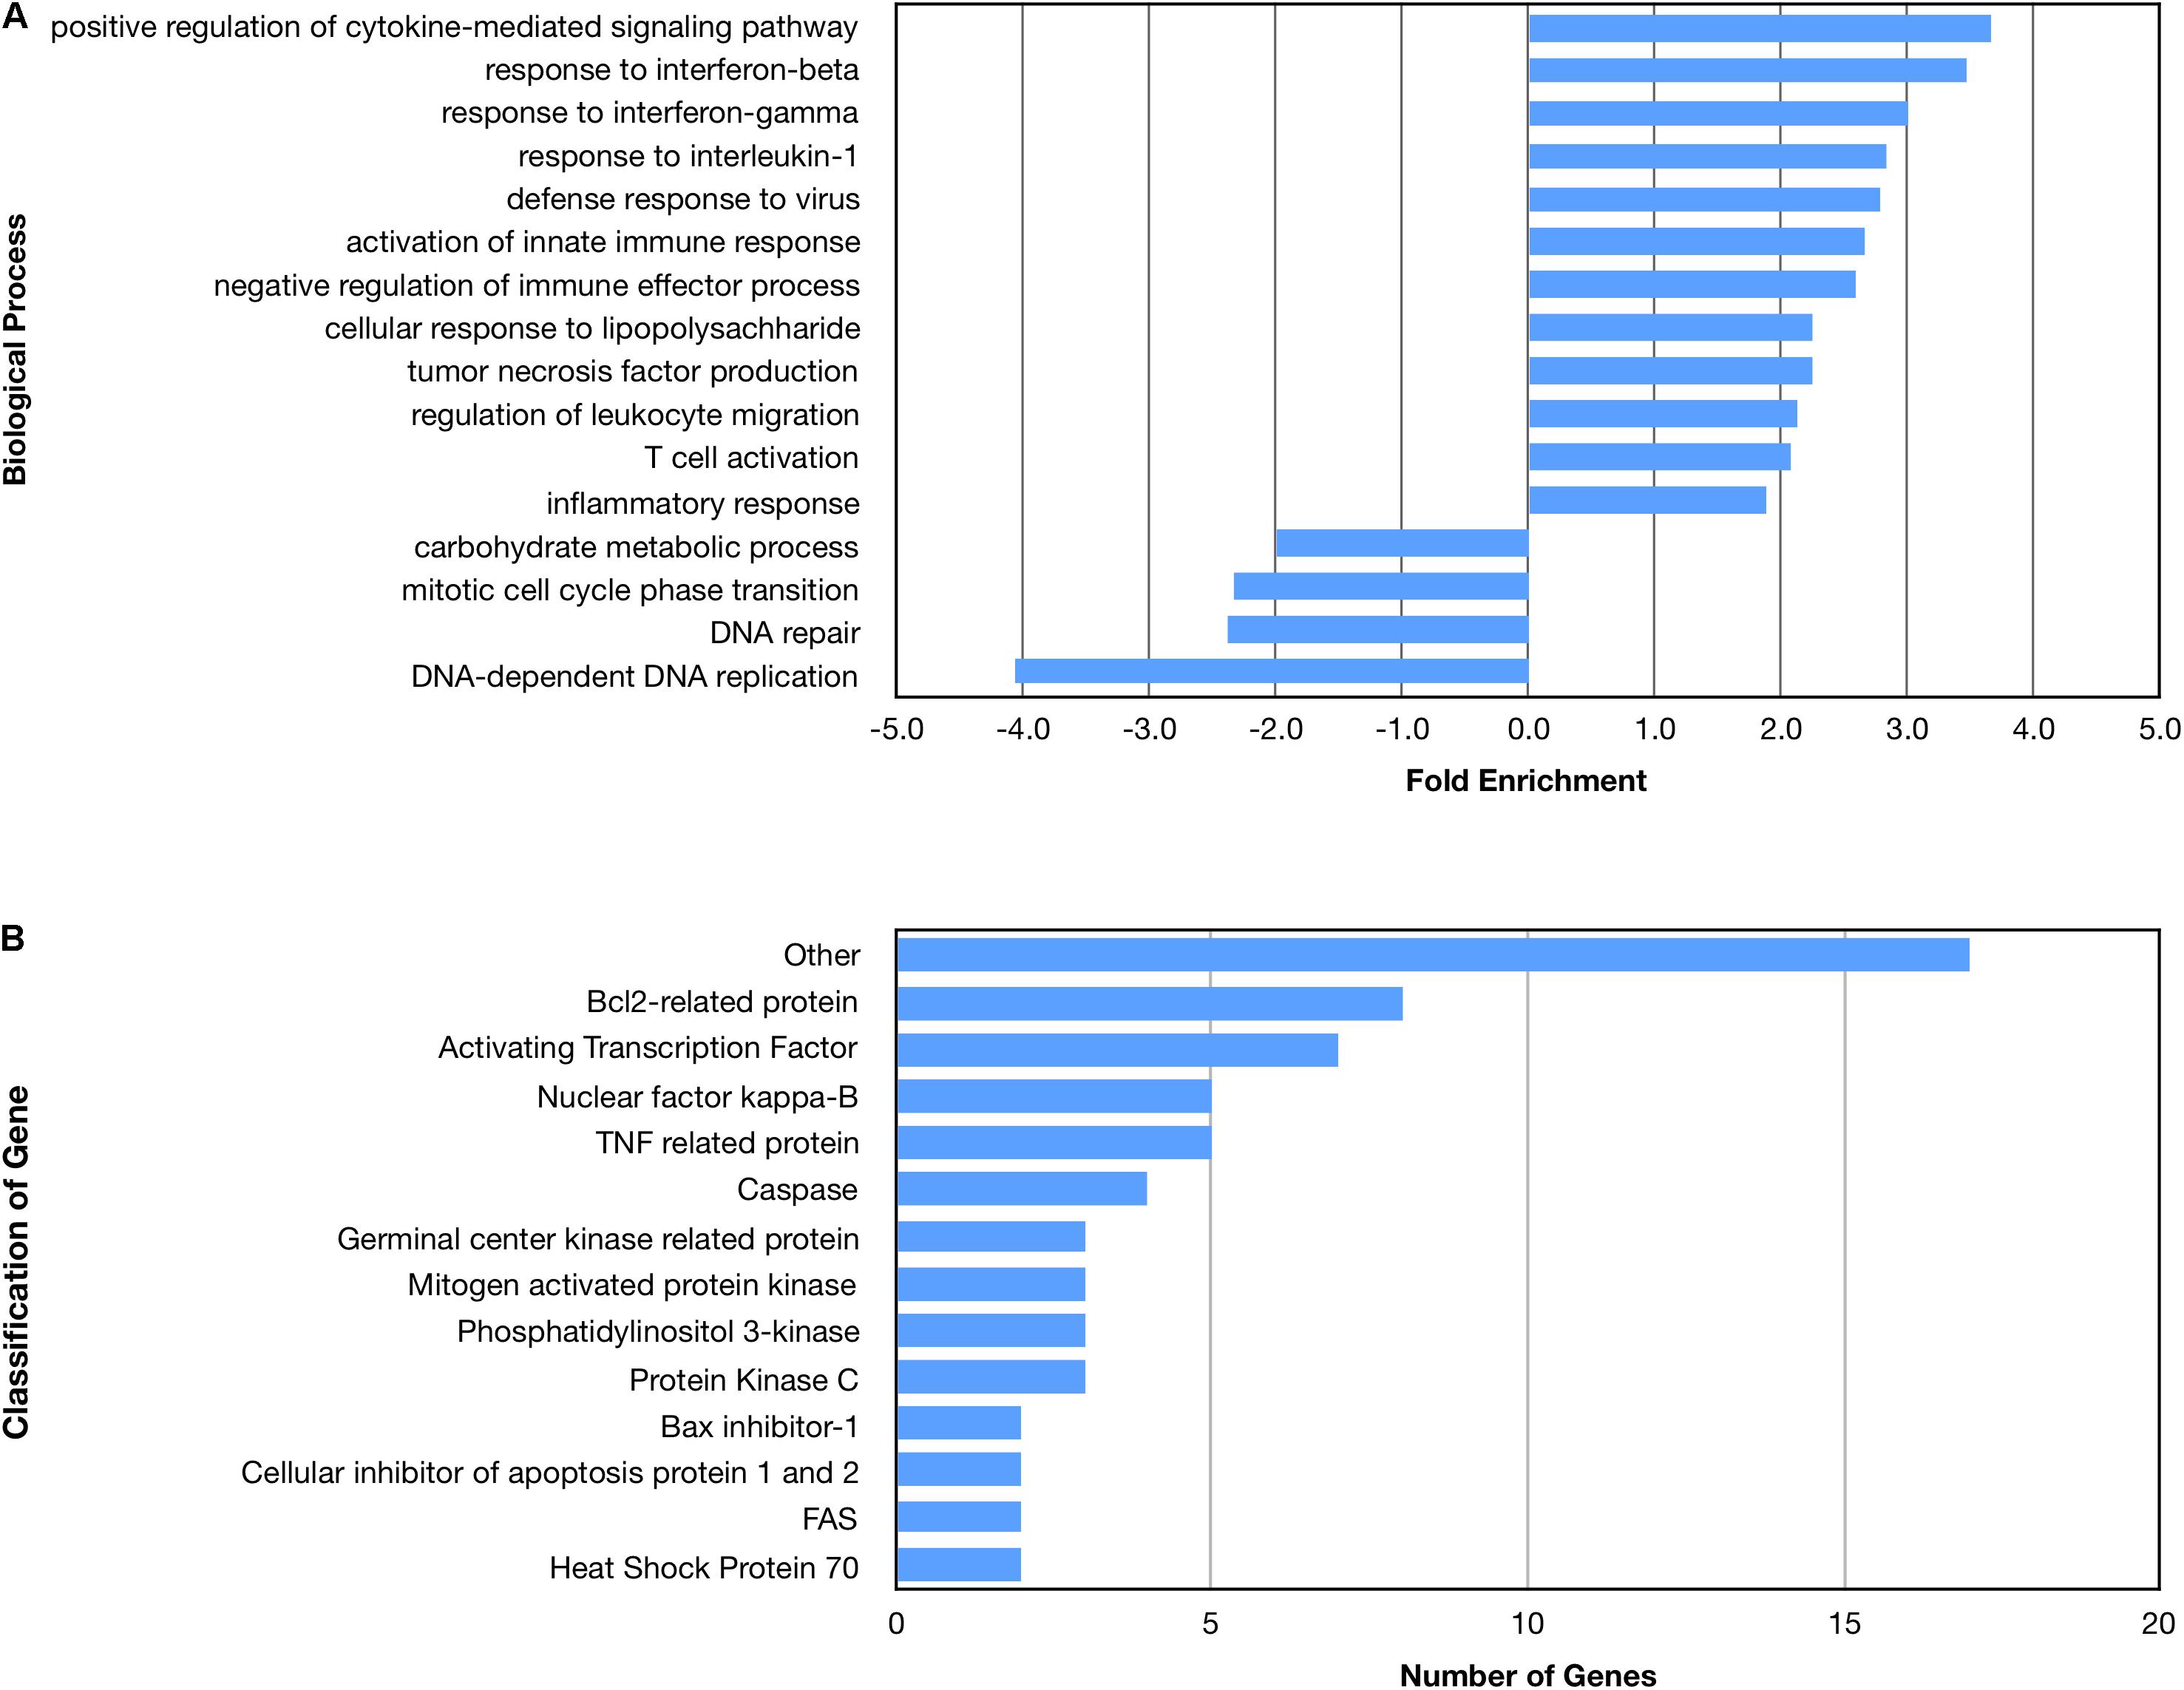
Figure 4. Enriched biological processes and classification of apoptosis related genes regulated by an amino terminal fragment of nApoE4. BV2 cells were plated onto 6-well plates to confluency and treated with or without ApoE41–151 for 5 h. Following treatment, total RNA was extracted and transcriptome analysis was carried out as described in the Materials and Methods. (A) Data are expressed as fold enrichment of biological processes in BV2 microglia cells in the presence of the ApoE41–151. Up-regulated processes are involved in the inflammatory immune response and the activation of BV2 microglia, while down-regulated processes are involved in cell division. (B) Classification of genes in the apoptosis signaling pathway regulated by ApoE41–151. A total of 66 out of 72 genes in the apoptosis signaling pathway (P00006) were influenced by the introduction of ApoE41–151. Enrichment and classification analyses were conducted using the PANTHER classification system (pantherdb.org).
Transcriptome Analysis of BV2 Microglia Cells Following Treatment With ApoE31–151
We have previously documented the nuclear presence of nApoE1–151 fragments within microglia of the human AD brain whose genotype was E3/E3 (Love et al., 2017). This would suggest that nApoE31–151 may also act as a transcription factor leading to changes in gene expression. Therefore, we also performed an identical transcriptome analysis following treatment of BV2 microglia cells with nApoE31–151. It is important to note, that in our previous study, treatment of nApoE31–151 did not lead to cell toxicity (Love et al., 2017). As an initial approach, a broad overview of the similarities and differences between the two fragments was investigated. Treatment with nApoE31–151 led to a differential upregulation of 2,262 genes by at least two-fold as compared to 1,617 genes for nApoE41–151. Examining the top 20 genes that were induced by nApoE31–151, the representative fold change ranged from 118- to 410-fold increased as compared to non-treated control cells (Table 2). This is in contrast to a representative fold change of 182- to 714-fold increase following treatment by nApoE41–151 (Table 1). Of these 20 genes, 7 were also in the top 20 for nApoE41–151-induced genes including II12B, GM41236, GBP5, CXCl2, ACOD1, II1B, and GBP2. Of the known top 20 genes, 70% are known to be associated with immune function (Table 2).
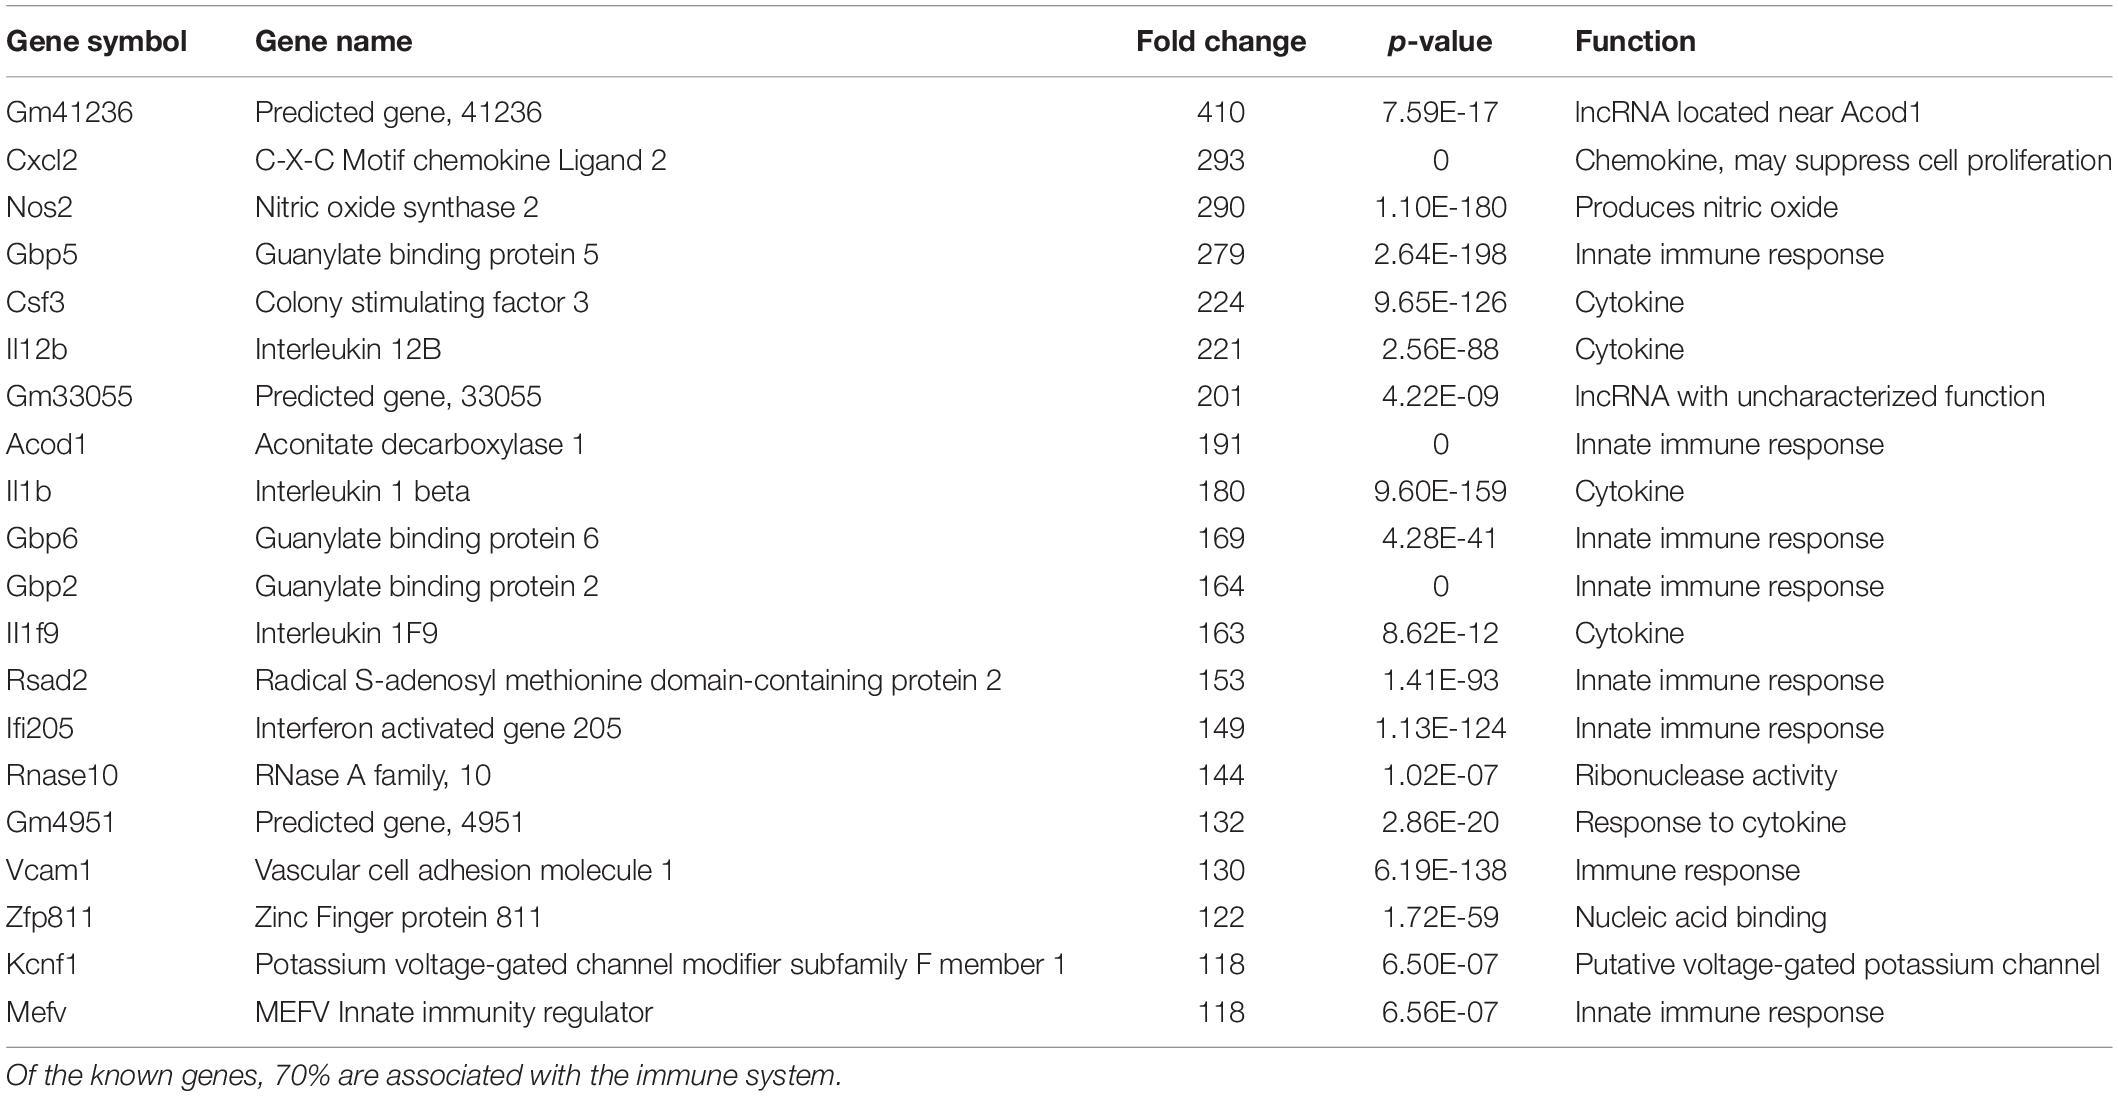
Table 2. The twenty most up-regulated genes and their functions following treatment of BV2 microglia cells with nApoE31–151.
Examining the enriched upregulated pathways, many of those pathways are linked to the immune system, similar to what was found for the nApoE41–151 fragment (Figure 5A). These enriched upregulated pathways included cellular responses to interferon-beta, regulation of viral life cycle, activation of the innate immune response and defense to viruses (Figure 5A). Our previous findings documented the toxicity of the nApoE41–151 fragment, while the nApoE31–151 showed no toxicity under identical treatment conditions. Therefore, like for the nApoE41–151 (Figure 3B), we examined whether any genes related to apoptosis were upregulated. As shown in Figure 5B, there was a mix of anti-apoptotic genes induced (Bcl-2 related), Bax inhibitor-1, and cellular inhibitors of apoptosis of protein 1 and 2 as well as pro-apoptotic genes including TNF related protein, caspases, and cytochrome c (Figure 4B). Comparing the fold enrichment between the two fragments, there was a 3.66-fold increase in apoptosis signaling for nApoE41–151 fragment versus 2.68 for the nApoE31–151 (Table 3). However, these data cannot explain the difference in our previously observed toxicity between the two fragments (Love et al., 2017).
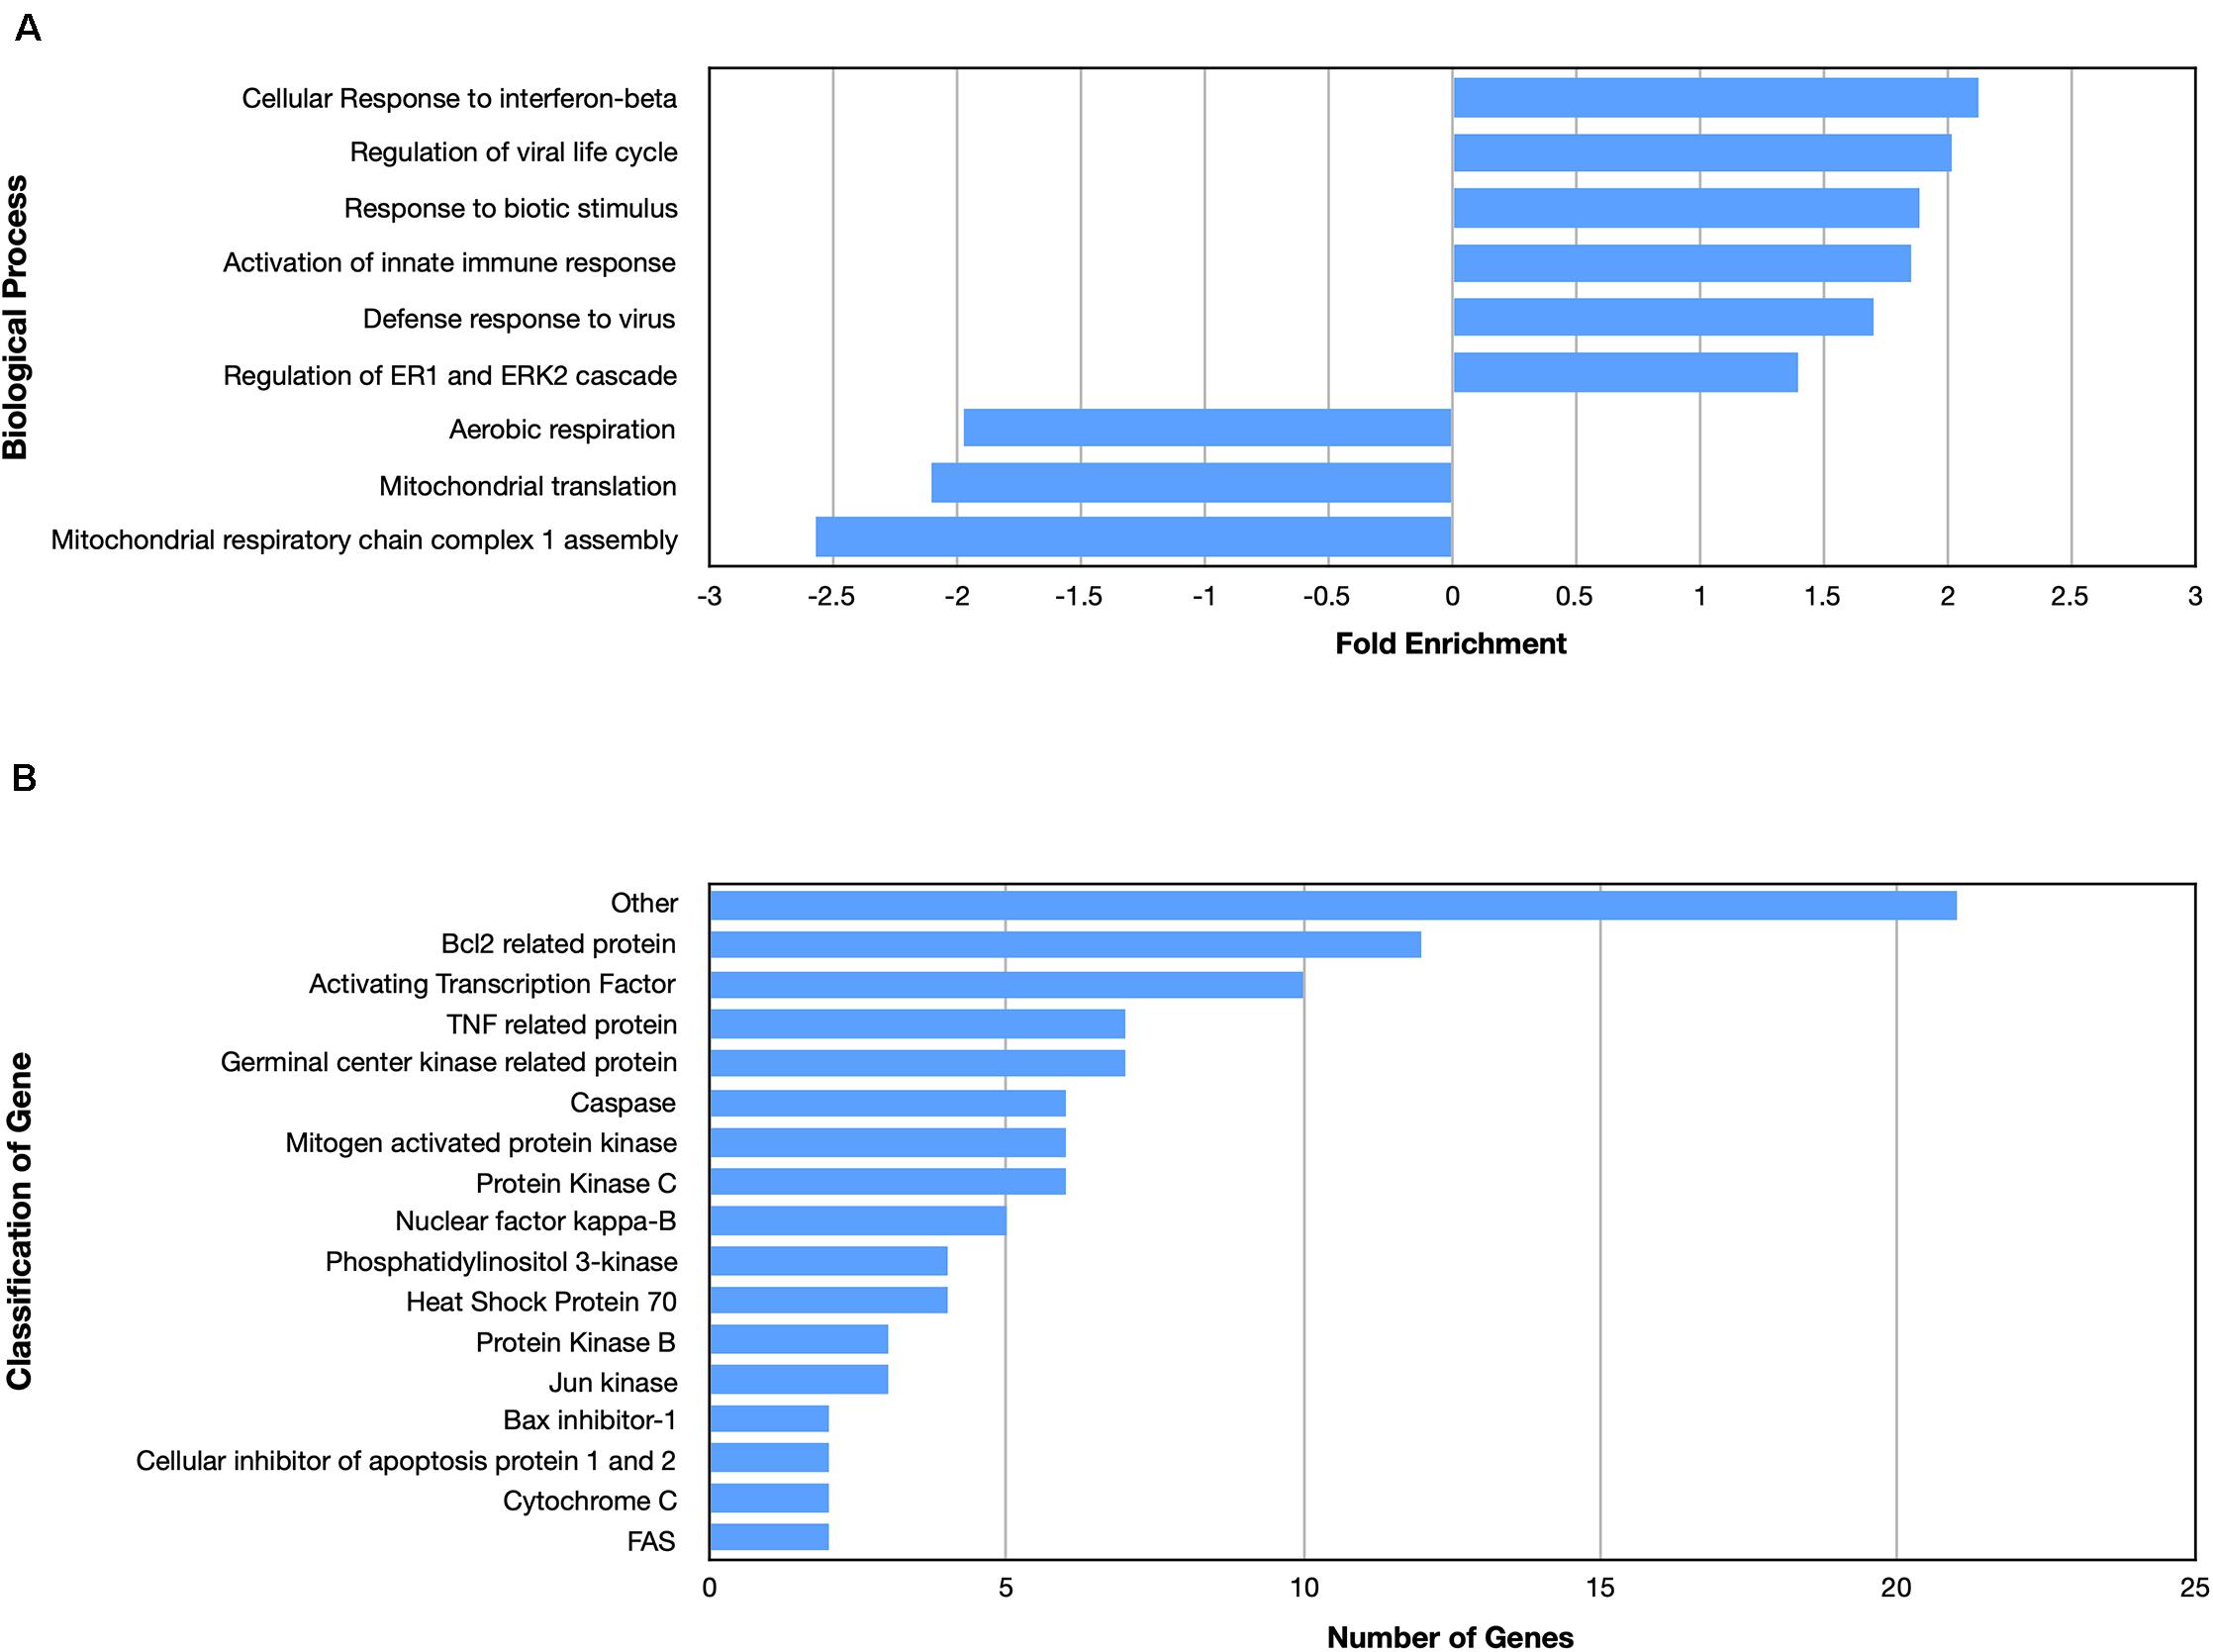
Figure 5. Enriched biological processes and classification of apoptosis related genes regulated by an amino terminal fragment of nApoE3. BV2 cells were plated onto 6-well plates to confluency and treated with or without nApoE31–151 for 5 h. Following treatment, total RNA was extracted and transcriptome analyses was carried out as described in the Materials and Methods. (A) Data are expressed as fold enrichment of biological processes in BV2 microglia cells in the presence of the nApoE31–151. Up-regulated processes are involved in the inflammatory immune response of BV2 microglia, while down-regulated processes are involved in mitochondrial oxidative phosphorylation. (B) Classification of genes in the apoptosis signaling pathway regulated by nApoE31–151. Numerous genes involved in cell signaling pathways were upregulated following treatment with the E3 fragment. Enrichment and classification analyses were conducted using the PANTHER classification system (pantherdb.org).
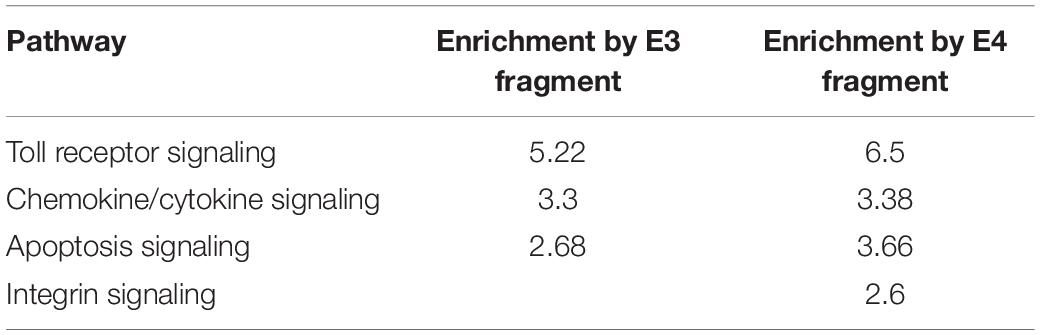
Table 3. Enriched pathways upregulated by nApoE31–151 and nApoE41–151.
We also found similar fold increases in enrichment pathways for both fragments with regards to Toll receptor signaling and inflammation mediated by chemokine and cytokine signaling. The only difference was that for integrin signaling pathways, which was found to be specifically enriched (2.6-fold) for only the nApoE41–151 fragment (Table 3).
Looking at gene pathways downregulated, there was a significant difference found between the two fragments. The nApoE31–151 led to the down regulation of genes related to aerobic respiration, mitochondrial translation, and in mitochondrial respiratory chain complex 1 assembly (Figure 5A). In contrast, many processes involved in cell division were downregulated by the nApoE41–151 fragment (Figure 4A).
There was a significant degree of overlap in the genes differentially expressed by both nApoE fragments. Following a correlation analysis with a pool of the top 500 upregulated nApoE41–151 and nApoE31–151 genes, the trajectories of the fold changes were similar for many of the genes (S = 9651720, ρ = 0.537, p-value < 0.00). These results indicate that while the degree of change may not always align for the two treatment groups, the direction of impact follows a weak positive correlation path (Figure 6). In most cases, even when genes were impacted in a similar fashion, the percent fold change in reference to the control was much higher for the nApoE41–151 fragment than for the nApoE31–151 fragment (Table 4).
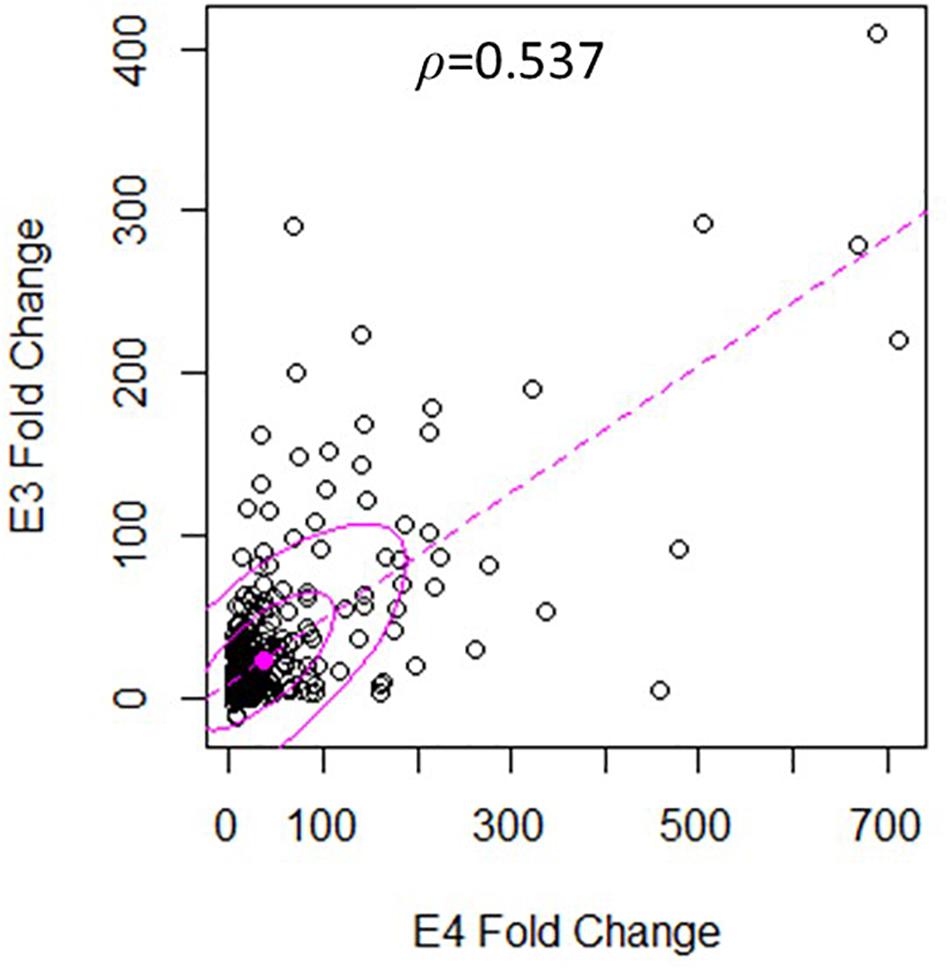
Figure 6. Gene expression following treatment with fragments displays similar patterns of upregulation. The scatterplot analysis displays a moderate positive relationship between the nApoE31–151 and nApoE41–151 treatment groups (S = 9651720, ρ = 0.537, p-value < 0.00). Data is representative of three independent trials that were averaged and expressed as a percentage change in comparison to the control versus each treatment. A Spearman Rank Correlation was utilized to overcome dissonance in normality from extreme data points. Ellipses represent 0.5 and 0.95 confidence intervals and the dotted line is a linear trendline.
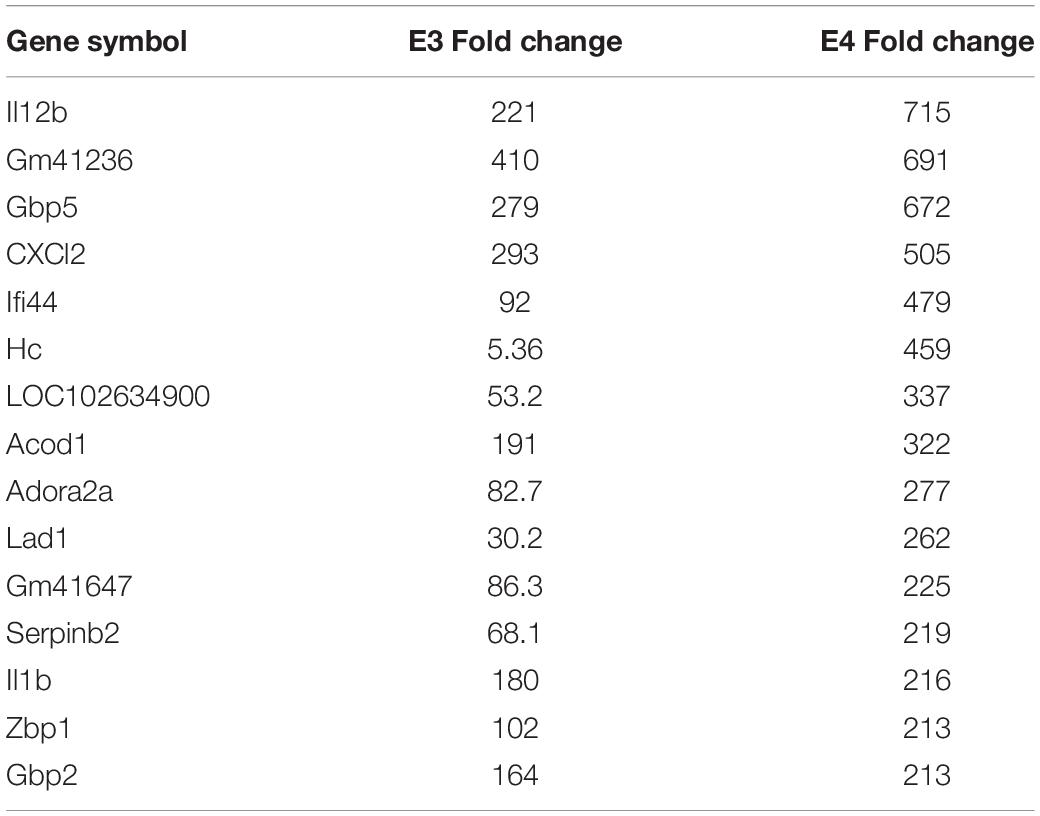
Table 4. The top 15 overlapping genes upregulated by nApoE31–151 and nApoE41–151.
Unique Genes Differentially Regulated Following Treatment of BV2 Microglia Cells With Either nApoE31–151 or nApoE41–151
For the nApoE31–151 fragment, using a minimum of two-fold increase/decrease change as our criteria, a total of 1,010 genes were upregulated by this fragment alone and 644 genes downregulated (Figure 7). Examining the putative functions of the top 10 unique upregulated genes, there was a diverse array of genes involved in cellular processes including, mitosis, regulation of the cytoskeleton, and cell signaling. The specific proteins expressed included those for a dopamine receptor (DRD3 gene), potassium channel (KCNF1 gene), collagen (COL6A1 gene), G-protein signaling (HCAR1 gene), and actin stability (NES and XIRP1 genes).
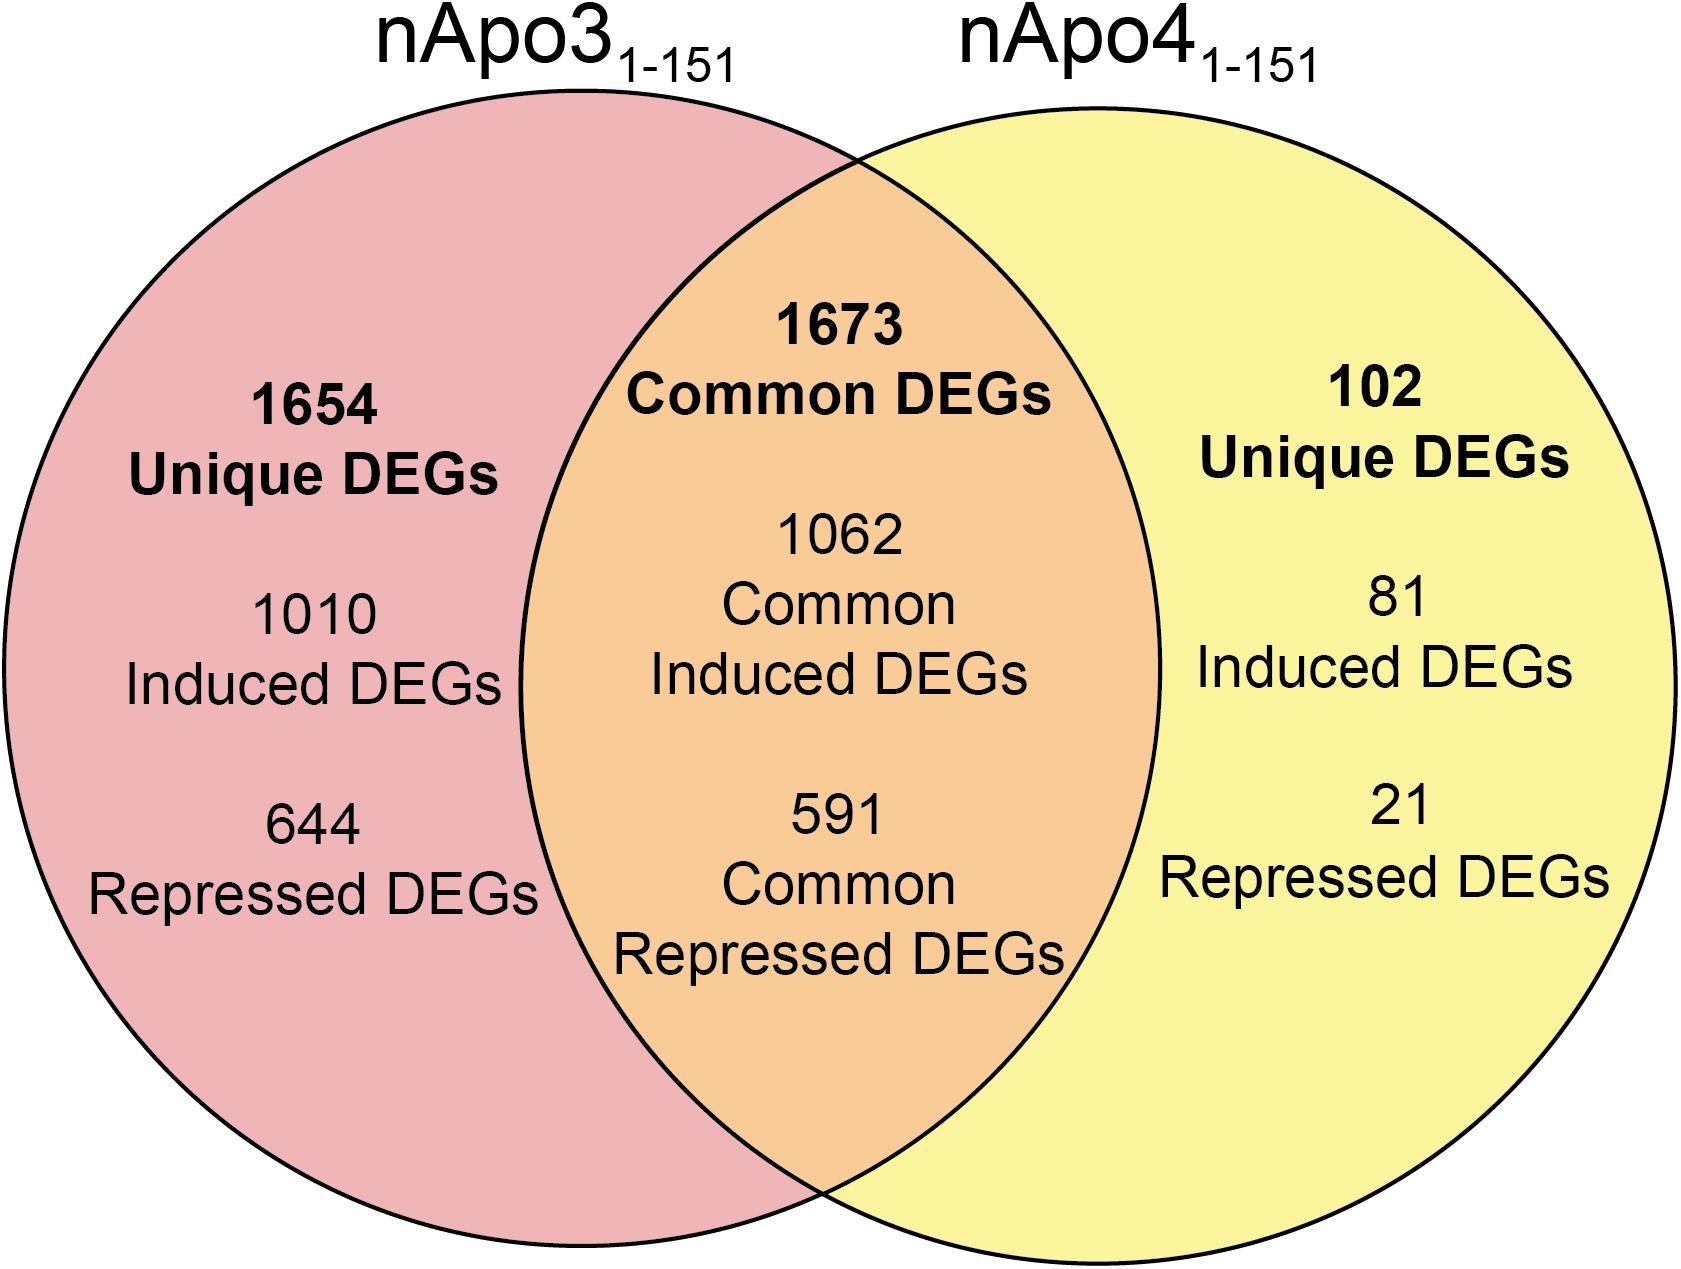
Figure 7. Venn diagram demonstrating common and divergent gene regulation between nApoE31–151 and nApoE41–151 fragments. A comparison of genes regulated more than two-fold by treatment with nApoE31–151 and nApoE41–151. nApoE31–151 regulated the expression of 1654 genes that were not regulated by nApoE41–151. Of these 1654 genes, 1010 were upregulated and 644 were downregulated. Conversely, there were 102 genes uniquely regulated by nApoE41–51. Of these 102 genes, 81 were upregulated, and 21 were downregulated. There were 1673 genes that were regulated by both nApoE41–151 and nApoE31–151. Also included are common differentially expressed genes (DEGs) for both fragments including 1,062 induced DEGs and 591 repressed DEGs (orange intersecting region).
Using the same criteria of at least a two-fold increase/decrease change in gene expression, a total of 81 genes were upregulated by the nApoE41–151 fragment (Figure 7). For those genes downregulated following treatment with nApoE41–151, a total of 21 genes were identified (Figure 7). Table 5 depicts the top 20 genes either upregulated or downregulated following treatment of BV2 microglia cells with the nApoE41–151 fragment. In both cases, these changes represent significantly fewer numbers of genes differentially expressed as compared to nApoE31–151. For the upregulated genes, examining the top twenty genes, only 6 (ETNK2, H2-Q6, EVA1B, NAT8, and KCNQ2) have known functions. The top five genes (1700025C18Rik, 1700003M07Rik, GM32846, GM36778, G930009F23RIK) representing a fold change of 43 to 268-fold), have no known function. Other genes in this top 20 list have been associated with a number of different diseases including cancer (SRMS), epilepsy (KCNQ2), frontotemporal dementia (TMEM252), and amyotrophic lateral sclerosis (TMEM252).
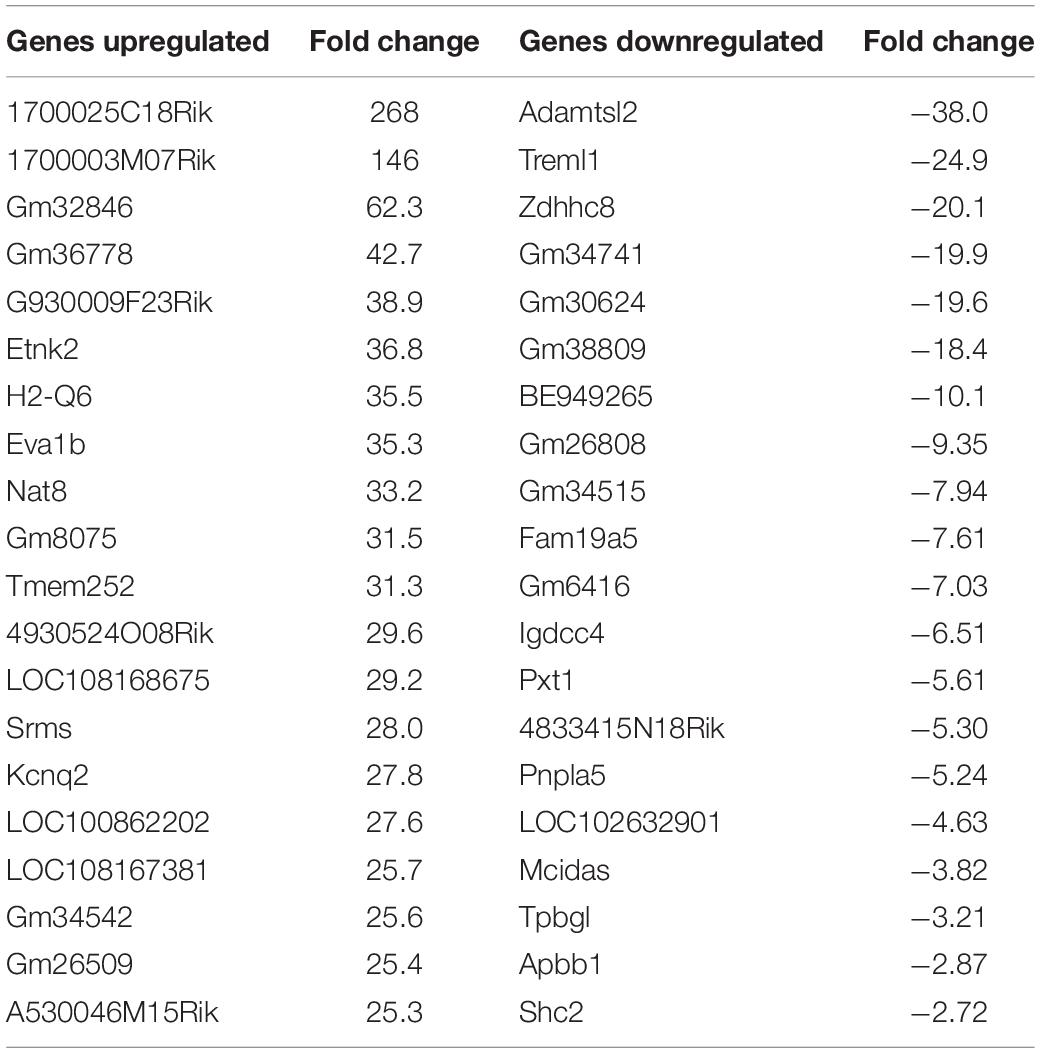
Table 5. Top 20 genes differentially regulated by the nApoE41–151 fragment.
Discussion
ApoE is polymorphic with three major isoforms, ApoE2, ApoE3, and ApoE4, which differ by single amino acid substitutions involving cysteine-arginine replacements at positions 112 and 158 (Weisgraber et al., 1981). Harboring the APOE3 allele is believed to neither increase nor decrease one’s risk of AD, whereas inheritance of the APOE4 allele increases disease risk upward to tenfold (Eisenstein, 2011). It is noteworthy that 65–80% of all AD patients have at least one APOE4 allele (Saunders et al., 1993; Farrer et al., 1997). The classic function of ApoE resides in the CNS, where it is produced by a variety of cells including microglia, and transports cholesterol to neurons via apoE receptors, which are members of the low-density lipoprotein (LDL) receptor family (Pitas et al., 1987; Michikawa et al., 2000). Although ApoE3 and ApoE4 differ by a single amino acid at position 112, none of the known actions of ApoE4 sufficiently explain how harboring this allele enhances AD risk. Recent evidence from our group has suggested that this single amino acid change leads to enhanced proteolysis of the full-length protein in several fragments, including a 151 amino-terminal fragment of ApoE4 (nApoE41–151). We have demonstrated that this fragment is present in the human AD brain where it localizes to nuclei of microglia cells (Love et al., 2017). In addition, nApoE41–151 is toxic in vitro in BV2 microglia cells and may induce toxicity by leading to the expression of inflammatory genes including TNFɑ (Love et al., 2017; Pollock et al., 2019). Moreover, nApoE41–151 binds directly to the promoter region of TNFɑ and can induce expression and release of the TNFɑ following treatment of BV2 microglia cells (Pollock et al., 2019). The purpose of the present study was to determine in greater detail the ability of nApoE41–151 to induce changes in gene expression following treatment of BV2 microglia cells. As a control, we directly compared transcriptome results with an identical nApoE31–151 that differs by a single amino acid at position 112 (C > R). It is noteworthy that we could not test the role of an ApoE2 fragment in terms of changes in gene expression because a 1-151 amino-terminal fragment of ApoE2 would be identical to the nApoE31–151 fragment. Bearing this in mind, it is difficult for us to speculate on what potential structural effects of ApoE2 could potentially modulate gene expression. However, it is possible that amino-terminal ApoE2 fragments may also have an effect on gene expression, but further studies will be necessary to address this issue.
Treatment of BV2 microglia cells with nApoE41–151 led to the differential expression of a vast array of thousands of genes including a 715-fold increase in the expression of IL12B gene as well as a 504-fold increase in the CXCL1 gene, both key mediators of inflammatory immune responses. We independently confirmed the increase in gene expression and protein secretion of IL12b, CxCl1 (Figure 3), and TNFɑ (Pollock et al., 2019) in BV2 cells by RT-PCR and ELISA assays. Overall, many biological processes involved in the inflammatory immune response were enriched by the fragment, while many processes involved in cell division were down regulated. In addition, apoptotic pathways were enriched by the nApoE41–151 fragment providing a possible link to the observed toxicity in vitro (Love et al., 2017).
Examining the top five genes induced by nApoE41–151 and their possible connection to AD, the top gene was IL12B, which increased 715-fold following treatment of BV2 microglia cells with nApoE41–151. This cytokine has been implicated in the AD process. Elevated levels of the p40 subunit of IL-12 have been detected in AD brains (Pitas et al., 1987), and in AD animal models, inhibition of p40 alleviates the cognitive impairments and AD-related pathology (Vom Berg et al., 2012; Tan et al., 2014). Rs568408 and rs3212227 SNPs, which are located in IL-12A and IL-12B, respectively, have recently been reported to influence AD risk in the Han Chinese population (Zhu et al., 2014). The GBP5 gene increased 672-fold following treatment with nApoE41–151 and this gene belongs to the TRAFAC class dynamin-like GTPase superfamily. The encoded protein acts as an activator of NLRP3 inflammasome assembly and has a role in innate immunity and inflammation (Latz et al., 2013). The NLRP3 inflammasome is an important contributor to inflammatory diseases, including AD (Latz et al., 2013; Heneka, 2017; Ising et al., 2019). Finally, the CXCl2 gene expression increased 505-fold following treatment. This gene is part of a chemokine superfamily that encodes secreted proteins involved in immunoregulatory and inflammatory processes. The CXCl2 protein and its receptor has been identified in AD patient brains and may promote Aβ-stimulated microglia activation (Boddeke et al., 1999; Van Coillie et al., 1999; El Khoury et al., 2003).
In summary, exogenous treatment of BV2 microglia cells with nApoE41–151 led to the upregulation of thousands of genes and of the top 20, 80% are associated with microglia activation and inflammation. These data support a possible linkage between harboring the APOE4 allele and inflammation that has long been associated with AD (Streit, 2005; Graeber and Streit, 2010; Heneka et al., 2014; Das and Chinnathambi, 2019).
We compared the transcriptome results of nApoE41–151 with nApoE31–151 which differ by a single amino acid at position 112. It is noteworthy that in a previous study, we identified nApoE31–151 in postmortem human AD sections, although to a lower extent as to nApoE41–151 (Love et al., 2017). In BV2 cells, although nApoE31–151 appears to somewhat traffic to the nucleus, it does not lead to cell toxicity nor does it lead to a change of morphology indicative of activation (Love et al., 2017; Pollock et al., 2019). Therefore, we were somewhat surprised at the number of genes differentially regulated by the nApoE31–151 fragment. Of the top twenty genes induced, 70% are involved in immune function. In addition, six of the top twenty genes upregulated were listed in the top twenty genes induced by the nApoE41–151 fragment (Tables 1, 2). Like nApoE41–151, nApoE31–151 led to a 2.68-fold enrichment in apoptotic pathways, compared to 3.66-fold for nApoE41–151 (Table 3). Therefore, at this time we cannot reconcile the lack of cell death as caused by treatment with nApoE31–151 in BV2 cells (Love et al., 2017) and the upregulation of apoptosis signaling pathways shown in the present study. It is also important to note that our read depth was sufficient so that results are not biased, meaning that the differences in the significant genes that appear in one treatment versus another are not due to a difference in coverage, but that they are actually significant.
A significant difference between the two fragments was that only nApoE41–151 led to enrichment in integrin signaling pathways (2.6-fold). Another interesting difference was the finding that the nApoE31–151 uniquely led to the downregulation of pathways involved in mitochondrial function including aerobic respiration, mitochondrial translation and mitochondrial respiratory chain complex 1 assembly (Figure 5). Multiple lines of evidence suggest that mitochondrial integrity and function, and innate immunity are closely interlinked processes. Mitochondria are intracellular organelles required for numerous cellular functions including energy metabolism, regulation of reactive oxygen species (ROS) signaling, Ca2+ homeostasis, and apoptosis (Culmsee et al., 2018). Therefore, a potential consequence of down regulating genes associated with mitochondrial function may be a dampening of the production of ROS and an overall effect of moving microglia away from activation.
We also examined those genes whose expression changed with the treatment of nApoE31–151 but did not change with the treatment of nApoE41–151 and vice versa. Using a criterion of at least a two-fold change in expression, there were ∼16 times more genes differentially upregulated by nApoE31–151 (1,010 genes) in comparison to nApoE41–151 (81 genes). Many of these nApoE31–151-induced genes appeared to be involved in an array of microglia processes including regulation of the cytoskeleton, cell signaling, and extracellular matrix pathways. In addition, one gene of interest was uniquely downregulated by nApoE31–151 by ∼20-fold. This gene, SLC25A11 encodes for mitochondrial, 2-oxoglutarate/malate carrier (Monne et al., 2013). A recent study demonstrated that this carrier plays a key role in regulation of the NLRP3 inflammasome, a multiprotein complex, which is involved in a pro-inflammatory form of cell death (Shuvarikov et al., 2018). Thus, the downregulation of SLC25A11 protein may prevent activation of this inflammasome and thus limit this form of cell death as well as subsequent inflammation.
In contrast to those genes specifically regulated by nApoE31–151, many of the genes differentially expressed by nApoE41–151 have unknown functions. For example, of the 20 top upregulated genes, only 6 (ETNK2, H2-Q6, EVA1B, NAT8, and KCNQ2) have known functions. The top five genes (1700025C18RIK, 1700003M07Rik, GM32846, GM36778, G930009F23RIK) representing a 43-268-fold change), have no known function. Although no known function has been assigned to any of these top 5 genes, one gene where there is existing evidence is 1700025C18RIK, which increased 146-fold following nApoE41–151 treatment. 1700003M07Rik encodes for AK005651 mRNA and exhibits decreased expression in thymus and spleen in non-obese diabetic mice. A type 1 diabetes susceptibility locus, IDD11, and recombination hotspot were found within this gene. As a result, this gene may play a role in diabetes (Tan et al., 2010; Hamilton-Williams et al., 2013). Limited data is also available on another relatively unknown gene, G930009F23RIK upregulated 39-fold by the nApoE41–151 fragment. G930009F23RIK is transcribed to AK145170 lncRNA. Previous studies have shown AK145170 is upregulated 21-fold following treatment with negative factor (Nef) in mouse astrocytes (Zhou et al., 2018). Nef is a myristoylated, HIV-encoded protein released through exosomes that induces the production of various cytokines and chemokines in astrocytes to promote neuron death (van Marle et al., 2004). The effects of HIV-1 infection, especially through the neurotoxicity of Nef, may contribute to HIV-associated neurocognitive disorders (HAND) pathogenesis (Torres-Munoz et al., 2001). Thus, G930009F23RIK expression may play a role in the pathogenesis of HAND.
It is interesting to speculate on what role these top five genes may have and if they contribute somehow to the toxicity produced by nApoE41–151, which was not observed with nApoE31–151 (Love et al., 2017). Due to the paucity of unique genes induced by nApoE41–151, we were unable to analyze any enriched pathways, however, the data did reveal two genes involved in the AD-presenilin pathway and one gene involved in the AD-Aβ secretase pathway. On the other hand, enriched pathways for nApoE31–151, were easily calculated given the large number of genes upregulated and included collagen biosynthesis and modifying enzymes (5.17-fold enrichment), collagen formation (4.34-fold enrichment), class A/1 Rhodopsin-like receptors (2.54-fold enrichment), and GPCR ligand binding (2.23-fold enrichment). Taken together, these results can be interpreted to suggest that nApoE31–151 may play a more physiological role in microglia cells as compared to nApoE41–151, which may lead to activation, inflammation, and activation of AD pathways.
Conclusion
Herein, we provide transcriptome data supporting a new role for ApoE3 and E4 as regulators of gene expression. Traditionally, ApoE has an important role in regulating the metabolism of lipids by directing their transport, delivery, and distribution from one cell type to another through ApoE receptors within the CNS (Verghese et al., 2011). Our previous findings supported a role for amino-terminal fragments of ApoE4 consisting of 1–151 amino acids (nApoE41–151) that can traffic to the nucleus and bind to enhancer elements such as for TNFα, leading to expression, activation and cytotoxicity of BV2 microglia cells (Love et al., 2017). Full-length ApoE4 was without effect in this respect, and treatment of nApoE31–151 did not lead to cellular toxicity. In the current study, we now extend these findings and demonstrate nApoE41–151 and nApoE31–151 can lead to large changes in gene expression following exogenous treatment of BV2 microglial cells. Our results suggest that while nApoE31–151 may serve a more physiological role in this manner, nApoE41–151 may activate genes with a more pathological purpose. These data support the hypothesis that the link between harboring the APOE4 allele and dementia risk could be enhanced inflammation through activation of microglia to the inflammatory M1 phenotype (see below). Future studies are warranted to understand the set of genes uniquely upregulated by the nApoE1–151 fragment, many of which have an unknown function at this time. BV2 cells are a well-characterized, extensively employed model system for microglia. Studies have demonstrated that BV2 cells are a valid substitute for primary microglia in many experimental settings, including complex cell-cell interaction studies (Henn et al., 2009). However, there are clear limitations using these cells including that they are murine in origin and represent transformed cells, which could change their phenotype (Timmerman et al., 2018). Therefore, further studies will be needed in human iPSC-induced microglia cells or other primary cultures of microglia to confirm that similar sets of genes are expressed in human microglia cells following treatment with E3 or E4 fragments.
RNA transcriptome analyses in BV2 microglia cells following sublethal treatment with nApoE41–151 indicated an upregulation of almost 4,000 genes with 20 of these genes upregulated 182-715-fold as compared to untreated control cells. The majority of these 20 genes play a role in the immune response and polarization toward the microglial M1 activation phenotype. For example several studies have supported that a M1 phenotype is characterized by the upregulation of proinflammatory pathways including TNFα, IL-12, IL-1B, CCl2, whereas a shift to the M2 antinflammatory phenotype leads to the downregulation of genes such as CD86 and CD163 (Shin et al., 2014; Gensel and Zhang, 2015; Yang et al., 2016; Li et al., 2019). Treatment of BV2 cells with nApoE41–151 led to a similar pattern of gene regulation supporting the conclusion of a conversion to a M1 phenotype. Recently, a strong case has been made for ApoE as a pivotal regulator for microglia phenotypes (Krasemann et al., 2017). In this regard, the authors identify a subset termed microglia neurodegenerative phenotype (MGnD) that is characterized by suppressed microglial homeostatic genes such as P2ry12, Tmem119, Olfml3, Csf1r, Rhob, Cx3cr1, Tgfb1, Mef2a, Mafb, Sall1 and upregulated inflammatory molecules included Spp1, Itgax, Axl, Lilrb4, Clec7a, Csf1, and Apoe, The authors concluded that as disease progresses, the gene expression profile of microglia switches to MGnD type. We examined the differential gene expression following treatment of BV2 cells with the nApoE41–151 fragment in the context of this study and found a similar increase in Axl (eight-fold), CCl2 (5.6-fold), Lilrb4 (4.43-fold), and Spp1 (two-fold). On the other hand, we found a similar decrease in Tmem119 (−2-fold), CSF1r (−1.11-fold), Rhob (−1.8-fold), and Mafb (−8.22-fold). Therefore, we believe our data support a similar phenotypic change to MGnD in our model system suggesting that nApoE41–151 may lead to a similar conversion of microglia in the AD brain. In a separate study, a novel type of disease-associated microglia (DAM) was characterized and was associated with beta-amyloid plaques in AD, and is also present in ALS (Keren-Shaul et al., 2017). Their analysis indicated that all of the microglia with a DAM signature expressed CD11c and showed an upregulation of other genes including CD9, Clec7a, and CD63 (Keren-Shaul et al., 2017). In the present study, we did not find a similar gene expression profile or other DAM-type changes in BV2 cells treated with nApoE fragments, and therefore, we do not believe nApoE41–151 switches microglia to this phenotype in the AD brain.
In conclusion, the nApoE41–151 fragment is a powerful regulator of gene expression, leading to the upregulation of numerous genes linked to inflammation associated with AD. Therefore, preventing the nuclear localization of nApoE41–151, perhaps through the use of structure-corrector molecules (Chen et al., 2012; Mahley and Huang, 2012) may prevent nuclear localization, blocking transcriptional effects and thus, preventing the subsequent inflammation accorded by microglia in AD (Webers et al., 2020).
Data Availability Statement
The data discussed in this publication have been deposited in NCBI’s Gene Expression Omnibus and are accessible through GEO Series accession number GSE153454: https://www.ncbi.nlm.nih.gov/geo/query/acc.cgi?acc=GSE153454.
Author Contributions
TR and TP designed experiments, analyzed the data, helped construct tables and figures, and contributed to writing of the manuscript. MM analyzed the data, constructed figures, and contributed to writing of the manuscript. NI, RD, and ES helped carry out experiments. TS and GC helped analyze the data. All authors contributed to the article and approved the submitted version.
Funding
This work was funded by the National Institutes of Health Grant 2R15AG042781-02A1. The project described was also supported by Institutional Development Award (IDeA) from the National Institute of General Medical Sciences of the National Institutes of Health under Grants #P20GM103408 and P20GM109095. The content is solely the responsibility of the authors and does not necessarily represent the official views of the National Institutes of Health. We also acknowledge support from the Biomolecular Research Center at Boise State with funding from the National Science Foundation, Grants #0619793 and #0923535; the M. J. Murdock Charitable Trust; and the Idaho State Board of Education.
Conflict of Interest
The authors declare that the research was conducted in the absence of any commercial or financial relationships that could be construed as a potential conflict of interest.
Supplementary Material
The Supplementary Material for this article can be found online at: https://www.frontiersin.org/articles/10.3389/fnagi.2020.00256/full#supplementary-material
Footnotes
- ^ https://www.bioinformatics.babraham.ac.uk/projects/trim_galore/
- ^ www.bioinformatics.babraham.ac.uk/projects/fastqc/
- ^ pantherdb.org
- ^ https://www.ncbi.nlm.nih.gov/geo/query/acc.cgi?acc=GSE153454
References
Anders, S., Pyl, P. T., and Huber, W. (2015). HTSeq–a Python framework to work with high-throughput sequencing data. Bioinformatics 31, 166–169. doi: 10.1093/bioinformatics/btu638
Bindea, G., Mlecnik, B., Hackl, H., Charoentong, P., Tosolini, M., Kirilovsky, A., et al. (2009). ClueGO: a cytoscape plug-in to decipher functionally grouped gene ontology and pathway annotation networks. Bioinformatics 25, 1091–1093. doi: 10.1093/bioinformatics/btp101
Boddeke, E. W., Meigel, I., Frentzel, S., Gourmala, N. G., Harrison, J. K., Buttini, M., et al. (1999). Cultured rat microglia express functional beta-chemokine receptors. J. Neuroimmunol. 98, 176–184. doi: 10.1016/s0165-5728(99)00096-x
Chen, H. K., Liu, Z., Meyer-Franke, A., Brodbeck, J., Miranda, R. D., McGuire, J. G., et al. (2012). Small molecule structure correctors abolish detrimental effects of apolipoprotein E4 in cultured neurons. J. Biol. Chem. 287, 5253–5266. doi: 10.1074/jbc.m111.276162
Culmsee, C., Michels, S., Scheu, S., Arolt, V., Dannlowski, U., and Alferink, J. (2018). Mitochondria, microglia, and the immune system-how are they linked in affective disorders? Front. Psychiatry 9:739. doi: 10.3389/fpsyt.2018.00739
Das, R., and Chinnathambi, S. (2019). Microglial priming of antigen presentation and adaptive stimulation in Alzheimer’s disease. Cell Mol. Life. Sci. 76, 3681–3694. doi: 10.1007/s00018-019-03132-2
DeTure, M. A., and Dickson, D. W. (2019). The neuropathological diagnosis of Alzheimer’s disease. Mol. Neurodegener. 14:32.
El Khoury, J. B., Moore, K. J., Means, T. K., Leung, J., Terada, K., Toft, M., et al. (2003). CD36 mediates the innate host response to beta-amyloid. J. Exp. Med. 197, 1657–1666. doi: 10.1084/jem.20021546
Farrer, L. A., Cupples, L. A., Haines, J. L., Hyman, B., Kukull, W. A., Mayeux, R., et al. (1997). Effects of age, sex, and ethnicity on the association between apolipoprotein E genotype and Alzheimer disease. a meta-analysis. APOE and Alzheimer disease meta analysis consortium. JAMA 278, 1349–1356. doi: 10.1001/jama.278.16.1349
Gensel, J. C., and Zhang, B. (2015). Macrophage activation and its role in repair and pathology after spinal cord injury. Brain Res. 1619, 1–11. doi: 10.1016/j.brainres.2014.12.045
Graeber, M. B., and Streit, W. J. (2010). Microglia: biology and pathology. Acta Neuropathol. 119, 89–105. doi: 10.1007/s00401-009-0622-0
Hamilton-Williams, E. E., Rainbow, D. B., Cheung, J., Christensen, M., Lyons, P. A., Peterson, L. B., et al. (2013). Fine mapping of type 1 diabetes regions Idd9.1 and Idd9.2 reveals genetic complexity. Mamm. Genome 24, 358–375. doi: 10.1007/s00335-013-9466-y
Heneka, M. T. (2017). Inflammasome activation and innate immunity in Alzheimer’s disease. Brain Pathol. 27, 220–222. doi: 10.1111/bpa.12483
Heneka, M. T., Kummer, M. P., and Latz, E. (2014). Innate immune activation in neurodegenerative disease. Nat. Rev. Immunol. 14, 463–477. doi: 10.1038/nri3705
Henn, A., Lund, S., Hedtjarn, M., Schrattenholz, A., Porzgen, P., and Leist, M. (2009). The suitability of BV2 cells as alternative model system for primary microglia cultures or for animal experiments examining brain inflammation. ALTEX 26, 83–94. doi: 10.14573/altex.2009.2.83
Huang, Y., Liu, X. Q., Wyss-Coray, T., Brecht, W. J., Sanan, D. A., and Mahley, R. W. (2001). Apolipoprotein E fragments present in Alzheimer’s disease brains induce neurofibrillary tangle-like intracellular inclusions in neurons. Proc. Natl. Acad. Sci. U S A. 98, 8838–8843. doi: 10.1073/pnas.151254698
Ising, C., Venegas, C., Zhang, S., Scheiblich, H., Schmidt, S. V., Vieira-Saecker, A., et al. (2019). NLRP3 inflammasome activation drives tau pathology. Nature 575, 669–673.
Kim, D., Langmead, B., and Salzberg, S. L. (2015). HISAT: a fast spliced aligner with low memory requirements. Nat. Methods 12, 357–360. doi: 10.1038/nmeth.3317
Krasemann, S., Madore, C., Cialic, R., Baufeld, C., Calcagno, N., El Fatimy, R., et al. (2017). The TREM2-APOE pathway drives the transcriptional phenotype of dysfunctional microglia in neurodegenerative diseases. Immunity 47, 566–581.e9. doi: 10.1016/j.immuni.2017.08.008
Latz, E., Xiao, T. S., and Stutz, A. (2013). Activation and regulation of the inflammasomes. Nat. Rev. Immunol. 13, 397–411. doi: 10.1038/nri3452
Li, Z., Liu, F., He, X., Yang, X., Shan, F., and Feng, J. (2019). Exosomes derived from mesenchymal stem cells attenuate inflammation and demyelination of the central nervous system in EAE rats by regulating the polarization of microglia. Int. Immunopharmacol. 67, 268–280. doi: 10.1016/j.intimp.2018.12.001
Love, J. E., Day, R. J., Gause, J. W., Brown, R. J., Pu, X., Theis, D. I, et al. (2017). Nuclear uptake of an amino-terminal fragment of apolipoprotein E4 promotes cell death and localizes within microglia of the Alzheimer’s disease brain. Int. J. Physiol. Pathophysiol. Pharmacol. 9, 40–57.
Love, M. I., Huber, W., and Anders, S. (2014). Moderated estimation of fold change and dispersion for RNA-seq data with DESeq2. Genome Biol. 15:550.
Mahley, R. W., and Huang, Y. (2012). Small-molecule structure correctors target abnormal protein structure and function: structure corrector rescue of apolipoprotein E4-associated neuropathology. J. Med. Chem. 55, 8997–9008. doi: 10.1021/jm3008618
Keren-Shaul, H., Spinrad, A., Weiner, A., Matcovitch-Natan, O., Dvir-Szternfeld, R., Ulland, T. K., et al. (2017). A unique microglia type associated with restricting development of Alzheimer’s disease. Cell 169, 1276–1290.e17. doi: 10.1016/j.cell.2017.05.018
Mi, H., Muruganujan, A., Ebert, D., Huang, X., and Thomas, P. D. (2019a). PANTHER version 14: more genomes, a new PANTHER GO-slim and improvements in enrichment analysis tools. Nucleic Acids Res. 47, D419–D426.
Mi, H., Muruganujan, A., Huang, X., Ebert, D., Mills, C., Guo, X., et al. (2019b). Protocol Update for large-scale genome and gene function analysis with the PANTHER classification system (v.14.0). Nat. Protoc. 14, 703–721. doi: 10.1038/s41596-019-0128-8
Mi, H., and Thomas, P. (2009). PANTHER pathway: an ontology-based pathway database coupled with data analysis tools. Methods Mol. Biol. 563, 123–140. doi: 10.1007/978-1-60761-175-2_7
Michikawa, M., Fan, Q. W., Isobe, I., and Yanagisawa, K. (2000). Apolipoprotein E exhibits isoform-specific promotion of lipid efflux from astrocytes and neurons in culture. J. Neurochem. 74, 1008–1016. doi: 10.1046/j.1471-4159.2000.0741008.x
Monne, M., Miniero, D. V., Iacobazzi, V., Bisaccia, F., and Fiermonte, G. (2013). The mitochondrial oxoglutarate carrier: from identification to mechanism. J. Bioenerg. Biomembr. 45, 1–13. doi: 10.1007/s10863-012-9475-7
Pitas, R. E., Boyles, J. K., Lee, S. H., Hui, D., and Weisgraber, K. H. (1987). Lipoproteins and their receptors in the central nervous system. characterization of the lipoproteins in cerebrospinal fluid and identification of apolipoprotein B,E(LDL) receptors in the brain. J. Biol. Chem. 262, 14352–14360.
Pollock, T. B., Mack, J. M., Day, R. J., Isho, N. F., Brown, R. J., Oxford, A. E., et al. (2019). A fragment of apolipoprotein E4 leads to the downregulation of a CXorf56 homologue, a novel ER-associated protein, and activation of BV2 microglial cells. Oxid. Med. Cell Longev. 2019:5123565.
Raber, J., Huang, Y., and Ashford, J. W. (2004). ApoE genotype accounts for the vast majority of AD risk and AD pathology. Neurobiol. Aging 25, 641–650. doi: 10.1016/j.neurobiolaging.2003.12.023
Rohn, T. T. (2013). Proteolytic cleavage of apolipoprotein e4 as the keystone for the heightened risk associated with Alzheimer’s disease. Int. J. Mol. Sci. 14, 14908–14922. doi: 10.3390/ijms140714908
Rohn, T. T., Catlin, L. W., Coonse, K. G., and Habig, J. W. (2012). Identification of an amino-terminal fragment of apolipoprotein E4 that localizes to neurofibrillary tangles of the Alzheimer’s disease brain. Brain Res. 1475, 106–115. doi: 10.1016/j.brainres.2012.08.003
Saunders, A. M., Strittmatter, W. J., Schmechel, D., George-Hyslop, P. H., Pericak-Vance, M. A., Joo, S. H., et al. (1993). Association of apolipoprotein E allele epsilon 4 with late-onset familial and sporadic Alzheimer’s disease. Neurology 43, 1467–1472.
Shannon, P., Markiel, A., Ozier, O., Baliga, N. S., Wang, J. T., Ramage, D., et al. (2003). Cytoscape: a software environment for integrated models of biomolecular interaction networks. Genome Res. 13, 2498–2504. doi: 10.1101/gr.1239303
Shin, J. A., Lim, S. M., Jeong, S. I., Kang, J. L., and Park, E. M. (2014). Noggin improves ischemic brain tissue repair and promotes alternative activation of microglia in mice. Brain Behav. Immun. 40, 143–154. doi: 10.1016/j.bbi.2014.03.013
Shuvarikov, A. A., Davis, M. A., Esser-Nobis, K., and Gate, M. J. (2018). Mitochondrial SLC25 proteins interact with NLRP3 to regulate inflammasome function. J. Immunol. 200(1 Suppl.). 115.8.
Streit, W. J. (2005). Microglia and neuroprotection: implications for Alzheimer’s disease. Brain Res. Brain Res. Rev. 48, 234–239. doi: 10.1016/j.brainresrev.2004.12.013
Tan, I. K., Mackin, L., Wang, N., Papenfuss, A. T., Elso, C. M., Ashton, M. P., et al. (2010). A recombination hotspot leads to sequence variability within a novel gene (AK005651) and contributes to type 1 diabetes susceptibility. Genome Res. 20, 1629–1638. doi: 10.1101/gr.101881.109
Tan, M. S., Yu, J. T., Jiang, T., Zhu, X. C., Guan, H. S., and Tan, L. (2014). IL12/23 p40 inhibition ameliorates Alzheimer’s disease-associated neuropathology and spatial memory in SAMP8 mice. J. Alzheimers. Dis. 38, 633–646. doi: 10.3233/jad-131148
Timmerman, R., Burm, S. M., and Bajramovic, J. J. (2018). An overview of in vitro methods to study microglia. Front. Cell. Neurosci. 12:242. doi: 10.3389/fncel.2018.00242
Torres-Munoz, J., Stockton, P., Tacoronte, N., Roberts, B., Maronpot, R. R., and Petito, C. K. (2001). Detection of HIV-1 gene sequences in hippocampal neurons isolated from postmortem AIDS brains by laser capture microdissection. J. Neuropathol. Exp. Neurol. 60, 885–892. doi: 10.1093/jnen/60.9.885
Van Coillie, E., Van Damme, J., and Opdenakker, G. (1999). The MCP/eotaxin subfamily of CC chemokines. Cytokine Growth. Factor. Rev. 10, 61–86. doi: 10.1016/s1359-6101(99)00005-2
van Marle, G., Henry, S., Todoruk, T., Sullivan, A., Silva, C., Rourke, S. B., et al. (2004). Human immunodeficiency virus type 1 Nef protein mediates neural cell death: a neurotoxic role for IP-10. Virology 329, 302–318. doi: 10.1016/j.virol.2004.08.024
Verghese, P. B., Castellano, J. M., and Holtzman, D. M. (2011). Apolipoprotein E in Alzheimer’s disease and other neurological disorders. Lancet Neurol. 10, 241–252.
Vom Berg, J., Prokop, S., Miller, K. R., Obst, J., Kalin, R. E., Lopategui-Cabezas, A. I, et al. (2012). Inhibition of IL-12/IL-23 signaling reduces Alzheimer’s disease-like pathology and cognitive decline. Nat. Med. 18, 1812–1819. doi: 10.1038/nm.2965
Webers, A., Heneka, M. T., and Gleeson, P. A. (2020). The role of innate immune responses and neuroinflammation in amyloid accumulation and progression of Alzheimer’s disease. Immunol. Cell Biol. 98, 28–41. doi: 10.1111/imcb.12301
Weisgraber, K. H., Rall, S. C. Jr., and Mahley, R. W. (1981). Human E apoprotein heterogeneity. Cysteine-arginine interchanges in the amino acid sequence of the apo-E isoforms. J. Biol. Chem. 256, 9077–9083.
Yang, X. W., Li, Y. H., Zhang, H., Zhao, Y. F., Ding, Z. B., Yu, J. Z., et al. (2016). Safflower Yellow regulates microglial polarization and inhibits inflammatory response in LPS-stimulated Bv2 cells. Int. J. Immunopathol. Pharmacol. 29, 54–64. doi: 10.1177/0394632015617065
Zhou, F., Liu, X., Zuo, D., Xue, M., Gao, L., Yang, Y., et al. (2018). HIV-1 Nef-induced lncRNA AK006025 regulates CXCL9/10/11 cluster gene expression in astrocytes through interaction with CBP/P300. J. Neuroinflamm. 15:303.
Keywords: apolipoprotein E4, microglia cells, BV2 cells, Alzheimer’s disease, inflammation, toxicity, RNA-seq, M1 phenotype
Citation: Pollock TB, Cholico GN, Isho NF, Day RJ, Suresh T, Stewart ES, McCarthy MM and Rohn TT (2020) Transcriptome Analyses in BV2 Microglial Cells Following Treatment With Amino-Terminal Fragments of Apolipoprotein E. Front. Aging Neurosci. 12:256. doi: 10.3389/fnagi.2020.00256
Received: 27 May 2020; Accepted: 24 July 2020;
Published: 13 August 2020.
Edited by:
Khalil Sherali Rawji, University of Cambridge, United KingdomReviewed by:
Diego Sepulveda-Falla, University Medical Center Hamburg-Eppendorf, GermanyAnnakaisa Haapasalo, University of Eastern Finland, Finland
Copyright © 2020 Pollock, Cholico, Isho, Day, Suresh, Stewart, McCarthy and Rohn. This is an open-access article distributed under the terms of the Creative Commons Attribution License (CC BY). The use, distribution or reproduction in other forums is permitted, provided the original author(s) and the copyright owner(s) are credited and that the original publication in this journal is cited, in accordance with accepted academic practice. No use, distribution or reproduction is permitted which does not comply with these terms.
*Correspondence: Troy T. Rohn, trohn@boisestate.edu