Links Between Metabolic and Structural Changes in the Brain of Cognitively Normal Older Adults: A 4-Year Longitudinal Follow-Up
 Christian-Alexandre Castellano1*
  Carol Hudon2,3
  Etienne Croteau1,4
  Mélanie Fortier1
  Valérie St-Pierre1
  Camille Vandenberghe1 Scott Nugent2 Sébastien Tremblay5 Nancy Paquet6 Martin Lepage5,6,7
  Tamàs Fülöp1,8
  Éric E. Turcotte5,6,7 Isabelle J. Dionne1,9
  Olivier Potvin2
  Simon Duchesne2,10
  Stephen C. Cunnane1,4,8
- 1Research Center on Aging, Centre Intégré Universitaire de Santé et de Services Sociaux de l’Estrie (CIUSSS) de L’Estrie—Centre hospitalier Universitaire de Sherbrooke (CHUS), Sherbrooke, QC, Canada
- 2Centre de Recherche sur le Vieillissement (CERVO) Brain Research Centre, Centre Intégré Universitaire de Santé et de Services Sociaux (CIUSSS) de la Capitale-Nationale, Québec, QC, Canada
- 3School of Psychology, Université Laval, Québec, QC, Canada
- 4Department of Pharmacology and Physiology, Université de Sherbrooke, Sherbrooke, QC, Canada
- 5Sherbrooke Molecular Imaging Center, Université de Sherbrooke, Sherbrooke, QC, Canada
- 6Department of Nuclear Medicine and Radiobiology, Université de Sherbrooke, Sherbrooke, QC, Canada
- 7CR-Centre hospitalier Universitaire de Sherbrooke (CHUS), Centre Intégré Universitaire de Santé et de Services Sociaux de l’Estrie (CIUSSS) de l’Estrie—Centre hospitalier Universitaire de Sherbrooke (CHUS), Sherbrooke, QC, Canada
- 8Department of Medicine, Université de Sherbrooke, Sherbrooke, QC, Canada
- 9Faculty of Physical Activity Sciences, Université de Sherbrooke, Sherbrooke, QC, Canada
- 10Department of Radiology, Université Laval, Québec, QC, Canada
We aimed to longitudinally assess the relationship between changing brain energy metabolism (glucose and acetoacetate) and cognition during healthy aging. Participants aged 71 ± 5 year underwent cognitive evaluation and quantitative positron emission tomography (PET) and magnetic resonance imaging (MRI) scans at baseline (N = 25) and two (N = 25) and four (N = 16) years later. During the follow-up, the rate constant for brain extraction of glucose (Kglc) declined by 6%–12% mainly in the temporo-parietal lobes and cingulate gyri (p ≤ 0.05), whereas brain acetoacetate extraction (Kacac) and utilization remained unchanged in all brain regions (p ≥ 0.06). Over the 4 years, cognitive results remained within the normal age range but an age-related decline was observed in processing speed. Kglc in the caudate was directly related to performance on several cognitive tests (r = +0.41 to +0.43, all p ≤ 0.04). Peripheral insulin resistance assessed by the homeostasis model assessment of insulin resistance (HOMA-IR) was significantly inversely related to Kglc in the thalamus (r = −0.44, p = 0.04) and in the caudate (r = −0.43, p = 0.05), and also inversely related to executive function, attention and processing speed (r = −0.45 to −0.53, all p ≤ 0.03). We confirm in a longitudinal setting that the age-related decline in Kglc is directly associated with declining performance on some tests of cognition but does not significantly affect Kacac.
Introduction
The cerebral metabolic rate of glucose (CMRglc), measured using positron emission tomography (PET) with [18F]-fluoro-2-deoxyglucose (18F-FDG), is lower in cognitively normal older adults (Petit-Taboué et al., 1998; Kalpouzos et al., 2009; Nugent et al., 2014b). Quantifying the metabolic decline of the brain as it ages is important in order to better understand not only the relationship between aging-related cognitive and metabolic changes in the brain but also the difference between normal and pathological brain aging (Cunnane et al., 2016c). Indeed, brain glucose hypometabolism is well-known to be present in Alzheimer’s disease (AD) itself (Herholz, 1995, 2014) and in conditions associated with increased risk of AD including mild cognitive impairment (MCI; Albin et al., 2010; Pagani et al., 2015), carriers of the apolipoprotein E4 (APOE4) allele (Mosconi et al., 2008a), a family history of AD (Reiman et al., 2004; Mosconi et al., 2007a), and type 2 diabetes (Baker et al., 2011).
Brain glucose hypometabolism appears to increase the risk of AD (Cunnane et al., 2011; Mosconi, 2013), but few longitudinal follow-up studies on brain energy metabolism during cognitively normal aging have been reported. Of those few reports (Mosconi et al., 2008b; Shokouhi et al., 2013), none have quantitatively evaluated metabolism of both glucose and ketones, the fat-derived alternative fuel for the brain when glucose is limiting. Ketone metabolism can be assessed by PET with the tracer—[11C]-acetoacetate (11C-AcAc). The assessment of both the brain’s main fuels is particularly informative given that brain ketone uptake remains normal whereas brain glucose hypometabolism is observed in MCI and early AD (Cunnane et al., 2016b; Croteau et al., 2018).
Our overall aim here was to conduct a longitudinal study in a group of cognitively normal older adults, focussing particularly on brain metabolism of both glucose and ketone in relation to cognitive function. Our primary objective was to quantify brain energy metabolism at 2-year intervals over 4 years, with a focus on the brain’s capacity to extract these fuels from the blood, defined as the rate constant for glucose (Kglc; min−1) or acetoacetate (Kacac; min−1). Our secondary aims were to assess brain structural changes and the relation between change in cognitive performance and changes in brain energy metabolism, brain structure, peripheral energy metabolism and body composition over the same 4-year period.
Materials and Methods
Participants
This study was approved by the ethic committee of the Research Center on Aging—CIUSSS de l’Estrie—CHUS, and was conducted with the informed written consent of all the participants. Of 41 participants in a previous cross-sectional study (Nugent et al., 2014b, 2016), 25 agreed to be followed-up. Exclusion criteria at the entry of the study included a Mini-Mental State Examination (MMSE) score <26/30, prescription drug addiction, alcohol abuse, depression, smoking, diabetes, overt evidence of heart, liver or renal disease, uncontrolled hypertension, dyslipidemia, or thyroid disease. Twelve of the 25 older adult participants were unmedicated; thirteen were taking prescription medication for hypertension (N = 8), elevated cholesterol (N = 4), or hypothyroidism (N = 4). At baseline (N = 25), and at the 2-year (N = 25) and 4-year (N = 16) follow-up, participants underwent a general medical examination, complete blood test, body composition analysis, cognitive evaluation and a PET-MRI protocol all within a 6-week period.
PET Image Acquisition
Measurement of brain 18F-FDG and 11C-AcAc uptake was based on our dynamic quantitative PET imaging protocol described previously (Nugent et al., 2014b; Castellano et al., 2015b; Courchesne-Loyer et al., 2017). Brain PET scans were performed on a Philips Gemini TF PET/CT scanner (Philips Medical System, Eindhoven, Netherlands) using a dynamic list mode acquisition, with time-of-flight enabled, an isotropic voxel size of 2 mm3, field-of-view of 25 cm, and an axial field of 18 cm. Briefly, for each scan, after a fasting period of 6–7 h after breakfast, the participant was positioned in the PET/CT scanner in the early afternoon under dim light in a quiet environment, 15 min prior to acquiring the scan. Immediately after intravenous administration of 287 ± 90 MBq of 11C-AcAc via a forearm vein catheter, dynamic scans were obtained over a total duration of 10 min (time frames 12 × 10 s, 8 × 30 s, and 1 × 4 min). After a 60 min wash-out period, an i.v. dose of 191 ± 25 MBq of 18F-FDG was administered and PET images were acquired over 60 min (time frames = 12 × 10 s, 8 × 30 s, 6 × 4 min, and 6 × 5 min). Repeated arterialize venous blood samples were obtained during the two scans. 18F-FDG PET scans were reviewed by a nuclear radiologist to detect abnormalities.
MR Image Acquisition
For all participants and at each time point, T1-weighted (T1w) and FLAIR MRIs were acquired on a 1.5 Tesla scanner (Sonata, Siemens Medical Solutions, Erlangen, Germany). Scan duration was 9.14 min. FLAIR and T1w MRIs were reviewed by a neurologist to detect structural abnormalities as well as potential ischemic stroke. Acquisition parameters were identical at all three time points (Nugent et al., 2014a):
• T1w: TR = 16.00 ms, TE = 4.68 ms, field of view = 256 × 240 × 192 mm, matrix size of 256 × 256 × 164, flip angle = 20° and 1 mm3 isotropic voxels; and
• FLAIR: TR = 8,500 ms, TE = 91 ms, TI = 2,400 ms, echo train length of 17, matrix size of 256 × 192, for a 230 × 172.5 mm2 field of view, slice thickness of 6 mm, spacing between slices of 1.2 mm.
Quantification of Brain Acetoacetate, Total Ketone and Glucose Consumption
Brain 11C-AcAc and 18F-FDG PET images were analyzed using PMOD 3.8 software (PMOD Technologies Ltd., Zurich, Switzerland) as previously described (Castellano et al., 2017). Briefly, cerebral metabolic rate [CMR; (μmoles/100 g/min)] of acetoacetate and glucose (CMRacac and CMRglc, respectively) were quantified according to the graphical analysis method developed by Patlak et al. (1983); based on the plasma time-activity curves calibrated against the series of blood samples obtained during the PET scans. For each tracer, the measured PET activity is divided by plasma activity, and plotted at a “normalized time” (integral of input curve from injection divided by plasma activity). The resulting slope is the rate constant for brain extraction of the tracer [K; (min−1)]. Subsequently, the CMR is derived from the brain influx K according to the following mathematical equation:
where Cp is the plasma tracer, and LC is the lumped constant. The LC of CMRacac and CMRglc were set to 1.0 and 0.8, respectively.
PET images were partial volume-corrected (PVC) using the PVC MR-based solution (Müller-Gärtner et al., 1992) implemented in PMOD (PMOD Technologies Ltd., Zurich, Switzerland). Brain segmentation was defined by T1w MRI automatic anatomical labeling (AAL Single-Subject Atlas) implemented in PNEURO tool (PMOD Technologies Ltd., Zurich, Switzerland). Brain 3D surface projections of voxel-wise parametric images of Kglc and Kacac obtained with PXMOD tool (PMOD Technologies Ltd., Zurich, Switzerland) were generated using the MIMvista medical program 6.4 (MIM Software Inc., Cleveland, OH, USA).
Structural MR Image Analysis
T1w MRI data were automatically processed with the longitudinal stream in FreeSurfer (version 6.01; Reuter et al., 2012). Regional brain volumes were normalized to intracranial volumes (Westman et al., 2013). A fully automated analysis of whole-brain atrophy was performed using the SIENA software package from version 4.1.4 of FSL (FMRIB’s Software Library2), from which the percent whole brain volume change (PBVC) was calculated at 2-year intervals (Smith et al., 2002). Global brain atrophy was expressed as a negative PBVC between two time points.
Cognitive Battery
General cognitive status was based on the MMSE and Montreal Cognitive Assessment (MoCA). The Trail Making Number-Letter sequencing (NLS), Verbal Fluency category-switching and Stroop Color-Word interference inhibition/switching tests from the Delis–Kaplan Executive Function System (D-KEFS) provided information on executive function (Delis et al., 2001). Working memory was evaluated using the Number-Letter sequencing and the Spatial Span Backward tests of the Wechsler Adult Intelligence Scale-III (WMS-III; Wechsler, 1997), as well as the Digit Span Backward and Sequencing from the Wechsler Adult Intelligence Scale-IV (WAIS-IV; Wechsler, 2008). Episodic memory was assessed with the Rey Complex Figure immediate and delay recall tests (RCFT; Meyers and Meyers, 1995) as well as Verbal Paired Associates and Logical Memory recall and delay recall subtests from the WMS-III (Wechsler, 1997). The Boston Naming test, revised version (Kertesz, 1982), was used to provide information on language. Processing speed and attention were assessed with the Digit Symbol Substitution and the Symbol Search tests from the WAIS-IV as well as the Trail Making Visual Scanning (VS), Number Sequence (NS), and Letter Sequence (LS) tests from the D-KEFS (Wechsler, 2008). For each cognitive domain a composite z-score was calculated from the different scaled scores, based on normative conversion tables. For the 60-item Boston Naming test, normative data were used (Zec et al., 2007).
Blood Metabolites and Body Composition
The plasma ketones, beta-hydroxybutyrate (BHB) and AcAc, were analyzed as previously described (St-Pierre et al., 2017). Plasma insulin was analyzed by ELISA (Alpco, Salem, NH, USA). An index of insulin resistance was derived using the homeostasis model assessment for insulin resistance (HOMA-IR) method (Matthews et al., 1985). All other blood assays were done at the biochemistry core laboratory of Sherbrooke University Hospital Center (CIUSSS de l’Estrie—CHUS, Sherbrooke, QC, USA). Plasma glucose, cholesterol and triglycerides were analyzed by automated colorimetric assay with commercially available kits on a clinical chemistry analyzer (Dimension Xpand Plus; Siemens, Deerfield, IL, USA). Plasma albumin, aspartate aminotransferase, alanine aminotransferase, creatinine, and high and low-density lipoprotein cholesterol were measured by commercially available kits on an automated analyzer (COBAS; Roche Diagnostics, Indianapolis, IN, USA). Glycated hemoglobin (HbA1c) was measured by high performance liquid chromatography (Tosoh Bioscience, King of Prussia, PA, USA). Thyroid-stimulating hormone (TSH) was measured by sandwich electro-chemiluminescence immunochemistry.
Measurement of body composition (fat and lean mass) was done by dual-energy X-ray absorptiometry (Lunar iDXA, GE Healthcare Lunar, Madison, WI, USA). DXA-derived measures, fat mass index (total fat mass/height2) and appendicular lean mass index (arm + leg lean mass/height2), were also calculated (Imboden et al., 2017a,b).
Statistics
Results are expressed as mean values with their pooled standard errors, except where specified. The data were analyzed for serial measures using the MIXED procedure of SPSS (IBM SPSS Statistics Version 24.0) with age as the main factor. A linear model between dependent variables and age was used and slope tests for fixed effects were considered significant at an alpha level of 0.05. All neuroimaging analysis underwent a p ≤ 0.05 false discovery rate (FDR) correction (Benjamini and Hochberg, 1995). All correlations were made on the subject averages measurements. Linear regression modeling was used to test the different relationships: brain energy metabolism (CMRglc, CMRacac, Kglc and Kacac) vs. cognition, brain morphometry vs. cognition, HOMA-IR vs. brain energy metabolism, and HOMA-IR vs. cognition.
Results
Brain Glucose and Acetoacetate Extraction
Participant characteristics are shown in Table 1. Among the 43 neuroanatomical regions extracted using the AAL atlas, many brain regions had a statistically significant decrease in Kglc over time, mainly in the tempo-parietal lobes and cingulate gyri (Figure 1 and Table 2; all p < 0.05 FDR corrected). In contrast, Kacac did not show any statistical difference across the regions during the 4-year follow-up (Table 3; all p ≥ 0.11 FDR-corrected). At the 2 and 4-year time points compared to baseline, there was no difference in regional CMRglc or CMRacac (Supplementary Tables S1, S2; all p > 0.06 FDR-corrected).
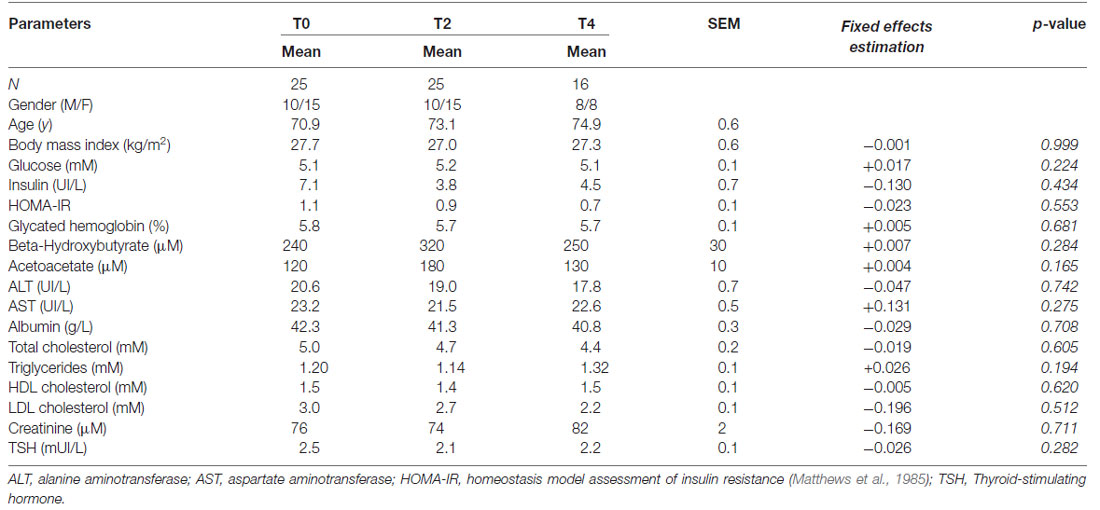
Table 1. Characteristics of the participants during the 4 year follow-up.
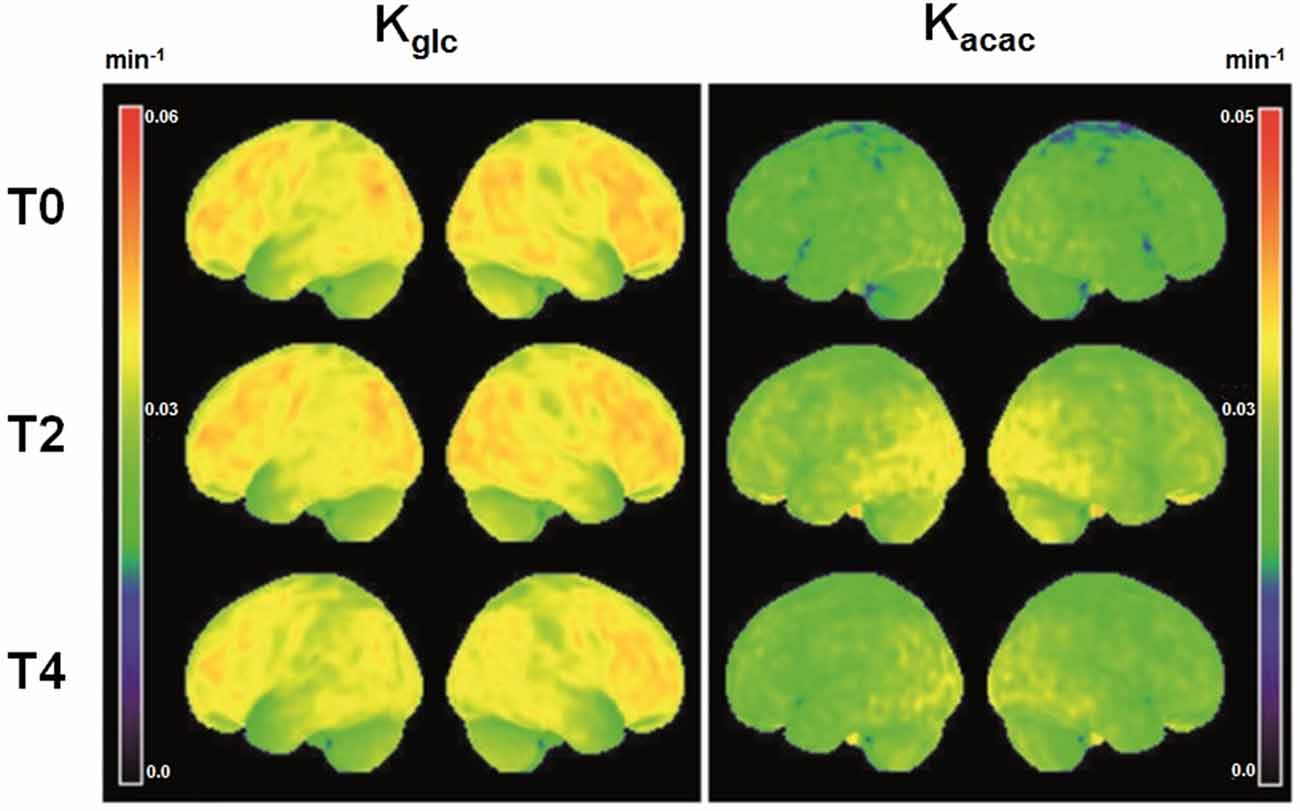
Figure 1. Voxel-wise three dimensional view of the brain surface showing the rate constant for brain extraction of glucose (Kglc, min−1) and acetoacetate (Kacac, min−1) at baseline (T0, N = 25) and two (T2, N = 25) and 4 years later (T4, N = 16). Theses mean maps are a simple representation of the average quantitative value of brain fuel uptake (glucose or acetoacetate) of all participants for each voxel relative to total whole brain tracer uptake.
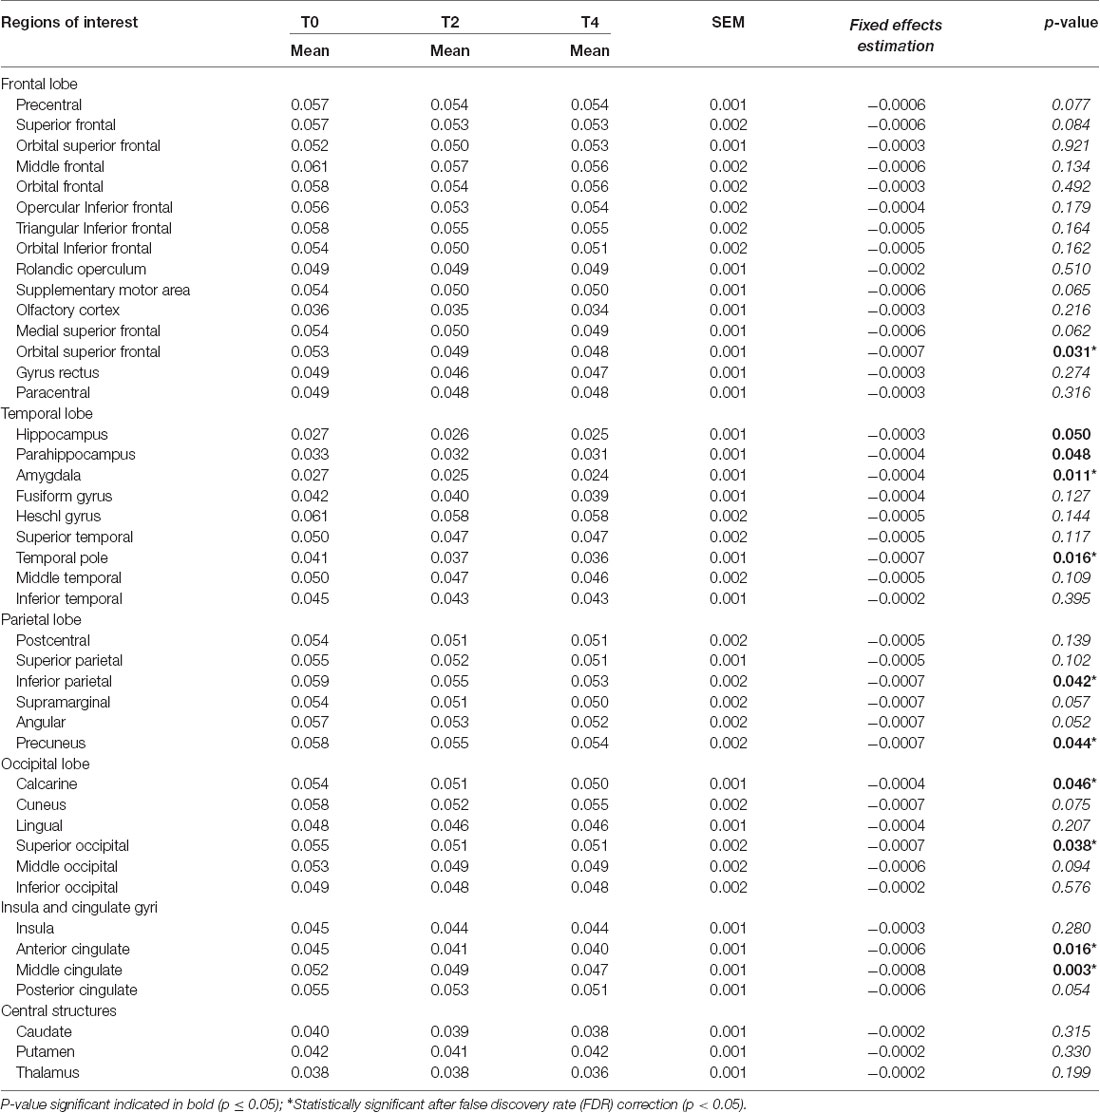
Table 2. Regional rate constant for brain extraction of glucose (Kglc; min−1) during the 4 year follow-up.
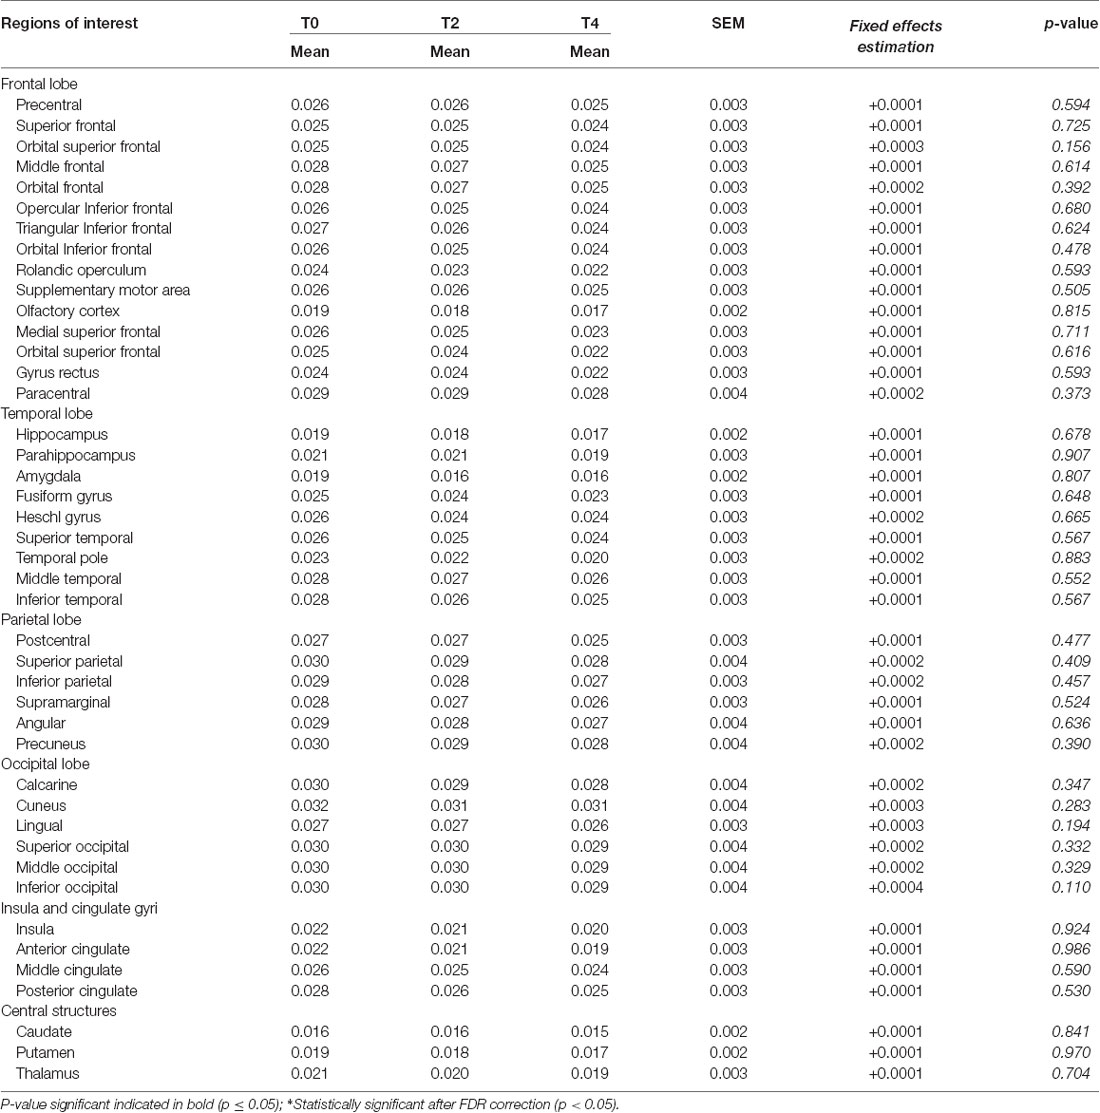
Table 3. Regional rate constant for brain extraction of acetoacetate (Kacac; min−1) over the 4 year follow-up.
Global and Regional MRI Measures
During the 2 and 4-year follow-ups, global brain atrophy (mean ± SD) was 1.2 ± 1.2% and 1.7 ± 1.7%, respectively, or 0.52% annually. Regional analysis of brain volumes showed the same pattern as global brain atrophy (Supplementary Table S3). Cortical thickness decreased by a mean of 0.04 ± 0.01 mm/year, mainly in the fronto-temporo-parietal regions (Supplementary Table S4; all p ≤ 0.01 FDR-corrected).
Cognitive Evaluation
Participants had a mean of 16 ± 4 years education. Overall, cognitive performance at baseline and over the 4-year follow-up remained within the normal range for age (Table 4), but significant declines in raw scores were noted on certain tests. For instance, time to complete increased on the Trail Making VS, NS, LS and NLS tasks and Stroop Inhibition/Switching task (all p ≤ 0.05). On the other hand, performance on learning word pairs of the Verbal Paired Associates—Part I (VPAI) improved over time (p = 0.03). After normalization of the results for age (scaled scores), only differences on the Trail Making VS and VPAI tests remained statistically different (Estimated fixed effects = −0.148 and +0.292, respectively; all p ≤ 0.02). Composite z-scores did not show any significant change over the 4 years, except in language which showed improvement (z-score ± SD, from −0.6 ± 1.1 to −0.1 ± 0.9; p = 0.02).
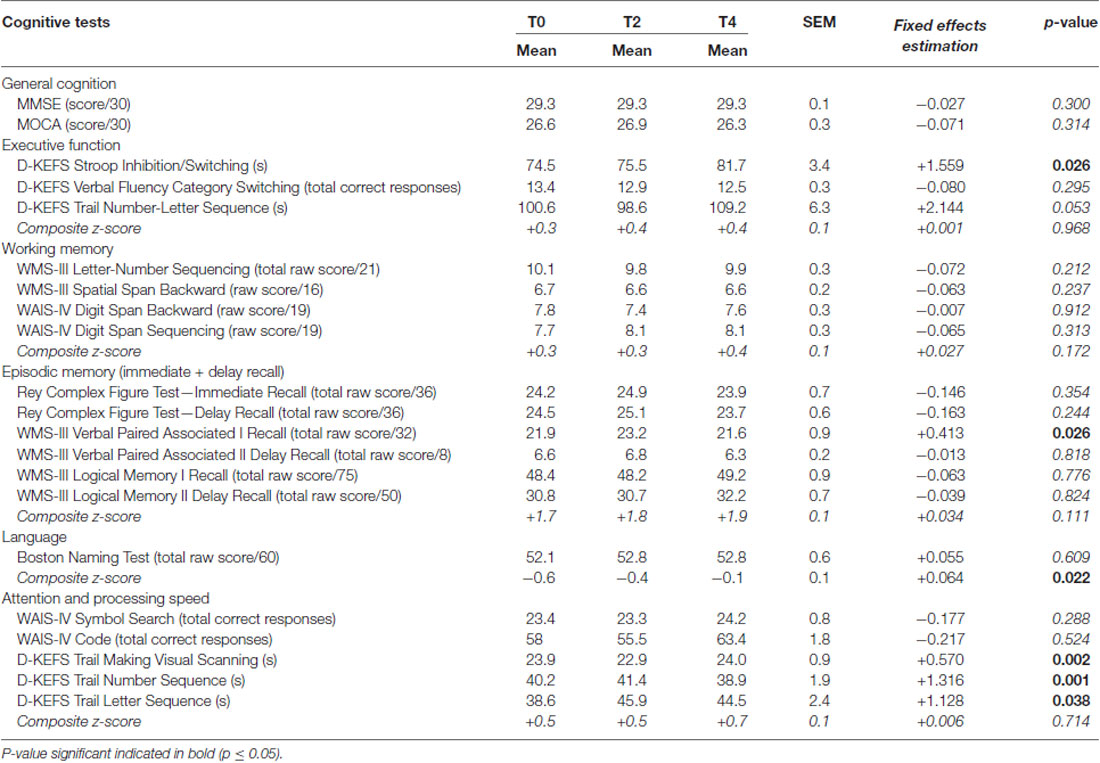
Table 4. Cognitive test scores (mean ± SEM) during the 4 year follow-up.
Blood Parameters and Body Composition
Baseline anthropometry and plasma metabolites corresponded to normal reference values for the same age range from the Sherbrooke University Hospital Center (Sherbrooke, QC, USA). Over the 4-year follow-up, no significant change in plasma metabolites or HOMA-IR index was observed (Table 1; all p ≥ 0.19). Participants had an average BMI of 27 ± 0.7 kg/m2 throughout the 4 years. No significant difference was found in body fat parameters throughout the 4 years (data not shown; all p ≥ 0.11). However, appendicular lean mass index declined over the 4 years (baseline, 2-year and 4-year values of 8.1 ± 1.2, 7.9 ± 1.2 and 7.8 ± 1.3 kg/m2, respectively; all p ≤ 0.02) but remained within the normal range for age (Imboden et al., 2017a).
Relation Between Brain Function/Structure, Cognitive Performance and Insulin Resistance
A significant positive relationship was observed between higher Kglc in the caudate and higher score on both the WAIS-IV Digit span Backward (r = +0.41, p = 0.044) and the D-KEFS Trail Making Visual scanning tests (r = +0.43, p = 0.034). Similarly, higher Kacac in the caudate was associated with a higher performance on several components of the D-KEFS Stroop Color-Word, the D-KEFS Verbal Fluency and the WMS-III Verbal Paired Associate (Supplementary Table S5; all p ≤ 0.04). Higher HOMA-IR was associated with lower Kglc in the thalamus (r = −0.44, p = 0.04) and caudate (r = −0.43; p = 0.05). Higher HOMA-IR tended to be associated with lower plasma ketone levels (r = −0.40, p = 0.06), but no significant relationship was noted between HOMA-IR and regional Kacac (p ≥ 0.51). Lower composite z-scores for executive function (r = −0.45, p = 0.035), attention and processing speed (β = −0.53, p = 0.012), were significantly inversely related to HOMA-IR. Better cognitive performance on several tests was positively associated with higher volume of the caudate (Rey Complex Figure Test—Delay Recall scaled score: r = +0.50, p = 0.012; Logical Memory Total scaled score: r = +0.41, p = 0.048; WAIS-IV Digit Span Backward scaled score: r = +0.56, p = 0.004). No other significant relationship was observed among these different parameters (all p > 0.05).
Discussion
Our main observation is that over the 4 year follow-up, cognitively normal older people have a significant decline in Kglc, the brain’s capacity to extract or acquire glucose, in multiple brain regions. This change in Kglc over time was associated with declining cognitive performance which nevertheless remained within the normal range for age. Several brain regions (frontal, parietal and temporal lobes) demonstrated an annual decline in Kglc averaging 1.5%–3.0% per year. These aging-related changes in brain glucose metabolism were less severe, less extensive and in different regions from the rate of decline in Kglc in the frontal and temporal regions in AD (Jagust et al., 1991; Piert et al., 1996; Kondoh et al., 1997; Mosconi et al., 2007b; Castellano et al., 2015b). No such temporal change occurred in the brain’s capacity to acquire acetoacetate (Kacac). Hence, we show for the first time in a longitudinal setting that the aging-related decline in brain energy metabolism is specific to glucose and is a physiological change associated with cognitive changes that are considered normal for age.
In the present study, we have focussed on “K,” Kglc or Kacac because it is a direct measure of the brain’s capacity to take up these to energy substrates. CMR is the brain’s actual uptake of the tracer which varies with changes in blood glucose or ketones. Plasma glucose does not vary too much in this type of PET study, so CMRglc is usually tightly correlated to Kglc and the two measures show broadly the same differences across the brain or over time. However, because plasma ketones can vary a lot, whereas Kacac does not vary much, Kacac is a better measure of the brain’s actual capacity to obtain ketones when they are available.
Decreasing brain glucose metabolism as function of age has been reported in rats (Smith et al., 1980), dogs (London et al., 1983), macaques (Noda et al., 2003) and humans (Bentourkia et al., 2000; Kalpouzos et al., 2009; Chételat et al., 2013; Nugent et al., 2014a,b, 2016). Several cross-sectional 18F-FDG PET studies, mostly done by comparing young vs. older healthy adults, have reported that age-related differences in brain energy metabolism mainly affect the frontal and temporo-parietal lobes (see review by Berti et al., 2014). However, few longitudinal studies on brain energy metabolism during aging have been reported. One 4-year follow-up reported subtle regional metabolic changes in the brain associated with changes in cognition in healthy older adults (Shokouhi et al., 2013). A 24-month follow-up study in older individuals with subjective memory complaints recently reported a reduced standardized uptake value for 18F-FDG in the posterior cingulate and temporo-parietal brain regions, a difference which disappeared after adjustment for sex, age and education (Dubois et al., 2018). Ours is the first report to quantitatively compare both brain glucose and AcAc metabolism in a longitudinal follow-up with measurements at three time points over 4 years.
The rate of decline in whole brain volume of 0.52%/year in the present study was comparable to that reported in other longitudinal studies in a healthy older population (Enzinger et al., 2005; Jack et al., 2005; Leong et al., 2017). Our participants had decreasing gray matter volume in most brain regions, including sub-cortical nuclei such as the caudate and putamen. There was also a significant correlation between the volume of the caudate and performance on learning tasks. The role of the caudate in cognitive decline has been previously noted (Grahn et al., 2008). Similar to our results, Bauer et al. (2015) reported that atrophy of the caudate is correlated with declining associative learning during normal aging. We extend these reports with a direct and significant relationship between lower performance in several cognitive tests of attention and executive function and lower Kglc in the caudate.
Mild to moderate systemic insulin resistance is common in aging (Rowe et al., 1983), so we investigated the potential relation between the HOMA-IR as a common measure of insulin resistance and brain energy metabolism. Similar to other studies that reported a negative association between insulin resistance and CMRglc (Baker et al., 2011; Castellano et al., 2015a; Willette et al., 2015), we show here that a higher HOMA-IR correlated significantly with lower Kglc and tended to correlate with lower plasma ketones (p = 0.06). Insulin influences three aspects of ketone metabolism: free fatty acid availability from adipose tissue by lipolysis, ketogenesis in the liver and peripheral ketone clearance (Ciaraldi and Henry, 2004). Ketone transport into tissues is influenced by insulin (Balasse and Havel, 1971; Hall et al., 1984) and the inhibitory influence of insulin resistance on ketone body metabolism can be present at raised but still physiological insulin levels (Singh et al., 1993). In the present study, HOMA-IR was inversely related to composite z-score for executive function, attention and processing speed, results that agree with those reported in older adults with cardiovascular disease (Lutski et al., 2017). The present results go further in demonstrating the direct relationship between cognition and the central utilization of glucose, and that insulin resistance is associated with lower plasma ketones in later life. This observation may be important in ketogenic strategies designed to compensate for or bypass brain glucose hypometabolism in AD (Cunnane et al., 2016a).
This study had several limitations, the main one being the small and unbalanced sample size between baseline and year 2 (both N = 25) compared to year 4 (N = 16). However, our statistical approach based on the linear mixed-effects model is the one specifically recommended for an unequal number of observations (McCulloch et al., 2008). It would have been interesting to explore a possible gender difference since a disparity in cognition can be observed between older men and women (Munro et al., 2012). However, this comparison was not done owing to small sample size, which was the same reason apolipoprotein E genotype was not assessed. APOE4 is both an important risk factor for late onset AD and lower brain glucose metabolism is present in AD-vulnerable brain regions in cognitively normal middle-aged carriers of APOE4 (Reiman et al., 2001). Longitudinal changes in cognitive performance show heterogeneous trajectories in normal aging (Wilson et al., 2002; Goh et al., 2012). The relatively slow decline in cognition in the present study likely reflects the overall good health and education, as well as the relatively young age of our cohort (mid-70s at the end of the study). Decline on several domains of cognition including memory may not manifest until after 75 years of age (Small et al., 2011). Finally, since the participants in the present study had a cognitive performance within the normal range at all three time points, the metabolic changes we report here do not really help identify those at highest risk of progressing to MCI or AD.
Conclusion
Widespread longitudinal changes in the capacity of the brain to extract glucose occur in healthy, cognitively normal older adults. These changes in brain glucose metabolism exceeded by several fold the annual rate of change in brain volume and were not observed for brain ketone metabolism. Insulin resistance was associated not only with declining cognitive performance but also with lower brain glucose metabolism in this cohort.
Data Availability
All datasets generated for this study are included in the manuscript and the supplementary files.
Author Contributions
SC designed the study. SC, MF and C-AC wrote the protocol. C-AC, EC, SN, ML and ST participated in the PET and/or MR image acquisition and processing. SD and OP performed the longitudinal MRI analysis. C-AC and CH ran the cognitive assessments, and analyzed and interpreted the cognitive data. ID supervised the iDXA acquisition and analysis. MF, VS-P and CV contributed to experimental methodology and biological analyses. CB, NF, TF and ET provided medical supervision and assessments throughout the study. C-AC undertook the statistical analysis. C-AC and SC drafted and revised the manuscript. All co-authors reviewed and commented on the manuscript before submission.
Funding
This work was supported by the Fonds de recherche Québec-Santé (institutional grant to the CdRV), NSERC (SC), the Canada Research Chairs Secretariat (SC), and a Université de Sherbrooke Research Chair (SC).
Conflict of Interest Statement
SC has received travel honoraria and/or consulted for Accera, Bulletproof, Nisshin Oillio, and Prüvit; he has received test materials for research purposes and/or research funding awarded to the Université de Sherbrooke from Abitec, Ultragenyx and Nestlé. He has a patent application pending on the formulation of a ketogenic drink. SC is President and sole shareholder of Senotec Ltd., company aiming to develop a ketogenic supplement for human consumption. SD is officer and shareholder of True Positive Medical Devices Inc., a company specializing in brain image analysis services.
The remaining authors declare that the research was conducted in the absence of any commercial or financial relationships that could be construed as a potential conflict of interest.
Acknowledgments
Excellent assistance was provided by Conrad Filteau, Christine Brodeur-Dubreuil and Marie-Christine Morin. We are grateful to Eric Lavallée and the clinical PET-MRI group (CIMS) for their technical assistance, Philippe Goffaux for his assistance with cognitive evaluations at the start of the project, Isabelle Dionne’s group for supervising iDXA body composition analysis, and Lise Trottier for providing help on the statistical analysis.
Abbreviations
11C-AcAc, [11C]-acetoacetate; 18F-FDG, [18F]-Fluoro-2-deoxyglucose; AD, Alzheimer’s disease; APOE4, apolipoprotein E4; BHB, Beta-Hydroxybutyrate; CMRacac, cerebral metabolic rate of acetoacetate; CMRglc, cerebral metabolic rate of glucose; HOMA-IR, Homeostasis Model Assessment of insulin resistance; Kacac, rate constant for brain extraction of acetoacetate; Kglc, rate constant for brain extraction of glucose; MCI, mild cognitive impairment; MMSE, Mini-mental state examination; MoCA, Montreal Cognitive Assessment; MRI, magnetic resonance imaging; PET, positron emission tomography.
Footnotes
Supplementary Material
The Supplementary Material for this article can be found online at: https://www.frontiersin.org/articles/10.3389/fnagi.2019.00015/full#supplementary-material
References
Albin, R. L., Koeppe, R. A., Burke, J. F., Giordani, B., Kilbourn, M. R., Gilman, S., et al. (2010). Comparing fludeoxyglucose F18-PET assessment of regional cerebral glucose metabolism and [11C]dihydrotetrabenazine-PET in evaluation of early dementia and mild cognitive impairment. Arch. Neurol. 67, 440–446. doi: 10.1001/archneurol.2010.34
Baker, L. D., Cross, D. J., Minoshima, S., Belongia, D., Watson, G. S., and Craft, S. (2011). Insulin resistance and Alzheimer-like reductions in regional cerebral glucose metabolism for cognitively normal adults with prediabetes or early type 2 diabetes. Arch. Neurol. 68, 51–57. doi: 10.1001/archneurol.2010.225
Balasse, E. O., and Havel, R. J. (1971). Evidence for an effect of insulin on the peripheral utilization of ketone bodies in dogs. J. Clin. Invest. 50, 801–813. doi: 10.1172/jci106551
Bauer, E., Toepper, M., Gebhardt, H., Gallhofer, B., and Sammer, G. (2015). The significance of caudate volume for age-related associative memory decline. Brain Res. 1622, 137–148. doi: 10.1016/j.brainres.2015.06.026
Benjamini, Y., and Hochberg, Y. (1995). Controlling the false discovery rate: a practical and powerful approach to multiple testing. J. R. Stat. Soc. B 57, 289–300. doi: 10.1111/j.2517-6161.1995.tb02031.x
Bentourkia, M. H., Bol, A., Ivanoiu, A., Labar, D., Sibomana, M., Coppens, A., et al. (2000). Comparison of regional cerebral blood flow and glucose metabolism in the normal brain: effect of aging. J. Neurol. Sci. 181, 19–28. doi: 10.1016/s0022-510x(00)00396-8
Berti, V., Mosconi, L., and Pupi, A. (2014). Brain: normal variations and benign findings in FDG PET/CT imaging. PET Clin. 9, 129–140. doi: 10.1016/j.cpet.2013.10.006
Castellano, C. A., Baillargeon, J. P., Nugent, S., Tremblay, S., Fortier, M., Imbeault, H., et al. (2015a). Regional brain glucose hypometabolism in young women with polycystic ovary syndrome: possible link to mild insulin resistance. PLoS One 10:e0144116. doi: 10.1371/journal.pone.0144116
Castellano, C. A., Nugent, S., Paquet, N., Tremblay, S., Bocti, C., Lacombe, G., et al. (2015b). Lower brain 18F-fluorodeoxyglucose uptake but normal 11C-acetoacetate metabolism in mild Alzheimer’s disease dementia. J. Alzheimers Dis. 43, 1343–1353. doi: 10.3233/jad-141074
Castellano, C. A., Paquet, N., Dionne, I. J., Imbeault, H., Langlois, F., Croteau, E., et al. (2017). A 3-month aerobic training program improves brain energy metabolism in mild Alzheimer’s disease: preliminary results from a neuroimaging study. J. Alzheimers Dis. 56, 1459–1468. doi: 10.3233/jad-161163
Chételat, G., Landeau, B., Salmon, E., Yakushev, I., Bahri, M. A., Mézenge, F., et al. (2013). Relationships between brain metabolism decrease in normal aging and changes in structural and functional connectivity. Neuroimage 76, 167–177. doi: 10.1016/j.neuroimage.2013.03.009
Ciaraldi, T. P., and Henry, R. R. (2004). “Insulin regulation of ketone body metabolism,” in International Textbook of Diabetes Mellitus—Third Edition, eds E. F. R. A. De Fronzo, H. Keen and P. Zimmet (West Sussex: John Wiley and Sons Ltd.). doi: 10.1002/0470862092.d0308
Courchesne-Loyer, A., Croteau, E., Castellano, C. A., St-Pierre, V., Hennebelle, M., and Cunnane, S. C. (2017). Inverse relationship between brain glucose and ketone metabolism in adults during short-term moderate dietary ketosis: a dual tracer quantitative positron emission tomography study. J. Cereb. Blood Flow Metab. 37, 2485–2493. doi: 10.1177/0271678x16669366
Croteau, E., Castellano, C. A., Fortier, M., Bocti, C., Fulop, T., Paquet, N., et al. (2018). A cross-sectional comparison of brain glucose and ketone metabolism in cognitively healthy older adults, mild cognitive impairment and early Alzheimer’s disease. Exp. Gerontol. 107, 18–26. doi: 10.1016/j.exger.2017.07.004
Cunnane, S. C., Courchesne-Loyer, A., St-Pierre, V., Vandenberghe, C., Croteau, E., and Castellano, C. A. (2016a). “Glucose and ketone metabolism in the aging brain: implications for therapeutic strategies to delay the progression of Alzheimer’s disease,” in Ketogenic Diet and Metabolic Therapies: Expanded Roles in Health and Disease, ed. S. A. Masino (New York, NY: Oxford University Press), 424.
Cunnane, S. C., Courchesne-Loyer, A., St-Pierre, V., Vandenberghe, C., Pierotti, T., Fortier, M., et al. (2016b). Can ketones compensate for deteriorating brain glucose uptake during aging? Implications for the risk and treatment of Alzheimer’s disease. Ann. N Y Acad. Sci. 1367, 12–20. doi: 10.1111/nyas.12999
Cunnane, S. C., Courchesne-Loyer, A., Vandenberghe, C., St-Pierre, V., Fortier, M., Hennebelle, M., et al. (2016c). Can ketones help rescue brain fuel supply in later life? Implications for cognitive health during aging and the treatment of Alzheimer’s disease. Front. Mol. Neurosci. 9:53. doi: 10.3389/fnmol.2016.00053
Cunnane, S., Nugent, S., Roy, M., Courchesne-Loyer, A., Croteau, E., Tremblay, S., et al. (2011). Brain fuel metabolism, aging, and Alzheimer’s disease. Nutrition 27, 3–20. doi: 10.1016/j.nut.2010.07.021
Delis, D., Kaplan, E., and Kramer, J. (2001). Delis-Kaplan Executive Function System (D-KEFS). San Antonio, TX: Psychological Corporation.
Dubois, B., Epelbaum, S., Nyasse, F., Bakardjian, H., Gagliardi, G., Uspenskaya, O., et al. (2018). Cognitive and neuroimaging features and brain β-amyloidosis in individuals at risk of Alzheimer’s disease (INSIGHT-preAD): a longitudinal observational study. Lancet Neurol. 17, 335–346. doi: 10.1016/s1474-4422(18)30029-2
Enzinger, C., Fazekas, F., Matthews, P. M., Ropele, S., Schmidt, H., Smith, S., et al. (2005). Risk factors for progression of brain atrophy in aging: six-year follow-up of normal subjects. Neurology 64, 1704–1711. doi: 10.1212/01.wnl.0000161871.83614.bb
Goh, J. O., An, Y., and Resnick, S. M. (2012). Differential trajectories of age-related changes in components of executive and memory processes. Psychol. Aging 27, 707–719. doi: 10.1037/a0026715
Grahn, J. A., Parkinson, J. A., and Owen, A. M. (2008). The cognitive functions of the caudate nucleus. Prog. Neurobiol. 86, 141–155. doi: 10.1016/j.pneurobio.2008.09.004
Hall, S. E., Wastney, M. E., Bolton, T. M., Braaten, J. T., and Berman, M. (1984). Ketone body kinetics in humans: the effects of insulin-dependent diabetes, obesity, and starvation. J. Lipid Res. 25, 1184–1194.
Herholz, K. (1995). FDG PET and differential diagnosis of dementia. Alzheimer Dis. Assoc. Disord. 9, 6–16. doi: 10.1097/00002093-199505000-00004
Herholz, K. (2014). The role of PET quantification in neurological imaging: FDG and amyloid imaging in dementia. Clin. Transl. Imaging 2, 321–330. doi: 10.1007/s40336-014-0073-z
Imboden, M. T., Swartz, A. M., Finch, H. W., Harber, M. P., and Kaminsky, L. A. (2017a). Reference standards for lean mass measures using GE dual energy x-ray absorptiometry in Caucasian adults. PLoS One 12:e0176161. doi: 10.1371/journal.pone.0176161
Imboden, M. T., Welch, W. A., Swartz, A. M., Montoye, A. H. K., Finch, H. W., Harber, M. P., et al. (2017b). Reference standards for body fat measures using GE dual energy x-ray absorptiometry in Caucasian adults. PLoS One 12:e0175110. doi: 10.1371/journal.pone.0175110
Jack, C. R. Jr., Shiung, M. M., Weigand, S. D., O’Brien, P. C., Gunter, J. L., Boeve, B. F., et al. (2005). Brain atrophy rates predict subsequent clinical conversion in normal elderly and amnestic MCI. Neurology 65, 1227–1231. doi: 10.1212/01.wnl.0000180958.22678.91
Jagust, W. J., Seab, J. P., Huesman, R. H., Valk, P. E., Mathis, C. A., Reed, B. R., et al. (1991). Diminished glucose transport in Alzheimer’s disease: dynamic PET studies. J. Cereb. Blood Flow Metab. 11, 323–330. doi: 10.1038/jcbfm.1991.65
Kalpouzos, G., Chételat, G., Baron, J. C., Landeau, B., Mevel, K., Godeau, C., et al. (2009). Voxel-based mapping of brain gray matter volume and glucose metabolism profiles in normal aging. Neurobiol. Aging 30, 112–124. doi: 10.1016/j.neurobiolaging.2007.05.019
Kondoh, Y., Nagata, K., Sasaki, H., and Hatazawa, J. (1997). Dynamic FDG-PET study in probable Alzheimer’s disease. Ann. N Y Acad. Sci. 826, 406–409. doi: 10.1111/j.1749-6632.1997.tb48493.x
Leong, R. L. F., Lo, J. C., Sim, S. K. Y., Zheng, H., Tandi, J., Zhou, J., et al. (2017). Longitudinal brain structure and cognitive changes over 8 years in an East Asian cohort. Neuroimage 147, 852–860. doi: 10.1016/j.neuroimage.2016.10.016
London, E. D., Ohata, M., Takei, H., French, A. W., and Rapoport, S. I. (1983). Regional cerebral metabolic rate for glucose in beagle dogs of different ages. Neurobiol. Aging 4, 121–126. doi: 10.1016/0197-4580(83)90035-0
Lutski, M., Weinstein, G., Goldbourt, U., and Tanne, D. (2017). Insulin resistance and future cognitive performance and cognitive decline in elderly patients with cardiovascular disease. J. Alzheimers Dis. 57, 633–643. doi: 10.3233/jad-161016
Matthews, D. R., Hosker, J. P., Rudenski, A. S., Naylor, B. A., Treacher, D. F., and Turner, R. C. (1985). Homeostasis model assessment: insulin resistance and β-cell function from fasting plasma glucose and insulin concentrations in man. Diabetologia 28, 412–419. doi: 10.1007/bf00280883
McCulloch, C. E., Searle, S. R., and Neuhaus, J. M. (2008). Generalized, Linear, and Mixed Models—Second Edition. New Jersey, NJ: John Wiley and Sons, Inc.
Meyers, J., and Meyers, K. (1995). Rey Complex Figure and Recognition Trial: Professional Manual. Odessa, FL: Psychological Assessment Resources.
Mosconi, L. (2013). Glucose metabolism in normal aging and Alzheimer’s disease: methodological and physiological considerations for PET studies. Clin. Transl. Imaging 1, 217–233. doi: 10.1007/s40336-013-0026-y
Mosconi, L., Brys, M., Switalski, R., Mistur, R., Glodzik, L., Pirraglia, E., et al. (2007a). Maternal family history of Alzheimer’s disease predisposes to reduced brain glucose metabolism. Proc. Natl. Acad. Sci. U S A 104, 19067–19072. doi: 10.1073/pnas.0705036104
Mosconi, L., Tsui, W. H., Rusinek, H., De Santi, S., Li, Y., Wang, G. J., et al. (2007b). Quantitation, regional vulnerability, and kinetic modeling of brain glucose metabolism in mild Alzheimer’s disease. Eur. J. Nucl. Med. Mol. Imaging 34, 1467–1479. doi: 10.1007/s00259-007-0406-5
Mosconi, L., De Santi, S., Brys, M., Tsui, W. H., Pirraglia, E., Glodzik-Sobanska, L., et al. (2008a). Hypometabolism and altered cerebrospinal fluid markers in normal apolipoprotein E E4 carriers with subjective memory complaints. Biol. Psychiatry 63, 609–618. doi: 10.1016/j.biopsych.2007.05.030
Mosconi, L., De Santi, S., Li, J., Tsui, W. H., Li, Y., Boppana, M., et al. (2008b). Hippocampal hypometabolism predicts cognitive decline from normal aging. Neurobiol. Aging 29, 676–692. doi: 10.1016/j.neurobiolaging.2006.12.008
Müller-Gärtner, H. W., Links, J. M., Prince, J. L., Bryan, R. N., McVeigh, E., Leal, J. P., et al. (1992). Measurement of radiotracer concentration in brain gray matter using positron emission tomography: MRI-based correction for partial volume effects. J. Cereb. Blood Flow Metab. 12, 571–583. doi: 10.1038/jcbfm.1992.81
Munro, C. A., Winicki, J. M., Schretlen, D. J., Gower, E. W., Turano, K. A., Munoz, B., et al. (2012). Sex differences in cognition in healthy elderly individuals. Neuropsychol. Dev. Cogn. B Aging Neuropsychol. Cogn. 19, 759–768. doi: 10.1080/13825585.2012.690366
Noda, A., Takamatsu, H., Minoshima, S., Tsukada, H., and Nishimura, S. (2003). Determination of kinetic rate constants for 2–fluoro-2-deoxy-D-glucose and partition coefficient of water in conscious macaques and alterations in aging or anesthesia examined on parametric images with an anatomic standardization technique. J. Cereb. Blood Flow Metab. 23, 1441–1447. doi: 10.1097/01.wcb.0000090623.86921.47
Nugent, S., Castellano, C. A., Bocti, C., Dionne, I., Fulop, T., and Cunnane, S. C. (2016). Relationship of metabolic and endocrine parameters to brain glucose metabolism in older adults: do cognitively-normal older adults have a particular metabolic phenotype? Biogerontology 17, 241–255. doi: 10.1007/s10522-015-9595-7
Nugent, S., Castellano, C. A., Goffaux, P., Whittingstall, K., Lepage, M., Paquet, N., et al. (2014a). Glucose hypometabolism is highly localized, but lower cortical thickness and brain atrophy are widespread in cognitively normal older adults. Am. J. Physiol. Endocrinol. Metab. 306, E1315–E1321. doi: 10.1152/ajpendo.00067.2014
Nugent, S., Tremblay, S., Chen, K. W., Ayutyanont, N., Roontiva, A., Castellano, C. A., et al. (2014b). Brain glucose and acetoacetate metabolism: a comparison of young and older adults. Neurobiol. Aging 35, 1386–1395. doi: 10.1016/j.neurobiolaging.2013.11.027
Pagani, M., De Carli, F., Morbelli, S., Öberg, J., Chincarini, A., Frisoni, G. B., et al. (2015). Volume of interest-based [18F]fluorodeoxyglucose PET discriminates MCI converting to Alzheimer’s disease from healthy controls. A european Alzheimer’s disease consortium (EADC) study. Neuroimage Clin. 7, 34–42. doi: 10.1016/j.nicl.2014.11.007
Patlak, C. S., Blasberg, R. G., and Fenstermacher, J. D. (1983). Graphical evaluation of blood-to-brain transfer constants from multiple-time uptake data. J. Cereb. Blood Flow Metab. 3, 1–7. doi: 10.1038/jcbfm.1983.1
Petit-Taboué, M. C., Landeau, B., Desson, J. F., Desgranges, B., and Baron, J. C. (1998). Effects of healthy aging on the regional cerebral metabolic rate of glucose assessed with statistical parametric mapping. Neuroimage 7, 176–184. doi: 10.1006/nimg.1997.0318
Piert, M., Koeppe, R. A., Giordani, B., Berent, S., and Kuhl, D. E. (1996). Diminished glucose transport and phosphorylation in Alzheimer’s disease determined by dynamic FDG-PET. J. Nucl. Med. 37, 201–208.
Reiman, E. M., Caselli, R. J., Chen, K., Alexander, G. E., Bandy, D., and Frost, J. (2001). Declining brain activity in cognitively normal apolipoprotein E epsilon 4 heterozygotes: a foundation for using positron emission tomography to efficiently test treatments to prevent Alzheimer’s disease. Proc. Natl. Acad. Sci. U S A 98, 3334–3339. doi: 10.1073/pnas.061509598
Reiman, E. M., Chen, K., Alexander, G. E., Caselli, R. J., Bandy, D., Osborne, D., et al. (2004). Functional brain abnormalities in young adults at genetic risk for late-onset Alzheimer’s dementia. Proc. Natl. Acad. Sci. U S A 101, 284–289. doi: 10.1073/pnas.2635903100
Reuter, M., Schmansky, N. J., Rosas, H. D., and Fischl, B. (2012). Within-subject template estimation for unbiased longitudinal image analysis. Neuroimage 61, 1402–1418. doi: 10.1016/j.neuroimage.2012.02.084
Rowe, J. W., Minaker, K. L., Pallotta, J. A., and Flier, J. S. (1983). Characterization of the insulin resistance of aging. J. Clin. Invest. 71, 1581–1587. doi: 10.1172/JCI110914
Shokouhi, S., Claassen, D., Kang, H., Ding, Z., Rogers, B., Mishra, A., et al. (2013). Longitudinal progression of cognitive decline correlates with changes in the spatial pattern of brain 18F-FDG PET. J. Nucl. Med. 54, 1564–1569. doi: 10.2967/jnumed.112.116137
Singh, B. M., Krentz, A. J., and Nattrass, M. (1993). Insulin resistance in the regulation of lipolysis and ketone body metabolism in non-insulin dependent diabetes is apparent at very low insulin concentrations. Diabetes Res. Clin. Pract. 20, 55–62. doi: 10.1016/0168-8227(93)90023-x
Small, B. J., Dixon, R. A., and McArdle, J. J. (2011). Tracking cognition-health changes from 55 to 95 years of age. J. Gerontol. B Psychol. Sci. Soc. Sci. 66, i153–i161. doi: 10.1093/geronb/gbq093
Smith, C. B., Goochee, C., Rapoport, S. I., and Sokoloff, L. (1980). Effects of ageing on local rates of cerebral glucose utilization in the rat. Brain 103, 351–365. doi: 10.1093/brain/103.2.351
Smith, S. M., Zhang, Y., Jenkinson, M., Chen, J., Matthews, P. M., Federico, A., et al. (2002). Accurate, robust, and automated longitudinal and cross-sectional brain change analysis. Neuroimage 17, 479–489. doi: 10.1006/nimg.2002.1040
St-Pierre, V., Courchesne-Loyer, A., Vandenberghe, C., Hennebelle, M., Castellano, C. A., and Cunnane, S. C. (2017). Butyrate is more ketogenic than leucine or octanoate-monoacylglycerol in healthy adult humans. Sci. Transl. Med. 32, 170–175. doi: 10.1016/j.jff.2017.02.024
Wechsler, D. (1997). Wechsler Memory Scale-Third Edition. San Antonio, TX: The Psychological Corporation.
Wechsler, D. (2008). Wechsler Adult Intelligence Scale-Fourth Edition (WAIS-IV): Technical and Interpretive Manual. San Antonio, TX: The Psychological Corporation.
Westman, E., Aguilar, C., Muehlboeck, J. S., and Simmons, A. (2013). Regional magnetic resonance imaging measures for multivariate analysis in Alzheimer’s disease and mild cognitive impairment. Brain Topogr. 26, 9–23. doi: 10.1007/s10548-012-0246-x
Willette, A. A., Bendlin, B. B., Starks, E. J., Birdsill, A. C., Johnson, S. C., Christian, B. T., et al. (2015). Association of insulin resistance with cerebral glucose uptake in late middle-aged adults at risk for Alzheimer disease. JAMA Neurol. 72, 1013–1020. doi: 10.1001/jamaneurol.2015.0613
Wilson, R. S., Beckett, L. A., Barnes, L. L., Schneider, J. A., Bach, J., Evans, D. A., et al. (2002). Individual differences in rates of change in cognitive abilities of older persons. Psychol. Aging 17, 179–193. doi: 10.1037/0882-7974.17.2.179
Keywords: aging, brain energy metabolism, cognition, glucose, insulin resistance, ketones
Citation: Castellano C-A, Hudon C, Croteau E, Fortier M, St-Pierre V, Vandenberghe C, Nugent S, Tremblay S, Paquet N, Lepage M, Fülöp T, Turcotte EE, Dionne IJ, Potvin O, Duchesne S and Cunnane SC (2019) Links Between Metabolic and Structural Changes in the Brain of Cognitively Normal Older Adults: A 4-Year Longitudinal Follow-Up. Front. Aging Neurosci. 11:15. doi: 10.3389/fnagi.2019.00015
Received: 21 November 2018; Accepted: 16 January 2019;
Published: 15 January 2019.
Edited by:
Enrique Cadenas, University of Southern California, United StatesReviewed by:
Zhigang Liu, Northwest A&F University, ChinaFei Yin, University of Arizona, United States
Copyright © 2019 Castellano, Hudon, Croteau, Fortier, St-Pierre, Vandenberghe, Nugent, Tremblay, Paquet, Lepage, Fülöp, Turcotte, Dionne, Potvin, Duchesne and Cunnane. This is an open-access article distributed under the terms of the Creative Commons Attribution License (CC BY). The use, distribution or reproduction in other forums is permitted, provided the original author(s) and the copyright owner(s) are credited and that the original publication in this journal is cited, in accordance with accepted academic practice. No use, distribution or reproduction is permitted which does not comply with these terms.
*Correspondence: Christian-Alexandre Castellano, alexandre.castellano@usherbrooke.ca