Dissecting the Role of SAL1 in Metabolizing the Stress Signaling Molecule 3′-Phosphoadenosine 5′-Phosphate in Different Cell Compartments
 Natallia Ashykhmina1†
  Kai Xun Chan2,3†
  Henning Frerigmann4
  Frank Van Breusegem2,3
  Stanislav Kopriva1
  Ulf-Ingo Flügge1
  Tamara Gigolashvili1*
- 1Institute for Plant Sciences, Cologne Biocenter, University of Cologne, Cologne, Germany
- 2Department of Plant Biotechnology and Bioinformatics, Ghent University, Ghent, Belgium
- 3VIB Center for Plant Systems Biology, Ghent, Belgium
- 4Max Planck Institute for Plant Breeding Research, Cologne, Germany
Plants possess the most highly compartmentalized eukaryotic cells. To coordinate their intracellular functions, plastids and the mitochondria are dependent on the flow of information to and from the nuclei, known as retrograde and anterograde signals. One mobile retrograde signaling molecule is the monophosphate 3′-phosphoadenosine 5′-phosphate (PAP), which is mainly produced from 3′-phosphoadenosine 5′-phosphosulfate (PAPS) in the cytosol and regulates the expression of a set of nuclear genes that modulate plant growth in response to biotic and abiotic stresses. The adenosine bisphosphate phosphatase enzyme SAL1 dephosphorylates PAP to AMP in plastids and the mitochondria, but can also rescue sal1 Arabidopsis phenotypes (PAP accumulation, leaf morphology, growth, etc.) when expressed in the cytosol and the nucleus. To understand better the roles of the SAL1 protein in chloroplasts, the mitochondria, nuclei, and the cytosol, we have attempted to complement the sal1 mutant by specifically cargoing the transgenic SAL1 protein to these four cell compartments. Overexpression of SAL1 protein targeted to the nucleus or the mitochondria alone, or co-targeted to chloroplasts and the mitochondria, complemented most aspects of the sal1 phenotypes. Notably, targeting SAL1 to chloroplasts or the cytosol did not effectively rescue the sal1 phenotypes as these transgenic lines accumulated very low levels of SAL1 protein despite overexpressing SAL1 mRNA, suggesting a possibly lower stability of the SAL1 protein in these compartments. The diverse transgenic SAL1 lines exhibited a range of PAP levels. The latter needs to reach certain thresholds in the cell for its impacts on different processes such as leaf growth, regulation of rosette morphology, sulfate homeostasis, and glucosinolate biosynthesis. Collectively, these findings provide an initial platform for further dissection of the role of the SAL1–PAP pathway in different cellular processes under stress conditions.
1 Introduction
Eukaryotic cells are highly organized into different compartments, such as the mitochondria, the endoplasmic reticulum, peroxisomes, and the Golgi apparatus. Additionally, plant cells possess plastids, large vacuoles, and the apoplast, each with a unique set of enzymes and functions. Chloroplasts not only perform photosynthesis but also participate in the assimilation of mineral nutrients (e.g., S, N, and P) and synthesize numerous compounds, including secondary metabolites [phenylpropanoids and glucosinolates (GSLs)], fatty acids, and amino acids (Bhardwaj et al., 2015). Mitochondria are essential for cellular respiration and contribute to the generation of reactive oxygen species (ROS) (Wang et al., 2018). The major protein complexes of chloroplasts and the mitochondria are combinations of nuclear- and organelle-encoded subunits; therefore, appropriate gene expression involves a tight coordination between the nucleus and organelles. Plastids and the mitochondria produce retrograde signals that modulate nuclear gene expression and organellar biogenesis or optimize their performance (Chi et al., 2015). Many signals in organellar retrograde pathways have been identified, including chlorophyll intermediates, ROS, and other metabolites (Chan et al., 2016; Ishiga et al., 2017; Pesaresi and Kim, 2019). For example, the SAL1–PAP retrograde signaling pathway is implicated in responses to drought and high-light stresses (Estavillo et al., 2011). The retrograde signaling molecule PAP (3′-phosphoadenosine 5′-phosphate) is generated by the sulfate assimilation pathway and degraded by SAL1 into AMP and inorganic phosphate. During stress conditions, PAP accumulates, as it can no longer be degraded by the nucleotidase/phosphatase SAL1, which becomes inactivated by oxidation (Chan et al., 2016). Transcriptome analysis has also shown that SAL1 regulates an overlapping set of genes with 3′ exoribonucleases (XRNs), suggesting that they function in a common signaling pathway (Estavillo et al., 2011).
The nuclear-encoded SAL1 belongs to a small family of six nucleotidase/phosphatase proteins in Arabidopsis thaliana, and out of these six proteins, only SAL1 contains a dual-targeting signal, which directs the protein to both the mitochondria and chloroplasts. Previous research has partly elucidated the role of SAL1 in sulfur metabolism and retrograde signaling (Lee et al., 2012; Chan et al., 2013). Several sal1 mutant alleles have been identified by genetic screens: fiery1 through an elevated abscisic acid (ABA) response (Xiong et al., 2001), alx8 was identified in a screen for the elevated expression of ASCORBATE PEROXIDASE2 at high- and low-light conditions, fou8 possesses elevated jasmonic acid (JA) levels (Rodríguez et al., 2010), and ron1 was isolated from a screen for mutants with aberrant vascular patterning (Robles et al., 2010) and has rounder leaves and altered auxin signaling. The alx8 and fry1 alleles can rescue stomatal closure in ABA-insensitive mutants, while fou8 has a high jasmonate level (Rodríguez et al., 2010), suggesting that SAL1 regulates development and stress responses via at least three of the main phytohormone signaling pathways. Consistently, Ishiga et al. (2017) have recently shown that the SAL1–PAP pathway is important for the regulation of retrograde signaling in plant immunity and that the salicylic acid (SA) and JA pathways are compromised in sal1, thereby confirming a role for the SAL1–PAP pathway in the antagonistic interaction between SA and ABA, JA and ABA, and SA and JA.
The subcellular localization of its components is important for the function of the SAL1–PAP pathway in retrograde signaling (Figure 1). As the precursor of PAP, 3′-phosphoadenosine 5′-phosphosulfate (PAPS) is mainly synthesized in chloroplasts and transported into the cytosol by PAPST1 (Gigolashvili et al., 2012) and, to a lesser extent, by PAPST2 (Tee, 2018; Ashykhmina et al., 2019), where it is used as a sulfate donor by sulfotransferases (SOTs) for various sulfation reactions. These reactions generate PAP in the cytosol, which is then transported into chloroplasts and the mitochondria for degradation by SAL1 (Estavillo et al., 2011). Unless it is transported back into organelles, PAP regulates nuclear gene expression (Dichtl et al., 1997) and inhibits SOTs in the cytosol (Rens-Domiano and Roth, 1987), thus modulating sulfur assimilation in plant cells (Lee et al., 2012; Chan et al., 2013). To modulate the concentration of PAP in the cytosol, its transport into chloroplasts and the mitochondria is mainly mediated by PAPST2 (Ashykhmina et al., 2019) and, to a lesser extent, by PAPST1 (Gigolashvili et al., 2012).
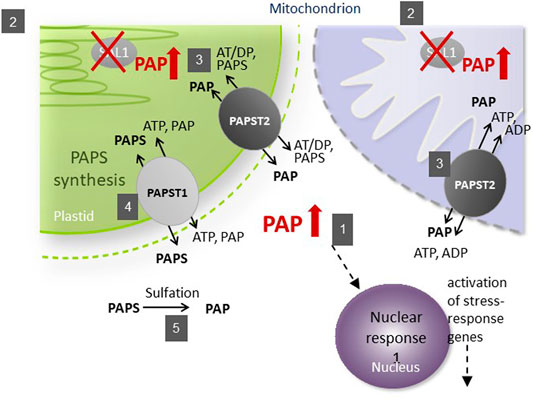
FIGURE 1. Schematic illustration of phosphoadenosine 5′-phosphate (PAP) catabolism in the sal1 mutant. The SAL1 (2) protein is localized to plastids and the mitochondria, where it regulates the intercellular PAP concentration (1). PAPST2 (3) and PAPST1 (4) import cytosolic PAP into the mitochondria and plastids. PAPST1 (4) delivers newly synthesized PAPS from the plastid to the cytosol in exchange for PAP. In the cytosol and the Golgi apparatus, PAPS consumption via sulfotransferases results in PAP release (5). A defect in SAL1 activity leads to PAP accumulation in these organelles, which decelerates PAP uptake. The resulting increase in cytosolic PAP induces nuclear responses and phenotypes recorded previously for sal1 mutants.
The dual localization of SAL1 in plastids and the mitochondria and the presence of two different PAP transporters in these compartments are indicative of distinct SAL1 functions in these two compartments. For example, studies that targeted yeast SAL1 (Sc-SAL1) to the chloroplast only (Rodríguez et al., 2010; Estavillo et al., 2011), as well as the nuclear- and cytosolic-specific expression of a truncated (missing chloroplastidic localization sequence) SAL1 construct (Kim and von Arnim 2009), complemented sal1 mutant phenotypes to different extents. Furthermore, although the papst1 mutant showed inhibited plant growth associated with lowered levels of PAPS and invariant levels of cellular PAP (Gigolashvili et al., 2012), the papst2 transfer DNA (T-DNA) and artificial microRNA (amiRNA) mutant lines displayed a larger rosette than did the wild type and moderately increased PAP levels (Ashykhmina et al., 2019). Remarkably, morphological phenotypes in the high-PAP-accumulating sal1 were partially restored to wild type in the sal1 papst1 double mutant, coincident with a lower cytosolic PAP content and a higher chloroplastic PAP level than in sal1. This is due to a decrease in PAPS transport via PAPST1 and, consequently, a reduced PAP formation in the cytosol. In contrast, sal1 papst2 showed an enhancement compared to the sal1 phenotype, with higher cytosolic and chloroplastic PAP contents than sal1.
Collectively, the above observations suggest that PAP has complex effects on plant growth, not only depending on its dosage but also on the subcellular location. This intriguing hypothesis prompted us to deconvolute the role of SAL1 in different cell compartments by systematically expressing it in chloroplasts, the mitochondria, nuclei, and the cytosol and assessing its ability to complement the morphological, physiological, and chemical phenotypes of the sal1 mutant (Ashykhmina et al., 2019).
2 Results
2.1 Generation of Chimeric Constructs to Direct SAL1 Protein Into Different Cell Compartments
To achieve the compartment-specific accumulation of SAL1 and expression of SAL1, we generated six chimeric constructs (Supplementary Figure S1). Constructs SAL1_I to SAL1_IV consisted of a truncated SAL1 (SAL1tr) backbone fused to various organellar targeting sequences. This SAL1tr backbone was previously reported to be localized to the cytosol and the nucleus and to complement the sal1 phenotype, in the absence of organellar targets (Kim and von Arnim, 2009). SAL1_I was designed to express the protein exclusively in the nucleus and contained SAL1tr fused to a nuclear localization sequence (NLS) at the C-terminus. Construct SAL1_II was created to express SAL1tr exclusively in the cytosol and was a fusion of the SAL1tr backbone to the nucleus exclusion sequence (NES) from At1g07140. This NES was necessary to avoid SAL1 localization to the nuclei, as described by Kim and von Arnim (2009). To constructs II–V, we added NES at the C-terminus of SAL1 by incorporating it into primers by PCR. Construct SAL1_III was designed to express SAL1 exclusively in plastids and consisted of SAL1tr fused to the chloroplast pre-sequence (cPS) of the Rubisco small subunit (SSU) at the N-terminus and to the NES at the C-terminus. Construct SAL1_IV aimed to express SAL1 exclusively in the mitochondria and contained SAL1tr fused to the mitochondrial pre-sequence (mPS) or transit peptide of heat shock protein 90 (Hsp90) (Krishna and Gloor, 2001) at the N-terminus and NES at the C-terminus. Construct SAL1_V encoded the native SAL1 pre-sequence and full-length SAL1 fused to the NES at the C-terminus and should target SAL1 to plastids and the mitochondria. SAL1tr, as described by Kim and von Arnim (2009), was designated SAL_VI.
To confirm the subcellular localization of SAL1 fusion proteins experimentally, we used Arabidopsis root cell suspension cultures and mesophyll protoplasts (Figure 2 and Supplementary Figure S2). Suspension cells from Arabidopsis roots were transformed with Agrobacterium carrying constructs encoding SAL1_I–VI fused to green fluorescent protein (GFP) at the C-terminus (Berger et al., 2007), and protoplasts were isolated from the mesophyll of leaves and transfected using purified plasmid DNA (Yoo et al., 2007). Fluorescence confocal microscopic analysis, shown in Figure 2 and Supplementary Figure S2, confirmed the expected localization of the transiently expressed SAL1_(I–VI):GFP fusion proteins in the designated compartments. DAPI staining of Arabidopsis root cells expressing SAL1_I-GFP and SAL1_VI-GFP (Figures 2A,F) confirmed the nuclear localization of both constructs (nuclei of cells containing both DAPI and SAL1-GFP are indicated by white arrows). The cytosolic localization of SAL1_II-GFP and SAL1_VI-GFP was observed in cells showing equal distribution of GFP in the cytosol (Figures 2B,F). Cells transfected with the SAL1-VI construct and showing SAL1-GFP in the cytosol are marked by red arrows (Figure 2F). The chloroplastidic localization of SAL1_III_GFP can be also confirmed (Figure 2C) as chlorophyll autofluorescence coincides with the GFP signal. Similarly, the mitochondrial localization of SAL1_IV (Figure 2D) was revealed by confirming the presence of the MitoTracker signal in the same structures as SAL1_IV-GFP. The GFP signal of SAL1_V was difficult to interpret as the expression level of this construct was weak (adjustments of levels were applied in Photoshop CS3). Nevertheless, the presence of SAL1_V protein in chloroplasts and in some mitochondria-like structures in the cytosol can be assumed (Figure 2E). The co-localization of SAL1_V with the MitoTracker was not successful as the GFP signal was too weak for this assay. Interestingly, the expression of SAL1_V in Arabidopsis suspension cells from roots, which lack chloroplasts (Supplementary Figure S2), showed intensive GFP staining in tiny mitochondria-like structures in the cytosol. In line with this observation Chen et al. (2011) and Estavillo et al. (2011) have previously demonstrated that when the full-length protein of SAL1 is fused to GFP (similar to the SAL1_V construct used in this work), SAL1 will be found in both chloroplasts and mitochondria. The only difference in the SAL1_V construct used in this work from that used by Chen et al. (2011) and Estavillo et al. (2011) is that our construct contained NES. However, as NES did not lead to mislocalization of constructs SAL1_II, SAL1_III, and SAL1_IV, the potential mislocalization of SAL1_V-GFP is less probable.
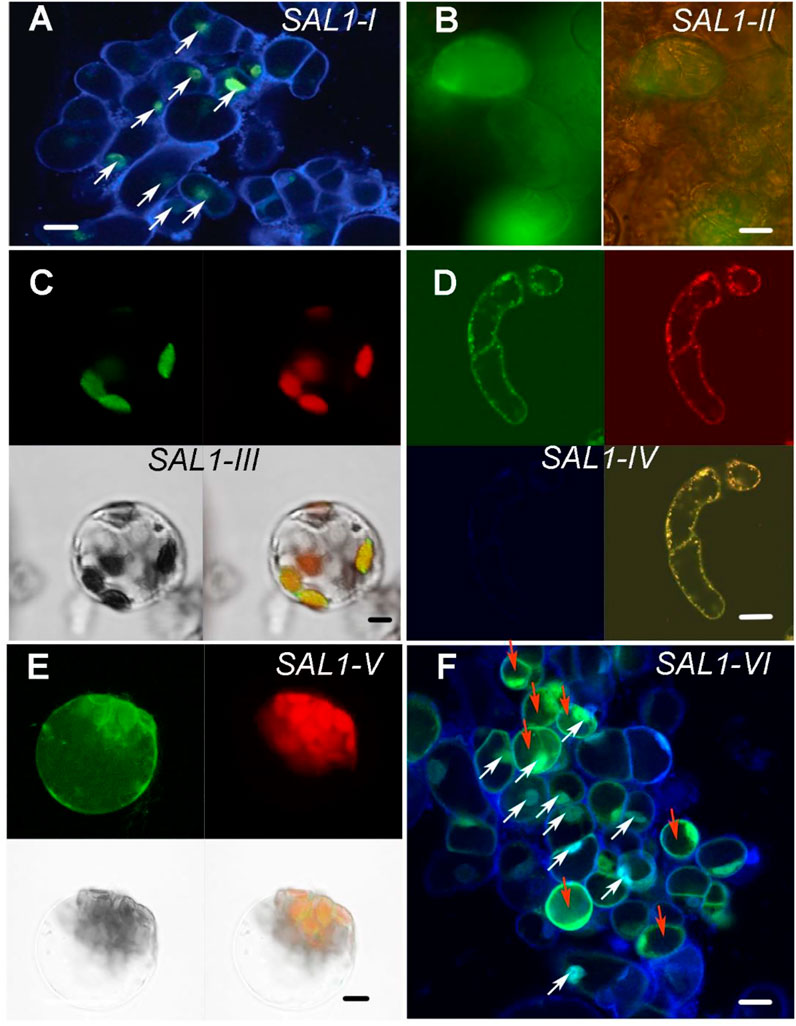
FIGURE 2. Subcellular localization of SAL1_I–SAL1_VI proteins in Arabidopsis root cell suspension cultures, protoplasts from the mesophyll, and in Nicotiana benthamiana. Transient expression of SAL1 protein chimeras fused to green fluorescent protein (GFP) under control of the 35S CaMV promoter in various subcellular compartments of cells from Arabidopsis root cell suspension culture, as revealed by confocal fluorescence microscopy. (A) DAPI-stained Arabidopsis suspension cells form roots showing the nuclear localization of SAL1_I:GFP. White arrows show cells in which both GFP and DAPI are visible in the nuclei. Bar = 20 μm. (B) Cytosolic localization of SAL1_II:GFP shown with GFP filter and bright field and GFP. Bar = 40 μm. (C) Chloroplastic localization of SAL1_III:GFP in Arabidopsis protoplasts form the mesophyll four fields with GFP, chlorophyll autofluorescence, bright field, and overlay of GFP and chlorophyll signals. Bar = 10 μm. (D) Mitochondrial localization of SAL1_IV:GFP in Arabidopsis suspension cells form roots four fields with GFP, MitoTracer in red, DAPI staining, and overlay of both MitoTracker with GFP. Bar = 20 μm. (E) SAL1_V:GFP localization in Arabidopsis protoplasts form the mesophyll. It shows the presence of SAL1 in chloroplasts and in some tiny dot-like structures in the cytosol, which can be the mitochondria. Four fields show GFP, chlorophyll autofluorescence, bright field, and overlay of GFP and chlorophyll signals. Bar = 10 μm. (F) DAPI-stained Arabidopsis suspension cells form roots, showing both the cytosolic and nuclear localization of GFP. White arrows show cells in which both GFP and DAPI are visible in the nuclei. Red arrows show cells in which GFP is visible in the cytosol. Bars = 20 μm.
2.2 Selection of Partly and Fully Complemented Transgenic Mutant Lines With Varying SAL1 Expression Levels
To study the function of SAL1 in different cell compartments in planta, sal1 mutant plants were transformed with the respective SAL1 chimeric constructs. We selected independent transgenic lines that showed varying SAL1 transcript levels and that were either marginally, moderately, or fully complemented in terms of the overall rosette morphology (Figure 3). We isolated 77 independent transgenic lines for each of SAL1_I, SAL1_III, and SAL1_IV, 40 lines for SAL1_V, and 12 lines for each of SAL1_II and SAL1_VI. Although we repeated the transformation process several times, we were not able to significantly increase the number of transgenic lines for constructs SAL1_II and SAL1_VI, indicating that SAL1 localization in the cytosol was probably not indiscriminate for the survival of transgenic plants. We then selected six to nine lines for each construct, which showed different levels of complementation. These lines were first compared to wild type and sal1 in their visual appearance of rosette morphology, SAL1 mRNA levels, shoot fresh weight (biomass) of fully developed 5-week-old adult plants, and PAP levels (Figures 3–5).
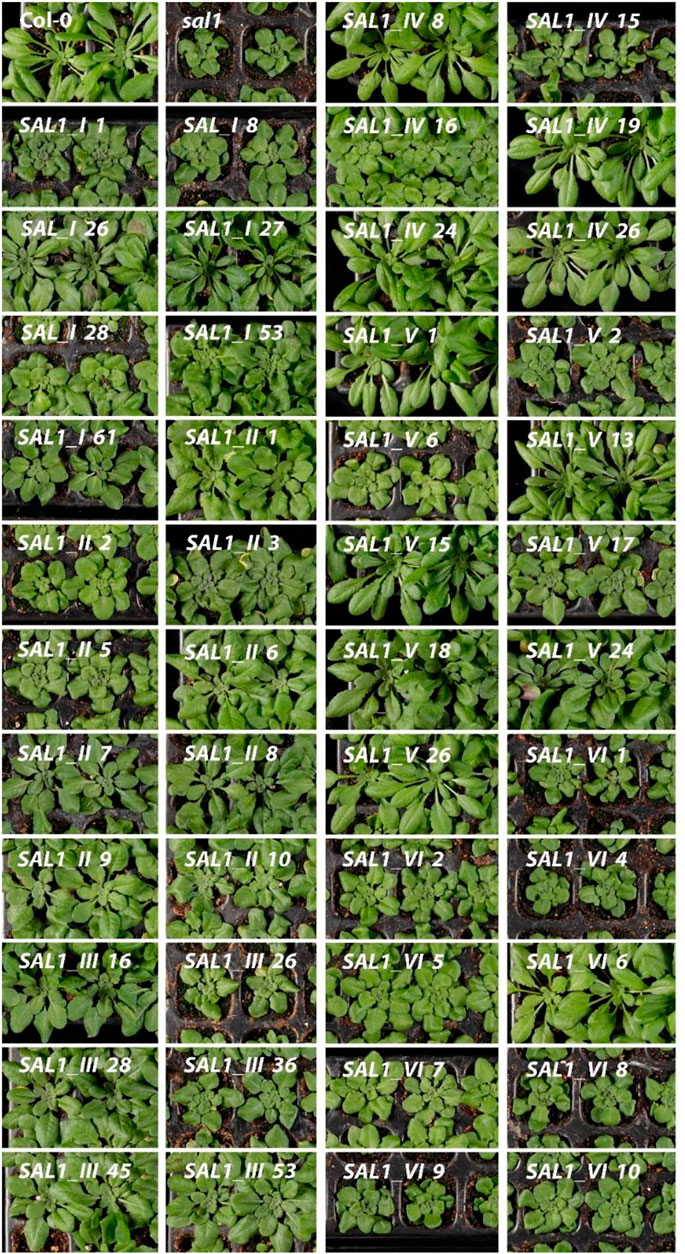
FIGURE 3. Morphological phenotypes of plants expressing SAL1 chimeric constructs in different cell compartments. Plants were grown for 5 weeks on soil in short days in a controlled environment chamber. Bar = 2 cm. SAL1_I, nuclear localization; SAL1_II, cytosolic localization; SAL1_III, chloroplastic localization; SAL1_IV, mitochondrial localization; SAL1_V, chloroplastic and mitochondrial localization; and SAL1_VI, nuclear and cytosolic localization, which served as a positive control for the complementation (Kim and von Arnim, 2009).
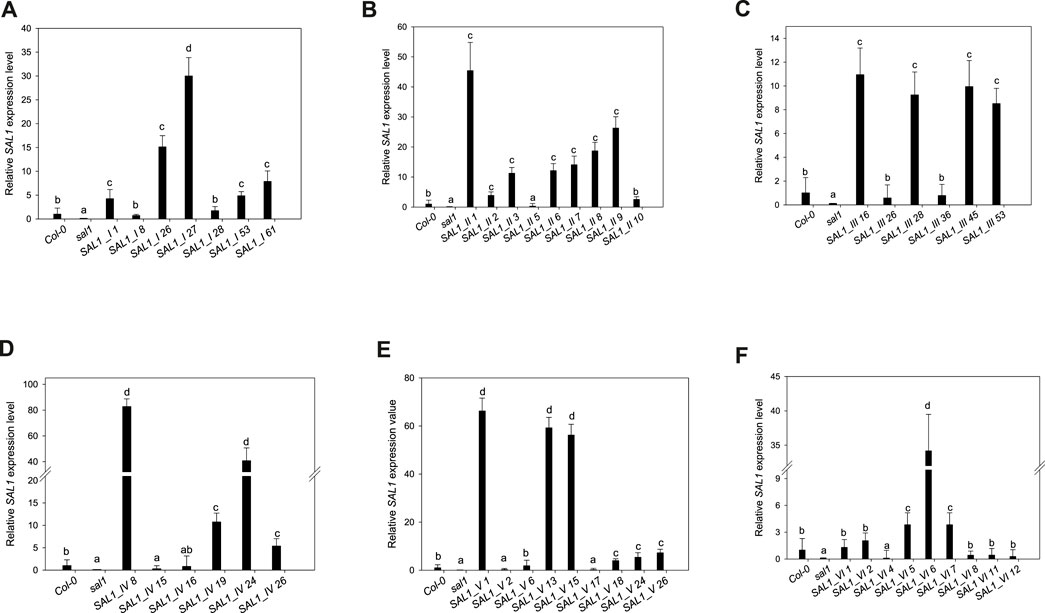
FIGURE 4. Expression levels of SAL1 in different transgenic lines. Plants were grown for 5 weeks on soil in short days in a controlled environment chamber, mRNA was isolated, and the expression of SAL1 analyzed. SAL1 expression levels for SAL1_I (nuclear localization) (A), SAL1_II (cytosolic localization) (B), SAL1_III (chloroplastic localization) (C), SAL1_IV (mitochondrial localization) (D), (E) SAL1_V (chloroplastic and mitochondrial localization) (E), and SAL1_VI (nuclear and cytosolic localization) (F). These SAL1 expression data show the mean ± SE from two independent experiments with five biological replicates in each (n = 10). Relative expression values were normalized to Actin2 and compared with the expression level in wild-type plants (Col-0 = 1). Different letters indicate significant differences among means based on t-tests at p < 0.05.
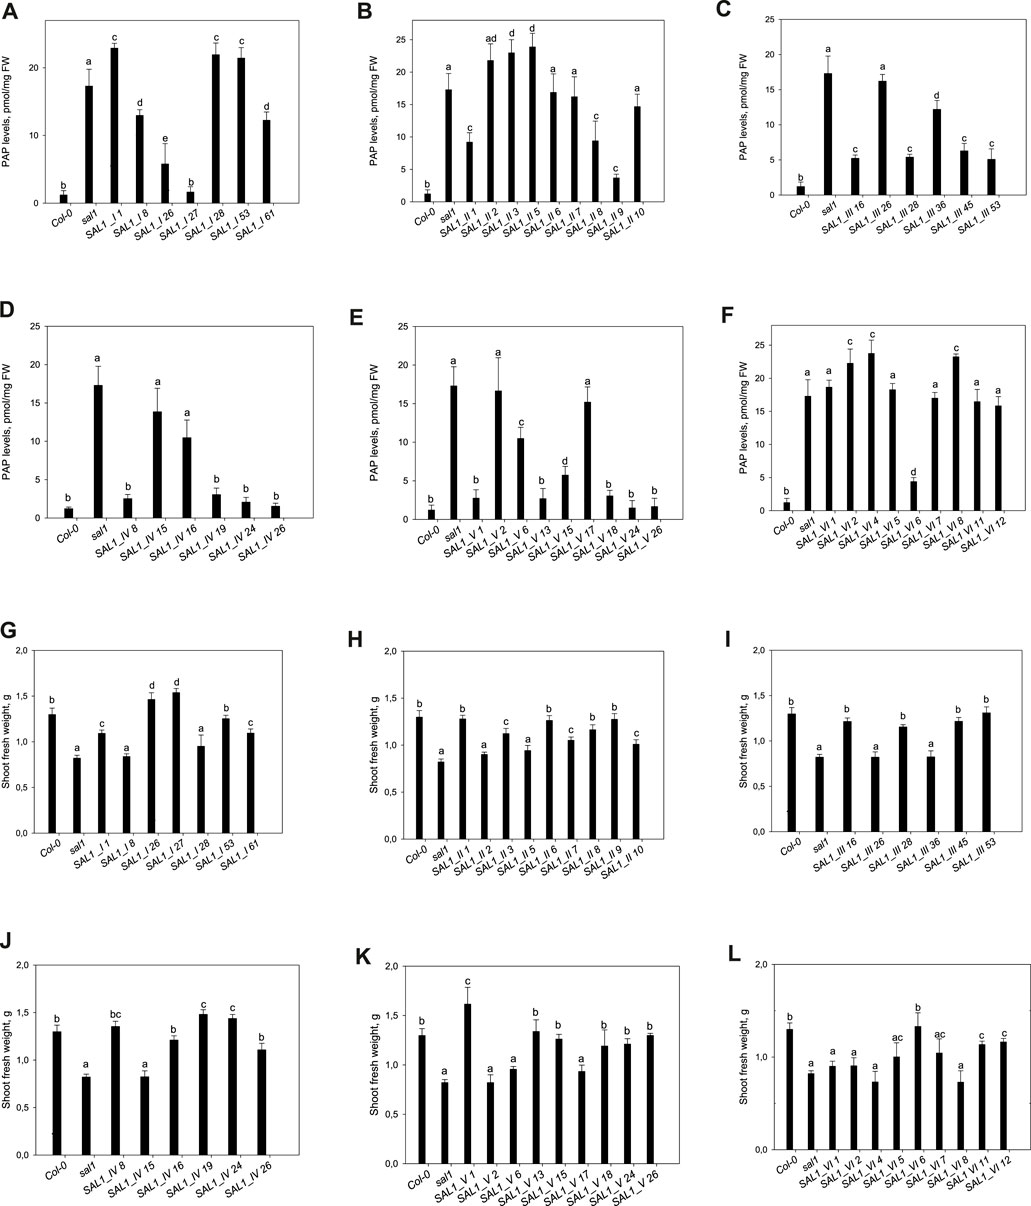
FIGURE 5. Phosphoadenosine 5′-phosphate (PAP) levels and shoot fresh weight in sal1 mutants with the directed expression of SAL1 to various cell compartments. (A–F) PAP levels in rosette leaves of 5-week-old SAL1 and stably transformed sal1 transgenic plants overexpressing SAL1 chimeric proteins. (A) SAL1_I (nuclear localization). (B) SAL1_II (cytosolic localization). (C) SAL1_III (chloroplastic localization). (D) SAL1_IV (mitochondrial localization). (E) SAL1_V (chloroplastic and mitochondrial localization). (F) SAL1_VI (nuclear and cytosolic localization). Plants were grown on soil in short days in a controlled environment chamber. Data show the mean ± SD (n = 3). FW, fresh weight. Different letters indicate significant differences among means based on t-tests at p < 0.05. (G–L) Shoot fresh weight of sal1 mutants complemented with SAL1 expressed in different cell compartments. Shoot fresh weight of wild-type, sal1, and stably transformed sal1 transgenic plants overexpressing SAL1 chimeric proteins. (G) SAL1_I (nuclear localization). (H) SAL1_II (cytosolic localization). (I) SAL1_III (chloroplastic localization). (J) SAL1_IV (mitochondrial localization). (K) SAL1_V (chloroplastic and mitochondrial localization). (L) SAL1_VI (nuclear and cytosolic localization). Plants were grown for 4 weeks on MS agar plated under short-day conditions in an environment-controlled chamber. Data show the mean ± SD (n = 9). Different letters indicate significant differences among means based on t-tests at p < 0.05.
2.3 Complementation of PAP Levels and Biomass Following SAL1 Expression in Different Compartments
2.3.1 Nucleus
Seven independent lines with varying SAL1 expression levels were analyzed in detail and are presented here. The extent to which the different sal1 phenotypes were complemented correlated well with the degree of nuclear-targeted SAL1 transcript levels. SAL1_I lines 26 and 27 showed the highest SAL1 mRNA levels at 15- to 30-fold that of the wild type (Figure 4A). Adult plants of these lines were fully complemented in terms of rosette morphology, showed higher biomass than did the wild type, and had PAP levels that were either similar to those of the wild type or significantly decreased compared to those of sal1 (Figures 4A, 5A,G). The SAL1_I lines 1, 53, and 61 with moderate SAL1 overexpression (five to eight fold higher than that of the wild type) only showed partial complementation in rosette morphology, biomass, and PAP levels, whereas lines 8 and 28 with wild-type levels of SAL1 expression only partially complemented leaf shape, but not biomass or PAP (Figures 4A, 5A,G).
2.3.2 Cytosol
Following the localization of SAL1 to the cytosol by construct SAL1_II, we obtained 12 independent transgenic lines with a stable phenotype. We analyzed nine lines that showed varying levels of SAL1 expression in detail. All lines showed only partial complementation and a disconnect between their growth/development phenotypes and PAP levels, despite high the SAL1 expression level in several transgenic lines (SAL1_II 1, 3, 6, 7, 8, and 9) (Figures 4B, 5B,H). For instance, biomass was complemented to Col-0 levels in three out of nine lines (SAL1_II 1, 8, and 9) (Figure 5H), but both the PAP levels and morphological phenotype of these lines were intermediate between that of Col-0 and sal1 (Figures 4B, 5B). Similarly, SAL1_II lines 3 and 7 showed partially complemented biomass (Figure 5H) despite accumulating similar or higher levels of PAP compared to sal1 (Figure 5B). SAL1_II lines 2, 3, and 5 accumulated higher levels of PAP than did sal1 and largely failed to restore biomass and rosette morphology (Figures 4B, 5H). This observation was similar to that for the SAL1-I construct (SAL1-I lines 1, 28, and 53). Finally, the cytosolic expression of SAL1 at levels similar to those of the wild type (in lines 2 and 10) (Figure 4B) was not sufficient to complement the biomass phenotype (Figure 5H) or the high PAP levels (Figure 5B) of sal1.
2.3.3 Chloroplast
Surprisingly, the transformation of sal1 by construct SAL1_III (targeting of SAL1 to the chloroplast) only led to partial complementation across lines with different SAL1 expression levels (Figure 4C). Multiple lines such as SAL1_III 16, 28, 45, and 53 showed full complementation of biomass, but not other parameters (Figures 3, 5C,I). Despite having comparable shoot fresh weight to that of wild-type plants (Figure 5I), the PAP levels in these lines were only partially decreased (Figure 5C) (from 17 to 5 pmol/mg) compared to those in sal1, and their rosette morphology was intermediate between that of Col-0 and sal1. As expected, two lines (SAL1_III line 26 and SAL1_III line 36) with only moderately decreased PAP contents showed no complementation of biomass and rosette morphology (Figures 3, 5C,I).
2.3.4 Mitochondria
Complementation of sal1 by construct SAL1_IV (targeted expression of SAL1 to the mitochondria) was extremely effective. Sixty-five out of 77 independent transgenic lines (85%) were fully complemented (data not shown). Here, we show six representative lines (Figures 4D, 5D,J) to illustrate the range of complementation observed. Lines SAL1_IV 8, 19, 24, and 26 had fully complemented PAP levels, whereas line SAL1_IV 16 showed partial complementation and SAL1_IV line 15, which had lower SAL1 transcript levels than the wild type, was not complemented. The extent to which the PAP levels and rosette morphology were complemented correlated well with the PAP levels of these lines (Figures 3, 5D).
2.3.5 Chloroplasts and Mitochondria
Complementation of sal1 by construct SAL1_V (SAL1 targeted to the mitochondria and chloroplasts) was functionally effective, as expected. Here, we present the data for nine representative independent transgenic lines with a range of phenotypes (Figures 4E, 5E,K). Six of these lines (SAL1_V 1, 13, 15, 18, 24, and 26) showed wild-type phenotypes, including leaf blade shape (Figure 3), PAP levels (Figure 5E), and biomass (Figure 5K). Nevertheless, line SAL1-V 6, which had a comparable SAL1 expression level to that of the wild type, was phenotypically similar to sal1 in terms of biomass and rosette morphology, although the PAP level was moderately but significantly decreased. Only lines SAL1_V 2 and SAL1_V 17 were not complemented, presumably due to their very low SAL1 expression (Figure 4E).
2.3.6 Cytosol and Nucleus
Following transformation with SAL1_VI, which served as a positive control for complementation (Kim and von Arnim, 2009), we obtained 12 independent transgenic lines with a stable phenotype and analyzed nine representative lines in detail (Figures 3, 4F, 5F,L). Only one line (SAL1_VI 6) was complemented in terms of leaf morphology and growth (Figure 4) and shoot fresh weight (Figure 5L), with its PAP level almost restored to that of the wild type (Figure 5F). The remaining eight lines all had similar or significantly higher PAP levels compared to sal1 and showed limited complementation in terms of rosette morphology and biomass (Figures 3, 4L). We did not expect to find only 1 out of 12 lines to be complemented or to show a wild-type phenotype because this construct was previously reported to be able to complement sal1 (Kim and von Arnim, 2009). Thus, complementation of sal1 by co-targeting SAL1 to the nucleus and the cytosol is possible in principle, but is not a guaranteed outcome (see Section 3).
2.4 The Sulfur Assimilation Pathway and Accumulation of Secondary Sulfated Compounds in Selected SAL1 Complemented Lines
Loss of SAL1 function results in low total sulfate levels, a decreased accumulation of GSLs, an increased level of desulfo-precursors, and a decreased level of thiols (Lee et al., 2012). Furthermore, sulfur assimilation in sal1 mutants was not only affected at the metabolic level, but the transcript profile of genes was similar to that of sulfate-starved plants (Lee et al., 2012). Therefore, in addition to the general processes related to growth and stress response, the nutritional status was also impaired in sal1 plants. To address the role of the compartmentalization of SAL1 in sulfur assimilation, we selected the best-complemented transgenic lines, SAL1_I 26, SAL1_II 1, SAL1_III 53, SAL1_IV 8, SAL1_V 13, and SAL1_VI 6 (Figures 4, 5), and analyzed their sulfur metabolite profiles (Figure 6). The accumulation of sulfur metabolites in phenotypically weakly complemented lines is shown in Supplementary Figure S3.

FIGURE 6. Analysis of sulfate, desulfo-glucosinolate (GSL), and aliphatic and indolic GSL levels in complemented sal1 mutant lines. The levels of sulfate (A), desulfo-GSL (B), indolic GSL (C), and aliphatic GSL (D) were analyzed in rosette leaves of 5-week-old sal1 and complemented lines SAL1_I 26, SAL1_II 1, SAL1_III 53, SAL1_IV 8, SAL1_V 13, and SAL1_VI 6. Sulfur metabolites of partially complemented lines are shown in Supplementary Figure S3. Plants were grown on soil in short days in an environment-controlled chamber. Data show the mean ± SD (n = 4). FW, fresh weight. Different letters indicate significant differences among means based on t-tests at p < 0.05.
The sulfate content in the selected lines revealed that SAL1 can rescue the low-sulfate phenotype of sal1 in all compartments, even when it is expressed in the cytosol or the nucleus alone (Figure 6A). However, in weakly expressing lines, complementation of low sulfate levels only occurred when SAL1 was expressed in the nucleus, mitochondria, or chloroplasts, but not when SAL1 was present in the cytosol (constructs II and VI) (Supplementary Figure S3).
As sulfate is required for the sulfation of GSLs, we additionally measured the accumulation of indolic (IG) and aliphatic (AG) GSLs and their desulfo-precursors. The desulfo-GSLs (ds-GSLs), which accumulate to high levels in sal1, were fully complemented by SAL1 expression in the nucleus, mitochondria, and by the native SAL1 construct. However, the cytosolic and chloroplastic expression of SAL1 only led to a 50% decrease in the accumulation of ds-GSL, which could not restore the wild-type level of ds-GSL (Figure 6B). In contrast to ds-GSLs, we observed less phenotypic variation among the SAL1-expressing lines for AGs and IGs. The production of AGs was fully complemented in all lines, with the exception of line VI in which the low AG level only slightly increased (Figure 6D). Conversely, the production of IGs was fully complemented only when SAL1 was targeted to the mitochondria (Figure 6C).
2.5 Phenotypic Comparison of Complementation Efficiency by SAL1 in Different Subcellular Compartments
We further characterized the best-complemented lines in Figure 6 by quantifying their leaf phenotypes in more detail. We did comparative analysis of the following transgenic lines: 1) plants expressing SAL1 in the compartments in which PAP is proposed to act (nucleus, cytosol, or both) compared to the wild type and 2) plants expressing SAL1 in a single organelle (chloroplast or the mitochondria) compared to both organelles where SAL1 is normally found (wild type). Targeting SAL1 to both the cytosol and the nucleus (SAL1_VI_6) showed an additive effect compared to either the nucleus (SAL1_I 26) or the cytosol (SAL1_II_1) alone in restoring leaf area to wild-type levels (Figures 6, 7). In contrast, SAL1 in either the cytosol or the nucleus alone was similarly effective as SAL1 in both the cytosol and the nucleus in rescuing rosette compactness (Figure 7). In the second set of comparisons, targeting SAL1 to chloroplasts alone (SAL1_III 53) only partially rescued leaf area and rosette compactness. Similarly, targeting SAL1 to the mitochondria (SAL1_IV) did not completely restore leaf area, although it rescued rosette compactness to wild-type levels (Figure 7). Taken together, these results suggest that PAP most likely exerts its effects in both the cytosol and the nucleus, albeit unequally, and that the presence of SAL1 in both chloroplasts and the mitochondria is required for PAP homeostasis.
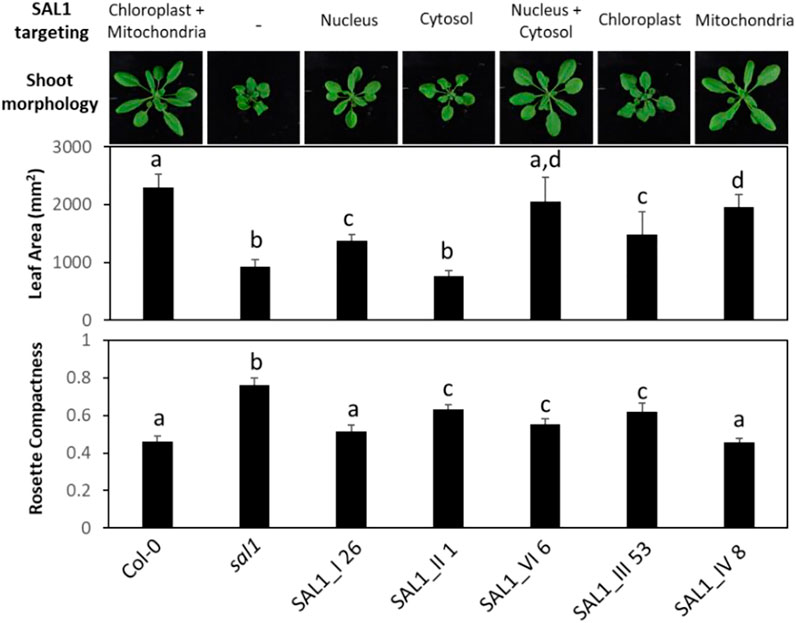
FIGURE 7. Shoot morphology, leaf area, and rosette compactness in best-complemented sal1 mutant lines expressing SAL1 in different subcellular compartments. Morphological phenotypes were analyzed in rosette leaves of 25-day-old soil-grown plants. The entire aboveground rosette was excised and photographed under standardized lighting conditions, then the image analyzed using ImageJ to quantify the leaf area and rosette compactness. Data show the mean ± SD (n = 5). Different letters indicate significant differences among means based on one-way ANOVA and Tukey’s honestly significant difference (HSD) post-hoc test at p < 0.05. Note that line V_13 was not analyzed here due to the impaired germination and growth of the seeds after prolonged storage between the initial characterization (Figures 2–6) and this analysis. Furthermore, given that V_13 utilizes the native SAL1 targeting sequence (Figure 1), in our view, V_13 should be functionally similar to the wild-type control. Thus, the wild type and constructs III and IV are sufficient for comparing SAL1 targeting to the chloroplasts, mitochondria, or both organelles.
2.6 Re-Evaluating Complementation Efficiency by SAL1 in the Context of SAL1 mRNA and Protein Levels In Vivo
The unequal complementation obtained with the different constructs (Figures 3–7) was striking and unexpected, given that SAL1 was driven by a strong promoter that, in theory, should drive overexpression in all constructs. Therefore, we first examined for any possible relationship between the different phenotypes and SAL1 mRNA levels in lines of the different constructs. SAL1 overexpression at 5- to 10-fold of the wild-type levels was sufficient to completely restore the PAP levels in SAL1_IV 26, but not in lines of the other constructs such as SAL1_I 53, SAL1_II 2, SAL1_III 53, and SAL1_VI 5 (Figures 4, 5). Similarly, SAL1 expression at levels comparable to those of wild-type Col-0 restored plant biomass and significantly decreased the PAP levels only in construct IV, but not in lines of the other constructs (Figures 4, 5).
To address the possibility that the mRNA levels of transgenic SAL1 are uncoupled from the protein levels of SAL1 in the different constructs, we first compared selected lines with similar SAL1 mRNA expression levels (∼10-fold higher than that of Col-0) irrespective of their targeting. The different constructs showed significantly different degrees of leaf complementation despite their similar levels of SAL1 mRNA (Figure 8). Interestingly, the variance in leaf phenotype complementation appeared linked to substantial variation in the protein levels of SAL1, with the Western blot of lines SAL1_III 16 and 28 in particular showing much weaker SAL1 protein bands compared to SAL1_II 3 and SAL1_VI 6 (Figure 9B). This was further confirmed by comparing the protein and mRNA levels of SAL1 in the best-complemented lines of each construct regardless of their SAL1 mRNA levels (Figure 9A). Although the SAL1_I 26, III 53, and VI 6 lines all expressed SAL1 mRNA at 10- to 15-fold that of the wild type, their SAL1 protein levels varied substantially, with III 53 showing very low SAL1 protein abundance. SAL1_II 1 had similar SAL1 protein abundance to III 53 despite overexpressing SAL1 mRNA to a greater extent (40- vs. 10-fold, respectively). Similarly, SAL1_V 13 accumulated substantially more SAL1 protein than SAL1 IV 8 despite overexpressing SAL1 mRNA to a lesser degree (60 vs. 80-fold). Therefore, instead of SAL1 mRNA being the primary determinant of complementation, targeting SAL1 to different subcellular compartments may lead to different levels of the SAL1 protein in vivo through unknown mechanism(s), thus causing unequal complementation.
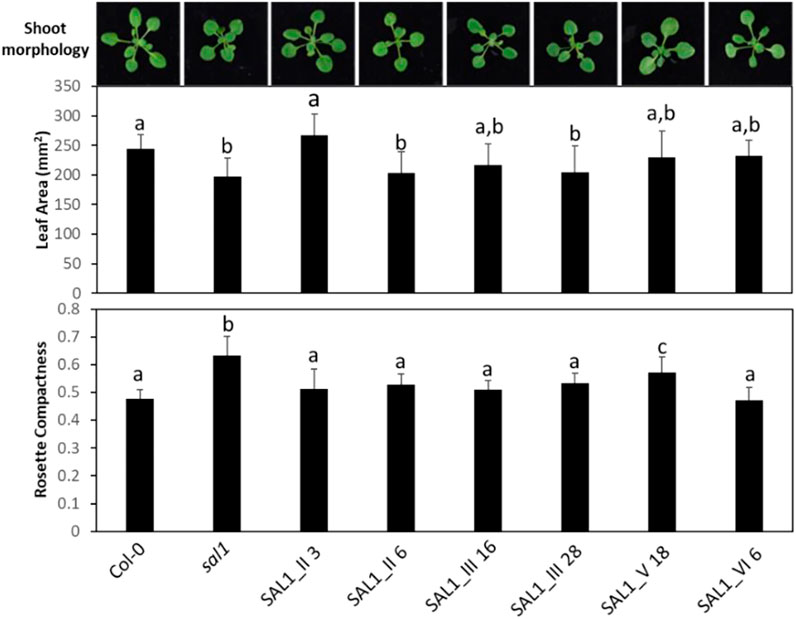
FIGURE 8. Shoot morphology, leaf area, and rosette compactness in complemented sal1 mutant lines expressing SAL1 mRNA at similar levels. Morphological phenotypes were analyzed in rosette leaves of 25-day-old soil-grown plants. The entire aboveground rosette was excised and photographed under standardized lighting conditions, then the image analyzed using ImageJ to quantify the leaf area and rosette compactness. All lines shown here have SAL1 mRNA overexpressed at ∼10-fold the levels of Col-0. Data show the mean ± SD (n = 5). Different letters indicate significant differences among means based on one-way ANOVA and Tukey’s honestly significant difference (HSD) post-hoc test at p < 0.05. Note that, similar to Figure 7, there was either complete or serious loss in germination rate and/or seedling growth in lines of interest, which were not seen in earlier experiments (e.g., lines I_61, IV_19, IV_26, and V_13). We decided to omit representatives from certain lines (e.g., construct IV) because no other representative within that construct had similar SAL1 mRNA expression to the rest of the constructs. However, we attempted to compensate for this deficiency by studying two representatives of certain constructs (II and III), in cases where they have similar SAL1 mRNA expression to the rest of the constructs.
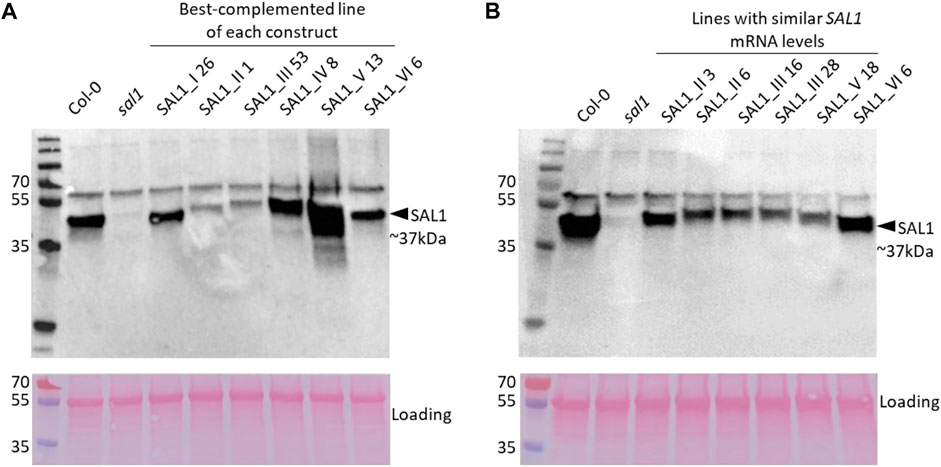
FIGURE 9. SAL1 protein levels in best-complemented sal1 lines expressing SAL1 in different subcellular compartments and in complemented sal1 lines expressing similar SAL1 mRNA levels. SAL1 protein levels were analyzed in total protein extracts of 25-day-old rosette leaves from the best-complemented line of sal1 expressing the different constructs I–VI (A) and diverse complemented sal1 lines with similar SAL1 mRNA levels (∼10-fold overexpression compared to Col-0) (B). Immunoblotting was performed with an anti-SAL1 antibody and a horseradish peroxidase (HRP)-conjugated secondary antibody against 20 µg total protein per sample. The SAL1 protein was detected at approximately 37 kDa, with no SAL1 protein in the sal1 mutant sample, as expected. A higher band at 55 kDa is most likely the result of nonspecific antibody binding to Rubisco (upper panels). The blots were subsequently stained with Ponceau S and re-imaged to evaluate equal loading between samples (lower panels). In both (A) and (B), the upper and lower panels were generated from the same blot that was independently imaged twice after incubation with HRP chemiluminescence substrate and Ponceau S, respectively.
3 Discussion
The accumulation of PAP differs in different subcellular compartments due to the activities of SAL1. Based on current knowledge concerning the SAL1–PAP pathway and taking all phenotypes reported for sal1 mutants into consideration, we hypothesized that PAP can act in different compartments, where PAP signaling can potentially execute different functions (Phua et al., 2018). These intriguing scenarios prompted us to design experiments addressing the role of SAL1 in different cell compartments by expressing it in chloroplasts, the mitochondria, the nucleus, and the cytosol. This set of experiments aimed to compare the ability of SAL1 expressed in different compartments to complement the morphological, physiological, and chemical phenotypes of sal1, thereby revealing initial hints on how PAP might differentially affect multiple growth- and sulfur metabolism-related phenotypes.
Our results indicated that SAL1 expression in the nucleus (construct I) was sufficient to complement the sal1 phenotypes (Figures 4–7). This finding, which is consistent with previous observations by Kim and von Arnim (2009), pointed that: 1) PAP is present in the nucleus due to diffusion from the cytosol and that 2) modulating nuclear the PAP levels can revert the phenotype of sal1 to that of the wild type. This finding is also consistent with the localization of two known PAP targets, XRN2 and XRN3, in the nucleus. PAP inhibits the 5′–3′ exoribonuclease activity of the XRN proteins, most likely by binding to the active site of XRNs (Nagarajan et al., 2013), as suggested by in vitro assays and the protein crystallography of PAP-inhibited exoribonucleases (Yun et al., 2018). In contrast, the high mRNA level of cytosol-targeted SAL1 did not fully complement sal1 with respect to leaf shape, PAP level, plant biomass, and GLs (SAL1_II lines; Figures 4–6). This is counterintuitive because PAP is generated in the cytosol and, therefore, the cytosolic expression of SAL1 was predicted to directly detoxify PAP without the requirement for PAP transport into organelles or its diffusion into the nucleus. Similarly, targeting SAL1 to the chloroplast, which is one of the organelles in which SAL1 is normally located in wild-type plants, should have enabled efficient complementation of sal1 phenotypes. These discrepancies can be explained by the low levels of transgenic SAL1 protein when expressed exclusively in the cytosol or in the chloroplast (Figure 9). It is also possible that the introduction of a NES or the Rubisco SSU targeting peptide to the SAL1 sequences in SAL1_II and SAL1_III lines, respectively, could have negatively impacted its protein folding or structure since even relatively few (one to four) codon changes to the SAL1 sequence are sufficient to decrease its protein abundance in Arabidopsis (Wilson et al., 2009) and Escherichia coli (Chan et al., 2016). Interestingly, in an experiment aiming at the subcellular localization of native SAL1_V_GFP, we also observed low levels of the GFP protein, which can be caused by both GFP and NES. Although the NES was also present in SAL1 sequences of the well-complemented SAL1_IV 8 and SAL1_V 13 lines, these two lines had among the highest levels of SAL1 mRNA overexpression across all the lines tested, which could have partially compensated for the decreased protein stability.
As demonstrated by line SAL1_IV 8, all secondary sulfate metabolism metabolites, including sulfate, ds-GSL, and aliphatic and indolic GSLs, were also fully restored to wild-type levels (Figure 6). Notably, sulfur assimilation (Supplementary Figure S3) was highly stimulated by the mitochondrial expression of SAL1. Aliphatic and indolic GSLs reached levels significantly higher than those in the wild type (Figures 6C, D). Taken together, these observations confirmed the transport of PAP into the mitochondria for degradation by SAL1, which was previously only inferred based on the localization data for SAL1 and the PAPS/PAP transporter PAPST2 (Estavillo et al., 2011; Ashykhmina et al., 2019). Nevertheless, PAP degradation by SAL1 in both chloroplasts and the mitochondria may still be required for complete regulation of PAP-mediated signaling since the leaf area was still significantly, albeit only slightly, lower in SAL1_IV 8 compared to the wild type (Figure 9).
When comparing the PAP levels, leaf area, and rosette compactness between the different lines (Figures 5, 7), it appears that the same level of PAP may exert different impacts on individual growth phenotypes. A moderately elevated PAP level compared to that of the wild-type was sufficient to suppress the altered leaf area, but not rosette compactness (e.g., SAL1_V 13 and SAL1_VI 6), whereas higher PAP levels that were intermediate between the wild type and sal1 also had an impact on rosette morphology (SAL1_II 1 and SAL1_III 53). Similarly, the lines SAL1_II 6, SAL1_III 16, and SAL1_III 28, all of which have similar PAP contents, have suppressed leaf area like sal1, but have wild type-like rosette compactness. Notably, rosette compactness is highly influenced by petiole length (Vanhaeren et al., 2015), which is regulated by light signaling components such as PhyB that are also influenced by PAP accumulation (Kim and von Arnim, 2009). Leaf area is a function of cell size and number, which in turn are regulated by several complex factors such as cell expansion, cell wall composition, and the cell cycle (Gonzalez et al., 2012). How PAP signaling influences these processes is still not clear. Given that a small increase in cytosolic PAP levels, as observed here for the SAL1_IV lines or in the papst2 mutant (Ashykhmina et al., 2019), actually enhances plant growth while further PAP elevations suppress growth, it may be that at least one of the parameters governing cell growth and replication is highly tuned to fluctuations in the intracellular PAP levels.
Similarly, the production of indolic GSLs seemed more sensitive to PAP accumulation than that of aliphatic GSLs. Both SAL1_II 1 and SAL1_III 53 had only partially complemented ds-GSLs and indolic GSLs, yet exhibited complete complementation of aliphatic GSLs. Given that SOT16 highly prefers indolic ds-GSLs whereas SOT18 prefers aliphatic ds-GSLs in vitro (Klein and Papenbrock, 2009), it is possible that PAP exerted a stronger inhibitory effect on SOT16 than on SOT18 in vivo. The inhibition kinetics of PAP have only been determined for SOT18 so far (Hirschmann et al., 2017). Alternatively, it may be that the effect of PAP on indolic GSLs was more pronounced due to their greater abundance in vivo compared to aliphatic GSLs (Figure 6).
All of the best-complemented lines from each construct showed complete recovery of the sulfate levels. This suggests that the regulation of total sulfate is relatively insensitive to PAP accumulation until a very high threshold is reached, as shown by SAL1_II 1, which had wild-type sulfate content despite accumulating 50% of the PAP levels in sal1 (Figures 5, 6). Recently, it has been shown that GSLs serve as a sulfate reservoir and can be catabolized to release free sulfate (Sugiyama et al., 2021), so it is tempting to speculate that a high PAP may affect the sulfate levels at least partly via GSLs. It is also possible that PAP affects sulfate by modulating sulfate transport since the expressions of some sulfate transporters were affected in fry1-6 (Estavillo et al., 2011).
Collectively, our results indicate that the role of the SAL1–PAP pathway in different cell compartments, environmental conditions, and signaling pathways is likely to be more complex than previously assumed. Understanding how PAP exerts differential effects on diverse processes, such as leaf morphology, growth, and sulfur metabolism, as we have shown here, could be the key to unraveling its role in the integration of retrograde, light, and hormonal signaling (Rodríguez et al., 2010; Estavillo et al., 2011; Ishiga et al., 2017; Phua et al., 2018), as well as in nutrient (Hirsch et al., 2011; Lee et al., 2012) and pathogen signaling (Ishiga et al., 2017).
4 Materials and Methods
4.1 Plant Material and Growth Conditions
Seeds of A. thaliana ecotype Col-0, the T-DNA insertion mutant, and complemented transgenic plants were sown on soil or culture plates containing 1/2 Murashige and Skoog medium. The seeds were stratified for 2–3 days in the dark, and the plants were cultivated under short-day (8-h light and 16-h dark) conditions with an average photon flux density of 100–150 μmol m−2 s−1. White light was provided by Fluora L58W/77 fluorescent tubes. The temperature was kept at 22°C during the light period and 18°C during the dark period. The relative humidity was ∼40%.
4.2 Isolation of sal1 Mutant
The homozygous mutant sal1 line (At5g63980, SALK_020882, and SALK_005741) was identified and the insertion position of the T-DNA in the target gene was confirmed by sequencing previously (Ashykhmina et al., 2019). In this manuscript, we present data on the analysis and complementation of SALK_020882 line, named here also as sal1.
4.3 Cloning of Chimeric SAL1 Constructs
To achieve the compartment-specific accumulation of SAL1, we generated six chimeric constructs, as shown in Supplementary Figure S1. The SAL1tr backbone was amplified from Arabidopsis cDNA and fused with different DNA pieces using fusion PCR, as described in Section 2.
In our cloning procedure, all six constructs were inserted into the entry pDONOR207 vector. pDONOR207 vectors containing six different SAL1s were recombined with either the binary vector pGWB5 (for GFP localization studies) or pGWB2 (for the complementation of sal1) under the control of the 35S cauliflower mosaic virus promoter. All constructs of interest were transformed into Arabidopsis mesophyll protoplasts or root suspension cells.
4.4 GFP-Based Subcellular Localization of SAL1 Proteins in Arabidopsis Protoplasts and in Arabidopsis Suspension Cell Culture From Roots
To confirm the subcellular localization of SAL1 fusion proteins experimentally, Arabidopsis mesophyll protoplasts and root cell suspension cultures were transformed with Agrobacterium carrying constructs encoding SAL1_I–VI fused to the GFP at the C-terminus. Transfection of Arabidopsis mesophyll protoplasts was performed as described by Yoo et al. (2007) using 20–40 μg of plasmid DNA. Transformation of Arabidopsis root suspension cells was performed as described previously (Berger et al., 2007).
For staining with 4′,6-diamidino-2-phenylindol (DAPI), Arabidopsis cells were incubated in 2 μg ml−1 (w/v) solution of DAPI for 5 min in the dark, followed by one to two times rinsing with cell culture media (Berger et al., 2007). For MitoTracker staining, the cells were removed from the medium and exposed in 500 nmol concentrated MitoTracker dye for 45–60 min. Cells were rinsed several times with cell culture media prior to imaging.
The GFP expression patterns in dark-grown cultured Arabidopsis or protoplasts from mesophyll tissue were recorded by confocal laser scanning microscopy (Zeiss, Jena, Germany). Images were acquired as z-series with a 1- to 3-μm interval with 25 frames using a Zeiss LSM510 confocal laser scanning microscope. Green fluorescent protein was visualized with a 488-nm laser and a band-pass (BP) 500–530 filter and the MitoTracker stain with a 543-nm laser and a BP 565–615 filter. For the visualization of DAPI, we used ultraviolet light and a BP 385–470 filter.
Co-localization of the GFP signal with chlorophyll autofluorescence indicated chloroplastidic localization. A co-labeling of GFP with the DNA fluorescent stain DAPI was interpreted as a nuclear localization, whereas a co-labeling of GFP with the MitoTracker indicated a mitochondrial localization.
Results were documented with Discus and Zeiss software. Images were processed using Photoshop CS3 (Adobe Systems, San Jose, CA, USA). Adjustment of levels was applied to the SAL1-V construct to make weak GFP signals better visible in protoplasts.
4.5 Complementation of sal1 Mutant Using SAL1 I to VI Constructs
To complement sal1, we utilized constructs SAL1 I to VI without GFP and generated stable Arabidopsis transgenic lines. All six SAL1 constructs were recombined from pDONR207 into the Gateway destination pGWB2 vector (35S cauliflower mosaic virus promoter), and correctness of constructs was verified by sequencing. SAL1 I to VI were delivered to sal1 Arabidopsis plants by Agrobacterium-mediated transformation, and positive transformants were selected using kanamycin. The homozygous SAL1ox lines I to VI were isolated following segregation analysis of populations.
4.6 Analysis of Shoot Fresh Weight of Complemented Plants
Individual Arabidopsis plants were grown on MS agar media for 4 weeks as described above. To measure the shoot fresh weight of complemented sal1 mutants, the aboveground rosettes were excised at the hypocotyl and individual weight was recorded. At least nine seedlings per construct were analyzed.
4.7 RNA Extraction and RT-qPCR
To measure the transcript levels in the wild type and the different complemented mutant plants, total RNA was isolated from leaves, cDNA was reversely transcribed, and reverse transcription quantitative PCR (RT-qPCR) was performed as described previously (Gigolashvili et al., 2009). The relative quantification of the expression levels was performed using the comparative delta Ct method, and the calculated relative expression values were normalized to Actin2 and compared with the expression level in wild-type plants (Col-0 = 1).
4.8 Extraction and Measurement of Sulfated Compounds and of Sulfate
GSLs and their desulfo-precursors were extracted from the lyophilized plant material as reported previously (Ashykhmina et al., 2019). Sulfate was detected as previously reported in Mugford et al. (2009).
4.9 Quantification of PAP in Plant Extracts
Plant material was collected and frozen in liquid nitrogen. The extraction and chromatographic detection of PAP were performed as reported previously (Ashykhmina et al., 2019).
4.10 Quantification of Rosette Parameters
Individual Arabidopsis plants were grown on separate soil-filled pots for 25 days under long-day conditions (18-h light and 6-h darkness at ∼100 µmol photons m−2 s−1, 22°C/20°C day/night cycle). For imaging, the aboveground rosettes were excised at the hypocotyl with sharp scissors and immediately photographed using an in-house imaging platform comprising a Canon DSLR camera and controlled fluorescent lighting. The images were analyzed in ImageJ to quantify the leaf area (area of green pixels) and the rosette compactness (ratio of leaf area relative to the convex hull) (Vanhaeren et al., 2015).
4.11 Protein Extraction and Western Blot
Approximately 100 mg leaf tissue harvested from 25-day-old soil-grown Arabidopsis plants was snap-frozen in liquid nitrogen, ground to fine powder using a ball mill at 20 Hz for 1 min (Retsch, Haan, Germany), and then resuspended in 300 µl RIPA extraction buffer (1% NP-40, 0.5% sodium deoxycholate, 0.1% sodium dodecyl sulfate, and 10% glycerol) supplemented with 1 mM phenylmethylsulfonyl fluoride (PMSF). Cellular debris was removed by centrifugation (14,000 × g for 10 min at 4°C) and the supernatant moved to a fresh tube. Total protein was quantified using the Bradford assay. For SDS-PAGE and Western blotting, 20 µg total protein was loaded per sample onto 12% Mini-PROTEAN® TGX™ Precast Gels (Bio-Rad, Hercules, CA, United States) and resolved at 200 V for 30 min. The proteins were then transferred unto PVDF membranes using the Trans-Blot Turbo Transfer System (Bio-Rad). The membranes were incubated in blocking solution (5% milk, 1 × PBS, and 0.05% Tween) for 1 h at room temperature. This was followed by an anti-SAL1 antibody (Agrisera AS07 256; 1:1,000 dilution in 1% milk, 1 × PBS, and 0.05% Tween) overnight at 4°C and a secondary antibody (ECLTM Donkey anti-rabbit IgG, horseradish peroxidase linked; GE Healthcare, Chicago, IL, United States) for 1 h at room temperature, with three 15-min washes (1 × PBS and 0.05% Tween) after every incubation step. The blots were developed using ECL imaging solution (Clarity Western Peroxide Reagent and Clarity Western Luminol/Enhancer Reagent; Bio-Rad). Chemiluminescence was visualized using the ChemiDoc system (Bio-Rad). To visualize all proteins present on the blot, the membrane was incubated for 5 min in Ponceau S solution (Sigma-Aldrich, St. Louis, MO, USA) and washed with distilled water to remove background staining.
4.12 Statistical Analysis
Comparison of means was performed to determine statistical significance using a two-sample Student’s t-test or an ANOVA (Tukey’s test). Constant variance and normal distribution of data were verified prior to statistical analysis.
In the first phase of the project, comparison to wild type with repeated t-tests seemed to be the most accessible method of choice, as we were most interested in whether an individual line was not significantly different from the wild type (indicating complete complementation) rather than possible differences between certain lines (partial complementation). Prior to the t-test, a two-sample F-test for variances was implemented to check for scedasticity, shown in Figures 4–6. If the variances differed, a heteroscedastic two-tailed t-test was performed, while equal variances led to the choice of a homoscedastic t-test. For Figures 7, 8, homogeneity of the variances was verified using the Levene’s test for equality of variances in SPSS Statistics version 27 (IBM, Armonk, NY, USA). All datasets passed the test for equal variances, returning significance values between 0.3 and 0.6 (significance values higher than 0.05 indicate equal variance). The datasets were subsequently analysed by ANOVA.
Data Availability Statement
The original contributions presented in the study are included in the article/Supplementary Material. Further inquiries can be directed to the corresponding author.
Author Contributions
NA and KXC performed most of the experiments and analyzed the data. HF did analysis of the glucosinolates and contributed to data analysis. TG and U-IF made the original experimental design. KXC, SK, and FVB contributed to the experimental design and editing. TG and KXC wrote the manuscript.
Funding
This work was supported by Deutsche Forschungsgemeinshaft grant (GI-824/2-1) and the Deutsche Forschungsgemeinshaft Heisenberg Fellowship (GI-824/4-1). Research in SK’s lab is supported by Deutsche Forschungsgemeinschaft under Germany’s Excellence Strategy (EXC 2048/1)—project 390686111. KXC is funded by a Postdoctoral Fellowship from the Research Foundation—Flanders (FWO; grant no. 12N4818N). FVB is funded by Fonds Wetenschappelijk Onderzoek and Fonds De La Recherche Scientifique—FNRS (EOS project no. 30829584).
Conflict of Interest
The authors declare that the research was conducted in the absence of any commercial or financial relationships that could be construed as a potential conflict of interest.
Publisher’s Note
All claims expressed in this article are solely those of the authors and do not necessarily represent those of their affiliated organizations, or those of the publisher, the editors, and the reviewers. Any product that may be evaluated in this article, or claim that may be made by its manufacturer, is not guaranteed or endorsed by the publisher.
Acknowledgments
We thank Bastian Walter and Claudia Nothelle (University of Cologne) for technical assistance with anion and thiol analysis and greatly acknowledge undergraduate students Eduard Hofsetz, Yvonne Peters, and Olga Spit for their assistance in the lab. We very much appreciate the financial support from the Deutsche Forschungsgemeinshaft grant (FL-126/24-1).
Supplementary Material
The Supplementary Material for this article can be found online at: https://www.frontiersin.org/articles/10.3389/fmolb.2021.763795/full#supplementary-material
References
Ashykhmina, N., Lorenz, M., Frerigmann, H., Koprivova, A., Hofsetz, E., Stührwohldt, N., et al. (2019). PAPST2 Plays Critical Roles in Removing the Stress Signaling Molecule 3′-Phosphoadenosine 5′-Phosphate from the Cytosol and its Subsequent Degradation in Plastids and Mitochondria. Plant Cell 31, 231–249. doi:10.1105/tpc.18.00512
Berger, B., Stracke, R., Yatusevich, R., Weisshaar, B., Flügge, U.-I., and Gigolashvili, T. (2007). A Simplified Method for the Analysis of Transcription Factor-Promoter Interactions that Allows High-Throughput Data Generation. Plant J. 50, 911–916. doi:10.1111/j.1365-313x.2007.03088.x
Chan, K. X., Mabbitt, P. D., Phua, S. Y., Mueller, J. W., Nisar, N., Gigolashvili, T., et al. (2016). Sensing and Signaling of Oxidative Stress in Chloroplasts by Inactivation of the SAL1 Phosphoadenosine Phosphatase. Proc. Natl. Acad. Sci. 113, 201604936. doi:10.1073/pnas.1604936113
Chan, K. X., Wirtz, M., Phua, S. Y., Estavillo, G. M., and Pogson, B. J. (2013). Balancing Metabolites in Drought: the Sulfur Assimilation Conundrum. Trends Plant Sci. 18, 18–29. doi:10.1016/j.tplants.2012.07.005
Chen, H., Zhang, B., Hicks, L. M., and Xiong, L. (2011). A Nucleotide Metabolite Controls Stress-Responsive Gene Expression and Plant Development. Plos One 6, e26661. doi:10.1371/journal.pone.0026661
Chi, W., Feng, P., Ma, J., and Zhang, L. (2015). Metabolites and Chloroplast Retrograde Signaling. Curr. Opin. Plant Biol. 25, 32–38. doi:10.1016/j.pbi.2015.04.006
Dichtl, B., Stevens, A., and Tollervey, D. (1997). Lithium Toxicity in Yeast Is Due to the Inhibition of RNA Processing Enzymes. Embo J. 16, 7184–7195. doi:10.1093/emboj/16.23.7184
Estavillo, G. M., Crisp, P. A., Pornsiriwong, W., Wirtz, M., Collinge, D., Carrie, C., et al. (2011). Evidence for a SAL1-PAP Chloroplast Retrograde Pathway that Functions in Drought and High Light Signaling in Arabidopsis. The Plant Cell Online 23, 3992–4012. doi:10.1105/tpc.111.091033
Gigolashvili, T., Geier, M., Ashykhmina, N., Frerigmann, H., Wulfert, S., Krueger, S., et al. (2012). The Arabidopsis Thylakoid ADP/ATP Carrier TAAC Has an Additional Role in Supplying Plastidic Phosphoadenosine 5′-Phosphosulfate to the Cytosol. Plant Cell 24, 4187–4204. doi:10.1105/tpc.112.101964
Gigolashvili, T., Yatusevich, R., Rollwitz, I., Humphry, M., Gershenzon, J., and Flügge, U.-I. (2009). The Plastidic Bile Acid Transporter 5 Is Required for the Biosynthesis of Methionine-Derived Glucosinolates inArabidopsis Thaliana. Plant Cell 21, 1813–1829. doi:10.1105/tpc.109.066399
Gonzalez, N., Vanhaeren, H., and Inzé, D. (2012). Leaf Size Control: Complex Coordination of Cell Division and Expansion. Trends Plant Science 17, 332–340. doi:10.1016/j.tplants.2012.02.003
Hirsch, J., Misson, J., Crisp, P. A., David, P., Bayle, V., Estavillo, G. M., et al. (2011). A Novel Fry1 Allele Reveals the Existence of a Mutant Phenotype Unrelated to 5'->3' Exoribonuclease (XRN) Activities in Arabidopsis thaliana Roots. Plos One 6, e16724. doi:10.1371/journal.pone.0016724
Hirschmann, F., Krause, F., Baruch, P., Chizhov, I., Mueller, J. W., Manstein, D. J., et al. (2017). Structural and Biochemical Studies of Sulphotransferase 18 from Arabidopsis thaliana Explain its Substrate Specificity and Reaction Mechanism. Sci. Rep. 7, 4160. doi:10.1038/s41598-017-04539-2
Ishiga, Y., Watanabe, M., Ishiga, T., Tohge, T., Matsuura, T., Ikeda, Y., et al. (2017). The SAL-PAP Chloroplast Retrograde Pathway Contributes to Plant Immunity by Regulating Glucosinolate Pathway and Phytohormone Signaling. Mpmi 30, 829–841. doi:10.1094/mpmi-03-17-0055-r
Kim, B.-H., and von Arnim, A. G. (2009). FIERY1regulates Light-Mediated Repression of Cell Elongation and Flowering Time via its 3′(2′),5′-bisphosphate Nucleotidase Activity. Plant J. 58, 208–219. doi:10.1111/j.1365-313x.2008.03770.x
Klein, M., and Papenbrock, J. (2009). Kinetics and Substrate Specificities of Desulfo-Glucosinolate Sulfotransferases in Arabidopsis Thaliana. Physiologia Plantarum 135, 140–149. doi:10.1111/j.1399-3054.2008.01182.x
Krishna, P., and Gloor, G. (2001). The Hsp90 Family of Proteins in Arabidopsis thaliana. Cell Stress Chaper 6, 238–246. doi:10.1379/1466-1268(2001)006<0238:thfopi>2.0.co;2
Lee, B.-R., Huseby, S., Koprivova, A., Chételat, A., Wirtz, M., Mugford, S. T., et al. (2012). Effects of Fou8/fry1 Mutation on Sulfur Metabolism: Is Decreased Internal Sulfate the Trigger of Sulfate Starvation Response? PloS One 7, e39425. doi:10.1371/journal.pone.0039425
Mugford, S. G., Yoshimoto, N., Reichelt, M., Wirtz, M., Hill, L., Mugford, S. T., et al. (2009). Disruption of Adenosine-5′-Phosphosulfate Kinase in Arabidopsis Reduces Levels of Sulfated Secondary Metabolites. Plant Cell 21, 910–927. doi:10.1105/tpc.109.065581
Nagarajan, V. K., Jones, C. I., Newbury, S. F., and Green, P. J. (2013). XRN 5′→3′ Exoribonucleases: Structure, Mechanisms and Functions. Biochim. Biophys. Acta (Bba) - Gene Regul. Mech. 1829, 590–603. doi:10.1016/j.bbagrm.2013.03.005
Pesaresi, P., and Kim, C. (2019). Current Understanding of GUN1: a Key Mediator Involved in Biogenic Retrograde Signaling. Plant Cell Rep. 38, 819–823. doi:10.1007/s00299-019-02383-4
Phua, S. Y., Yan, D., Chan, K. X., Estavillo, G. M., Nambara, E., and Pogson, B. J. (2018). The Arabidopsis SAL1-PAP Pathway: A Case Study for Integrating Chloroplast Retrograde, Light and Hormonal Signaling in Modulating Plant Growth and Development? Front. Plant Sci. 9, 1171. doi:10.3389/fpls.2018.01171
Poonam, R., Bhardwaj, R., Kaur, R., Bali, S., Kaur, P., Sirhindi, G., et al. (2015). Role of Various Hormones in Photosynthetic Responses of green Plants under Environmental Stresses. Curr. Protein Pept. Sci. 16, 435–449. doi:10.2174/1389203716666150330125215
Rens‐Domiano, S. S., and Roth, J. A. (1987). Inhibition of M and P Phenol Sulfotransferase by Analogues of 3′‐Phosphoadenosine‐5′‐Phosphosulfate. J. Neurochem. 48, 1411–1415. doi:10.1111/j.1471-4159.1987.tb05679.x
Robles, P., Fleury, D., Candela, H., Cnops, G., Alonso-Peral, M. M., Anami, S., et al. (2010). TheRON1/FRY1/SAL1Gene Is Required for Leaf Morphogenesis and Venation Patterning in Arabidopsis. Plant Physiol. 152, 1357–1372. doi:10.1104/pp.109.149369
Rodríguez, V. M., Chételat, A., Majcherczyk, P., and Farmer, E. E. (2010). Chloroplastic Phosphoadenosine Phosphosulfate Metabolism Regulates Basal Levels of the Prohormone Jasmonic Acid in Arabidopsis Leaves. Plant Physiol. 152, 1335–1345. doi:10.1104/pp.109.150474
Sugiyama, R., Li, R., Kuwahara, A., Nakabayashi, R., Sotta, N., Mori, T., et al. (2021). Retrograde Sulfur Flow from Glucosinolates to Cysteine in Arabidopsis thaliana. Proc. Natl. Acad. Sci. 118, e2017890118. doi:10.1073/pnas.2017890118
Tee, E. E. (2018). Too Much, Take it Back: PAP Moves from the Cytosol to Plastids and Mitochondria for Degradation via PAPST2. The Plant Cell 31 (1), 15–16. doi:10.1105/tpc.18.00944
Vanhaeren, H., Gonzalez, N., and Inzé, D. (2015). A Journey through a Leaf: Phenomics Analysis of Leaf Growth in Arabidopsis thaliana. The Arabidopsis Book 13, e0181. doi:10.1199/tab.0181
Wang, Y., Berkowitz, O., Selinski, J., Xu, Y., Hartmann, A., and Whelan, J. (2018). Stress Responsive Mitochondrial Proteins in Arabidopsis thaliana. Free Radic. Biol. Med. 122, 28–39. doi:10.1016/j.freeradbiomed.2018.03.031
Wilson, P. B., Estavillo, G. M., Field, K. J., Pornsiriwong, W., Carroll, A. J., Howell, K. A., et al. (2009). The Nucleotidase/phosphatase SAL1 Is a Negative Regulator of Drought Tolerance in Arabidopsis. Plant J. 58, 299–317. doi:10.1111/j.1365-313x.2008.03780.x
Xiong, L., Lee, Bh., Ishitani, M., Lee, H., Zhang, C., and Zhu, J. K. (2001). FIERY1 Encoding an Inositol Polyphosphate 1-Phosphatase is a Negative Regulator of Abscisic Acid and Stress Signaling in Arabidopsis. Genes Dev. 15 (15), 1971–1984. doi:10.1101/gad.891901
Yoo, S.-D., Cho, Y.-H., and Sheen, J. (2007). Arabidopsis Mesophyll Protoplasts: a Versatile Cell System for Transient Gene Expression Analysis. Nat. Protoc. 2, 1565–1572. doi:10.1038/nprot.2007.199
Keywords: 3′-phosphoadenosine 5′-phosphate (PAP), chloroplasts, mitochondria, nuclei, cytosol, metabolite signaling, SAL1, nucleotidase/phosphatase
Citation: Ashykhmina N, Chan KX, Frerigmann H, Van Breusegem F, Kopriva S, Flügge U-I and Gigolashvili T (2022) Dissecting the Role of SAL1 in Metabolizing the Stress Signaling Molecule 3′-Phosphoadenosine 5′-Phosphate in Different Cell Compartments. Front. Mol. Biosci. 8:763795. doi: 10.3389/fmolb.2021.763795
Received: 10 September 2021; Accepted: 24 November 2021;
Published: 21 January 2022.
Edited by:
Robert David Hall, Wageningen University and Research, NetherlandsReviewed by:
Charlotte Gommers, Wageningen University and Research, NetherlandsEva Knoch, Ludwig Maximilian University of Munich, Germany
Copyright © 2022 Ashykhmina, Chan, Frerigmann, Van Breusegem, Kopriva, Flügge and Gigolashvili. This is an open-access article distributed under the terms of the Creative Commons Attribution License (CC BY). The use, distribution or reproduction in other forums is permitted, provided the original author(s) and the copyright owner(s) are credited and that the original publication in this journal is cited, in accordance with accepted academic practice. No use, distribution or reproduction is permitted which does not comply with these terms.
*Correspondence: Tamara Gigolashvili, t.gigolashvili@uni-koeln.de
†These authors have contributed equally to this work