 Jinpeng Liang1†
 Yulan Chen1,2†
 Sisi Li1†Dongyang Liu1,2Hong Tian1
 Quanju Xiang1Ke Zhao1
 Xiumei Yu1
 Qiang Chen1Hongzhu Fan3Lingzi Zhang1
 Petri Penttinen1*
 Yunfu Gu1*
- 1Department of Microbiology, College of Resources, Sichuan Agricultural University, Chengdu, China
- 2Liangshan Tobacco Corporation of Sichuan Province, Xichang, China
- 3Institute of Agricultural Resources and Environmental Science, Sichuan Academy of Agricultural Sciences, Chengdu, China
Introduction: pH is one of the important factors affecting the growth and performance of microorganisms.
Methods: We studied the pH response and plant growth-promoting (PGP) ability of Rhizopus delemar using cultivation experiments and transcriptomics, and verified the expression profiles using quantitative real-time PCR.
Results: pH affected the growth and PGP properties of R. delemar. At pH 7, the growth rate of R. delemar was rapid, whereas pH 4 and 8 inhibited mycelial growth and PGP ability, respectively. In the pot experiment, the plant height was the highest at pH 7, 56 cm, and the lowest at pH 4 and pH 5, 46.6 cm and 47 cm, respectively. Enzyme activities were highest at pH 6 to pH 7. Enzyme activities were highest at pH 6 to pH 7. Among the 1,629 differentially expressed genes (DEGs), 1,033 genes were up-regulated and 596 were down-regulated. A total of 1,623 DEGs were annotated to carbohydrate-active enzyme coding genes.
Discussion: The PGP characteristics, e.g., Phosphorus solubilization ability, of R. delemar were strongest at pH 7. The results provide useful information regarding the molecular mechanism of R. delemar pH response.
1 Introduction
The fungus Rhizopus delemar (R. delemar) in the phylum Zygomycota is widely ustilized in industrial production due to its broad metabolic capacity. R. delemar is employed in ethanol production from starchy substrates and in the synthesis of organic acids such as lactic and fumaric acid from starch, cellulose, and hemicellulose (Zhou et al., 2011; Odoni et al., 2017). In addition, R. delemar strains exhibit plant growth promoting (PGP) and plant disease-suppressing abilities, which hold promise for sustainable agricultural applications (Zhang et al., 2022).
The PGP abilities of fungi include secreting organic acids to dissolve insoluble minerals and facilitate plant nutrient absorption, including nitrogen and phosphorus (Whitelaw et al., 1999). Moreover, PGP fungi may promote plant growth via phytohormone production, stress alleviation and suppression of pathogenic microorganisms (Hashem et al., 2019). These PGP abilities are governed by the organism’s genetic makeup. Notably, three PGP Aspergillus strains closely related to A. puulaauensis and A. sydowii in Ascomycota were found to carry more carbohydrate-active enzyme (CAZymes) genes, small secreted protein (SSPs) genes, and gene clusters encoding indole metabolism compared to pathogenic Aspergillus strains (Jing et al., 2022). To our knowledge, little attention has been given to exploring the PGP properties and related genes in zygomycetes.
Microorganisms exhibit sensitivity to environmental pH due to direct contact with the surroundings (Selvig et al., 2011). Fungi demonstrate adaptability to a wide pH range, maintaining homeostasis under acidic and alkaline conditions. For example, A. nidulans displays growth across pH 2.5 to 9.0 (Caddick et al., 1986). Environmental pH influences enzyme activities, thereby affecting microbial metabolism. In addition, pH affects cell membranes, enzyme-substrate affinity, and substrate absorption by microorganisms (Li et al., 2019). Microorganisms regulate gene expression to coordinate metabolic reactions in response to environmental conditions (Wilson et al., 2017), with specific gene expression modulated by environmental pH (Manteau et al., 2003). Fungi colonize and invade fibrous plant materials, participating in cell wall polysaccharide degradation and fiber digestion (Hébraud and Fèvre, 1988). Changes in pH lead to changes in the activities of glucosidase, cellulase and other CAZymes (Lou et al., 2013) that play key roles in the synthesis or decomposition of complex carbohydrates by degrading, modifying, and generating glycosidic bonds (Cantarel et al., 2009; Davies and Williams, 2016). In addition, CAZymes may contribute to PGP ability (Jing et al., 2022). To the best of our knowledge, there are no studies on the effect of pH on R. delemar CAZymes.
CAZymes are categorized into six groups based on associated catalytic activity motifs and domains: glycosyl hydrolases (GHs), carbohydrate esterases (CEs), polysaccharide lyases (PLs), carbohydrate-binding modules (CBMs), glycosyl transferases (GTs), and auxiliary activities (AAs) (Várnai et al., 2014; Drula et al., 2022). In the R. oryzae genome, CAZymes gene composition differs from most ascomycetes and basidiomycetes, suggesting R. oryzae’s utilization of easily digestible sugars but not complex plant cell wall polysaccharides, aligning with its growth profile (Battaglia et al., 2011). However, information regarding CAZymes in R. delemar and the effects of pH on the R. delemar transcriptome remains scarce.
We studied the plant growth-promoting (PGP) ability of R. delemar using transcriptomics to elucidate the PGP mechanism and the role of CAZymes therein, providing a theoretical foundation for further agricultural applications of R. delemar.
2 Materials and methods
2.1 Strain
The strain Rhizopus delemar SICAUZ-1 was isolated from corn (Zea mays L. var. Kangnongyu007) in Liangshan Yi Autonomous Region, China. The strain was maintained on potato dextrose agar (PDA). The partial ribosomal RNA gene sequence of R. delemar SICAUZ-1 is deposited in NCBI GenBank under the accession number ON584326. The strain was preserved in the China Center for Type Culture Collection under the identification number M2022700. The conidia of the isolates were stored at −80°C in 20% glycerol solution until use.
2.2 Determination of mycelial growth
To measure mycelial growth rate, mycelium was inoculated onto potato dextrose agar (PDA) and into 150 mL potato dextrose broth (PDB) medium (glucose 20 g/L, potato extract powder 300 g/L), followed by incubation at 28°C. Mycelial growth rate was determined on PDA by measuring the colony diameter every 12 h. Mycelial biomass was determined by growing the inoculant in PDB at 180 rpm for 72 h, after which the culture was filtered, and the weight of the mycelia was measured.
2.3 Plant growth-promoting characteristics of Rhizopus delemar
The inocula for the PGP ability tests were prepared by cultivating the strain in PDB medium at 28°C and 180 rpm until reaching the logarithmic phase. After the mycelium had colonized the medium completely within 3 days, the culture was centrifuged at 12,000 g for 1 min, and the pellet was re-suspended to a density of 7.50 × 10⁷ cfu/mL in ddH2O.
In the PGP ability tests, the pH of the media was adjusted to pH 4, 5, 6, 7, and 8 using 1 mol/L sodium hydroxide (NaOH) or 1 mol/L hydrochloric acid (HCl). All tests were conducted in triplicate. After sterilization, the pH value of the media was measured and adjusted when needed.
Indole-3-acetic acid (IAA) production was estimated as described by Joshi et al. (2021). 0.5 mL of the inoculant was inoculated into 150 mL PDB medium with 2 mg/ mL l-tryptophan and incubated at 150 rpm and 28°C for 72 h. After incubation, the culture was centrifuged at 10,000 g for 30 min, and 1 mL of the supernatant was mixed with 2 mL of Salkowski reagent (1 mL 0.5 M FeCl3 and 49 mL of 35% HClO4). After incubation at room temperature for 0.5 h, the concentration of IAA was determined using ultraviolet–visible spectrophotometry (Shimadzu, CHN) at 530 nm and a 1–50 μg/mL IAA standard curve.
To measure phosphorus solubilization capacity, 0.4 mL of the inoculant was inoculated into 150 mL inorganic phosphorus liquid medium (Phosphate solubilizer) and incubated at 180 rpm and 28°C for 72 h (Johri et al., 1999), followed by centrifugation of 1 mL of the culture at 10,000 rpm for 10 min, and measuring water-soluble phosphate concentrations in the supernatant using molybdenum antimony resistance colorimetry.
To determine siderophore production, 0.5 mL of the inoculant was inoculated on chrome azurol S (CAS) agar, and the plates were incubated at 28°C for 2 days (Machuca et al., 2003). An orange halo around a colony indicated the production of siderophores and the diameter of the halo indicated the amount produced (Schwyn and Neilands, 1987).
The in vivo PGP ability of the strain Rhizopus delemar SICAUZ-1 on corn (Zea mays L. var. Kangnongyu007) was tested in a greenhouse experiment. Particle size 1 mm quartz sand was sterilized at 121°C for 2 h. Corn seeds were washed with ddH2O and germinated in the dark for 2 days. The seeds were soaked for 2 h in 150 mL of the fungal suspension; soaking in sterile PDB served as the uninoculated control. Five seeds per pot were planted in plastic pots filled with 500 g of quartz sand. The pots were watered daily with Hoagland’s nutrient solution. After 45 days, the plants were carefully removed from the pots, the root and aboveground parts were separated and washed with distilled water, and dried until constant weight to determine the dry weight.
2.4 RNA extraction, cDNA library construction, and sequencing
The strain was cultivated as in the PGP tests at pH 4, 5, 6, 7, and 8, immediately frozen in liquid nitrogen and stored at −80°C. The mycelia from plates were pooled and ground to powder with a pestle in liquid nitrogen-chilled mortars. Cells were crushed using a FastPrep-24 (MP Biomedical, Shanghai, China). RNA was extracted using the Trizol Reagent (Invitrogen Life Technologies, Carlsbad, CA, United States). The concentration and quality of the extracted RNA were determined using a NanoDrop spectrophotometer (Thermo Scientific, Waltham, MA, United States). The integrity of the extracted RNA was assessed with gel electrophoresis in 1% agarose.
The TruSeq RNA Sample Preparation Kit (Illumina, San Diego, CA, United States) was used to create sequencing libraries according to the manufacturer’s instructions. Briefly, mRNA in 3 μg of RNA was purified using poly-T-oligo-attached magnetic beads, and fragmented in the fragmentation buffer utilizing divalent cations at a high temperature. First-strand cDNA was synthesized using SuperScript II and random oligonucleotides, and second-strand cDNA was synthesized using RNase H and DNA polymerase I. Exonuclease/polymerase activities were used to blunt the residual overhangs, and the enzymes were eliminated. Illumina paired-end adaptor oligonucleotides were ligated to prepare for hybridization after the 3′ ends of the DNA fragments were acetylated. The library fragments were purified using an AMPure XP system (Beckman Coulter, Beverly, CA, United States) to choose cDNA fragments of the preferred 200 bp length. In a 15-cycle PCR reaction, DNA fragments with ligated adaptors on both ends were specifically enriched using Illumina PCR Primer Cocktail. Products were measured using the Agilent high-sensitivity DNA test on a Bioanalyzer 2,100 system (Agilent) and purified using the AMPure XP system. The sequencing was carried out at Shanghai Personal Biotechnology Co. Ltd. (Shanghai, China) using an Illumina Hiseq platform.
2.5 Transcriptome data analysis
Sequences were trimmed and filtered to remove reads with average quality below Q20. The filtered reads were aligned to the R. delemar reference genome (GCA_011763715.1_ASM1176371v1_genomic.fna) using HISAT2 (Kim et al., 2015).
Transcripts were functionally annotated against the UniProt Consortium (2023), the Gene Ontology (GO) (2023), and the Kyoto Encyclopedia of Genes and Genomes (KEGG) (Kanehisa et al., 2000) databases using BLAST (Altschul et al., 1990). The annotated genes were assigned to GO categories. Unigenes were subjected to KEGG Orthology analysis using the KOBAS 2.0 web server.1
Based on the results on the PGP properties, differential expression analysis was conducted using DESeq2 (Wang et al., 2019) by comparing the expression at pH 7 to expression at other pH treatments. p-values in individual comparisons were adjusted for multiple testing using the procedure described by Wright (1992). Genes with |log2FoldChange| > 1 and p < 0.05/4 (the number of comparisons) were taken as differentially abundant. KEGG pathway enrichment analysis and GO functional enrichment analysis of differentially expressed genes (DEGs) were carried out using the KEGG biological pathway database2 and Gene Ontology3 databases, respectively.
2.6 Enzyme assay
The cultured fungal solution was centrifuged at 10,000 rpm for 10 min, and the precipitate was washed with 0.9% NaCl solution cells 3 times, suspended in phosphate buffer (100 mM, pH 7.4), treated with ultrasound for 5 min, centrifuged at 10,000 rpm and 4°C for 15 min, and the supernatant was collected as the crude enzyme extract. Lytic polysaccharide monooxygenases, protease, endo- and exo-1,4-beta-glucanase, β-glucosidase, and pectin lyase activities were determined as previously described (Yeo et al., 2007; Songulashvili et al., 2008; MacDonald et al., 2016; Rueda-Mejia et al., 2021).
2.7 CAZymes annotation
Using the CAZymes Analysis Toolkit (CAT) (Park et al., 2010), differentially expressed genes related to carbohydrate active enzyme genes were annotated in the Carbohydrate Enzyme Database.4
2.8 Quantitative real-time PCR (qRT-PCR) validation of RNA-seq data
The expression of selected CAZymes genes were validated using qRT-PCR with three biological replicates and three technical replicates per biological replicate. Based on the results of GO and KEGG analysis, we selected five genes with known or predicted carbohydrate activity and responding to pH. qRT-PCR was carried out using a CFX96 Real-Time System (BIO-RAD) according to the manufacturer’s instructions, and SYBR green as the fluorescent dye (Libert et al., 2015). The primers used are listed in Supplementary Table S1. Internal Transcribed Spacer was used as the internal control gene. Genes were considered differentially expressed when fold change ≥1.5 or ≤ 0.667 and p ≤ 0.05.
2.9 Statistical analyses
Differences in PGP properties and qPCR expression levels between treatments were tested using analysis of variance (ANOVA) and Tukey post hoc test in SPSS 23.0. Differences were considered statistically significant at p < 0.05. Before the tests, the normality of distribution and homogeneity of variance were tested.
3 Results
3.1 The effect of pH on Rhizopus delemar growth and PGP capacity
The mycelium biomass and growth rate were highest at pH 7, followed by pH 6 and pH 5 (p < 0.05) (Figure 1; Table 1). The mycelium biomass was lowest at pH 4 and the growth rate at pH 4 and pH 8 (p < 0.05). The IAA concentration ranged from 10.0 to 10.4 μg/mL, and the phosphate solubilization from 4.17 to 6.36 μg/mL; both were highest at pH 7. Based on the halo diameters, siderophore production was highest at pH 7, followed by pH 6, pH 8, pH 5, and pH 4 (p < 0.05) (Table 1).

Figure 1. (A) The mycelium growth of Rhizopus delemar in PDA under different pH conditions (measured every 12 h). (B) The mycelium growth of Rhizopus delemar PDB under different pH conditions.
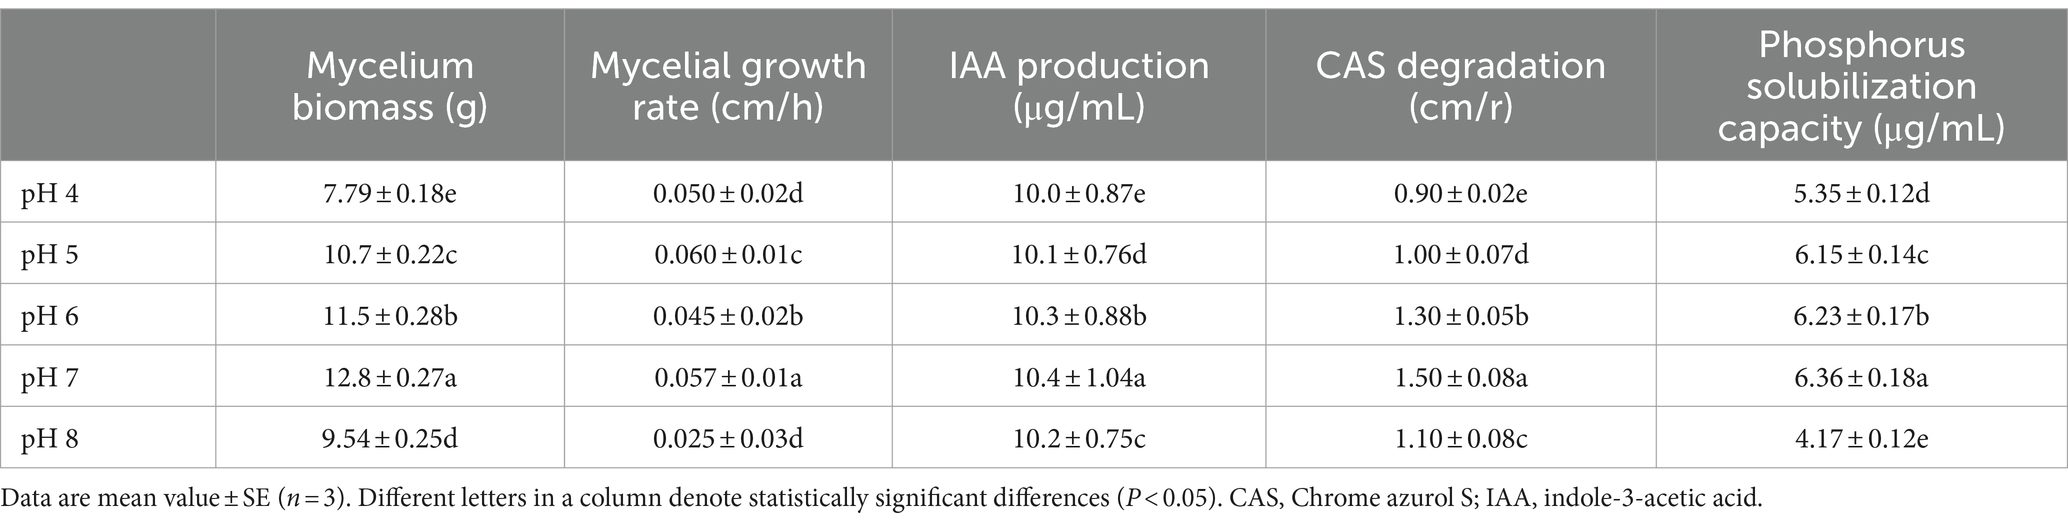
Table 1. The mycelium biomass, growth rate, IAA production, CAS degradation, and phosphorus solubilization capacity of Rhizopus delemar grown at different pH levels.
In the pot experiment, plant height and shoot weight were highest at pH 7 and lowest at pH 4 and pH 5 (p < 0.05) (Figure 2; Table 2). Intriguingly, roots were longest at pH 8, followed by pH 7 and 5, pH 6, and pH 4, whereas the number of roots was greatest at pH 5 to pH 7, followed by pH 8, and pH 4 (p < 0.05). Leaf area, fresh and dry root weight and dry shoot weight were biggest at pH 7 and smallest at pH 4 (p < 0.05).
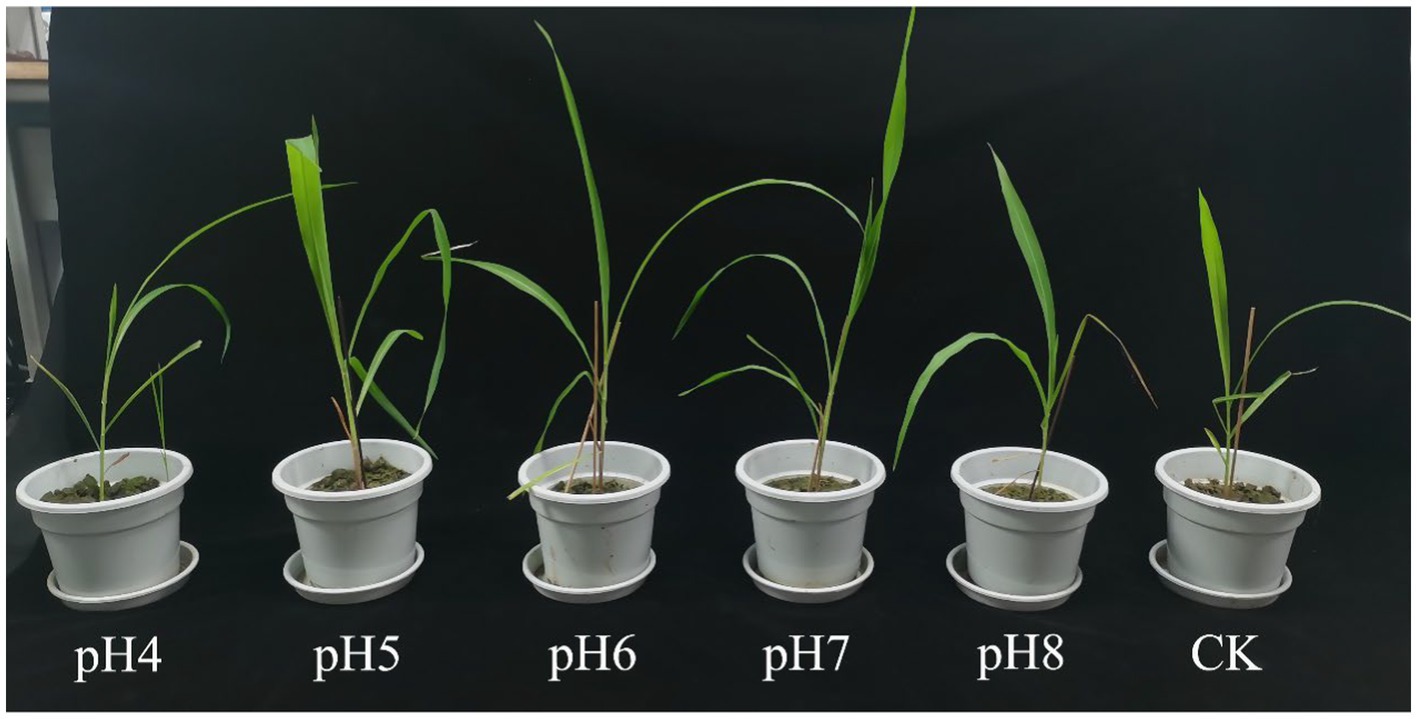
Figure 2. Potted plant of Rhizopus delemar corn under different pH conditions.
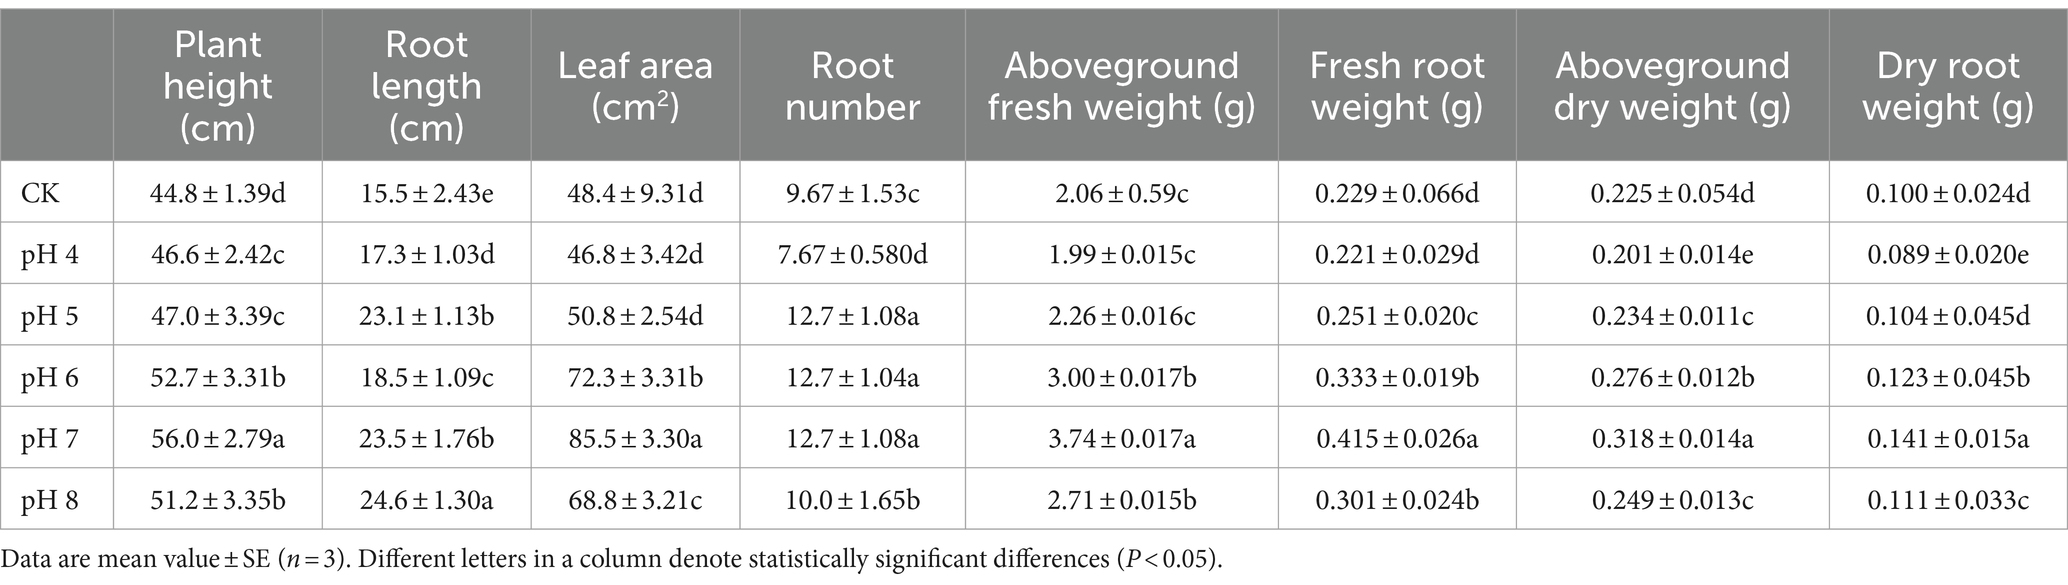
Table 2. The properties of corn seedlings treated with the fermentation broth of Rhizopus delemar grown at different pH conditions.
3.2 Rhizopus delemar gene expression under different pH treatments
Approximately 94% of the reads passed the quality filtering, and approximately 96% of the filtered reads were mapped to the R. delemar genome. We obtained about 4.2, 4.0, 4.3, and 4.4 million reads for the different pH treatment R. delemar, and 4.7 million reads for the pH 7 (Supplementary Table S2). Within the replicates, the correlation in gene expression varied from 0.86 to 0.98 (Figure 3). In total, 1,629 DEGs were detected between the pH 7 and the other pH values (|log2FoldChange|>1) (Figures 4,5; Supplementary Table S1). In the comparisons, the number of unique DEGs ranged from 593 in the pH 4 vs. pH 7 to 46 in the pH 6 vs. pH 7; most of the DEGs at pH4 and pH 5 were up-regulated genes compared to pH 7 (Figure 4).
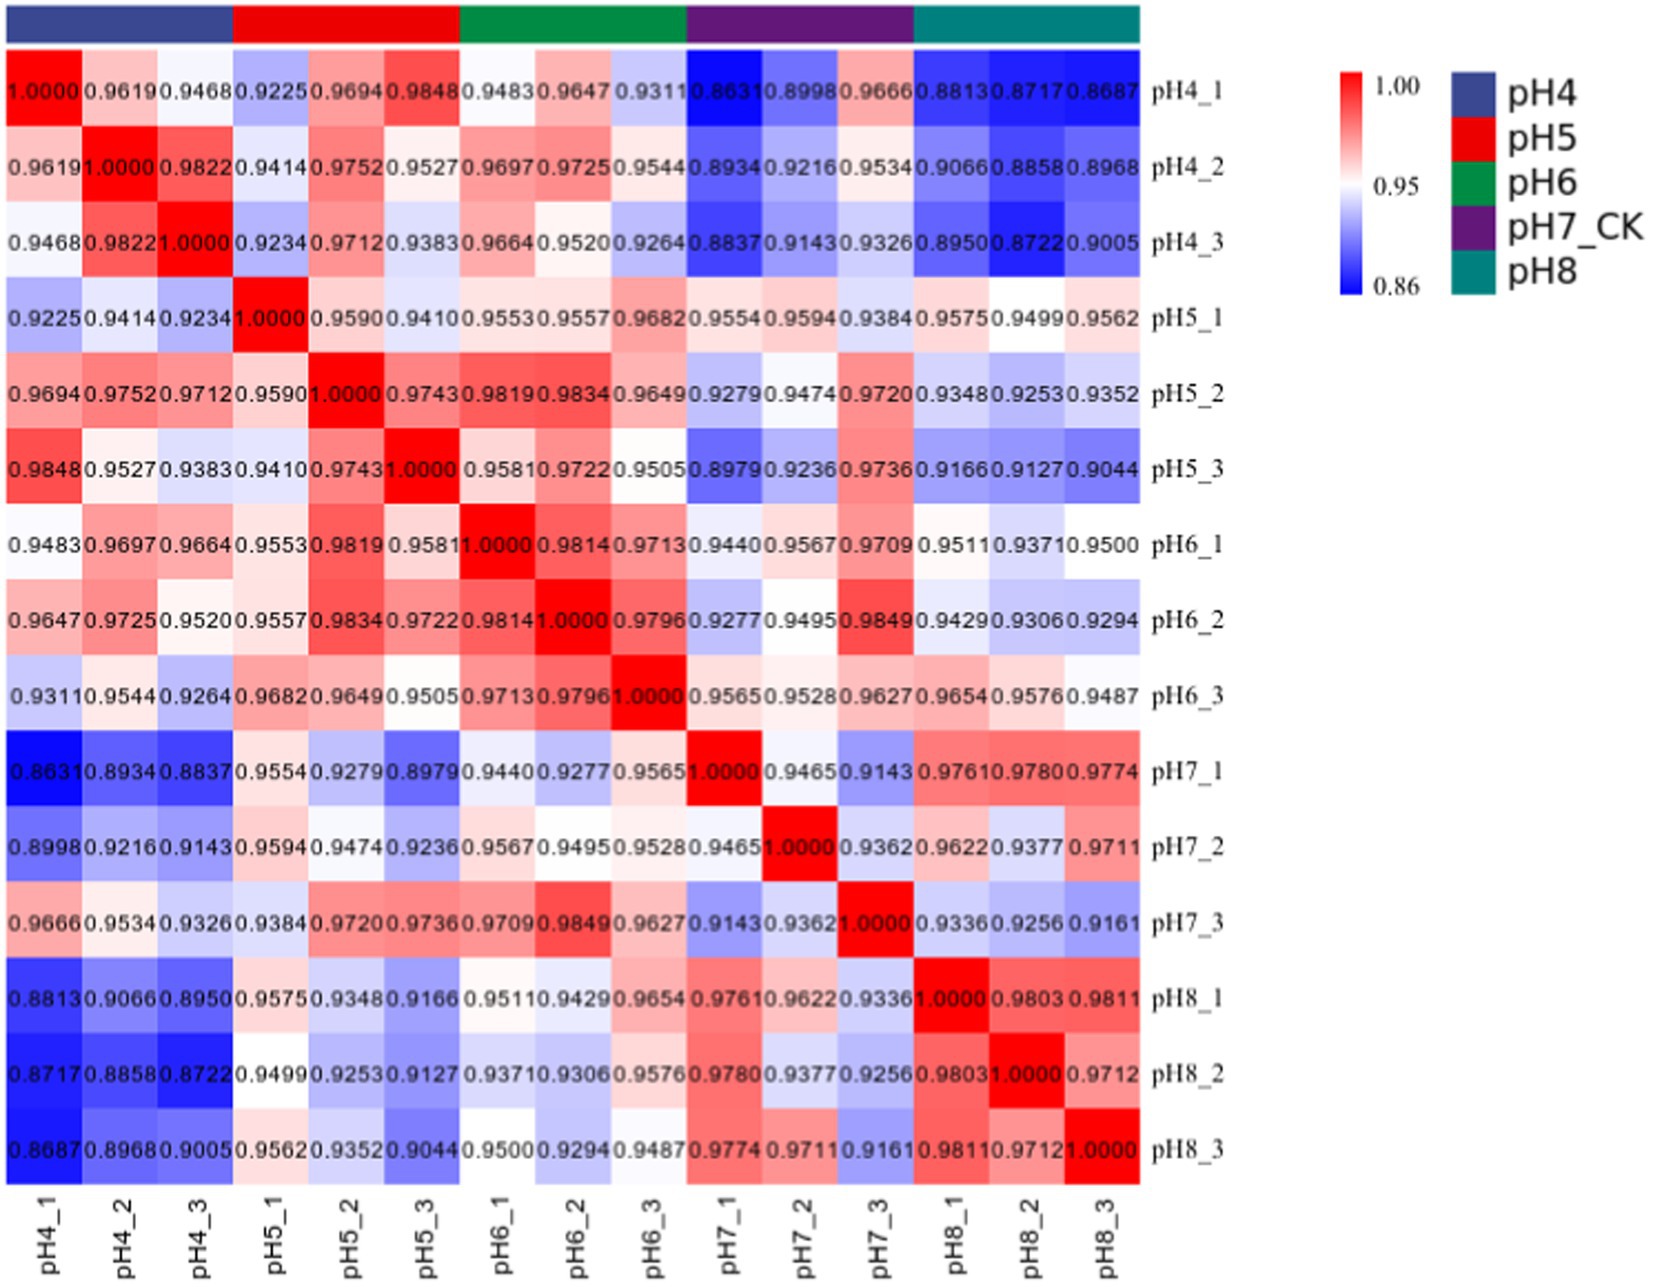
Figure 3. Pearson correlation coefficient was used to represent the correlation of gene expression levels between samples.
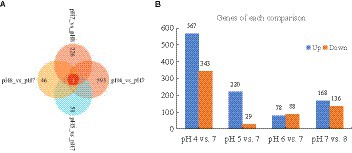
Figure 4. (A) Unique DEGs in the comparisons between pH 7 and the other pH values; (B) The number of up-regulated and down-regulated DEGs in the comparisons.
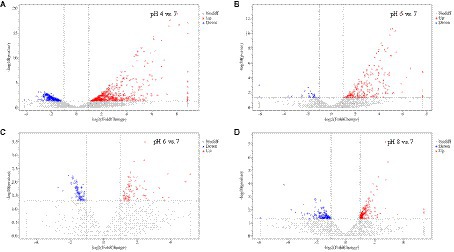
Figure 5. Volcanic expression distribution of DEGs in Rhizopus delemar transcriptome at different pH levels. (A) pH 4 vs. 7, (B) pH 5 vs. 7, (C) pH 6 vs. 7, (D) pH 8 vs. 7).
At pH 4 vs. pH 7, 567 and 343 genes were significantly upregulated and downregulated, respectively. Upregulated genes included serine/threonine-protein kinase PAK 1 (G6F53_003097), 5′-nucleotidase doman-containing protein (G6F53_003201), transforming growth factor-beta-induced protein (G6F53_007702), ABC transporter G family member (G6F53_007454), peptidoglycan-N-acetylglucosamine deacetylase (G6F53_000518), alpha-mannosidase (G6F53_007010), chitin synthase (G6F53_007011); downregulated genes included 12-oxophytodienoate reductase (G6F53_002340), and cAMP-dependent protein kinase (G6F53_000024), nucleolar MIF4G domain-containing protein (G6F53_004769). At pH 5 vs. pH 7, 220 and 29 genes were significantly upregulated and downregulated, respectively. Upregulated genes included hypothetical proteins (G6F53_002001), mesaconyl-C (4)-CoA hydratase (G6F53_000105), and 5′-nucleotidase domain-containing protein (G6F53_003201); downregulated genes included transposable element Tc1 transposase (G6F53_013486) and hypothetical protein (G6F53_000790). At pH 6 vs. pH 7, 78 and 88 genes were significantly upregulated and downregulated, respectively. Upregulated genes included tigger transposable element-derived protein (G6F53_006194, G6F53_002255) and ammonium transporter (G6F53_000650); downregulated genes included proton-coupled amino acid transporter (G6F53_002419) and chitinase (G6F53_001950). At pH 8 vs. pH 7, 168 and 136 genes were significantly upregulated and downregulated, respectively. Upregulated genes included transposable element Tc1 transposase (G6F53_013294) and hypothetical proteins; downregulated genes included trimethylguanosine synthase (G6F53_011806) and iron transport multicopper oxidase (G6F53_000791).
3.2.1 Go enrichment analysis of DEGs of Rhizopus delemar
At pH 4 vs. pH 7, DEGs were classified into 839 molecular function (MF), 602 cell component (CC), and 5,426 biological process (BP) terms (Figure 6A; Supplementary Table S2). At pH 5 vs. 7, the DEGs were classified into 386 MFs, 298 CCs, and 2,676 BPs (Figure 6B). Ammonia assimilation cycle, nitrogen utilization, and glutamate biosynthetic process were enriched. At pH 6 vs. 7, the DEGs were classified into 376 MFs, 267 CCs, and 2,456 BPs (Figure 6C). Ribosome biogenesis, rRNA metabolic process, and rRNA processing were enriched. At pH 8 vs. 7, the DEGs were classified into 495 MFs, 397 CCs, and 2,972 BPs (Figure 6D).
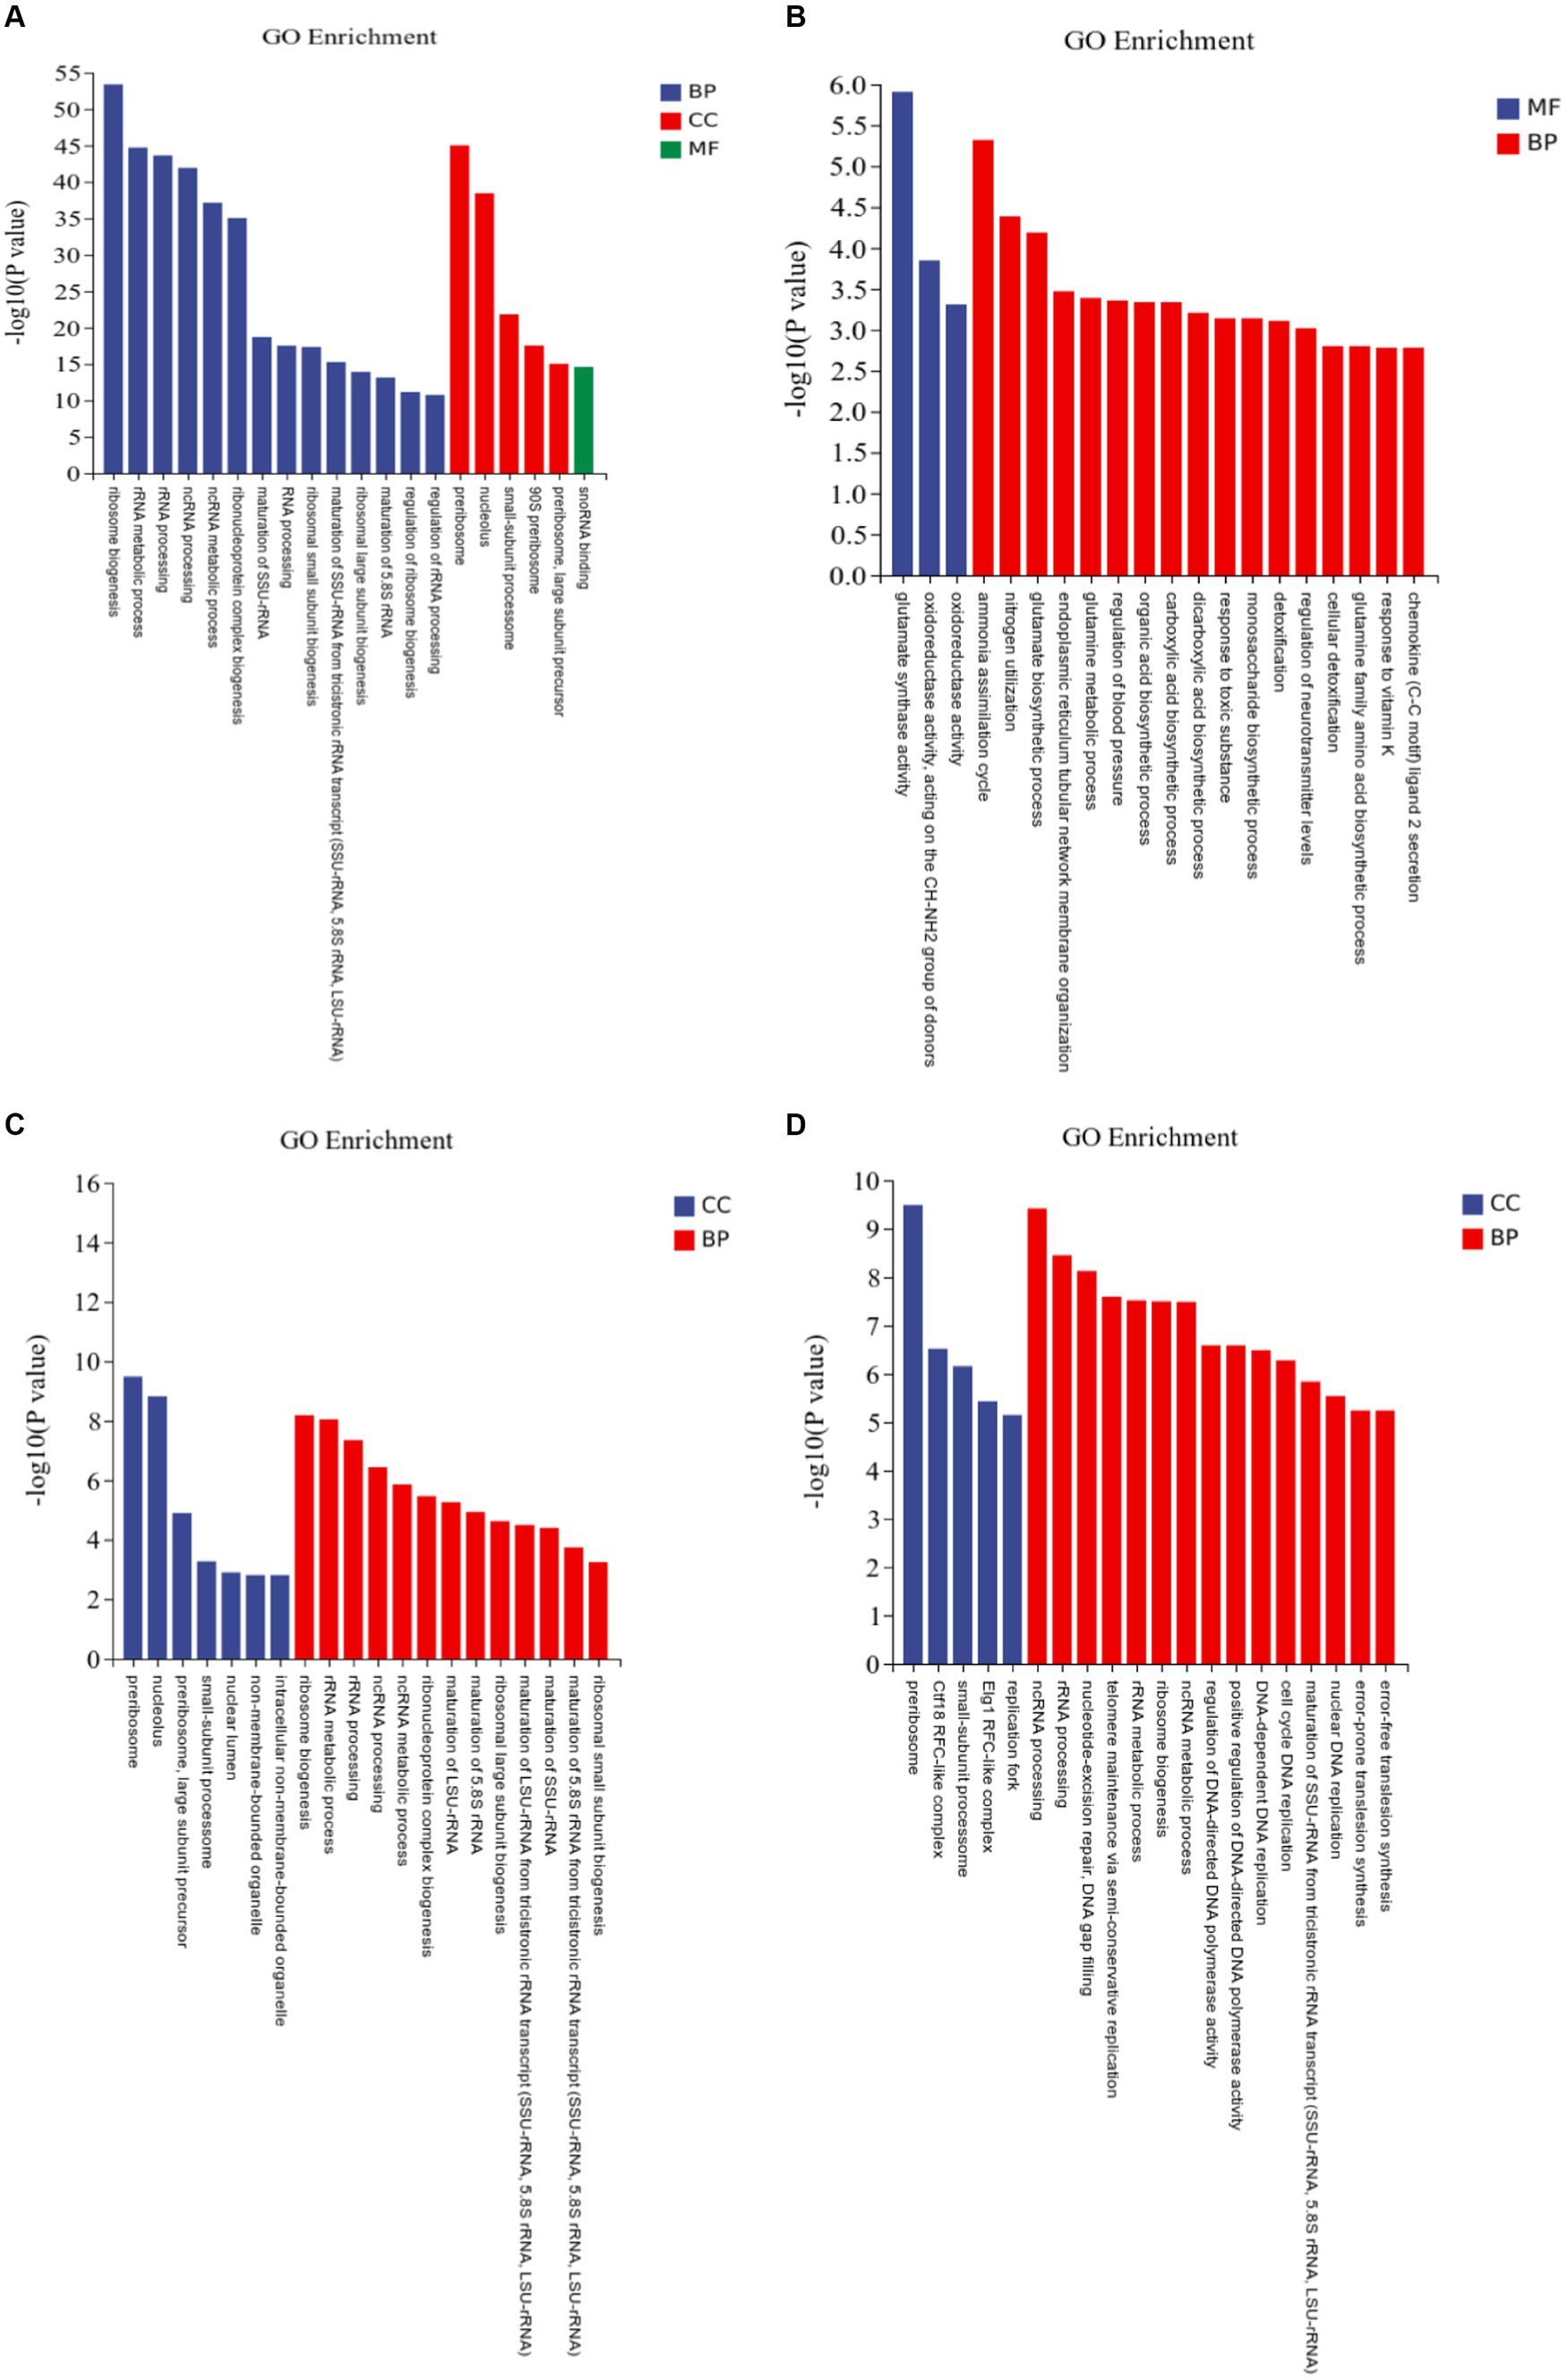
Figure 6. Gene Ontology (GO) assignments of differentially expressed genes (DEGs) in Rhizopus delemar transcriptome at different pH levels. (A) pH 4 vs. 7, (B) pH 5 vs. 7, (C) pH 6 vs. 7, (D) pH 8 vs. 7.
Several up-regulated genes involved in plant growth promotion via auxin production were identified, including: auxin-responsive protein SAUR78, indole-3-acetic acid-amido synthetase and protein RALF-like 24 precursor, which were mainly included in GO terms: indole-containing compound metabolic process (GO: 0042430, GO: 0042436), positive regulation of cell growth (GO: 0030307) and positive regulation of cell development (GO: 0010720).
3.2.2 KEGG pathway enrichment analysis of DEGs of Rhizopus delemar
In the KEGG pathway enrichment analysis, the DEGs at pH 4 vs. 7 were assigned to 286 pathways; at pH 5 vs. 7, to 55 pathways; at pH 6 vs. 7, to 34 pathways; and at pH 8 vs. 7, to 48 pathways (Figure 7; Supplementary Table S3).
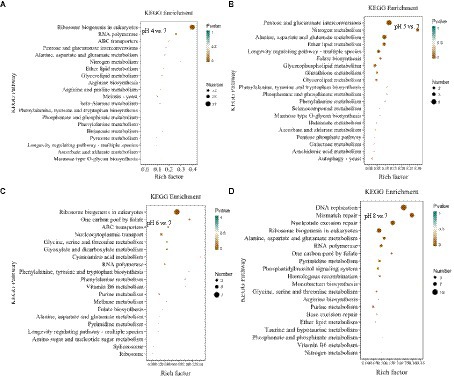
Figure 7. KEGG pathway enrichment analysis of differentially expressed genes (DEGs) in Rhizopus delemar transcriptome at different pH levels. (A) pH 4 vs. 7, (B) pH 5 vs. 7, (C) pH 6 vs. 7, (D) pH 8 vs. 7. KEGG, Kyoto Encyclopedia of Genes and Genomes.
At pH 4 vs. 7, the eukaryotic pathway ribosome biogenesis (ko03008) contained 56 up-regulated genes and 37 down-regulated genes. Glycolysis/gluconeogenesis (ko00010) contained 2 up-regulated genes and 5 down-regulated genes, and pyruvate metabolism pathway (ko00620) contained 2 up-regulated genes and 6 down-regulated genes. At pH 5 vs. 7, the metabolism of pentose and glucuronate (ko00040) contained 5 up-regulated genes, the butanoate metabolism (ko00650) treatment contained 1 up-regulated gene. Alanine, the alanine, aspartate and glutamate metabolism (ko00250) contain 2 up-regulated genes and 2 down-regulated genes. At pH 6 vs. 7, among the enriched genetic information processing pathways, the ribosome biogenesis in the eukaryotes pathway (ko03008) contained seven downregulated genes, and one carbon pool by the folate pathway (ko00670) contained two downregulated genes. At pH 8 vs. 7, butyric acid metabolism (ko00650) treatment contained 1 up-regulated gene, propionic acid metabolism pathway (ko00640) treatment contained 1 up-regulated gene, and fructose and mannose metabolism (ko00051) treatment contained 1 up-regulated gene, and alanine, aspartate and glutamate metabolism pathway (ko00250) contained 2 up-regulated genes and 3 down-regulated genes.
The results implied that R. delemar gene expression was significantly affected by pH. Most of the DEGs were enriched in butyric acid metabolism, pyruvate metabolism pathway, glycolysis/ gluconeogenesis, propionic acid metabolism pathway and other CAZymes (p < 0.05).
3.3 Differentially expressed CAZymes genes
A total of 1,623 genes of R. delemar transcriptome were identified as CAZymes genes (Supplementary Tables S4). Among these, 454 GHs, 108 AAs, 540 GTs, 352 CEs, 145 CBMs, and 24 PLs were identified (Figure 8). At pH 4 and 5 vs. 7 and at pH 7 vs. 8, 431 DEGs were related to CAZymes. At pH 6 vs. 7, 428 DEGs were related to CAZymes.
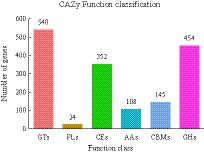
Figure 8. The classification of differentially expressed genes (DEGs) in Rhizopus delemar transcriptome at different pH levels into carbohydrate active enzyme (CAZymes) families.
The qRT-PCR gene expression levels of five CAZymes genes, chosen based on their biological roles, were in line with the differential expression detected in the transcriptomic analysis (Figure 9), supporting the validity of the results.
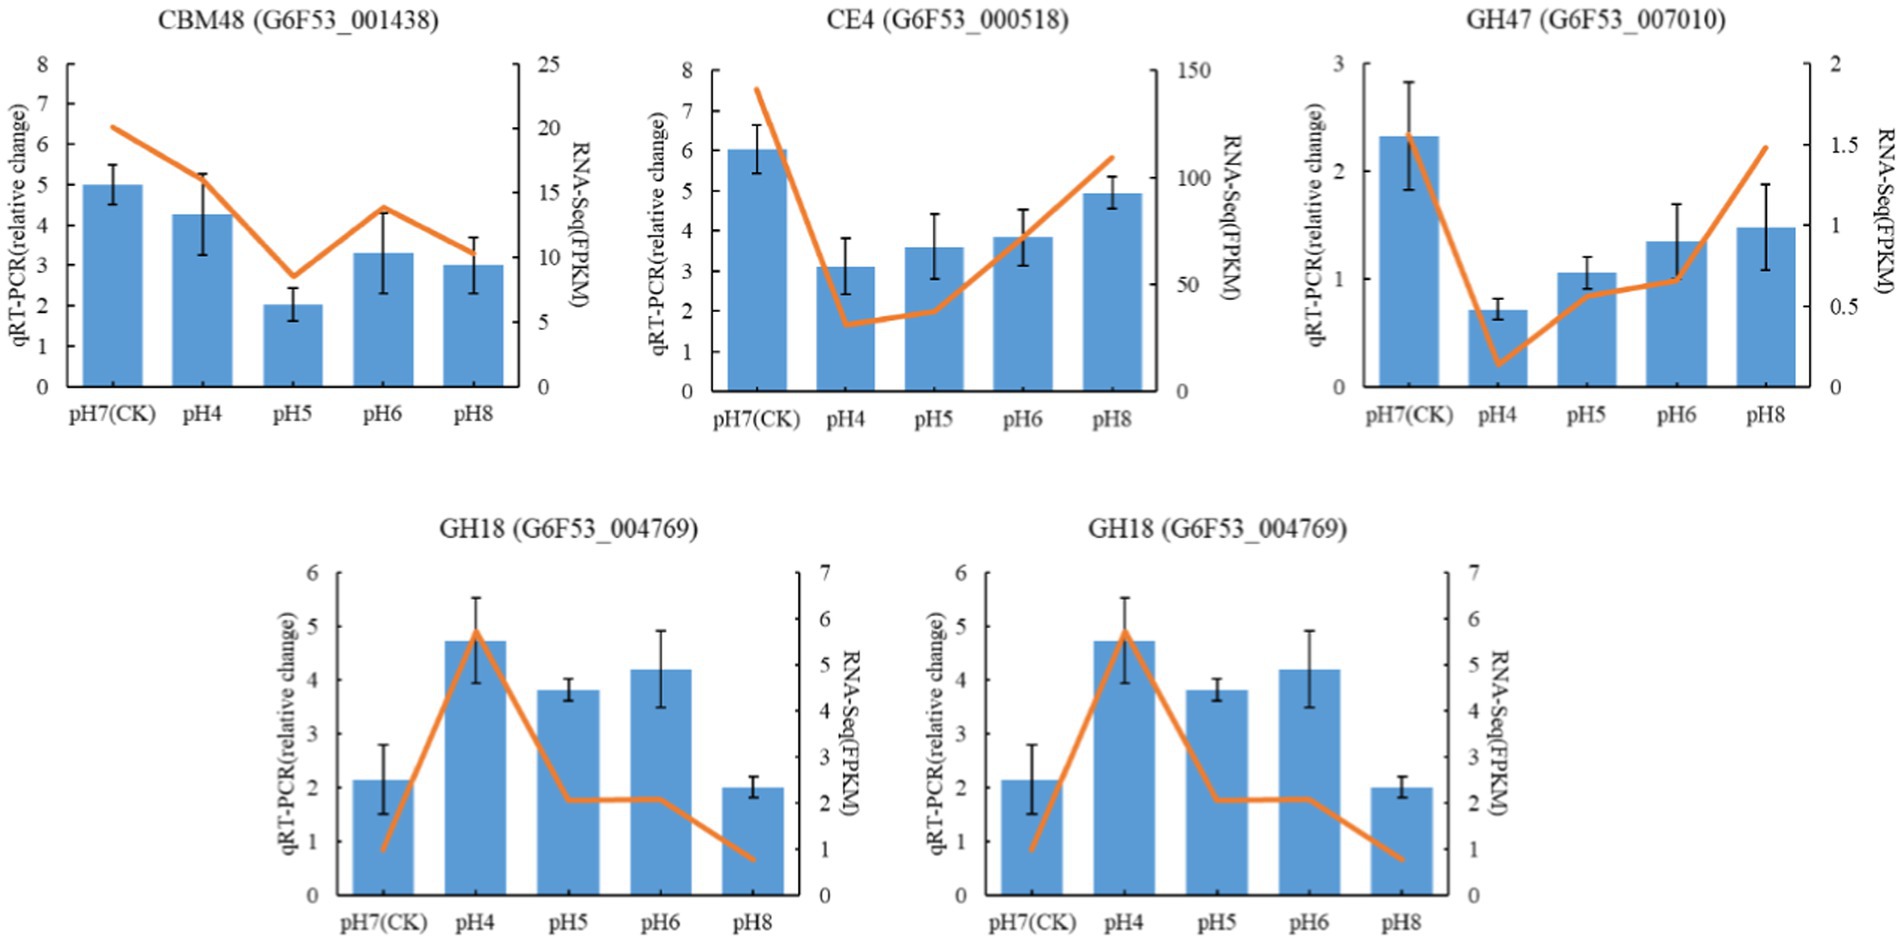
Figure 9. Validation of RNA-seq data by qRT-PCR Blue color bars represent the relative expression levels determined by qRT-PCR. Orange lines indicate the log2 fold change based on the read count values of the RNA-seq analysis. Error bars indicate standard errors of the means (n = 3).
3.4 Enzyme assay
To further reveal the effect of pH on CAZymes, endo-and exo-1,4-beta-glucanase, β-glucosidase, lytic polysaccharide monooxygenases, pectin lyase, and protease activities were determined. Endo-and exo-1,4-beta-glucanase, β-glucosidase are classified under glycoside hydrolase (GHs) group in Carbohydrate Enzyme database (Wierzbicka-Woś et al., 2019). In the transcriptomic analysis, the number of up-regulated GHs genes were greater than that of down-regulated genes. The enzyme activities of β-glucosidase and endo-and exo-1,4-beta-glucanase were lower at pH 4 and pH 8 compared with pH7, indicating that the activity of hydrolases were inhibited under acid–base conditions. We also found that the activity of pectin lyase, encoded by PLs family genes, was highest at pH 7 (Figure 10; Supplementary Table S4).
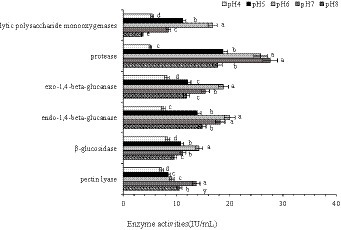
Figure 10. Lytic polysaccharide monooxygenase, protease, exo-1,4-beta-glucanase, endo-1,4-beta-glucanase, β-glucosidase, and pectin lyase activities in Rhizopus delemar grown at different pH levels. (p < 0.05).
4 Discussion
Fungi can be used to produce valuable metabolites at industrial scale and provide great potential for biotechnology and agriculture, e.g., due to plant growth promoting (PGP) abilities. The PGP properties, and the related genes in zygomycetes have received little attention.
Generally, R. delemar grows best at a neutral pH, and the growth of R. delemar decreased below pH 3.5 and above pH 6.5 (Turgeman et al., 2016), consistent with the results of this study. pH can affect spore germination, transcriptional expression, and metabolism-related pathways of fungi (Han et al., 2011; Li et al., 2019). Likewise, pH is expected to affect the expression of PGP properties. Similar with plant growth promoting bacteria (Joshi et al., 2021), the R. delemar PGP characteristics, e.g., Phosphorus solubilization ability, were strongest at pH 7 (Liu et al., 2021). Even though the production of organic acids lowers the pH of the culture medium, an initial low pH possibly inhibits the PGP abilities.
In agreement with Xu et al. (2020), the plants grew poorly at pH 4 and pH 8. The effect on growth was possibly connected to CAZymes activities. The GHs families contain hydrolases such as endo-and exo-1,4-beta-glucanase (Mendonça et al., 2023), which play an important role in the ductility of cell wall and affect plant growth and development. We found that although the gene expression of GHs in CAZymes was up-regulated under pH stress, the endo-and exo-1,4-beta-glucanase and β-glucosidase activities were highest at pH 7. In addition, the better growth at pH 7 may be related to the R. delemar’s ability to dissolve more phosphorus at pH 7 than at pH 4 and pH 8. Compared with the root system, the aboveground part of the plant is more affected by soil phosphorus deficiency. Phosphorus deficiency directly inhibits plant growth by reducing enzyme activity, and indirectly inhibits plant growth by inhibiting leaf photosynthesis (Yang et al., 2022).
In line with the in vitro results, R. delemar grown at pH 7 had strongest PGP effect on seedlings. Although the concentration of IAA produced by R. delemar was not high, there were differences in the growth of plants. It may be that when plants are subjected to pH stress, the semi-permeability of the protoplast membrane disappears, and the cells are subjected to osmotic stress, which accelerated the process of the leaching of anions (Lager et al., 2010), resulting in a significant difference in plant height between pH 4 and pH 8. In our study, genes related to auxin biosynthesis and metabolism were found. These genes are responsible for the division, elongation and differentiation of plant cells and are closely related to plant growth (Matthes et al., 2019). Under pH stress, it may be the interaction between Auxin/Índole-3-acetic acid (Aux/IAA) and Auxin response factor (ARF). When the auxin concentration is low, the repressor protein Aux / IAA forms a complex with the ARF protein to regulate the expression of auxin-responsive genes and prevent them from acting as transcription factors (Ortiz et al., 2019), which is consistent with this study.
In this study, the identified DEGs revealed that pH influence R. delemar gene expression. KEGG pathway analysis showed that differentially expressed genes were mainly involved in ribosomal biogenesis of the eukaryotes pathway. The differentially expressed genes of ribosomal biogenesis pathway under pH stress were all down-regulated, indicating that R. delemar was constantly producing less new proteins in order to adapt to pH changes. The above pathways are basically carbohydrate metabolism processes. It provides carbon source and energy for the growth and reproduction of R. delemar through carbohydrate metabolism.
In the GO enrichment analysis, the number of differentially expressed genes in BP and CC were the largest, the number of down-regulated genes being higher than that of up-regulated genes, and the differentially expressed genes in ribosome biogenesis were significantly expressed. Ribosome biogenesis is regulated at several levels, including transcription of ribosomal genes and phosphorylation, methylation, and acetylation of constituent nucleolar factors, as well as the transport and interaction of these factors (Leary and Huang, 2001). In the comparison of pH 5 vs. pH 7, the GO enrichment of glutamate synthase metabolism was the most significant, and the glutamate differential gene was annotated as an acid ribosomal protein synthesis pathway, which indicated that the synthesis of acid protein would be promoted due to pH stress. Enrichment in pathways related to carbohydrate metabolism, transportation, catabolism, amino acid metabolism, and other nutrient-related processes indicates substantial environmental pressure due to pH changes for R. delemar.
The pH value has an important effect on pentose, glucuronic acid conversion, starch, and sucrose metabolism. Notably, CAZymes cellulase and hemicellulase play pivotal roles in cell wall polysaccharide hydrolysis, crucial for substrate degradation and microbial growth (Kala et al., 2017). CAZymes in carbohydrate metabolism are important for microbial growth, development, and metabolism, and the accumulation of microbial nutrients can be assessed by studying their activities (Wang et al., 2019). Glycoside hydrolases (GHs) include many enzymes that can hydrolyze glycosidic bonds in carbohydrates or between carbohydrate and non-carbohydrate molecules (Gupta et al., 2022). Among the CAZymes genes differentially expressed at pH 4 vs. 7, 78 and 35 genes encoding GHs were upregulated and downregulated, respectively, indicating their crucial role in providing adequate nutrition for R. delemar. Similarly, Fuglsang et al. (2000) reported that the GH18 gene may be related to chitinase activity; GH18 and CBM24 have been reported to bind to α-1,3-mutan, a mixed linked glucan from Streptococcus sp. Most differentially expressed, carbohydrate metabolism associated genes were downregulated at pH 4 vs. 8, indicating that carbohydrate metabolism in R. delemar was affected under acidic and alkaline conditions. Moreover, variations in the pH response within the GH18 enzyme subfamily were observed, showcasing a nuanced pH-dependent regulation within the enzyme subtypes.
In GHs that degrade cellulose, hemicellulose, chitosan, or arabinogalactan, the catalytic module is typically connected with one or more non-catalytic CBM that act independently (Veneault-Fourrey et al., 2014). Further research is needed to investigate whether the presence and location of CBM24 components affect the expression of the GH18 gene. In this study, one CBM12, two CBM13, three CBM30, and two CBM50 genes were upregulated, while one CBM1 and one CBM13 gene were downregulated at pH 4 vs. 7. CBM13 exhibits various sugar-binding specificities and is present in many CAZymes (Fujimoto, 2013). Most cellulose-binding domains attached to cellulolytic enzymes belong to CBM1 (Chen et al., 2014). On the cellulose surface, CBM1 enhances the hydrolysis of cellulose by increasing the concentration of effective enzymes (Takeda et al., 2015). The decrease in CBM1 expression may suggest that lower pH levels require fewer excessive cellulose-degrading enzymes.
At pH 4 vs. 7, 4 CE1, 22 CE4, 3 CE8, 1 CE9, 5 CE10, and 3 CE16 genes were upregulated, and 9 CE1 and 16 CE10 genes were downregulated. CE4 family is the largest in the CE family, and the structure of CE4 enzymes from many bacterial species has been determined (Aragunde et al., 2018). CE16 acts on glucuronoxylan and is induced by endo-β-1,4-glucanase generated fragments (Biely et al., 2016). CE1 and CE10 family members have carboxylesterase and endo-1, 4-β-xylanase activity (Zhao et al., 2014) and exhibit substantial diversity in substrate specificity. CE10 enzymes can act on non-carbohydrate substrates. The CE10 α-helix facilitates binding with specific substrates, such as glutamic acid or aspartic acid. After the formation of active sites, changes in enzyme structure allow for varied functions (Grams and Ospina-Giraldo, 2019), potentially explaining the mix of up- and downregulated genes within the CE10 family.
GTs of catalyze glycosidic bond formation to produce glycosides, participating in oligosaccharide, polysaccharide, and glycoconjugate biosynthesis. These enzymes transfer glycosyl groups using activated donor glycophosphate to form glycosidic bonds with specific receptor molecules (Williams et al., 2008). In our study, GT2, GT15, and GT20 were upregulated at pH 6, and GT1, GT2, GT8, and GT71 were downregulated. Lytic polysaccharide monooxygenases (PLs) use a β-elimination mechanism to split polysaccharides containing alduronic acid, generating unsaturated polysaccharides (El Kaoutari et al., 2013). In this study, pH stress potentially induced significant enzyme synthesis. Two or more polysaccharide utilization groups belonging to the PL7 family possibly promoted substrate degradation and synthesis. However, the specific functions of PLs remain to be clarified.
AAs of CAZymes are currently categorized into eight ligninolytic enzyme families and three lytic polysaccharide monooxygenase families, mainly based on amino acid sequence similarities. AAs include enzymes that cleave glycosidic bonds through an oxidation mechanism (Levasseur et al., 2013). Seven AA families were detected in R. delemar, including AA1, AA2, AA3, AA5, AA6, and AA7.
Consistent with the findings of Ikasari and Mitchell (1996), the activities of endo-and exo-1,4-beta-glucanase, β-glucosidase, lytic polysaccharide monooxygenases, pectin lyase, and protease in R. delemar remained highest at pH 6 or 7.
In conclusion, pH affected the growth and PGP properties of R. delemar, with the optimum pH being 7. In addition, pH affected the expression and activity of enzymes related to carbohydrate metabolism, contributing to the nutritional requirements of R. delemar. However, further clarification of the functions of differentially expressed genes is warranted.
Data availability statement
The datasets presented in this study can be found in online repositories. The names of the repository/repositories and accession number(s) can be found in the article/Supplementary material.
Author contributions
JL: Data curation, Validation, Writing – original draft, Writing – review & editing. YC: Validation, Writing – review & editing. SL: Validation, Writing – review & editing. DL: Data curation, Writing – review & editing. HT: Data curation, Writing – review & editing. QX: Data curation, Writing – review & editing. KZ: Data curation, Writing – review & editing. XY: Data curation, Writing – review & editing. QC: Data curation, Writing – review & editing. HF: Data curation, Writing – review & editing. LZ: Data curation, Writing – review & editing. PP: Writing – original draft, Writing – review & editing. YG: Writing – original draft, Writing – review & editing.
Funding
The author(s) declare financial support was received for the research, authorship, and/or publication of this article. This research was supported by grants from the National Natural Science Foundation of China (Grant No. 41201256) and the Project of Key Research and Development supported by the Sichuan government (Grant No. 2020YFN0100) and Sichuan Tobacco Company (Grant No. SCYC202104).
Acknowledgments
We thank Shanghai Personal Biotechnology Co. Ltd., China, for help in data analysis.
Conflict of interest
The authors declare that the research was conducted in the absence of any commercial or financial relationships that could be construed as a potential conflict of interest.
Publisher’s note
All claims expressed in this article are solely those of the authors and do not necessarily represent those of their affiliated organizations, or those of the publisher, the editors and the reviewers. Any product that may be evaluated in this article, or claim that may be made by its manufacturer, is not guaranteed or endorsed by the publisher.
Supplementary material
The Supplementary material for this article can be found online at: https://www.frontiersin.org/articles/10.3389/fmicb.2024.1359830/full#supplementary-material
Footnotes
References
Altschul, S. F., Gish, W., Miller, W., Myers, E. W., and Lipman, D. J. (1990). Basic local alignment search tool. J. Mol. Biol. 215, 403–410. doi: 10.1016/S0022-2836(05)80360-2
Aragunde, H., Biarnés, X., and Planas, A. (2018). Substrate recognition and specificity of chitin deacetylases and related family 4 carbohydrate esterases. Int. J. Mol. Sci. 19:412. doi: 10.3390/ijms19020412
Battaglia, E., Benoit, I., Van, D. B. J., Wiebenga, A. D., and Coutinho, P. M. (2011). Carbohydrate-active enzymes from the zygomycete fungus Rhizopus oryzae: a highly specialized approach to carbohydrate degradation depicted at genome level. BMC Genomics 12, 1–12. doi: 10.1186/1471-2164-12-38
Biely, P., Singh, S., and Puchart, V. (2016). Towards enzymatic breakdown of complex plant xylan structures: state of the art. Biotechnol. Adv. 34, 1260–1274. doi: 10.1016/j.biotechadv.2016.09.001
Caddick, M. X., Brownlee, A. G., and Arst, H. N. (1986). Regulation of gene expression by pH of the growth medium in aspergillus nidulans. Mol. Gen. Genomics. 203, 346–353. doi: 10.1007/BF00333978
Cantarel, B. L., Coutinho, P. M., Rancurel, C., Bernard, T., Lombard, V., and Henrissat, B. (2009). The carbohydrate-active EnZymes database (CAZy): an expert resource for Glycogenomics. Nucleic Acids Res. 37, D233–D238. doi: 10.1093/nar/gkn663
Chen, L., Drake, M. R., Resch, M. G., Greene, E. R., Himmel, M. E., Chaffey, P. K., et al. (2014). Specificity of O-glycosylation in enhancing the stability and cellulose binding affinity of family 1 carbohydrate-binding modules. Proc. Natl. Acad. Sci. 111, 7612–7617. doi: 10.1073/pnas.1402518111
Davies, G. J., and Williams, S. J. (2016). Carbohydrate-active enzymes: sequences, shapes, contortions and cells. Biochem. Soc. Trans. 44, 79–87. doi: 10.1042/BST20150186
Drula, E., Garron, M. L., Dogan, S., Lombard, V., Henrissat, B., and Terrapon, N. (2022). The carbohydrate-active enzyme database: functions and literature. Nuc. Acids. Res, 50, D571–D577. doi: 10.1093/nar/gkab1045
El Kaoutari, A., Armougom, F., Gordon, J. I., Raoult, D., and Henrissat, B. (2013). The abundance and variety of carbohydrate-active enzymes in the human gut microbiota. Nat. Rev. Microbiol. 11, 497–504. doi: 10.1038/nrmicro3050
Fuglsang, C. C., Berka, R. M., Wahleithner, J. A., Kauppinen, S., Shuster, J. R., Rasmussen, G., et al. (2000). Biochemical analysis of recombinant fungal mutanases. A new family of alpha1,3-glucanases with novel carbohydrate-binding domains. J. Biol. Chem. 275, 2009–2018. doi: 10.1074/jbc.275.3.2009
Fujimoto, Z. (2013). Structure and function of carbohydrate-binding module families 13 and 42 of glycoside hydrolases, comprising a β-trefoil fold. Biosci. Biotechnol. Biochem. 77, 1363–1371. doi: 10.1271/bbb.130183
Grams, N., and Ospina-Giraldo, M. (2019). Increased expression of Phytophthora sojae genes encoding membrane-degrading enzymes appears to suggest an early onset of necrotrophy during Glycine max infection. Fungal Genet. Biol. 133:103268. doi: 10.1016/j.fgb.2019.103268
Gupta, S., Han, S. R., Kim, B., Lee, C. M., and Oh, T. J. (2022). Comparative analysis of genome-based CAZyme cassette in Antarctic Microbacterium sp. PAMC28756 with 31 other Microbacterium species. Genes Genom. 44, 733–746. doi: 10.1007/s13258-022-01254-9
Han, T. H., Lee, J. H., Cho, M. H., Wood, T. K., and Lee, J. (2011). Environmental factors affecting indole production in Escherichia coli. Res. Microbiol. 162, 108–116. doi: 10.1016/j.resmic.2010.11.005
Hashem, A., Tabassum, B., and Fathi Abd_Allah, E. (2019). Bacillus subtilis: a plant-growth promoting rhizobacterium that also impacts biotic stress. Saudi J. Biol. Sci. 26, 1291–1297. doi: 10.1016/j.sjbs.2019.05.004
Hébraud, M., and Fèvre, M. (1988). Characterization of glycoside and polysaccharide hydrolases secreted by the rumen anaerobic fungi Neocallimastix frontalis, Sphaeromonas communis and Piromonas communis. Microbiology 134, 1123–1129. doi: 10.1099/00221287-134-5-1123
Ikasari, L., and Mitchell, D. A. (1996). Leaching and characterization of Rhizopus oligosporus acid protease from solid-state fermentation. Enzym. Microb. Technol. 19, 171–175. doi: 10.1016/0141-0229(95)00227-8
Jing, M., Xu, X., Peng, J., Li, C., Zhang, H., Lian, C., et al. (2022). Comparative genomics of three aspergillus strains reveals insights into endophytic lifestyle and endophyte-induced plant growth promotion. J. Fungi 8:690. doi: 10.3390/jof8070690
Johri, J. K., Surange, S., and Nautiyal, C. S. (1999). Occurrence of salt, pH, and temperature-tolerant, hosphate-solubilizing bacteria in alkaline soils. Curr. Microbiol. 39, 89–93. doi: 10.1007/s002849900424
Joshi, G., Kumar, V., and Brahmachari, S. K. (2021). Screening and identification of novel halotolerant bacterial strains and assessment for insoluble phosphate solubilization and IAA production. Bull. Natl. Res. Cent. 45, 1–12. doi: 10.1186/s42269-021-00545-7
Kala, A., Kamra, D. N., Kumar, A., Agarwal, N., Chaudhary, L. C., and Joshi, C. G. (2017). Impact of levels of total digestible nutrients on microbiome, enzyme profile and degradation of feeds in buffalo rumen. PLoS One 12:e0172051. doi: 10.1371/journal.pone.0172051
Kanehisa, M., and Goto, S. (2000). KEGG: kyoto encyclopedia of genes and genomes. Nucl. Acids. Res, 28, 27–30. doi: 10.1093/nar/28.1.27
Kim, D., Langmead, B., and Salzberg, S. L. (2015). HISAT: a fast spliced aligner with low memory requirements. Nat. Methods, 12, 357–360. doi: 10.1038/nmeth.3317
Lager, I. D. A., Andréasson, O. L. A., Dunbar, T. L., Andreasson, E., Matthew, A., Rasmusson, G. A., et al. (2010). Changes in external pH rapidly alter plant gene expression and modulate auxin and elicitor responses. Plant Cell Environ. 33, 1513–1528. doi: 10.1111/j.1365-3040.2010.02161.x
Leary, D. J., and Huang, S. (2001). Regulation of ribosome biogenesis within the nucleolus. FEBS Lett. 509, 145–150. doi: 10.1016/S0014-5793(01)03143-X
Levasseur, A., Drula, E., Lombard, V., Coutinho, P. M., and Henrissat, B. (2013). Expansion of the enzymatic repertoire of the CAZy database to integrate auxiliary redox enzymes. Biotechnol. Biofuels 6:41. doi: 10.1186/1754-6834-6-41
Li, H., Mei, X., Liu, B., Li, Z., Wang, B., Ren, N., et al. (2019). Insights on acetate-ethanol fermentation by hydrogen-producing Ethanoligenens under acetic acid accumulation based on quantitative proteomics. Environ. Int. 129, 1–9. doi: 10.1016/j.envint.2019.05.013
Libert, X., Chasseur, C., Bladt, S., Packeu, A., Bureau, F., Roosens, N. H., et al. (2015). Development and performance assessment of a qualitative SYBR® green real-time PCR assay for the detection of aspergillus versicolor in indoor air. Appl. Microbiol. Biotechnol. 99, 7267–7282. doi: 10.1007/s00253-015-6785-9
Liu, X. Y., Chen, C. Y., Wang, J., Zou, S. H., and Long, X. X. (2021). Phosphorus solubilizing bacteria bacillus thuringiensis and Pantoea ananatis simultaneously promote soil inorganic phosphate dissolution and soil Pb immobilization. Rhizosphere 20:100448. doi: 10.1016/j.rhisph.2021.100448
Lou, H., Zhu, J. Y., Lan, T. Q., Lai, H. R., and Qiu, X. Q. (2013). pH-induced lignin surface modification to reduce nonspecific cellulase binding and enhance enzymatic saccharification of lignocelluloses. ChemSusChem 6, 919–927. doi: 10.1002/cssc.201200859
Machuca, A., and Milagres, A. M. F. (2003). Use of CAS-agar plate modified to study the effect of different variables on the siderophore production by aspergillus. Lett. Appl. Microbiol. 36, 177–181. doi: 10.1046/j.1472-765X.2003.01290.x
MacDonald, J., Goacher, R. E., Abou-Zaid, M., and Master, E. R. (2016). Comparative analysis of lignin peroxidase and manganese peroxidase activity on coniferous and deciduous wood using ToF-SIMS. Appl. Microbiol. Biotechnol. 100, 8013–8020. doi: 10.1007/s00253-016-7560-2
Manteau, S., Abouna, S., Lambert, B., and Legendre, L. (2003). Differential regulation by ambient pH of putative virulence factor secretion by the phytopathogenic fungus Botrytis cinerea. FEMS Microbiol. Ecol. 43, 359–366. doi: 10.1111/j.1574-6941.2003.tb01076.x
Matthes, M. S., Best, N. B., Robil, J. M., Malcomber, S., Gallavotti, A., and Mcsteen, P. (2019). Auxin EvoDevo: conservation and diversification of genes regulating auxin biosynthesis, transport, and signaling. Mol. Plant 12, 298–320. doi: 10.1016/j.molp.2018.12.012
Mendonça, M., Barroca, M., and Collins, T. (2023). Endo-1, 4-β-xylanase-containing glycoside hydrolase families: characteristics, singularities and similarities. Biotechnol. Adv. 65. doi: 10.1016/j.biotechadv.2023.108148
Odoni, D., Tamayo-Ramos, J. A., Sloothaak, J., van Heck, R. G. A., Martins dos Santos, V. A. P., and de Graaff, L. H.. (2017). Comparative proteomics of Rhizopus delemar ATCC 20344 unravels the role of amino acid catabolism in fumarate accumulation. PeerJ 5:e3133. doi: 10.7717/peerj.3133
Ontology (GO) (2023). The Gene Ontology Consortium. (2023). The Gene Ontology knowledgebase in 2023. Genetics. 224: iyad031. doi: 10.1093/genetics/iyad031
Ortiz, J., Soto, J., Fuentes, A., Herrera, H., Meneses, C., and Arriagada, C. (2019). The endophytic fungus Chaetomium cupreum regulates expression of genes involved in the tolerance to metals and plant growth promotion in Eucalyptus globulus roots. Microorganisms 7:490. doi: 10.3390/microorganisms7110490
Park, B. H., Karpinets, T. V., Syed, M. H., Leuze, M. R., and Uberbacher, E. C. (2010). CAZymes analysis toolkit (CAT): web service for searching and analyzing carbohydrate-active enzymes in a newly sequenced organism using CAZy database. Glycobiology 20, 1574–1584. doi: 10.1093/glycob/cwq106
Rueda-Mejia, M. P., Nägeli, L., Lutz, S., Hayes, R. D., Varadarajan, A. R., and Grigoriev, I. V.. (2021). Genome, transcriptome and secretome analyses of the antagonistic, yeast-like fungus Aureobasidium pullulans to identify potential biocontrol genes. Microbial Cell 8, 184–202. doi: 10.15698/mic2021.08.757
Schwyn, B., and Neilands, J. B. (1987). Universal chemical assay for the detection and determination of siderophores. Anal. Biochem. 160, 47–56. doi: 10.1016/0003-2697(87)90612-9
Selvig, K., and Alspaugh, J. A. (2011). pH response pathways in fungi: adapting to host-derived and environmental signals. Mycobiology 39, 249–256. doi: 10.5941/MYCO.2011.39.4.249
Songulashvili, G. G., Elisashvili, V., Wasser, S. P., Hadar, Y., and Nevo, E. (2008). Effect of the carbon source and inoculum preparation method on laccase and manganese peroxidase production in submerged cultivation by the medicinal mushroom Ganoderma lucidum (W. Curt.: Fr.) P. Karst. (Aphyllophoromycetideae). Int. J. Medicinal. Mushrooms, 10, 79–86. doi: 10.1615/IntJMedMushr.v10.i1.100
Takeda, K., Matsumura, H., Ishida, T., Samejima, M., Ohno, H., and Yoshida, M.. (2015). Characterization of a novel PQQ-dependent quinohemoprotein pyranose dehydrogenase from Coprinopsis cinerea classified into auxiliary activities family 12 in carbohydrate-active enzymes. PLoS One 10:e0115722. doi: 10.1371/journal.pone.0115722
Turgeman, T., Shatil, C. A., Moshelion, M., Teper-Bamnolker, P., Skory, C. D., and Lichter, A.. (2016). The role of aquaporins in pH–dependent germination of Rhizopus delemar spores. PLoS One 11:e0150543. doi: 10.1371/journal.pone.0150543
UniProt Consortium. (2023). UniProt: the Universal Protein Knowledgebase in 2023. Nucl. Acids. Res, 51: D523–D531. doi: 10.1093/nar/gkac1052
Várnai, A., Mäkelä, M. R., Djajadi, D. T., Rahikainen, J., Hatakka, A., and Viikari, L. (2014). Carbohydrate-binding modules of fungal cellulases: occurrence in nature, function, and relevance in industrial biomass conversion. Adv. Appl. Microbiol. 88, 103–165. doi: 10.1016/B978-0-12-800260-5.00004-8
Veneault-Fourrey, C., Commun, C., Kohler, A., Morin, E., Balestrini, R., and Plett, J.. (2014). Genomic and transcriptomic analysis of Laccaria bicolor CAZome reveals insights into polysaccharides remodelling during symbiosis establishment. Fungal Genet. Biol. 72, 168–181. doi: 10.1016/j.fgb.2014.08.007
Wang, L. J., Zhang, G. N., Xu, H. J., Xin, H. S., and Zhang, Y. G. (2019). Metagenomic analyses of microbial and carbohydrate-active enzymes in the rumen of Holstein cows fed different forage-to-concentrate ratios. Front. Microbiol. 10:649. doi: 10.3389/fmicb.2019.00649
Whitelaw, M. A., Harden, T. J., and Helyar, K. R. (1999). Phosphate solubilisation in solution culture by the soil fungus Penicillium radicum. Soil Biol. Biochem. 31, 655–665. doi: 10.1016/S0038-0717(98)00130-8
Wierzbicka-Woś, A., Henneberger, R., Batista-García, R. A., Martínez-Ávila, L., Jackson, S. A., and Kennedy, J.. (2019). Biochemical characterization of a novel monospecific endo-β-1, 4-glucanase belonging to GH family 5 from a rhizosphere metagenomic library. Front. Microbiol. 10:1342. doi: 10.3389/fmicb.2019.01342
Williams, G. J., Gantt, R. W., and Thorson, J. S. (2008). The impact of enzyme engineering upon natural product glycodiversification. Curr. Opin. Chem. Biol. 12, 556–564. doi: 10.1016/j.cbpa.2008.07.013
Wilson, C. M., Klingeman, D. M., Schlachter, C., Syed, M. H., Wu, C. W., and Guss, A. M.. (2017). LacI transcriptional regulatory networks in Clostridium thermocellum DSM1313. Appl. Environ. Microbiol. 83, e02751–e02716. doi: 10.1128/AEM.02751-16
Wright, S. P. (1992). Adjusted P-values for simultaneous inference. Biometrics 48, 1005–1013. doi: 10.2307/2532694
Xu, P., Fang, S., Chen, H., and Cai, W. M. (2020). The brassinosteroid-responsive xyloglucan endotransglucosylase/hydrolase 19 (XTH19) and XTH23 genes are involved in lateral root development under salt stress in Arabidopsis. Plant J. 104, 59–75. doi: 10.1111/tpj.14905
Yang, H., Chen, R., Chen, Y., Li, H., Wei, T., and Xie, W.. (2022). Agronomic and physiological traits associated with genetic improvement of phosphorus use efficiency of wheat grown in a purple lithomorphic soil. Crop J 10, 1151–1164. doi: 10.1016/j.cj.2021.11.010
Yeo, S., Park, N., Song, H. G., and Choi, H. T. (2007). Generation of a transformant showing higher manganese peroxidase (Mnp) activity by overexpression of Mnp gene in Trametes versicolor. J. Microbiol. 45, 213–218.
Zhang, C., Cai, K., Li, M., Zheng, J. Q., and Han, Y. Z. (2022). Plant-growth-promoting potential of PGPE isolated from Dactylis glomerata L. Microorganisms 10:731. doi: 10.3390/microorganisms10040731
Zhao, Z. T., Liu, H. Q., Wang, C. F., and Xu, J. R. (2014). Erratum to: comparative analysis of fungal genomes reveals different plant cell wall degrading capacity in fungi. BMC Genomics 15, 1–15. doi: 10.1186/1471-2164-15-6
Keywords: environmental pH, Rhizopus delemar , CAZymes, transcriptomics, growth and metabolism
Citation: Liang J, Chen Y, Li S, Liu D, Tian H, Xiang Q, Zhao K, Yu X, Chen Q, Fan H, Zhang L, Penttinen P and Gu Y (2024) Transcriptomic analysis and carbohydrate metabolism-related enzyme expression across different pH values in Rhizopus delemar. Front. Microbiol. 15:1359830. doi: 10.3389/fmicb.2024.1359830
Edited by:
Anna Muszewska, Polish Academy of Sciences, PolandReviewed by:
Yu Hua Gong, Huazhong Agricultural University, ChinaTao Peng, Shantou University, China
Copyright © 2024 Liang, Chen, Li, Liu, Tian, Xiang, Zhao, Yu, Chen, Fan, Zhang, Penttinen and Gu. This is an open-access article distributed under the terms of the Creative Commons Attribution License (CC BY). The use, distribution or reproduction in other forums is permitted, provided the original author(s) and the copyright owner(s) are credited and that the original publication in this journal is cited, in accordance with accepted academic practice. No use, distribution or reproduction is permitted which does not comply with these terms.
*Correspondence: Petri Penttinen, petri.penttinen@helsinki.fi; Yunfu Gu, guyf@sicau.edu.cn
†These authors have contributed equally to this work