 Chenyang Han
 Feng Zhang1†
 Yancun Zhao
 Xiaosan Huang
- 1State Key Laboratory of Crop Genetics and Germplasm Enhancement, College of Horticulture, Nanjing Agricultural University, Nanjing, China
- 2Institute of Plant Protection, Jiangsu Academy of Agricultural Sciences, Nanjing, China
N6-methylated adenine (m6A) is the most prevalent modification of mRNA methylation and can regulate many biological processes in plants, such as mRNA processing, development, and stress response. Some studies have increased our understanding of its various roles in model plants in recent years. Nevertheless, the distribution of m6A and the impact of m6A on the regulation of plant defense responses against pathogen inoculation are virtually unknown in pear. In this study, MeRIP-seq and RNA-seq data from healthy and inoculated plants were analyzed to assess the changes in the transcript levels and posttranscriptional modification of pear in response to the fire blight pathogen Erwinia amylovora. Following the analysis of 97,261 m6A peaks, we found that m6A preferred to modify duplicate genes rather than singleton genes and that m6A-methylated genes underwent stronger purifying selection. A total of 2,935 specific m6A sites were detected at the transcriptome level after inoculation, which may increase defense-related transcript abundance to enhance pear resistance. In addition, 1,850 transcripts were detected only in the mock-inoculated groups. The hypomethylated transcripts were mainly related to transcriptional regulation and various biological processes, such as chloroplast organization and sucrose biosynthetic processes. In addition, we found that the extent of m6A methylation was significantly positively correlated with the transcript level, suggesting a regulatory role for m6A in the plant response.
Introduction
Posttranscriptional modification is an important posttranscriptional regulatory mechanism through which RNA transcripts can be ensured to work normally at any given time (Wang et al., 2018; Arribas-Hernandez and Brodersen, 2020). N6-methylated adenine (m6A) is the most prevalent modification in mRNA methylation that can be regulated by transcription, splicing, and translation, accounting for 80% of total RNA methylation modifications (Kierzek and Kierzek, 2003; Fu et al., 2014). Since m6A was first found in the 1970s, it has been widely identified in bacteria, viruses, plants, fungi, and mammals (Jia et al., 2013; Liu et al., 2014; Zheng et al., 2020). m6A modification is a dynamically reversible process regulated by a number of proteins, including methyltransferases (writers), demethylases (erasers), and m6A-binding proteins (readers), which act synergistically to regulate the abundance of m6A (Dominissini et al., 2012; Luo et al., 2014; Yue et al., 2019). Writers and erasers can bind the conserved consensus sequence RRACH (R = A or G; H (=A, U, or C) to add and remove m6A modification, and these modified RNAs eventually perform various functions by the binding of readers to m6A sites (Schwartz et al., 2013; Li et al., 2014; Parker et al., 2020). Following the discovery of the first m6A writer (METTL3) in mammals, a series of m6A-related enzymes have been found. METTL3 and METTL14 together form a heterodimer with the support of cofactors to induce m6A methylation (Bokar et al., 1994; Liu et al., 2014). The discovery of the first m6A eraser, obesity-associated protein (FTO), proves that RNA modification is dynamically reversible, but in recent studies, N6,2′-O-dimethyladenosine (m6Am) was proven to be the substrate of FTO (Jia et al., 2011; Mauer et al., 2017). The second identified m6A demethylase, ALKBH5, shows demethylation activity similar to that of FTO and is connected with cancer pathogenesis (Zheng et al., 2013). m6A readers exert a more specific regulatory function by binding m6A modification sites on RNA (Dominissini et al., 2012). RNA processing is also affected by m6A reader proteins; two kinds of m6A readers, YTHDF and YTHDC, can bind to the m6A sites in mRNA to implement the biological function of methylation modifications (Du et al., 2016; Patil et al., 2018; Scutenaire et al., 2018). It has now become clear that this reversible posttranscriptional modification is indispensable for gene regulation.
At present, research on plant m6A is mainly in mammalian systems and rarely in plants. Previously, several studies have investigated the role of m6A in mRNA stability, plant growth and development, and stress processes (Arribas-Hernandez and Brodersen, 2020). Some evidence suggests that plants display a different m6A modification pattern than animals. In Arabidopsis, MTA (METTL3 human homologue protein), MTB (METTL14 human homologue protein), FIP37 (WTAP human homologue protein), VIRILIZER (KIAA1429 human homologue protein), and HAKAI (HAKAI human homologue protein) are considered the five components of m6A writers (Liu et al., 2014; Kan et al., 2017; Ruzicka et al., 2017; Arribas-Hernandez et al., 2018; Scutenaire et al., 2018). The lack of MTA and MTB results in a decrease in m6A-modified mRNAs. Another member of the core m6A methylation family, the MTA-interacting protein FIP37, plays an important role in embryonic development and shoot stem cell fate (Vespa et al., 2004; Anderson et al., 2018). Inhibition of the expression of VIRILIZER and HAKAI resulted in a decrease in the level of m6A in Arabidopsis (Ruzicka et al., 2017). However, the number of m6A enzymes found to date in plants is small relative to the number in animals. Complex m6A modifications in plants suggest that some components of the m6A system are undetected, and the major m6A eraser FTO in mammals has not been found in plants (Hofmann, 2017; Yue et al., 2019). To date, it has been found that members of the ALKB family could be m6A erasers in plants. ALKBH9B and ALKBH10B are considered to be important components involved in the demethylation of Arabidopsis, and they were shown to revert m6A to adenosine (Duan et al., 2017; Martinez-Perez et al., 2017). Among the most important m6A readers, the ECT family in Arabidopsis contains a YTH domain to recognize m6A sites (Arribas-Hernandez et al., 2018). The binding ability of ECT2 to m6A depends on a tritryptophan pocket in plants, and it also improves the stability of m6A-methylated RNAs transcribed from genes related to trichome morphogenesis. In addition to RRACH, plants possess a specific consensus motif, URUAY (R (=A or G; Y (=U or C), which can be recognized by the m6A reader ECT2 (Scutenaire et al., 2018; Wei et al., 2018).
Methylated RNA immunoprecipitation with high-throughput sequencing (MeRIP-Seq) provides an effective method to further analyze the function of m6A modifications in plants (Cooper, 2012; Luo et al., 2014). By this method, it has been found that m6A can be selectively added to salt response proteins under salt stress (Anderson et al., 2018; Zheng et al., 2021). Although these studies have demonstrated the importance of m6A in plant growth and stress responses, whether m6A modifications can stabilize mRNAs is still controversial (Anderson et al., 2018).
Fire blight caused by Erwinia amylovora is one of the most damaging diseases on pear and other Rosaceae (Born et al., 2017; Schachterle and Sundin, 2019). Understanding the mechanistic basis of this host–pathogen interaction is imperative for elucidating the pathogenesis of fire blight. However, the underlying molecular mechanism of the resistance and susceptibility of pear to Erwinia amylovora is largely unknown (McNally et al., 2012). In this study, we focused on the changes in m6A modifications and mRNA levels in pear after fire blight inoculation by transcriptome sequencing (RNA-seq) and MeRIP-Seq. The expression changes at different points during inoculation revealed that plants activate immune responses rapidly, as early as 3 h after inoculation, and substantial changes were detected in gene expression levels. After a period of time, the plant immune response entered a stable period and then changed again 3 days later. These transcription-level changes attracted our interest. Next, we focused on the regulation of gene transcription and mRNA modification in pear throughout the defense processes. m6A methylation was shown to be dynamic and reversible through MeRIP-Seq. We found that m6A modifications can be selectively added to defense-related genes to increase expression abundance after fire blight inoculation. In addition, m6A modification was removed from a considerable number of transcripts during inoculation, including DNA-binding transcription factors and genes related to transcriptional regulation. Finally, we further confirmed that gene expression is positively correlated with m6A abundance.
Materials and Methods
Samples Collected for RNA-Seq and Methylated RNA Immunoprecipitation With High-Throughput Sequencing
Tissue-cultured plantlets of pear were cultivated in State Key Laboratory of Crop Genetics and Germplasm Enhancement in Nanjing Agricultural University. The fire blight pathogen was lyophilized and stored at −80°C in a freezer. Before their use, they were streaked on NA agar plates and cultured in liquid LB medium at 28°C for 16 h. Plant samples were collected at 3, 12, 24, 48, and 72 h post-inoculation and uninoculated seedlings were used as controls (mock); each time point had three duplications (three plants per replicate; 18 samples in total). The plants were grown in MS medium in growth chambers with 16 h of light and 8 h of darkness at 26°C with a relative humidity of 80%. The leaves were immediately frozen in liquid nitrogen and stored at −80°C until further use. These samples were used for RNA-seq and the same samples (mock, 12 HPI) were used to for MeRIP-Seq.
RNA-Seq and Data Analysis
RNA extraction and sequencing were done by Novogene Corporation (Nanjing, China). Total RNA was isolated using the Plant RNA Isolation Kit (Macrogene). RNA purity was checked using the NanoPhotometer spectrophotometer (IMPLEN, CA, United States). RNA concentration was measured using Qubit RNA Assay Kit in Qubit 2.0 Flurometer (Life Technologies, CA, United States). RNA integrity was assessed using the RNA Nano 6000 Assay Kit of the Bioanalyzer 2100 system (Agilent Technologies, CA, United States). A total amount of 3 μg RNA per sample was used as input material for the RNA sample preparations. Sequencing libraries were generated using NEBNext Ultra RNA Library Prep Kit for Illumina (NEB, United States). The library preparations were sequenced on an Illumina Hiseq platform and 125 bp/150 bp paired-end reads were generated.
Raw data (raw reads) of fastq format were firstly processed through in-house perl scripts and clean reads were obtained by removing reads containing adapter, reads containing ploy-N, and low-quality reads from raw data. For each sample, Q30, Q20, and GC content were calculated; all the downstream analyses were based on the clean data. The clean reads were aligned to the Chinese white pear genome (cv. “Dangshansuli”) using HISAT2 (Kim et al., 2015). The read counts of each sample were obtained by FeatureCounts (Liao et al., 2013). Finally, read counts were normalized to tags per million (TPM) by Tbtools (Chen et al., 2020). Correlation analysis of m6A writers, erasers, and readers under drought treatment and cold treatment was calculated using cor (a function in R).
Differential Gene Expression and Enrichment Analysis
The read counts were used to perform differential gene expression analysis with DESeq2 R package (v1.30.1). GO (Gene Ontology) and KEGG (Kyoto Encyclopedia of Genes and Genomes) pathway enrichment analysis was performed with KOBAS software (Xie et al., 2011)1.
Methylated RNA Immunoprecipitation With High-Throughput Sequencing and Data Analysis
MeRIP-Seq was performed by Cloudseq Biotech Inc. (Shanghai, China) according to the published procedure with slight modifications. Briefly, fragmented RNA was incubated with anti-m6A polyclonal antibody (Synaptic Systems, 202003) in IPP buffer for 2 h at 4°C. The mixture was then immunoprecipitated by incubation with protein-A beads (Thermo Fisher Scientific) at 4°C for an additional 2 h. Then, bound RNA was eluted from the beads with N6-methyladenosine (BERRY and ASSOCIATES, PR3732) in IPP buffer and then extracted with Trizol reagent (Thermo Fisher Scientific) by following the manufacturer’s instruction. Purified RNA was used for RNA-seq library generation with NEBNext Ultra RNA Library Prep Kit (NEB). Both the input sample without immunoprecipitation and the m6A IP samples were subjected to 150 bp paired-end sequencing on Illumina HiSeq sequencer.
The raw reads were retrieved as clean reads using the Cutadapt software tool (v1.9.3). The clean reads of input and IP libraries were mapped to genome by HISAT2 (Kim et al., 2015). Methylated sites on RNAs (peaks) were identified by MACS software (Zhang et al., 2008). Differentially methylated sites were identified by diffReps (Shen et al., 2013). Consensus sequence motifs enriched in m6A peaks were identified by MEME2. The visualization of the m6A abundance was present by Integrative Genomics Viewer (IGV). The circos plot of m6A peaks and DEPs across chromosomes were generated using the circos package in R.
Duplicated Gene Pairs Identification and Ka/Ks Calculation
A gene duplication analysis was conducted in pear genome and m6A genes, and the method was proposed by Qiao et al. (2019) The DupGen_finder pipeline was used to identify the different modes of duplicated gene pairs3, and the genome of Vitis vinifera was used as outgroup (Jaillon et al., 2007). To determine the duplication type of each gene, we used DupGen_finder-unique to assign the duplicate genes to a unique mode (Qiao et al., 2019). The priority of the duplicate genes is as follows: WGD > tandem > proximal > transposed > dispersed. The Ka/Ks ratio was calculated using the calculate_Ka_Ks_pipelin (Wang et al., 2010).
LC-MS/MS Quantification of RNA Modification in Total RNA
LC-MS/MS analysis refers to the means of Adams et al. (2020) with minor modifications. Total RNA (1 μg) was digested by buffer 1 (300 mM CH3COONa, 2,800 mM NaCl, 10 mM ZnSO4, pH 4.6), 1 μl of the S1 nuclease (180 U/μl) was added, and the samples were incubated at 37°C for 4 h. Then 10 μl buffer 2 (500 mM Tris–HCl, 10 mM MgCl2, pH 9.0) was added, followed by the addition of 5 μl Venom phosphodiesterase I (0.002 U/μl) and 1 μl alkaline phosphatase (30 U/μl). The samples were incubated again at 37°C for 2 h. The nucleosides were separated by reverse phase high-performance liquid chromatography on an Agilent C18 column, coupled with mass spectrometry detection using AB SCIEX QTRAP 5500. The m6A levels were calculated as the ratio of m6A to A based on the calibrated concentrations according to the standard curve obtained from pure nucleoside standards running with the same batch of samples.
qRT-PCR and m6A-IP-qPCR
For qRT-PCR, total RNA extraction and the synthesis of cDNA were according to the instructions of RNA kit (Tiangen, Beijing, China) and PrimeScript RT reagent kit (Trans Gen). qRT-PCR was performed using a LightCycler 480 SYBR-GREEN I Master (Roche, United States), and tubulin (Tub) is used as the reference genes. m6A-IP–qPCR was performed as previously described (Dominissini et al., 2013) immediately after m6A-IP enrichment. The same amount of the concentrated IP RNA or input RNA from each sample was used for the cDNA library. The relative m6A enrichment in genes were calculated by the m6A levels (m6A IP) normalized using the input of each gene. Relative levels of genes were calculated using the 2–ΔΔCt method. The primers are shown in Supplementary Table 12.
Results
Transcriptome Sequencing Revealed Rapid Transcriptional Changes in the Pear Response in the Early Stage After Fire Blight Inoculation
To begin studying the possibility that pear responds to fire blight, we inoculated Erwinia amylovora into pear seedlings, and LB liquid medium was inoculated to serve as a mock inoculation. The seedlings were observed for 72 h post-inoculation (HPI). Disease symptoms developed at 12 HPI, and mild lesions were observed at the inoculation site (Figure 1A). Notably, before significant lesions were found in leaves, the stems were infected and melanized at 48 HPI (red circle; Figure 1A). The leaves developed clear symptoms of inoculation at 72 HPI; subsequently, the stem base became completely black, and the entire plant wilted. Samples were collected at 0 (preinoculation), 3, 12, 24, 48, and 72 HPI for transcriptome sequencing, and each time point contained three replicates. From these samples, approximately 1.62 billion raw reads were produced. Following filtering, 1.59 million high-quality-filtered (clean) reads proceeded to the next step of the study, and the average read count for each sample ranged from approximately 40 to 63 million. The resulting clean reads were aligned against the Chinese white pear genome (Wu et al., 2013) (cv. “Dangshansuli”), with mapping rates ranging from 76.64 to 79.22% (Supplementary Table 1).
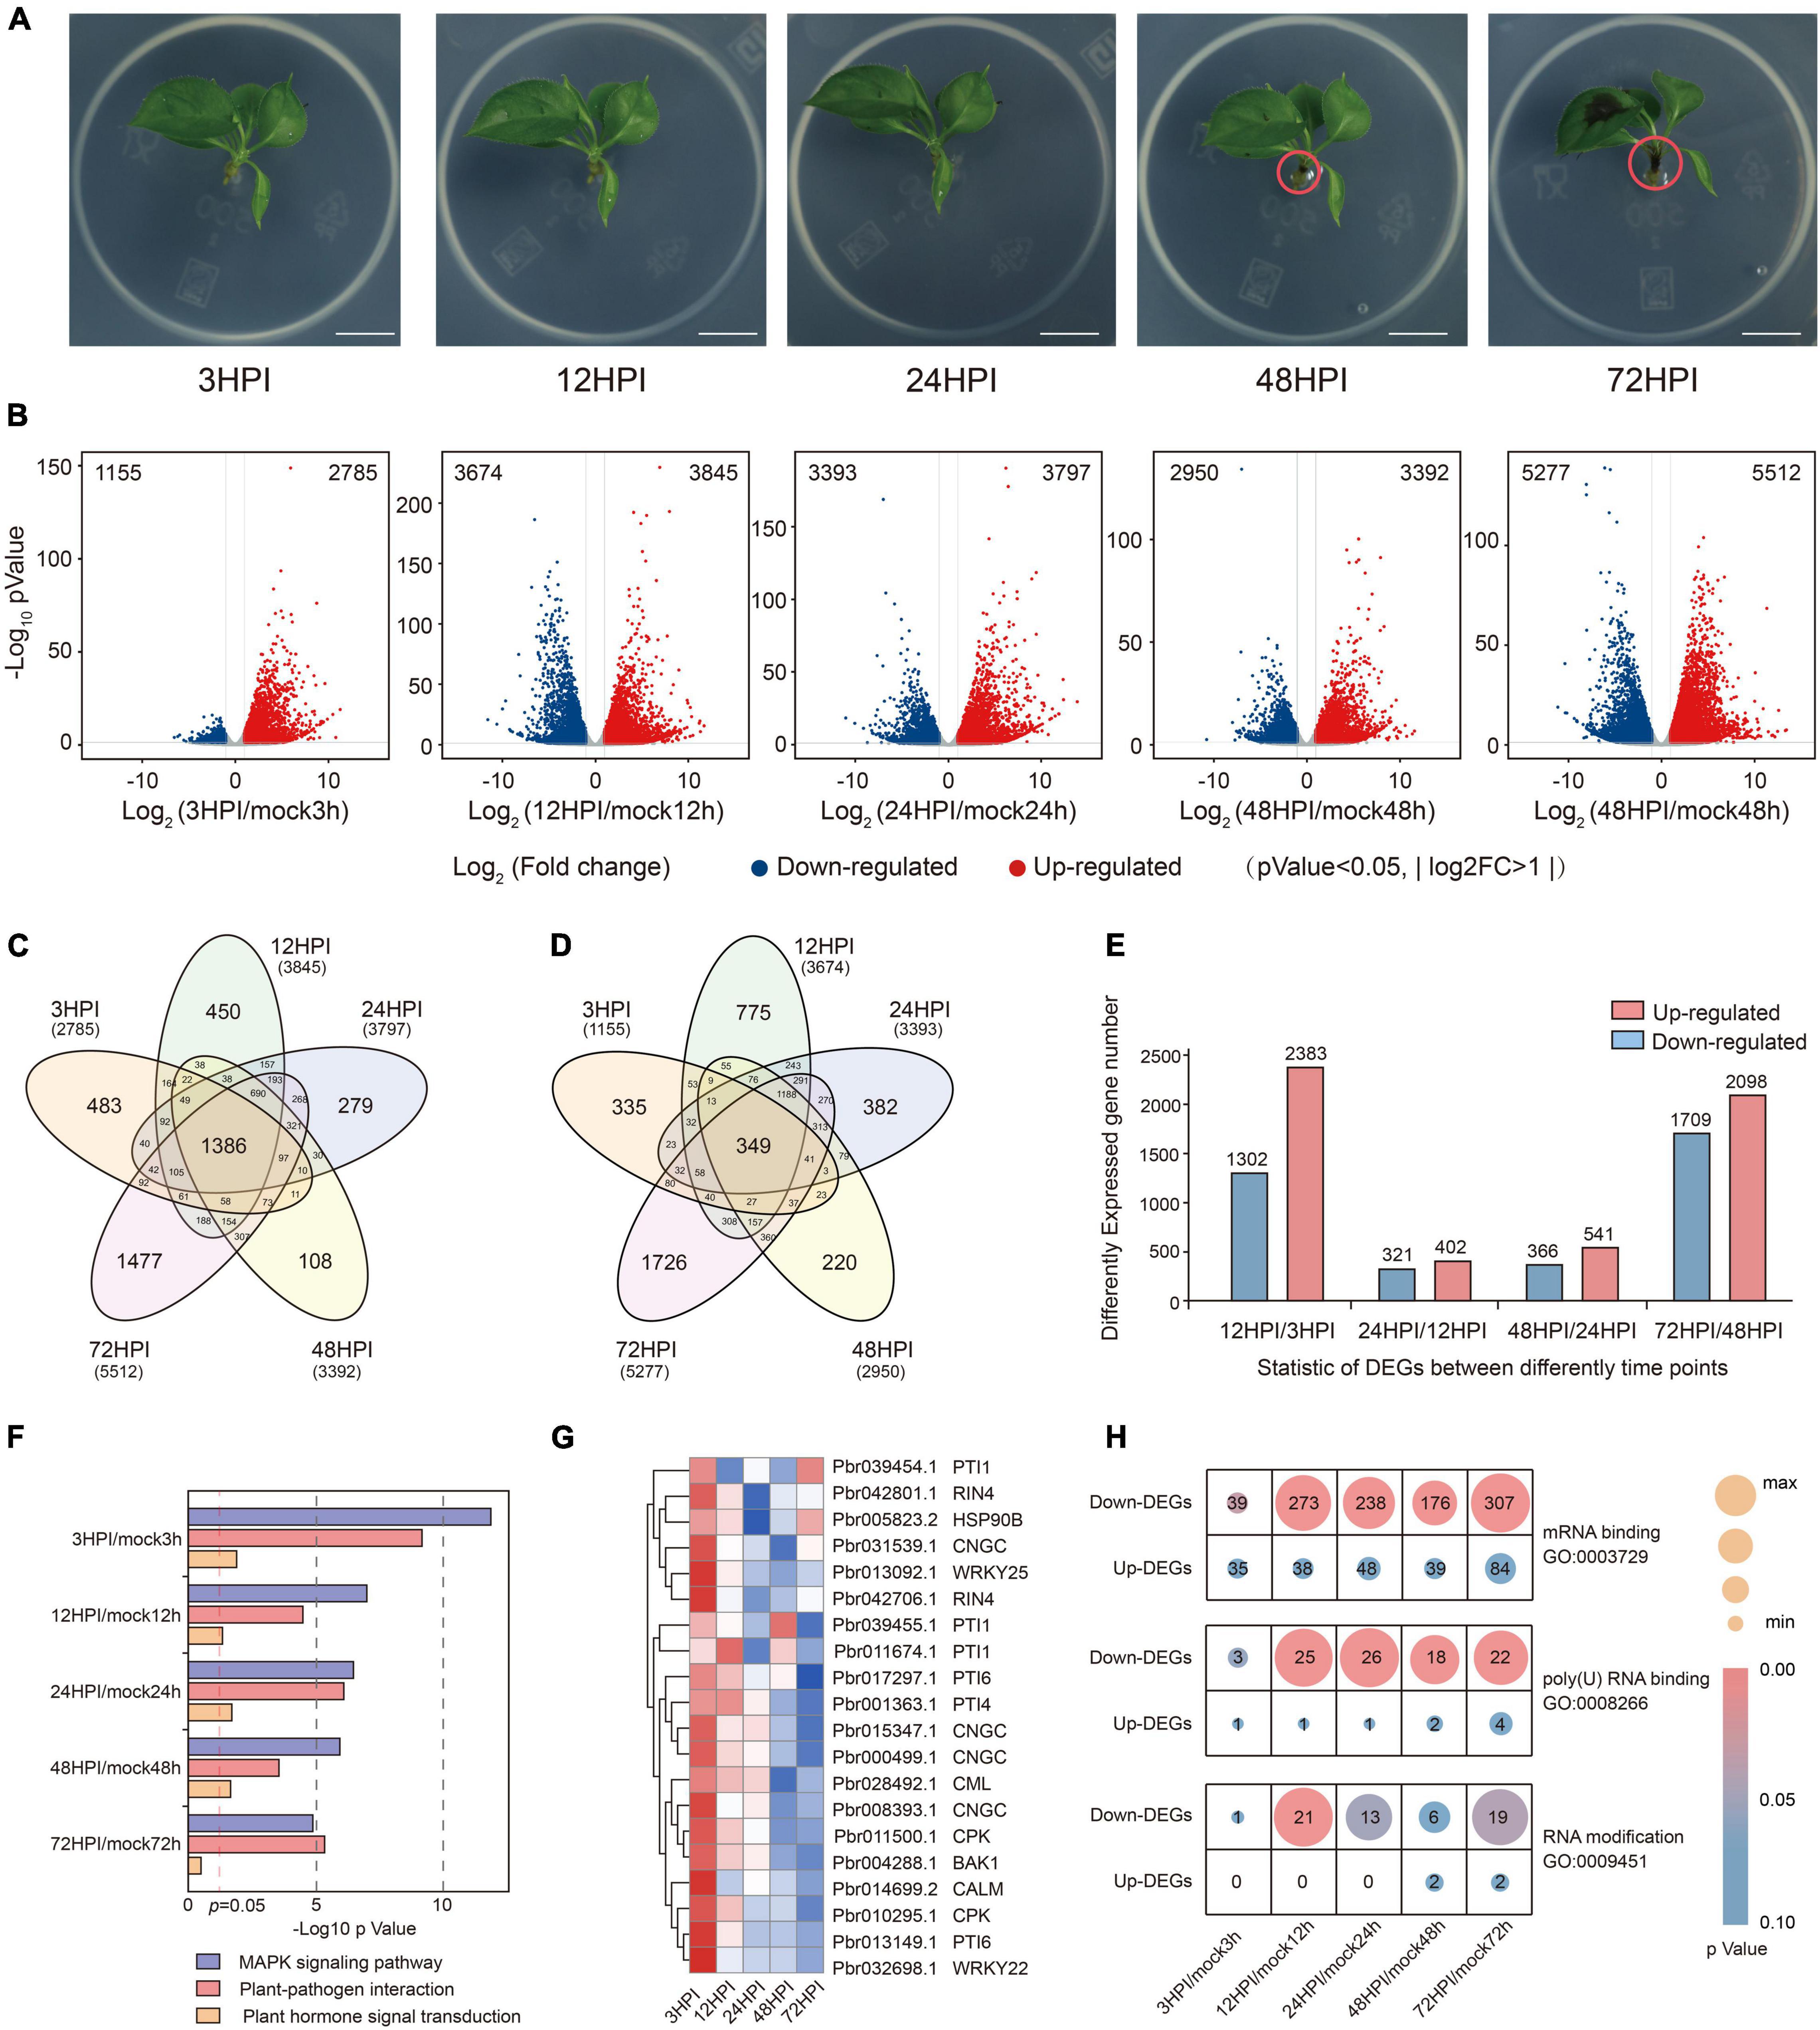
Figure 1. Significant changes in transcription levels after fire blight inoculation. (A) Images of pear seedlings after fire blight inoculation at 3 HPI, 12 HPI, 24 HPI, 48 HPI, and 72 HPI. Scale bar = 1 cm. (B) Volcano plot of DEGs (differentially expressed genes) between Erwinia amylovora–inoculated and mock-inoculated at different time points. (C,D) Venn diagram showing the number of DGEs identified between Erwinia amylovora–inoculated and mock-inoculated at different time points. (C) Upregulation. (D) Downregulation. (E) The bars indicate the number of DEGs between samples from adjacent time points, red indicates upregulation, and blue indicates downregulation. (F) KEGG pathway analysis of upregulated genes in plant hormone signal transduction, plant–pathogen interaction, and MAPK signaling pathway. (G) Expression profiles of DEGs related with plant–pathogen interaction pathway. (H) Gene number of DEGs involved in GO term mRNA binding (GO:0003723), poly(U) RNA binding (GO:0008266), and RNA modification (GO: 0009451).
Differential expression results were generated using DESeq2, and gene expression was quantified using transcripts per million (TPM). Genes with expression | fold change| > 2 (p < 0.05) were considered to be differentially expressed compared with the previous time point, and they were visualized through volcano plots (Figure 1B). In total, 3,940 (2,785 were upregulated and 1,155 were downregulated), 7,519 (3,674 were upregulated and 3,845 were downregulated), 7,190 (3,393 were upregulated and 3,797 were downregulated), 6,342 (2,950 were upregulated and 3,392 were downregulated), and 10,789 (5,277 were upregulated and 5,512 were downregulated) differentially expressed genes (DEGs) were identified at 3, 12, 24, 48, and 72 HPI (Figure 1B). We next compared DEGs among different time points; indeed, 72 HPI had the largest number of genes among all of the DEGs in the mock- and Ea-inoculated groups (Figures 1C,D). This result suggested that relatively little change occurred in the initial stage of inoculation. To test this hypothesis, the same method was performed to determine which pairs of adjacent time points differed significantly from each other by DESeq2 (Figure 1E). Analysis of these DEGs revealed a significant difference after inoculation, and these changes were particularly pronounced during early stages of fire blight inoculation (within 12 h). However, changes were less apparent from 12 to 48 HPI, after which they started to rise again at 72 HPI. To learn more about the changes during plant defense, we focused on the three KEGG pathways associated with plant defense, including the MAPK signaling pathway, plant–pathogen interaction, and plant hormone signal transduction. It was found that the enrichment of the MAPK signaling pathway and plant–pathogen interaction decreased with time, and the gene expression level declined over time (Figures 1F,G), possibly indicating that the defense response to fire blight is initially intense and wanes over time. The identified DEGs were subjected to gene ontology (GO) analysis (Supplementary Table 2), and the GO terms with high fold enrichment in upregulated DEGs at 3 HPI were “defense response to bacterium (GO: 0042742)” and “defense response (GO: 0006925),” which indicated that the defense response of plants was very rapid, occurring within 3 h. At consecutive time points, GO analysis indicated that the enriched GO terms in upregulated mRNAs were mainly associated with the defense response. Studies have reported that fire blight inoculation can induce an increase in jasmonic acid levels in apple (Kamber et al., 2016). We found significant enrichment of jasmonic acid–related GO terms, including jasmonic acid biosynthetic process (GO:0009695) and response to jasmonic acid (GO:0009753), in upregulated DEGs during the entire inoculation process. Interestingly, the number of DEGs decreased significantly from 12 to 48 HPI. Therefore, we hypothesized that the defense responses of plants reached a steady state between 12 and 48 HPI. In a recent study, it was reported that m6A has an impact on the resistance of apple to powdery mildew (Guo et al., 2021). Subsequently, we counted the RNA-related genes annotated by the GO terms “mRNA binding (GO:0003729),” “poly(U) RNA binding (GO:0008266),” and “RNA modification (GO:0009451)” in DEGs and found that they were enriched, especially after 12 HPI (Figure 1H). We hypothesize that fire blight inoculation might affect the transcription and stability of the mRNA and that plants might control mRNA levels by regulating the modification of mRNA. These results indicate that plants responded very quickly to fire blight inoculation. After a period of stability, the response of plants again became apparent with increasing inoculation severity.
The Expression Pattern Changes of m6A Regulators Suggest That m6A Plays a Role During Fire Blight Inoculation
Gene expression is regulated by multiple posttranscriptional modifications, such as m6A (Shi et al., 2017). The m6A modification is mediated by the concerted action of m6A writers, erasers, and readers. We used the same methodology presented by Yue et al. (2019) to identify the m6A regulators in pear, including 11 writers, 8 erasers, and 17 readers (Supplementary Table 3). The number of m6A regulators was much greater than that in Arabidopsis due to recent whole-genome duplications (WGD) in pear. Notably, the m6A writers (MTA, MTB, MTC, FIP37, VIR, HAKAI) in pear were almost double those in Arabidopsis. These duplicate genes have survived WGD, and it is unclear whether they can regulate m6A methylation through different molecular regulatory mechanisms. We analyzed the Ka (number of substitutions per non-synonymous site), Ks (number of substitutions per synonymous site), and Ka/Ks values to detect the selection pressure acting on m6A regulators. The Ka/Ks values of all the m6A regulators were less than one, indicating that these genes evolved through purifying selection (Supplementary Table 4). We further examined whether fire blight inoculation affects the expression of m6A regulators, and the RNA levels were tested by qRT-PCR. The expression pattern of m6A writers was significantly downregulated after inoculation (Figure 2A and Supplementary Figure 1A). In addition, we found high correlations among these m6A regulators, such as PbrMTA1 and PbrFIP37 (Figure 2B and Supplementary Figure 1B).
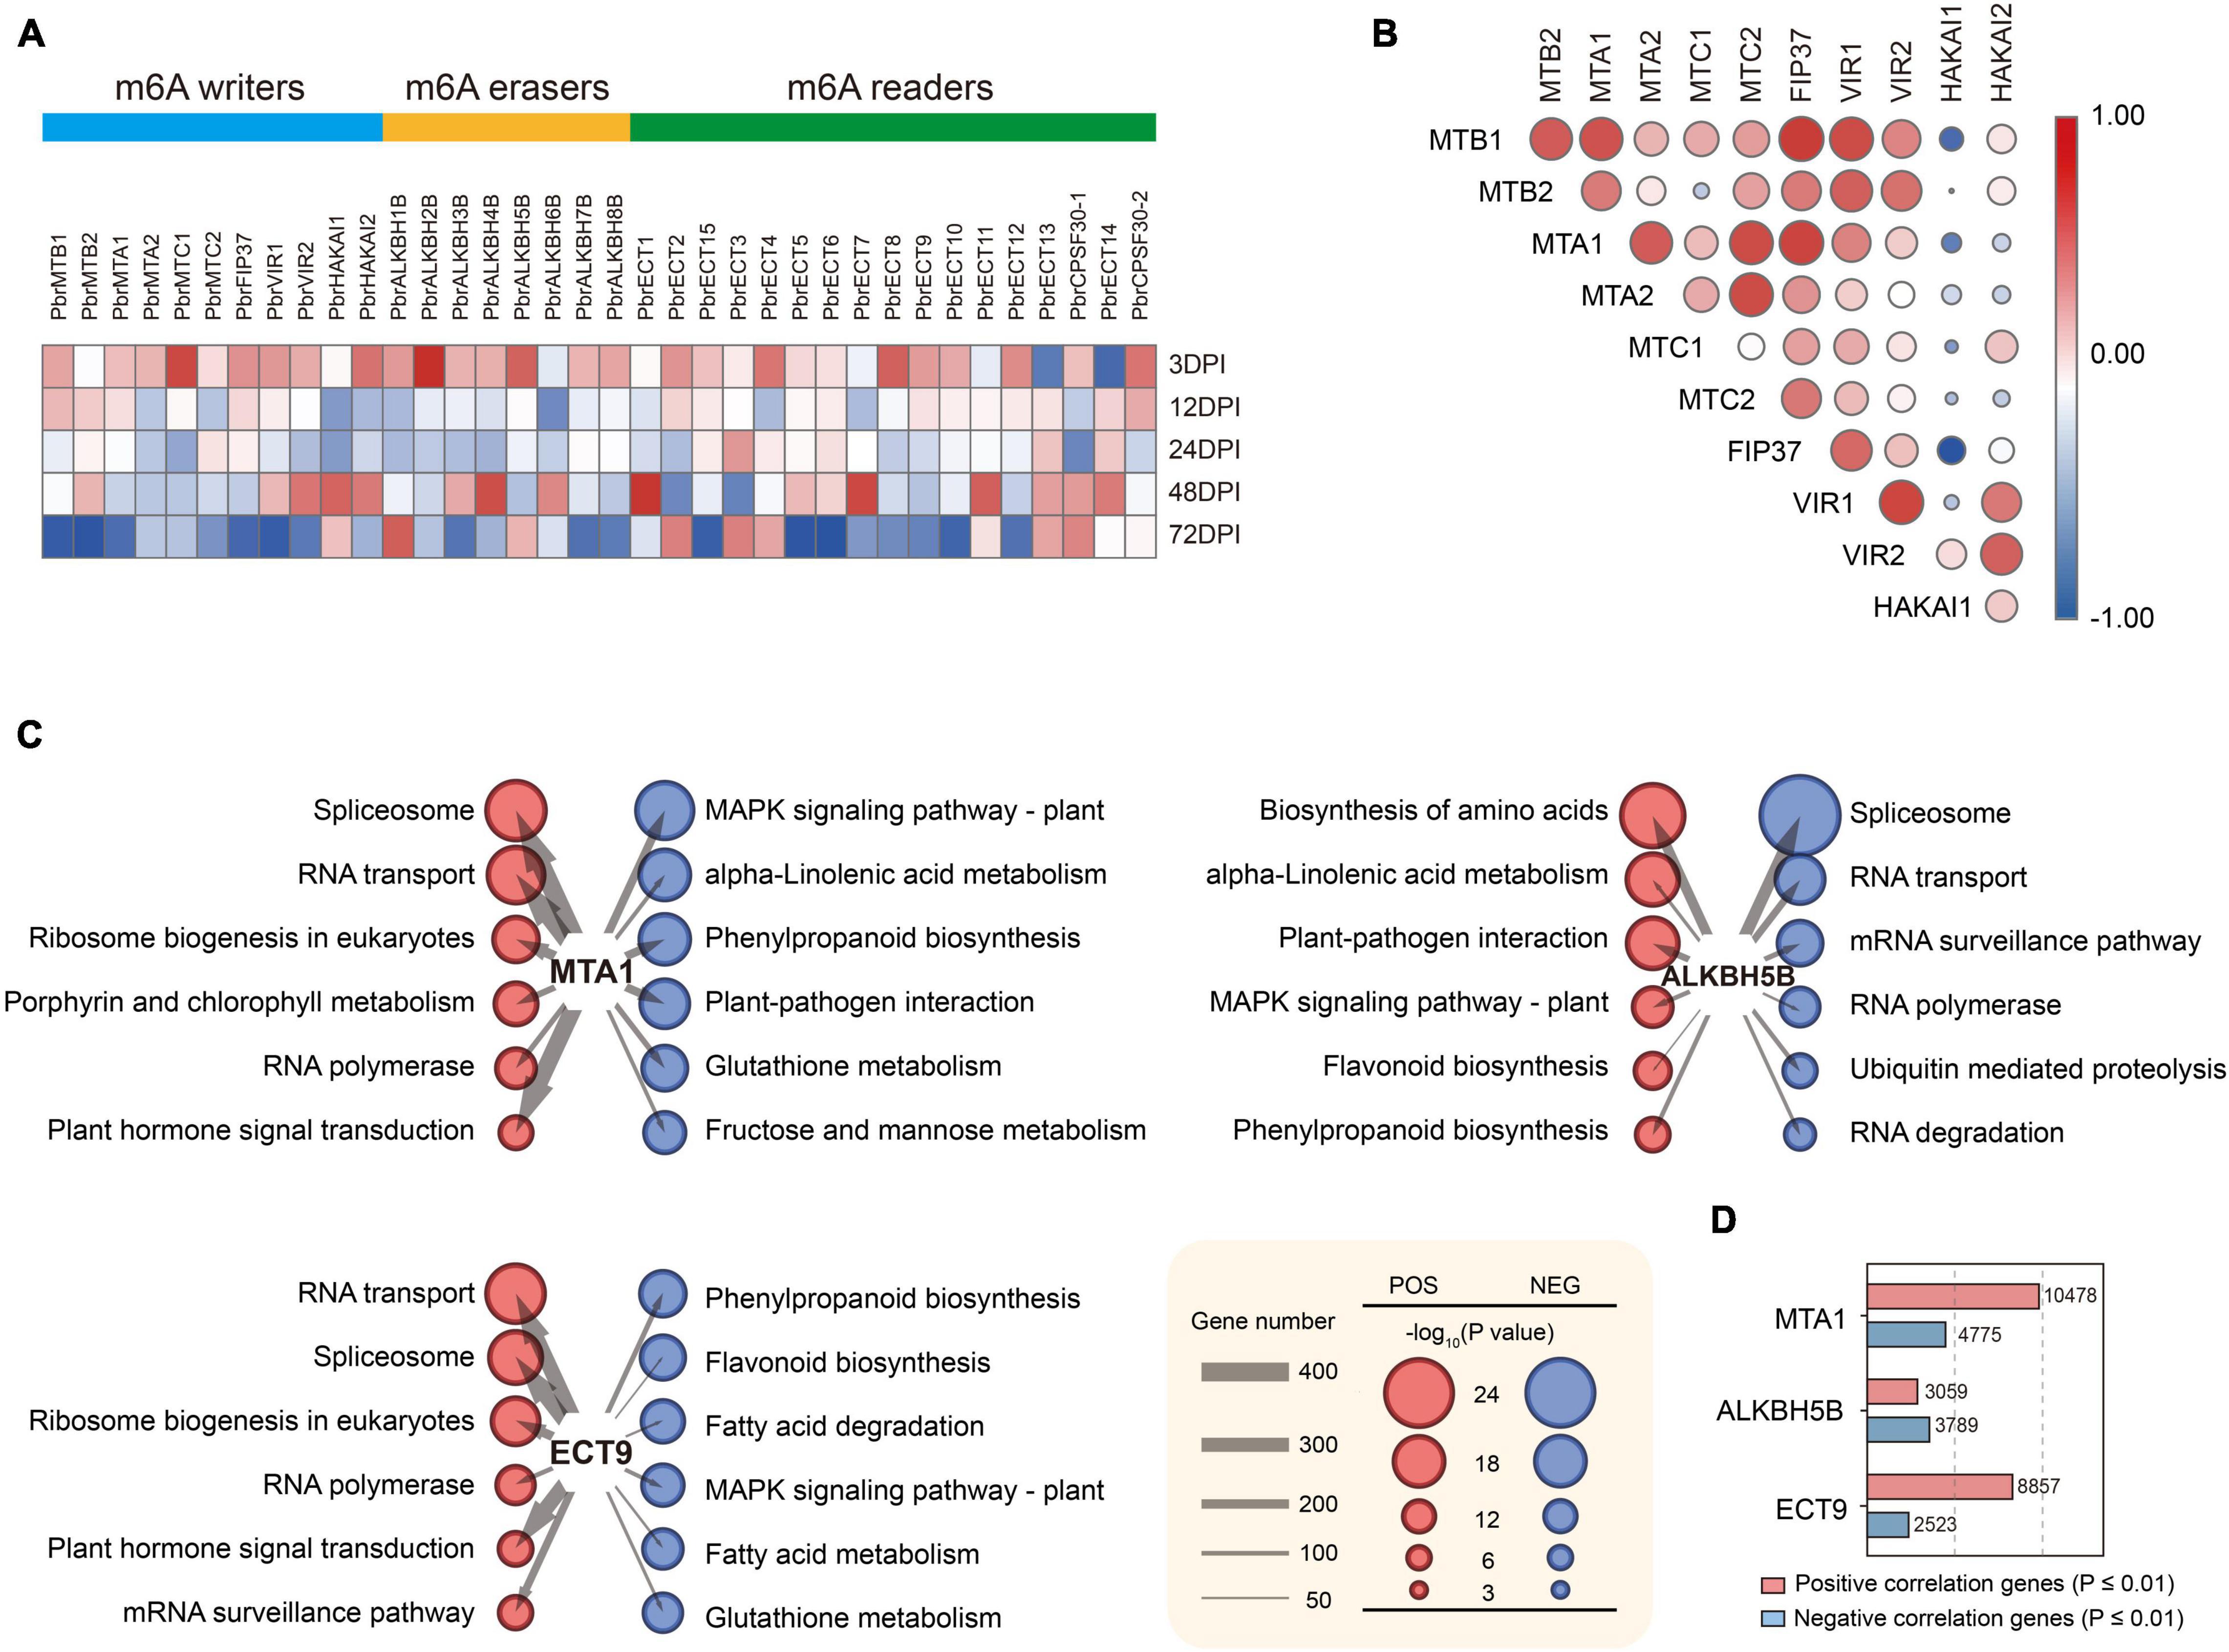
Figure 2. Expression alterations of m6A writers, erasers, and readers in pear after fire blight inoculation. (A) Heat map of RNA-Seq expression of m6A regulators. Color scale of the dendrogram represents the scale value of TPM, normalized expression data expressed as log2 (TPM+1) values. (B) Correlation among the expression of m6A regulators. (C) Network diagram demonstrating the correlation between m6A regulators and signaling pathways. Red represents a positive correlation, and blue represents a negative correlation. The size of the nodes corresponds to the number of genes enriched in the entry. The size of the circles corresponds to -log10(p-value) of KEGG pathways. (D) Number of genes that significantly correlated with MTA1, ALKBH5B, and ECT9.
m6A Regulators Were Significantly Associated With RNA- and Defense-Related Pathways
To further study which signaling pathways are associated with m6A regulators, we performed a coexpression network analysis to illuminate the collaboration between m6A regulators and bulk mRNA data in 30 transcriptome samples. Pearson correlations between behavioral test scores were calculated using the corr.test. Here, MTA1, ALKBH5B, and ECT9 showed significant correlations (p-value ≤ 0.01) with a large set of genes (Figure 2D), and these genes were then employed for KEGG enrichment analysis (Figure 2C). We found that the expression of m6A regulators was correlated with multiple RNA-related signaling pathways, such as spliceosome, RNA transport, and RNA polymerase. The results revealed that the RNA-related signaling pathways were negatively correlated with the m6A writer MTA but positively correlated with the m6A eraser ALKBH5B and the m6A reader ECT9. Notably, MTA and ALKBH5B were also associated with plant–pathogen interactions, MAPK signaling pathways, alpha-linolenic acid metabolism, and flavonoid biosynthesis. In addition, protein–protein interaction (PPI) analysis showed frequent interactions among these writers, erasers, and readers (Supplementary Figure 1C). Among them, m6A writers had the highest number of interactions. Taken together, these results suggest that the cross-talk among the m6A regulators plays critical roles during fire blight inoculation.
Transcriptome-Wide m6A Methylation Profiles in Pear
Based on the expression changes of m6A regulator levels in the progression of fire blight inoculation, we performed MeRIP-seq to profile a transcriptome-wide m6A map of pear. This series included mock-inoculated control plants (mock) and fire blight–infected plants (12 HPI), and each group had three biological repeats (Supplementary Table 5). After alignment to the Chinese white pear reference genome (cv. “Dangshansuli”), a total of 97,261 m6A peaks were identified in mock plus treatment plants using MACS2 (Supplementary Table 6). At the genome level, m6A modifications were not evenly distributed across each chromosome, and the Circos plot showed good repeatability among sequencing samples (Supplementary Figures 2A,B). The m6A-modified gene transcripts consistently detected in three biological replicates were considered high-confidence genes; in total, 10,544 mock-specific genes and 10,729 12 HPI-specific genes were used in subsequent studies. We found that m6A modifications were highly enriched around the start and stop codons in pear (Figure 4A), consistent with the m6A distribution in Arabidopsis and tomato (Wan et al., 2015; Zhou et al., 2019). We detected the enrichment of m6A modifications in gene transcripts; most (74.91%) contained only a single m6A peak, 21.22% contained two m6A peaks, 3.21% exhibited three peaks, and 0.67% exhibited more than three peaks (Figure 4B), demonstrating that m6A modifications are highly conserved in pear. Reads were visualized using IGV to check repeatability among sequencing samples, and the results showed good repeatability among each sample (Figure 4C). MEME was used to identify sequence motifs enriched within the m6A peaks, and previously established motifs RRACH and UGUAYY were identified in pear as in Arabidopsis (Bailey et al., 2006; Figure 4D). We also examined the distribution of m6A modifications in inoculated plants (Supplementary Figure 3). The results showed that fire blight inoculation was unlikely to have a high impact on the m6A modification position in transcripts, and m6A modifications were enriched near the start and stop codons.
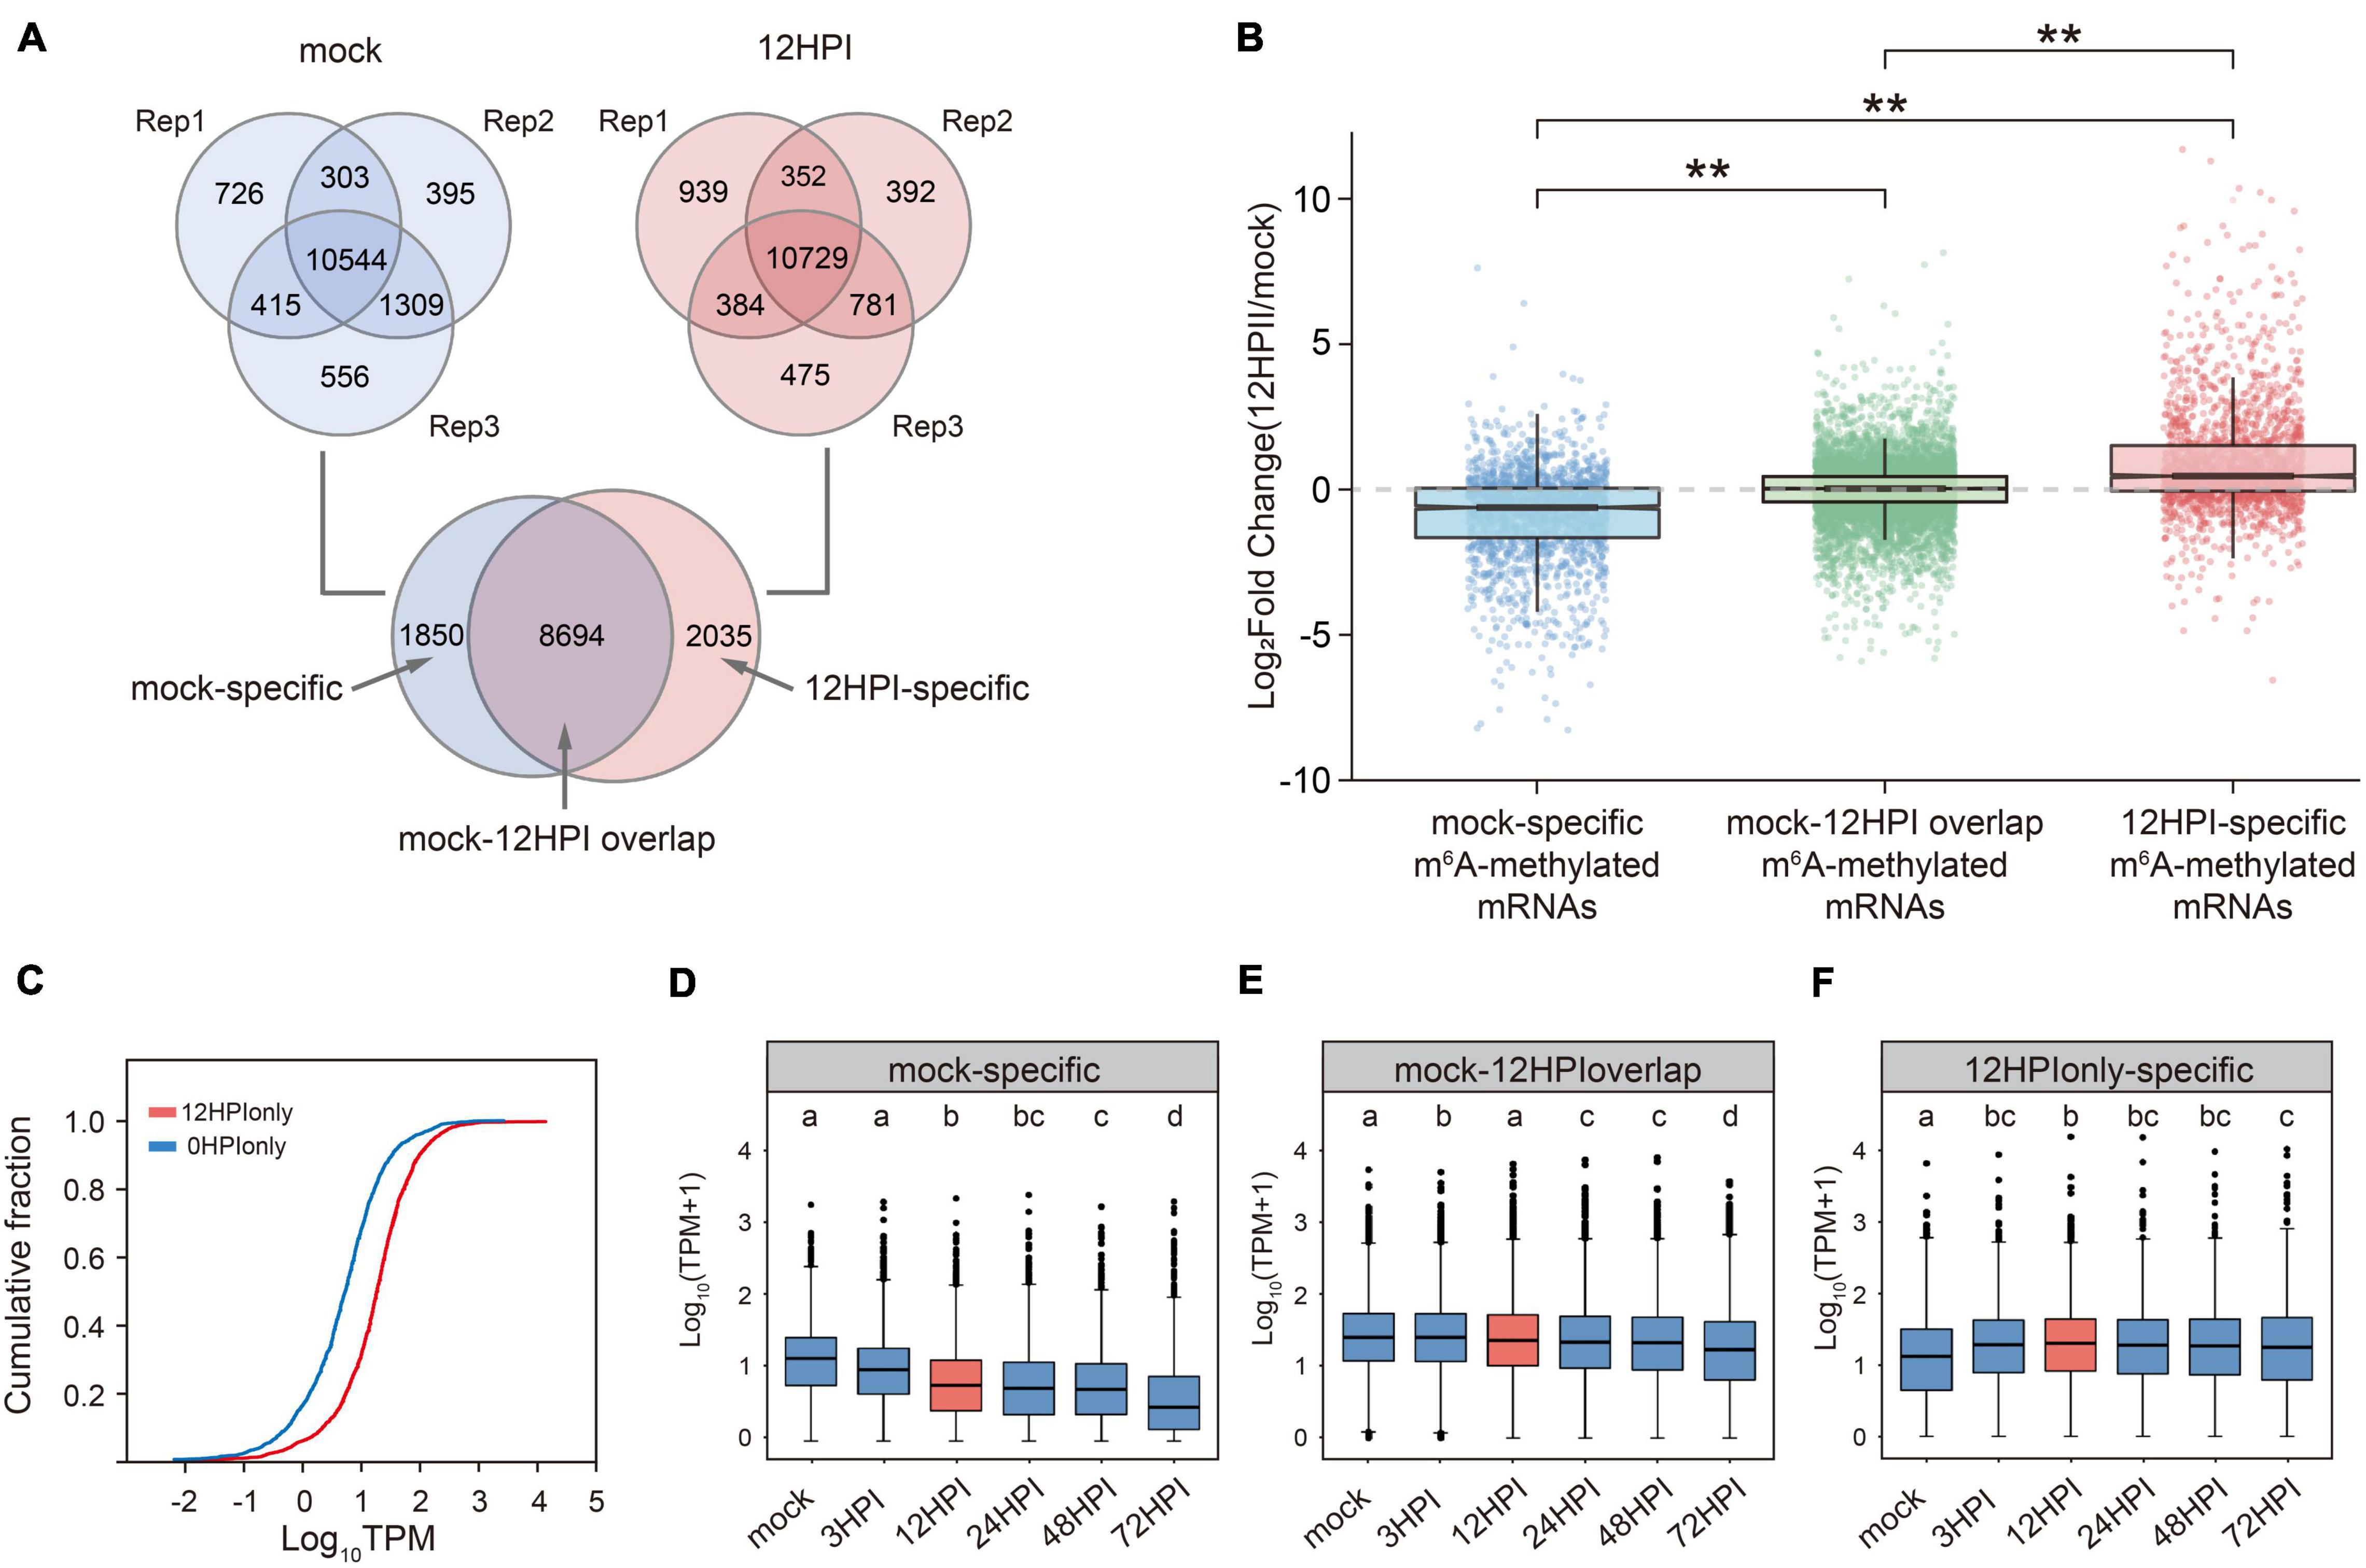
Figure 3. Fire blight inoculation induces changes in transcriptome-wide m6A modification, resulting in the increase of RNA abundance of m6A modified transcripts. (A) Overlap of m6A-modified genes among three replicates of mock (blue circles) and 12 HPI (red circles), the intersection of replicates indicates high-confidence m6A-modified genes. The subset of 0 HAI and 12 HAI indicates specifically m6A-modified genes before and after blight inoculation. (B) Relative abundance of m6A-modified gene transcripts in mock to 12 HPI contain mock-specific (blue box), 12 HPI–specific (red box), and mock-12 HPI overlap (green box). *p < 0.05; **p < 0.01. (C) Cumulative distribution function (CDF) of the relative abundance (12 HPI divided by mock) of transcripts in mock-specific m6A-modified genes and 12 HPI–specific m6A-modified genes compared using the Wilcoxon t-test. (D–F) Expression pattern of m6A-modified genes at different time points after inoculation.
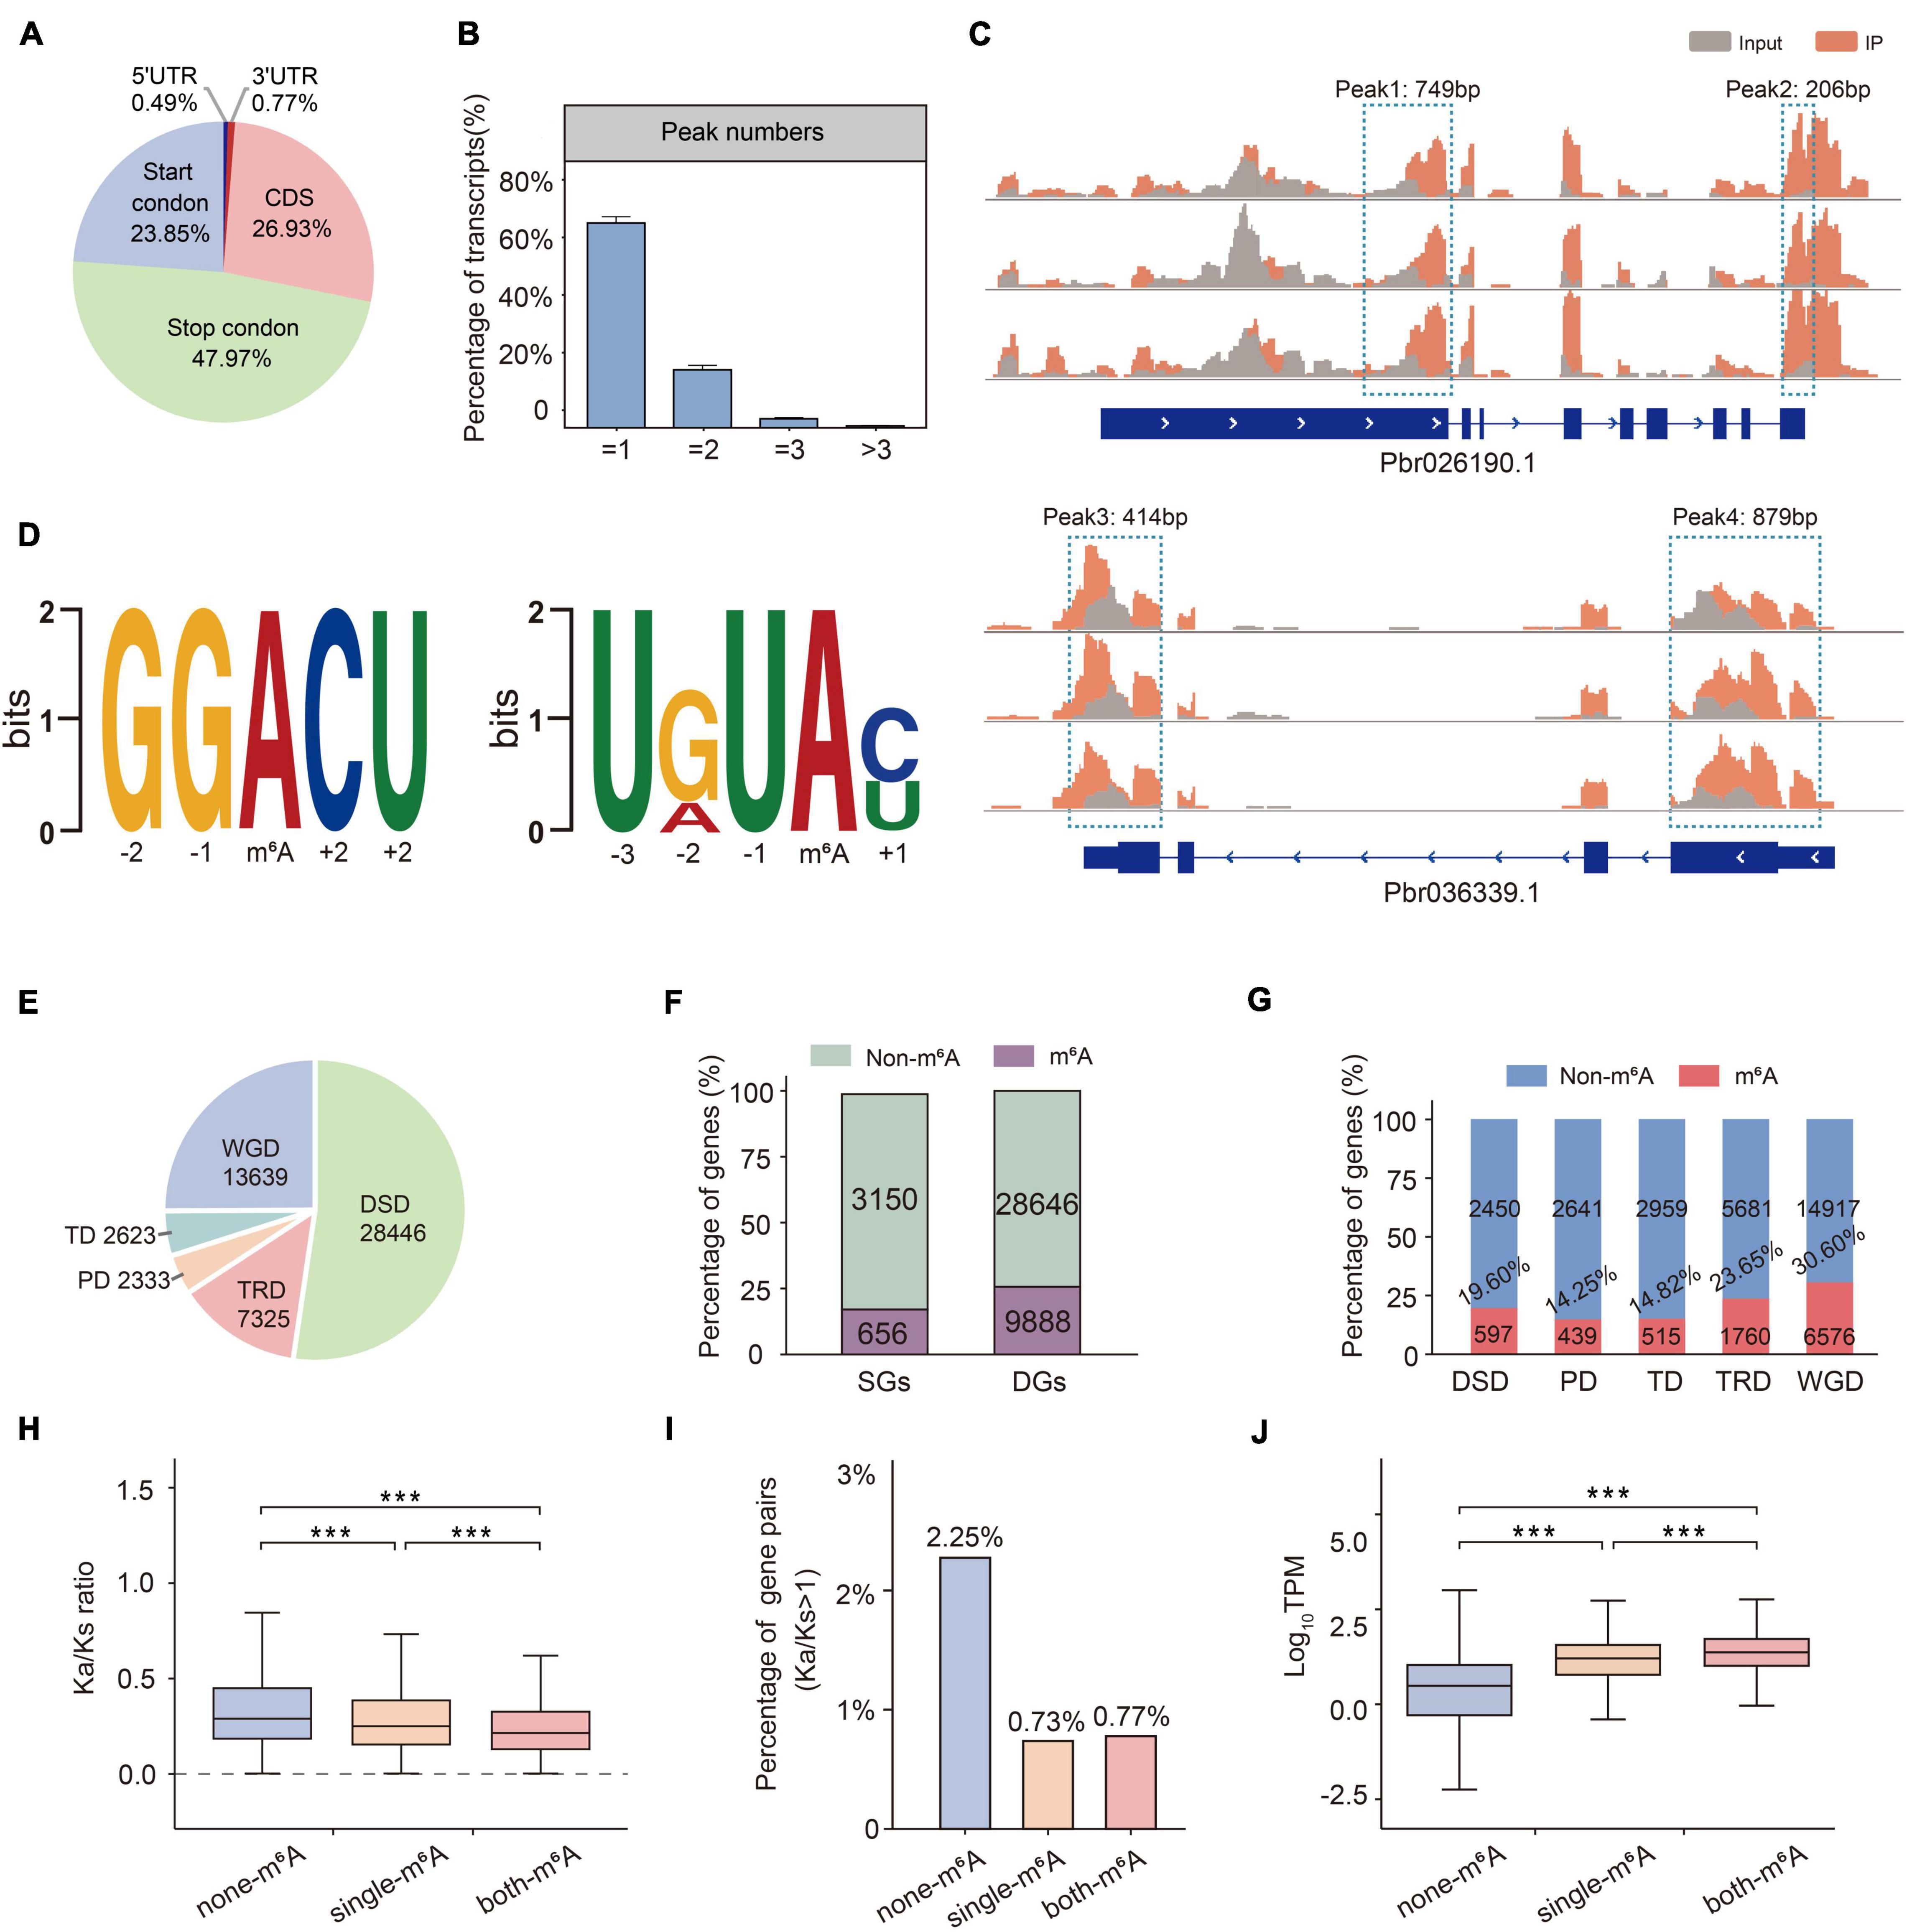
Figure 4. Overview of m6A methylation profiles in pear. (A) Percentage of total m6A peaks located throughout the regions of mRNA transcript. (B) Proportions of different m6A peak numbers in m6A-modified transcripts. Error bars represent the SD of three biological repeats. (C) Two examples of m6A-modified transcripts each containing two peaks at start codon, stop codon, and CDS (coding sequence). (D) Sequence motif identified by MEME. (E) The number of gene pairs derived from five duplication types in pear. (F) Comparison of ratios of m6A genes and non-m6A genes in SGs and DGs. (G) Comparison of ratios of m6A genes and non-m6A genes in five duplication S types. (H) Ka/Ks ratio of non-m6A gene pairs (blue box), single gene pairs (orange box), and both-m6A gene pairs (red box) in WGD. (I) The percentages of gene pairs showing Ka/Ks> 1 in WGD. (J) Expression divergence among duplicate genes derived from non-m6A, single-m6A, and both-m6A in WGD.
The pear genome was confirmed to have undergone at least two WGD events (4 dTv of ∼0.08; 4 dTv of ∼0.5), which provided us with a suitable system to study the effect of m6A on gene duplication (Wu et al., 2013). Here, we reviewed the evolutionary process of pear, and the duplicated gene pairs were classified into five categories by DupGen_finder (Qiao et al., 2019): DSD (dispersed duplication), TD (tandem duplication), PD (proximal duplication), TRD (transposed duplication), and WGD (whole-genome duplication) (Figure 4E). Of note, by examining the m6A modification on duplicated genes (DG) and singleton genes (SG), we found that m6A preferred DGs (25.66%) over SGs (17.23%) (Figure 4F). These genes that survived in duplicate from WGD had higher m6A methylation rates than the others. Then, we detected m6A-modified genes in pear, and they were assigned to DSD, TD, PD, TRD, and WGD (Figure 4G and Supplementary Table 7). Overall, ∼31% WGD and ∼24% TRD genes were methylated in pear. We reasoned that the genes generated by WGD and TRD can maintain m6A modification better than other duplication types. Based on our previous study, TRD may be important for plants to adapt to dramatic environmental changes (Qiao et al., 2019). Another study showed that m6A prefers actively transcribed genes (Zheng et al., 2020), and we hypothesize that epigenetic variation after gene duplication may lead to a greater activating function in plants. To investigate the coevolutionary consequences of gene duplication events and m6A modification in pear, we classified the gene pairs according to the m6A modification. The gene pairs were divided into three categories: gene pairs within two m6A-modified genes (both-m6A), gene pairs within a single m6A-modified gene (single-m6A), and gene pairs with no m6A-modified genes (non-m6A). Surprisingly, we found that both m6A gene pairs had the highest Ka/Ks ratios (Figures 4H,I) and the lowest expression (Figure 4J) in WGD. These findings suggest that non-m6A genes experience stronger positive selection and that m6A may affect the evolution of new biological functions.
Differentially m6A-Modified Genes in Mock- and Pathogen-Inoculated Plants
To study the effect of m6A during plant defense, we detected the overall m6A methylation level by LC-MS/MS, but there was no significant difference between mock and 12 HPI (Supplementary Figure 5A). We next characterized the m6A-modified genes in mock-inoculated plants and 12 HPI plants. We identified 10,544 and 10,729 high-confidence genes in the mock and 12 HPI groups using MACS (Zhang et al., 2008; Figure 3A). Based on these results, 1,850 and 2,035 m6A-modified genes were unique to the mock and 12 HPI groups, respectively.
We then compared the relative abundance (log2[12 HPI mRNA-seq TPM divided by mock mRNA-seq TPM]) during fire blight inoculation for mRNAs with mock-specific, 12 HPI–specific, and mock-12 HPI overlapping m6A peaks (Figure 3B). We found a significant difference (p-value < 0.001; Wilcoxon t-test) in the relative abundance between mock-specific m6A-modified mRNAs and 12 HPI–specific m6A-modified mRNAs from 0 to 12 h (Figures 3B,C). In fact, mock-specific m6A-modified mRNAs decreased in abundance with the loss of m6A modification (blue box; median < 0), and 12 HPI–specific m6A-modified mRNAs increased in abundance with the addition of m6A modifications (red box; median > 0). The other transcripts were slightly increased in abundance (green box; median > 0; Figure 3B). The box plots also indicated that the data distributions were concentrated, particularly the transcripts without modification changes. We next compared the gene expression patterns of these three classes of mRNAs at more time points (Figures 3D–F). These results show that the expression level of mock-specific m6A-modified mRNAs had a decreasing trend (Figure 3D), whereas 12 HPI-specific m6A-modified mRNAs had an increasing trend (Figure 3F), while the other mRNAs remained flat (Figure 3E).
To characterize the mock-specific m6A-modified mRNAs and 12 HPI–specific m6A-modified mRNAs, we performed GO and KEGG pathway analyses on these two classes of mRNAs (Supplementary Tables 8, 9). We found that m6A modification was added to the genes encoding proteins involved in the defense response to bacteria, cellular response to hypoxia, and response to wounding after fire blight inoculation (Figure 5A). Conversely, genes with mock-specific m6A peaks were enriched for more general terms associated with transcriptional regulation, such as DNA-binding transcription factor activity, regulation of transcription, and DNA templating (Figure 5B). We speculated that m6A selectively adds or removes m6A modification to regulate the plant defense response. KEGG enrichment results also indicated that some genes involved in metabolic processes lost m6A modification, while some associated with defense response were modified after inoculation (Figure 5C). After that, we counted the number of transcription factors (TFs) for mRNAs with mock-specific m6A peaks and 12 HPI–specific m6A peaks (Figure 5D). There were differences in the number of TFs between the specific mock- and 12 HPI–specific genes, such as ERF, bZIP, and HD-ZIP. A remarkable finding is that higher numbers of WRKY TFs were found in genes with 12 HPI–specific m6A peaks but not in mock-specific genes. WRKY TFs are conventionally thought to play important roles in the regulation of plant immunity. The aforementioned results show that m6A can selectively remove or add m6A modification to specific transcripts to regulate mRNA abundance, and plants can secure themselves via this defense mechanism.
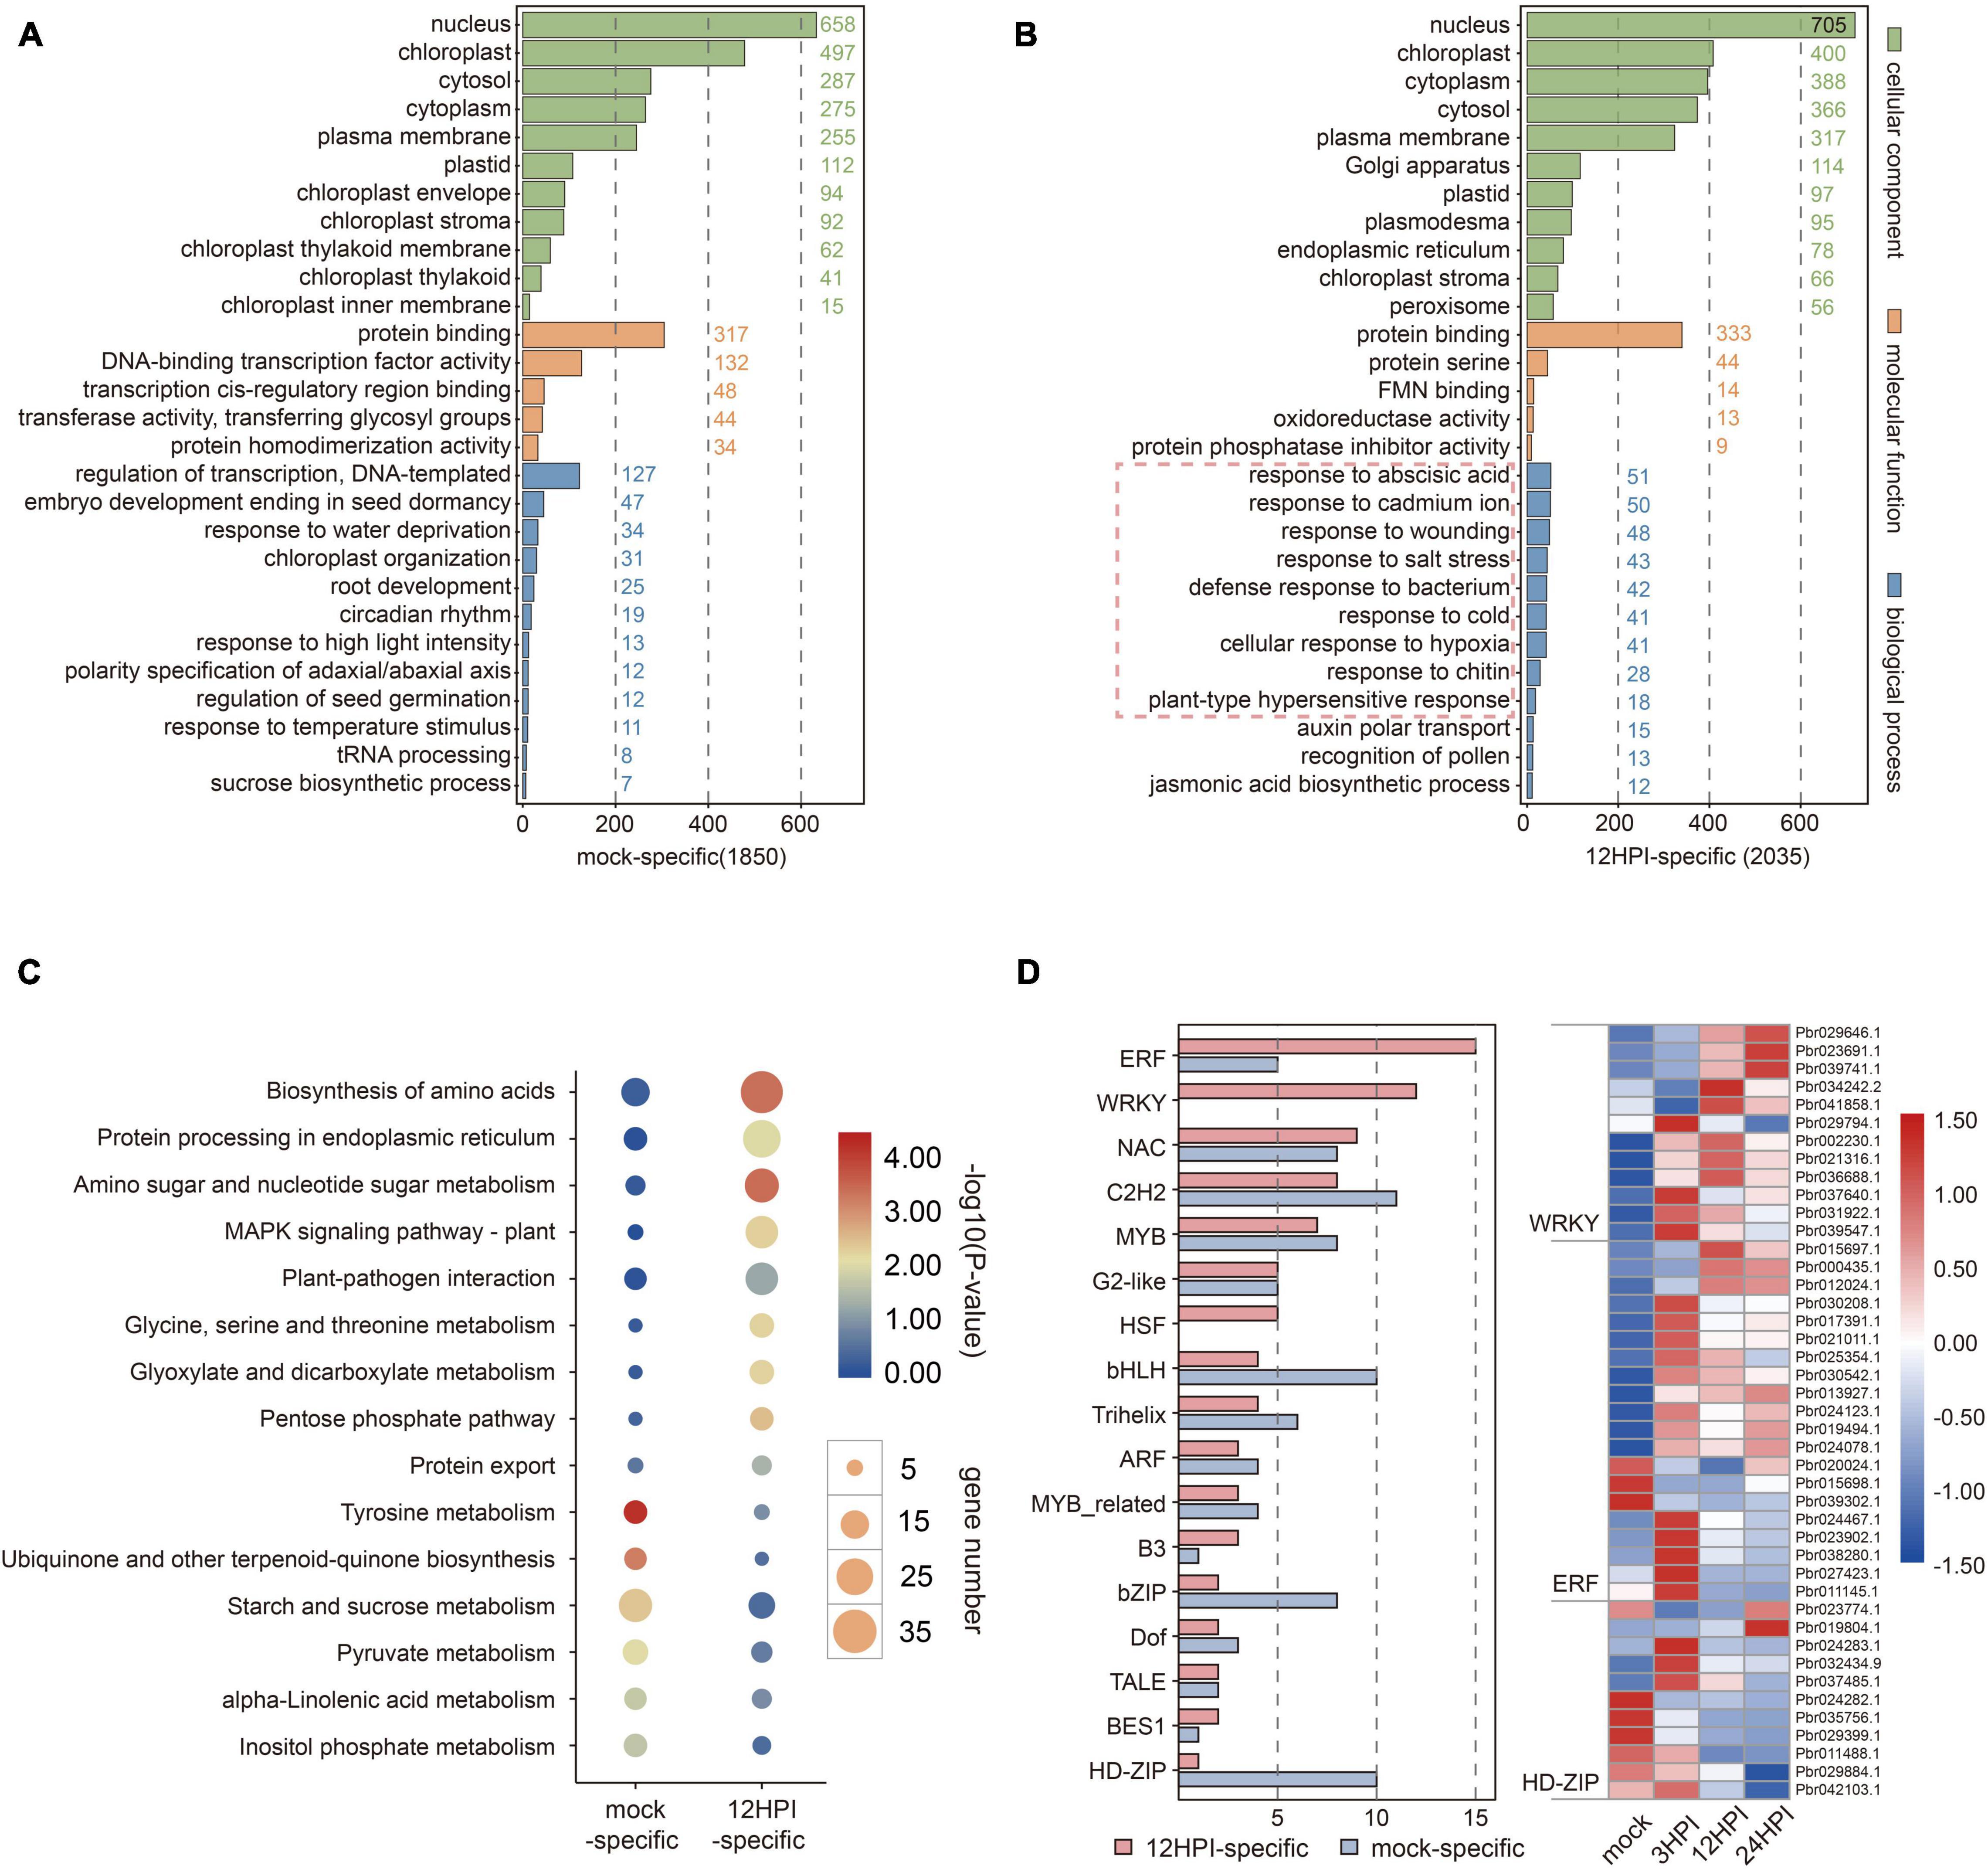
Figure 5. Functional analysis of mock-specific and 12 HPI-specific m6A-modified genes. (A,B) Gene Ontology (GO) enrichment analysis of mock-specific and 12 HPI–specific m6A-modified genes. (C) KEGG pathway enrichment analysis of mock-specific and 12 HPI–specific m6A-modified genes. (D) Distribution and expression analysis of transcription factors (TFs) involved in mock and 12 HPI.
Correlation Analysis of Gene Expression Level and m6A Level
To further verify the relationship between gene expression patterns and m6A modifications, we localized differentially enriched peaks (DEPs) on a genome-wide scale using Diffreps (Shen et al., 2013). In total, 891 upregulated DEPs (red; fold change ≥ 2; p < 0.01) and 2,026 downregulated DEPs (blue; fold change ≤ 2; p < 0.01) were identified across 17 chromosomes (Figure 6A). These DEPs were mapped to 859 (upregulated) and 1,961 (downregulated) genes (differentially methylated genes; DMGs). Subsequently, m6A-upregulated genes and m6A-downregulated genes were subjected to GO and KEGG pathway analyses (Figure 6B and Supplementary Tables 10, 11). Similar to our previous results, m6A-upregulated genes focused on the defense response, and m6A-downregulated genes focused on transcription regulation and some plant life activities.
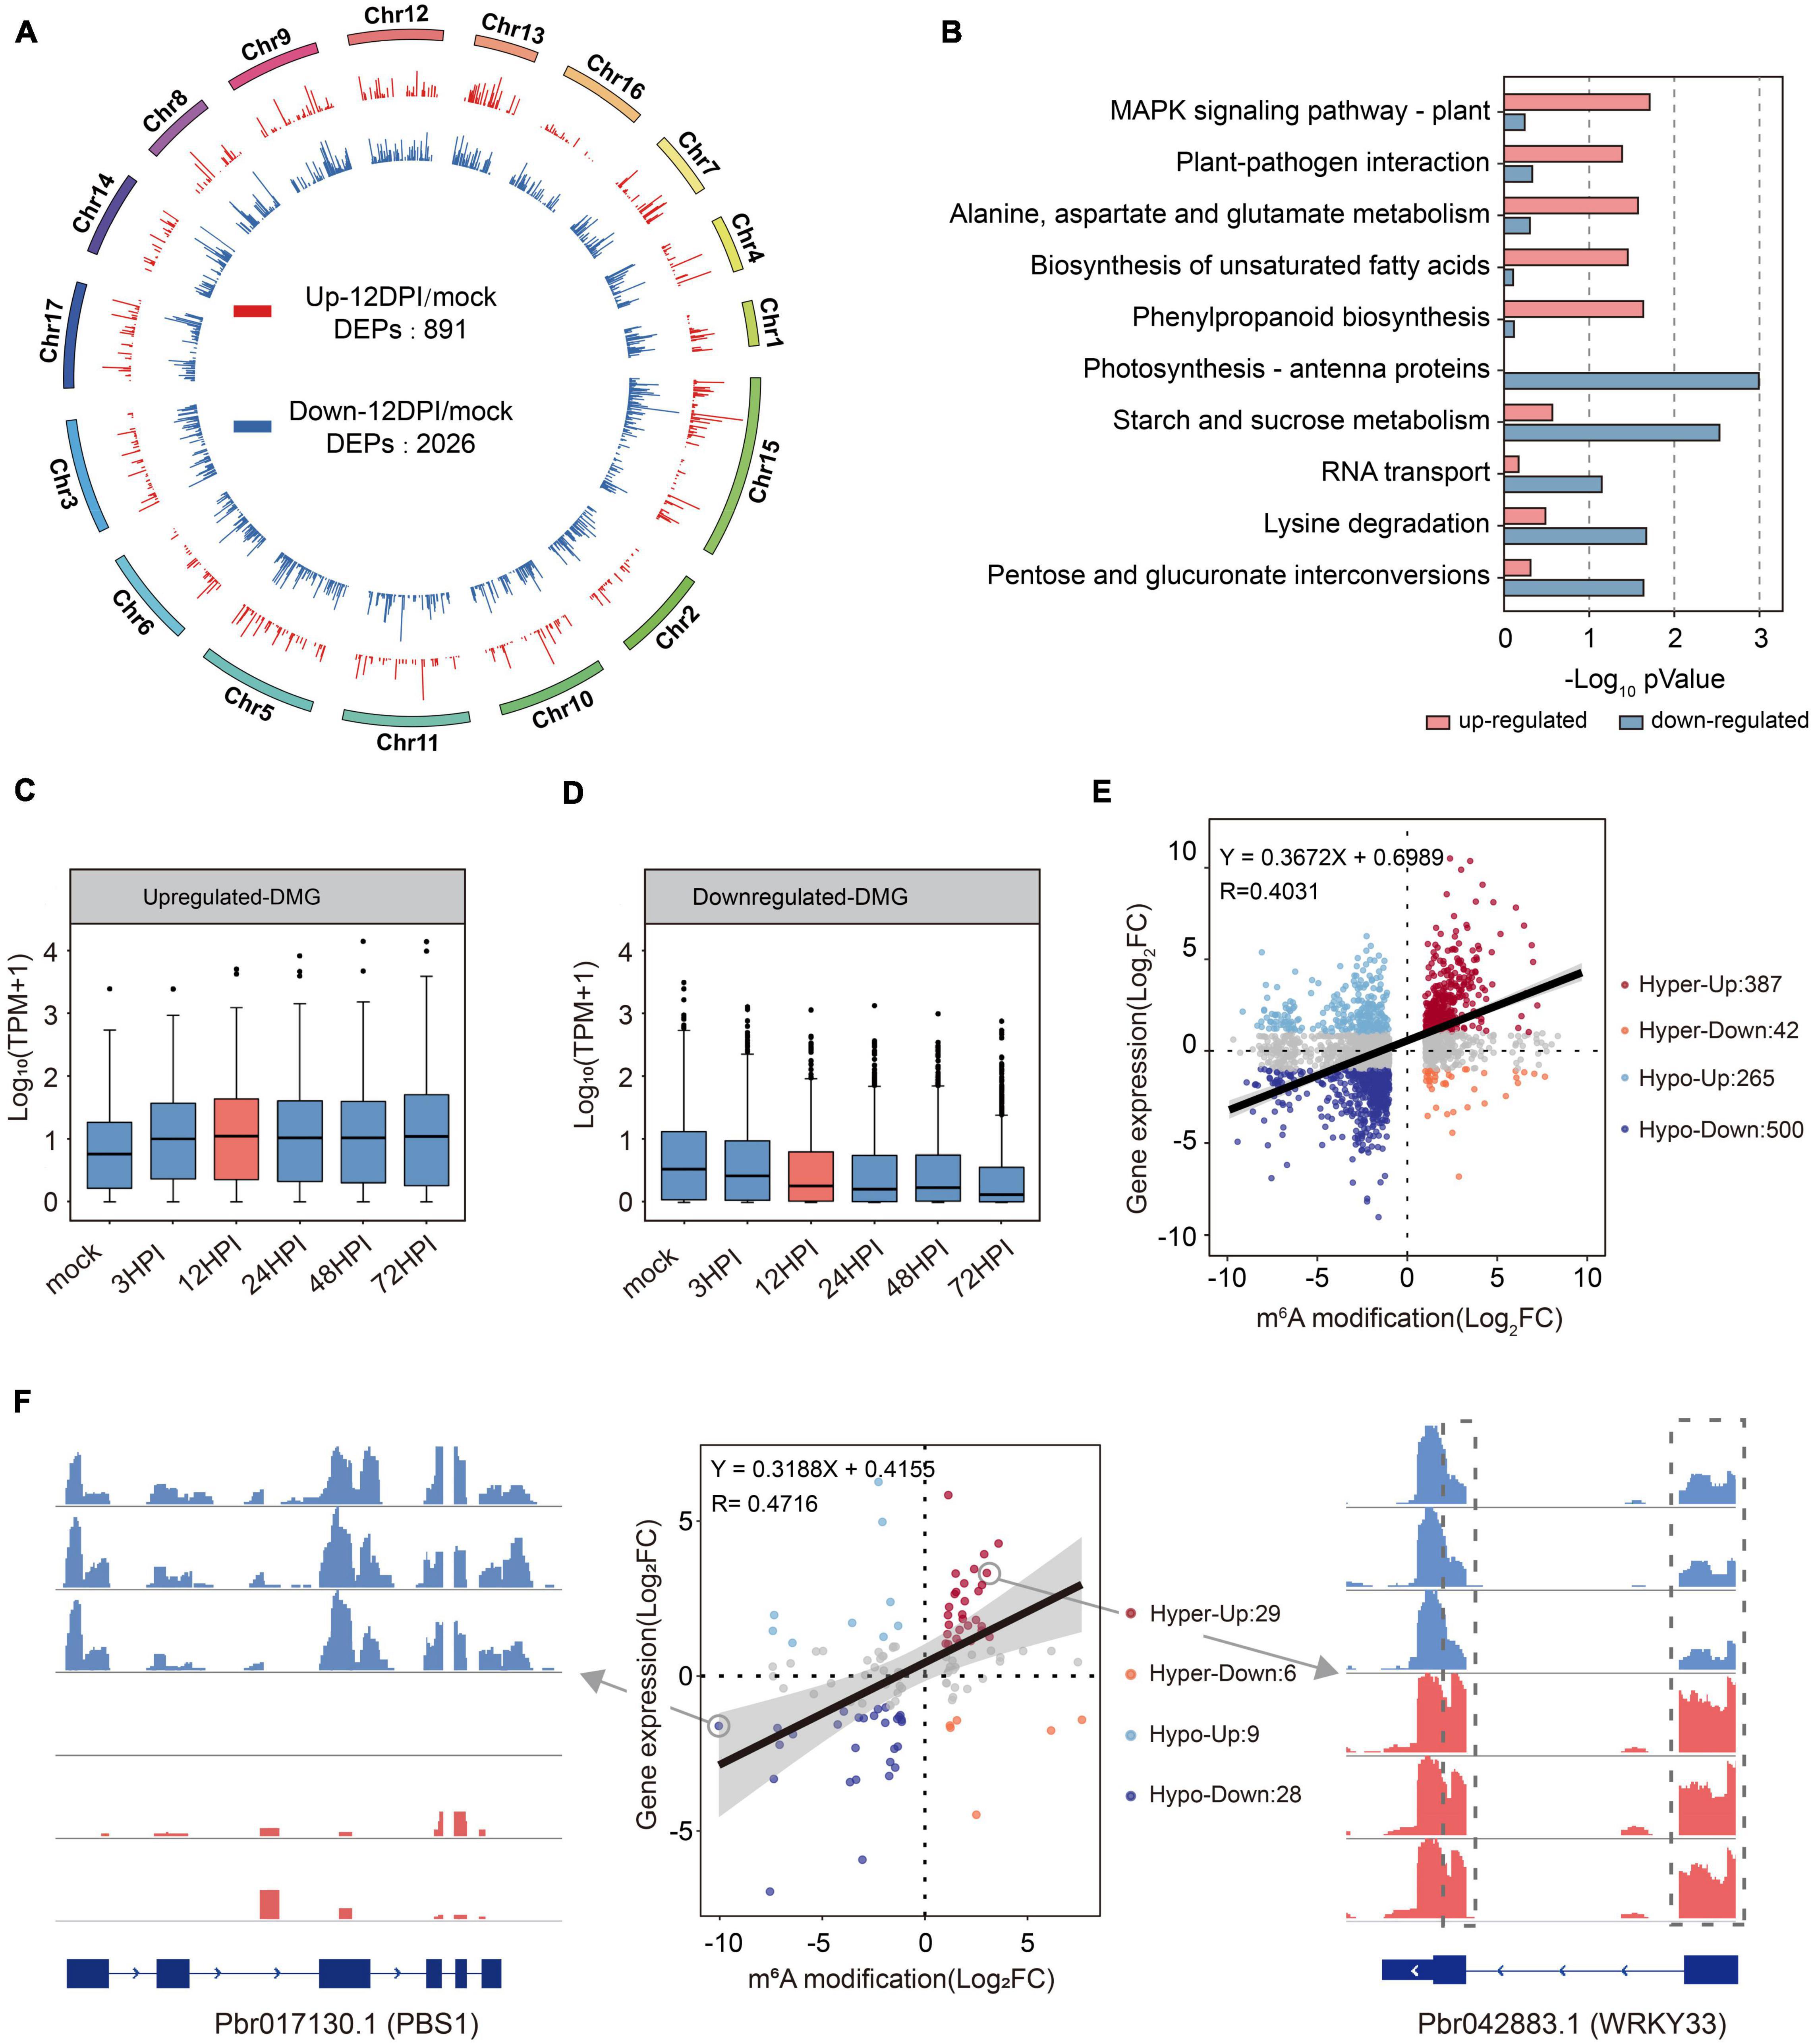
Figure 6. Association analysis of MeRIP-seq and RNA-seq reveals that m6A-modification results in the increase of transcript abundance. (A) Circos plots of pear genome showing the relative abundance of m6A modification across 17 chromosomes. Upregulated methylated peaks are shown in red and downregulated methylated peaks are shown in blue. The kurtosis represents fold change of m6A abundance. (B) KEGG pathway enrichment analysis of upregulated and downregulated methylated genes. (C) Distribution of genes with a significant change in both the m6A level and the gene expression level in mock compared with 12 HPI. The linear regression equations and R2 are shown on the graph. (D,E) Expression pattern of upregulated and downregulated methylated genes at different time points after inoculation. (F) Distribution of genes in plant–pathogen interaction KEGG pathway. Two genes were selected to present the browser views for m6A modification.
The conjoint analysis of the MeRIP-Seq and transcriptome data showed that the expression of genes with upregulated DEPs was significantly upregulated (Figure 6C). Conversely, the expression patterns of genes with downregulated DEPs were downregulated (Figure 6D). To further determine the relationship between gene expression and m6A abundance, the mock and 12 HPI RNA-seq data were selected for subsequent analysis. A total of 1,449 genes (| fold change| ≥ 2) were considered significantly different in their expression patterns (Figure 6E). Among these m6A-upregulated genes, 387 had increased mRNA levels (Hyperup), whereas 42 had reduced levels (Hyperdown). In addition, 500 had reduced mRNA levels (Hypo-down), whereas 265 had increased levels (Hypo-up) among m6A-downregulated genes. We observed a positive correlation between m6A abundance and mRNA levels (Pearson r correlation test; R = 0.4031; p < 0.01). To validate differential m6A abundance, we selected 98 genes involved in “plant–pathogen interaction” (ko: 04626) and verified the presence of m6A changes within WRKY transcription factors (Pbr042883.1) and serine/threonine kinases (Pbr017130.1) (Figure 6F). Eight genes were selected to validate the microarray results by qRT-PCR and m6A-IP-qPCR; we found that most of the genes were upregulated in methylation level and were also upregulated at the transcript level (Supplementary Figures 5B,C).
To further investigate the role of m6A in plant immunity, we concentrated on pathogen−associated molecular pattern (PAMP)–triggered immunity (PTI) genes (Figure 7). Among them, most PTI-responsive genes were modified after fire blight inoculation, including genes involved in signaling and systemic acquired resistance (SAR). In addition, their expression levels in pathogen-inoculated plants were significantly higher than those in mock-inoculated plants.
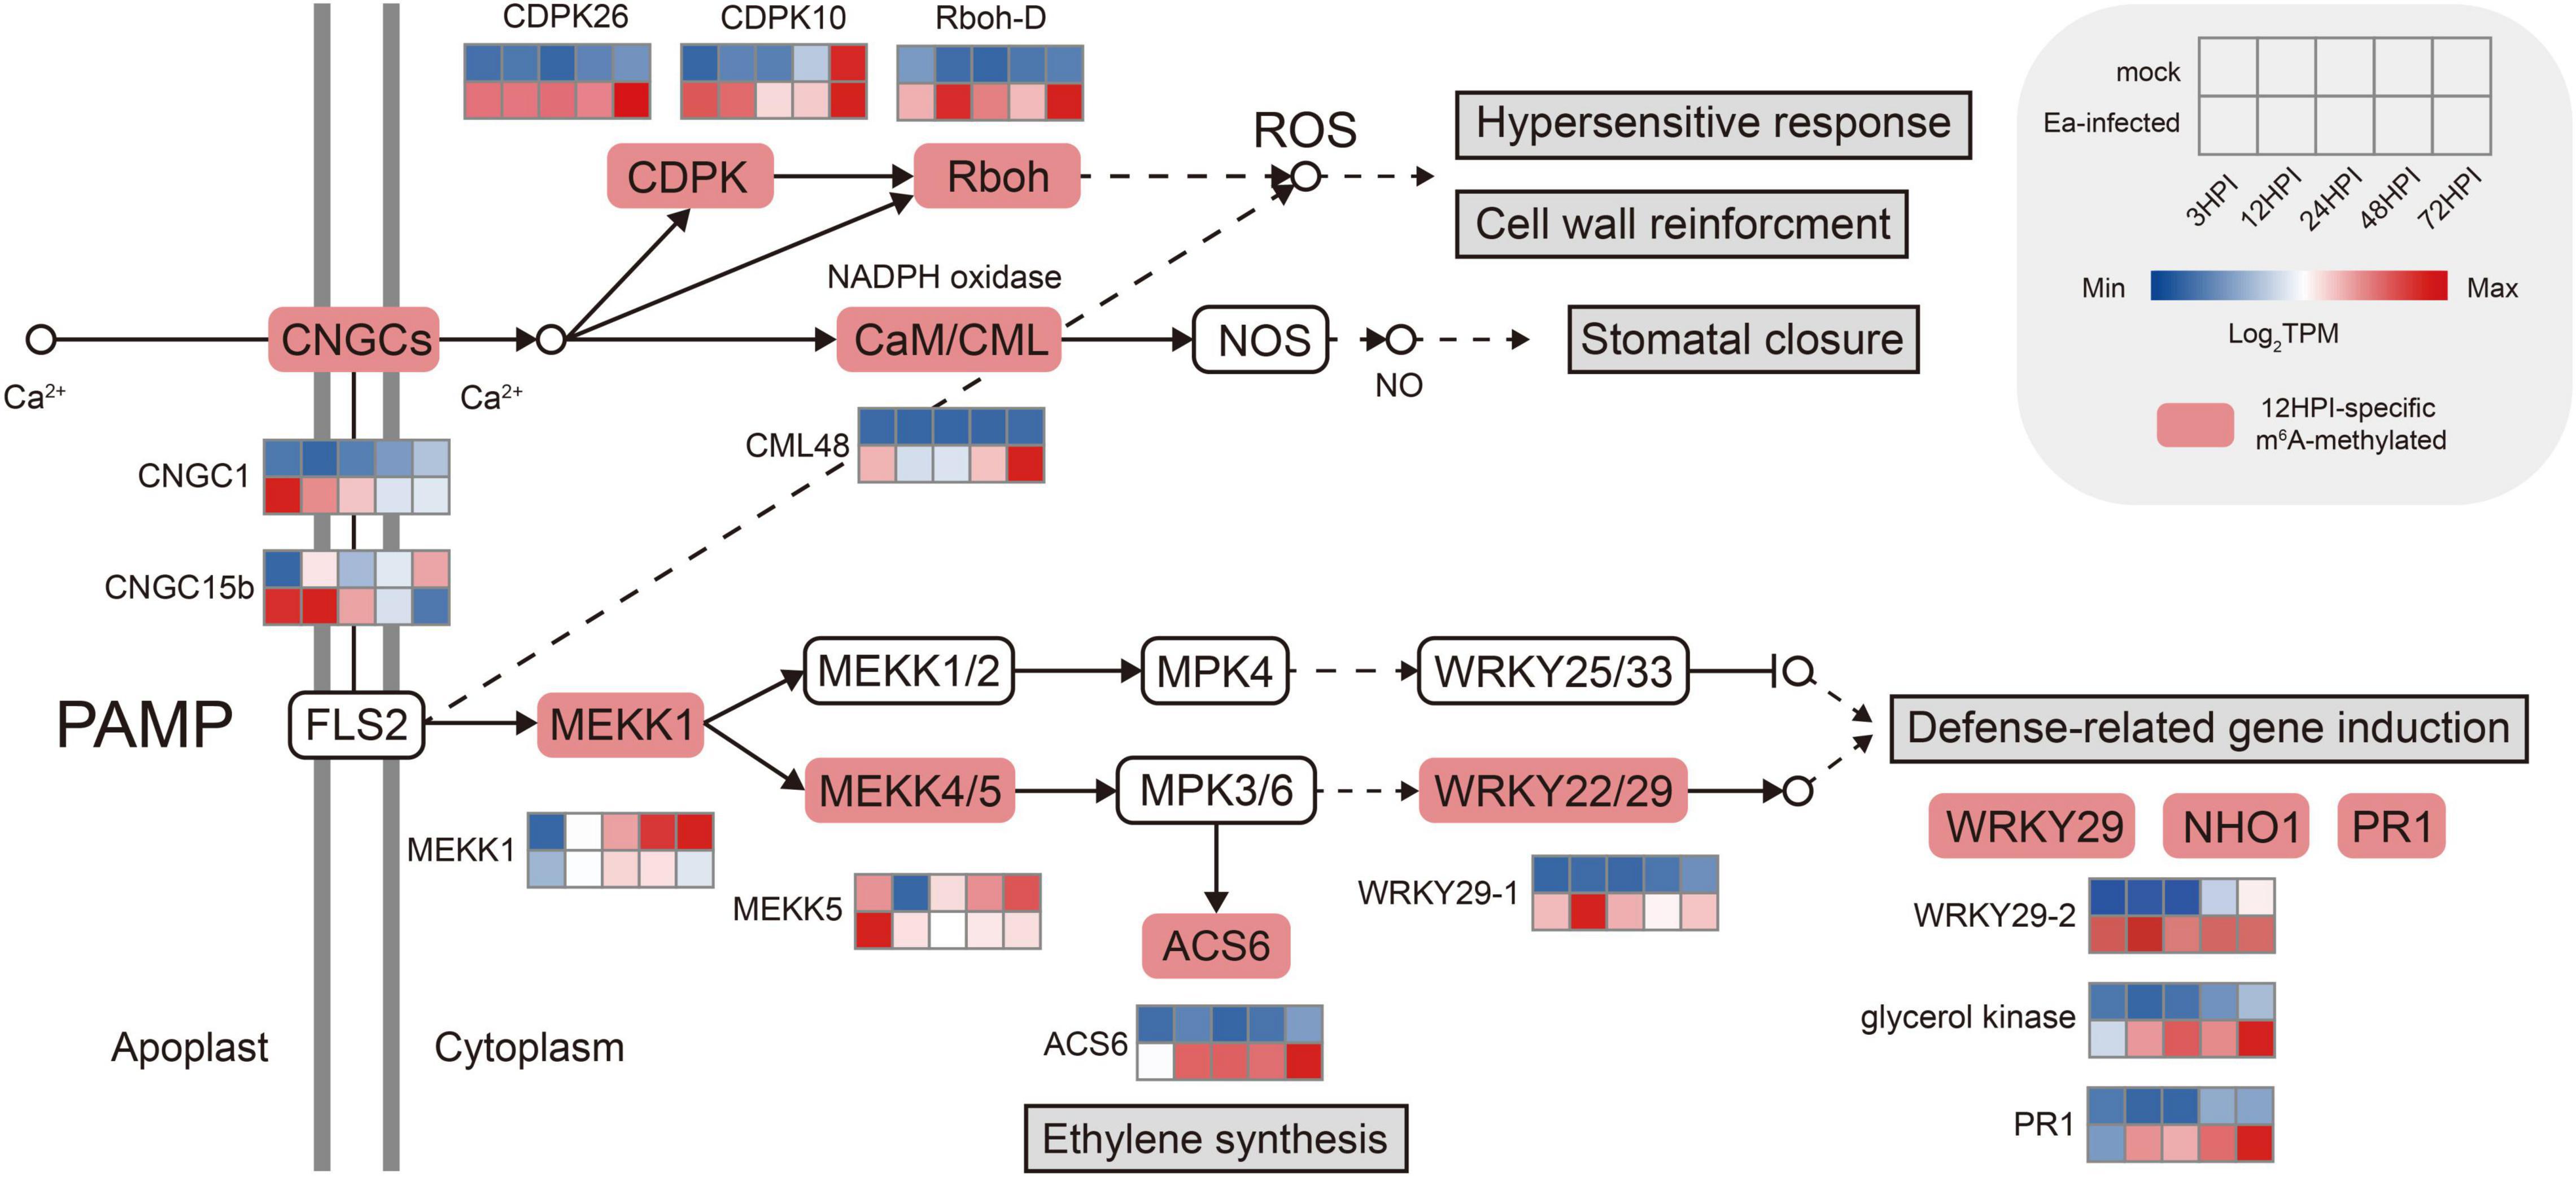
Figure 7. Visualization of pattern-triggered immunity (PTI) after fire blight inoculation. The red boxes indicate 12 HPI–specific m6A-methylated genes. The heatmap represents the expression patterns of the mock-inoculated plants and Erwinia amylovora–inoculated plants.
Discussion
In this work, we investigated the impact of m6A methylation on plants under biotic stress. This is the first study that has used MeRIP-seq to study pear disease resistance. In addition, we also examined the association between m6A and gene duplication events. Our analysis provides important insights into the role of posttranscriptional modifications in plant defense and will be relevant for molecular breeding strategies for pear. Although m6A methylation in the plant response to abiotic stress has been preliminarily studied, only a few reports have focused on biotic stress. In a study of N. tabacum infected with tobacco mosaic virus, a decrease in the levels of m6A was detected after inoculation (Li et al., 2018). However, there is still a lack of high-throughput data to understand the mechanism of this reversible dynamic modification under biotic stresses, and low-throughput mechanistic studies cannot show the genome-wide localization of m6A modifications (Anderson et al., 2018). To address this issue, we used MeRIP-seq technologies to examine m6A methylation profiles in pear at different time points after fire blight inoculation. Our study indicated that these dynamic and reversible modifications appear to be selective. Specifically, our study revealed that m6A modifications can be selectively added or removed to regulate the plant defense response (Figure 5). In previous m6A studies in Arabidopsis, the effect of m6A on mRNA processing was mainly examined by measuring the function of m6A regulators (Ruzicka et al., 2017). In a recent study, the number of m6A writers in higher plants was found to be much greater than that in lower plants, indicating that m6A methylation may be more complicated and precise in higher plants (Yue et al., 2019). However, the function and existence of these regulators are still not clear. The role of the m6A eraser FTO in the demethylation of m6A has been recognized in mammals, but homologues have not been found in plants (Jia et al., 2011; Miao et al., 2020). In this context, we herein present the first MeRIP-seq analysis of pear. Overall, m6A methylation is highly conserved in pear, and the canonical m6A consensus motif RRACH and plant-specific motif URUAY are both enriched in pear (Figure 4). m6A modifications are mainly distributed around the start and stop codons, and the distribution does not change much after fire blight inoculation.
Almost all Rosaceae plants have undergone multiple genome duplication events; the most recent whole-genome duplication occurred in pear and apple 30–45 million years ago, but not in other Rosaceae (Wu et al., 2013). The Chinese white pear genome is approximately 512 Mb and displays 42,431 coding genes, providing a foundation to study the evolutionary mode of m6A in plants (Wu et al., 2013). Previous studies in mammals have shown that m6A is associated with selective constraints (Ma et al., 2017). A recent study reported that m6A modification divergence of duplicate genes can affect subgenome dominance by impacting gene expression abundance (Miao et al., 2020). However, in-depth studies of the relationship between m6A and gene duplication evolution are still missing. Here, we provide a new way to investigate the connection between m6A and duplicated gene pairs. We classified the duplicated genes by five duplication types (Qiao et al., 2019) (DSD, TD, PD, TRD, and WGD), and then the gene pairs were reclassified into non-m6A, single-m6A, and both-m6A to examine the coevolution of m6A and different duplication types. It was found that m6A preferentially modified duplicate genes rather than singleton genes (Figure 4F). The genes generated by WGD had the highest methylation rates, and they maintained m6A modification after duplication events better than other duplication types (Figure 4G). Moreover, we examined the Ka/Ks values of non-m6A, single-m6A, and both-m6A gene pairs. Ka/Ks values are usually divided into positive selection (Ka/Ks> 1), neutral selection (Ka/Ks (=1), and purifying selection (Liu et al., 2020) (Ka/Ks < 1). The m6A-modified genes are more conserved with smaller Ka/Ks values than those without m6A modifications, suggesting that m6A-modified genes have experienced stronger purifying selection (Figure 4H and Supplementary Figures 4D–F). The association of m6A and gene duplication may be important. By counting the percentages of gene pairs showing Ka/Ks> 1, non-m6A genes were obviously subjected to stronger selective pressure (Figure 4I and Supplementary Figure 4G).
The functions of m6A genes deserve further attention. Although m6A is a dynamic process, the majority of m6A modification sites will not change much, and those small sites that change the modification sites deserve to be more precisely investigated (Figure 3A). Although there have been several studies on the transcriptome-wide map of m6A modifications, there are scarce studies comparing m6A preference and dynamic changes. Selective stabilization of salt-responsive transcripts by m6A has been proposed in recent reports (Anderson et al., 2018; Zheng et al., 2021); however, studies on effects following biotic stress generally focused on the role of m6A regulators. We used MeRIP-seq to establish the temporal m6A modification patterns of pear under biotic stress to examine the m6A change. In our study, we found that m6A methylation is a reversible equilibrium process. m6A had a preference for defense-related transcripts after inoculation, and we clearly demonstrated that the addition of m6A modifications can increase mRNA abundance (Figures 3B, 6E). Furthermore, we identified a considerable number of key defense-related genes, and these genes might become potential biomarkers of plant resistance. Similarly, the demethylation process of m6A is worth investigating, and the functions of transcripts with methylation loss were mainly related to transcriptional regulation and various biological processes. At present, it is not clear why these transcripts lost m6A modifications after inoculation. We can reasonably hypothesize that plants can maintain the mRNA dynamic equilibrium by regulating the m6A abundance of specific transcripts. Therefore, it is crucial to determine which types of defense signaling lead to the activation of m6A methylation and demethylation under stress.
Conclusion
Using a combined RNA-seq and MeRIP-seq approach, we reveal an early response to fire blight in pear. The m6A modification patterns of pear lay the groundwork for comprehensive understanding of the m6A methylation and demethylation in plants. Our data highlight the importance of m6A in mRNA stabilization, response defense, gene duplication, and evolution. We have demonstrated that plants can regulate mRNA abundance by adding or removing m6A modification, and there was a significant positive correlation between mRNA abundance and m6A abundance. We also found that the m6A-modified genes experienced stronger purifying selection, further enhancing our understanding of function and evolution of m6A in plants.
Data Availability Statement
The datasets presented in this study can be found in online repositories. The names of the repository/repositories and accession number(s) can be found below: https://db.cngb.org/cnsa/, CNP0001995.
Author Contributions
SZ and XH conceived and designed the study. XH improved the methodology of data collection and analysis. QQ, CH, YZ, and FZ contributed the collecting samples. XQ was responsible for analysis and interpretation of the part of gene duplication. CH and FZ performed the bioinformatics analysis. CH wrote the article. All authors approved the submitted version of this article.
Funding
This work has been supported by the National Key Research and Development Program of China (2018YFD1000303), the National Science Foundation of China (31872070 and 32072538), the Jiangsu Agriculture Science and Technology Innovation Fund [CX(18)3065], the Excellent Youth Natural Science Foundation of Jiangsu Province (SBK2017030026), the Project Funded by the Priority Academic Program Development of Jiangsu Higher Education Institutions, and the Earmarked Fund for China Agriculture Research System (CARS-28). The fire blight pathogen was kindly provided by Fengquan Liu and YZ (Jiangsu Academy of Agricultural Sciences).
Conflict of Interest
The authors declare that the research was conducted in the absence of any commercial or financial relationships that could be construed as a potential conflict of interest.
Publisher’s Note
All claims expressed in this article are solely those of the authors and do not necessarily represent those of their affiliated organizations, or those of the publisher, the editors and the reviewers. Any product that may be evaluated in this article, or claim that may be made by its manufacturer, is not guaranteed or endorsed by the publisher.
Supplementary Material
The Supplementary Material for this article can be found online at: https://www.frontiersin.org/articles/10.3389/fmicb.2021.803512/full#supplementary-material
Supplementary Figure 1 | There were significant correlations among m6A writers, erasers, and readers. (A) Relative mRNA expression level of MTA1, ALKBH5B, and ECT9 in mock, 3 HPI, 12 HPI, and 72 HPI. (B) Correlation analysis of m6A regulators after fire blight inoculation. (C) The protein–protein interactions among m6A regulators.
Supplementary Figure 2 | Circos plots of the m6A methylation pattern in pear. (A) m6A peak and gene density within each chromosome in pear plants at mock and 12 HPI. (B) Fold enrichment of m6A modification in three biological replicates at mock and 12 HPI.
Supplementary Figure 3 | Overview of m6A methylation profiles in fire blight infected pear. (A) Percentage of total m6A peaks located throughout regions of mRNA transcript in 12 HPI. (B) The localization of m6A peaks in mock and 12 HPI pear seedlings. (C) Proportions of different m6A peak numbers in m6A-modified transcripts in 12 HPI pear seedlings. Error bars represent the SD of three biological repeats.
Supplementary Figure 4 | Evidence for coevolution of m6A modifications and gene duplication. (A) Comparison of ratios of m6A gene pairs and non-m6A gene pairs in five duplication types. (B) Comparison of ratios of both-m6A gene pairs and single-m6A gene pairs in five duplication types. (C–F) Ka/Ks ratio of non-m6A gene pairs (blue box), single gene pairs (orange box), and both-m6A gene pairs (red box) in five duplication types. (G) The percentages of gene pairs showing Ka/Ks> 1 in TRD and DSD. (H–K) Expression divergence among duplicate genes derived from non-m6A, single-m6A, and both-m6A in PD, TRD, DSD, and TD.
Supplementary Figure 5 | LC-MS/MS quantification of RNA modification in mock and 12 HPI plants.
Supplementary Figure 6 | qRT-PCR and m6A-IP-qPCR assay of m6A-modified genes. (A) m6A-IP-qPCR validation of m6A methylation level of 10 randomly selected genes from Supplementary Table 6. (B) Relative mRNA levels. *p < 0.05; **p < 0.01.
Footnotes
- ^ http://kobas.cbi.pku.edu.cn/
- ^ https://meme-suite.org/meme/doc/streme.html
- ^ https://github.com/qiao-xin/DupGen_finder
References
Adams, K. J., Pratt, B., Bose, N., Dubois, L. G., St John-Williams, L., Perrott, K. M., et al. (2020). Skyline for small molecules: a unifying software package for quantitative metabolomics. J. Proteome Res. 19, 1447–1458. doi: 10.1021/acs.jproteome.9b00640
Anderson, S. J., Kramer, M. C., Gosai, S. J., Yu, X., Vandivier, L. E., Nelson, A. D. L., et al. (2018). N(6)-methyladenosine inhibits local ribonucleolytic cleavage to stabilize mRNAs in arabidopsis. Cell Rep. 25, 1146–1157.e3. doi: 10.1016/j.celrep.2018.10.020
Arribas-Hernandez, L., Bressendorff, S., Hansen, M. H., Poulsen, C., Erdmann, S., and Brodersen, P. (2018). An m(6)a-YTH module controls developmental timing and morphogenesis in arabidopsis. Plant Cell 30, 952–967. doi: 10.1105/tpc.17.00833
Arribas-Hernandez, L., and Brodersen, P. (2020). Occurrence and functions of m(6)a and other covalent modifications in plant mRNA. Plant Physiol. 182, 79–96. doi: 10.1104/pp.19.01156
Bailey, T. L., Williams, N., Misleh, C., and Li, W. W. (2006). MEME: discovering and analyzing DNA and protein sequence motifs. Nucleic Acids Res. 34, W369–W373. doi: 10.1093/nar/gkl198
Bokar, J. A., Rath-shambaugh, M. E., Ludwiczak, R., Narayan, P., and Rottman, F. (1994). Characterization and partial purification of mRNA N6-adenosine methyltransferase from HeLa cell nuclei. internal mRNA methylation requires a multisubunit complex. J. Biol. Chem. 269, 17697–17704. doi: 10.1016/s0021-9258(17)32497-3
Born, Y., Fieseler, L., Thony, V., Leimer, N., Duffy, B., and Loessner, M. J. (2017). Engineering of bacteriophages Y2::dpoL1-C and Y2::luxAB for efficient control and rapid detection of the fire blight pathogen, Erwinia amylovora. Appl. Environ. Microbiol. 83:e00341-17. doi: 10.1128/AEM.00341-17
Chen, C., Chen, H., Zhang, Y., Thomas, H. R., Frank, M. H., He, Y., et al. (2020). TBtools: an integrative toolkit developed for interactive analyses of big biological data. Mol. Plant 8, 1194–1202. doi: 10.1016/j.molp.2020.06.009
Cooper, T. A. (2012). Implications of widespread covalent modification of mRNA. Circ. Res. 111, 1491–1493. doi: 10.1161/CIRCRESAHA.112.281071
Dominissini, D., Moshitch-Moshkovitz, S., Salmon-Divon, M., Amariglio, N., and Rechavi, G. (2013). Transcriptome-wide mapping of N6-methyladenosine by m6A-seq based on immunocapturing and massively parallel sequencing. Nat. Protoc. 8:176. doi: 10.1038/nprot.2012.148
Dominissini, D., Moshitch-Moshkovitz, S., Schwartz, S., Salmon-Divon, M., Ungar, L., Osenberg, S., et al. (2012). Topology of the human and mouse m6A RNA methylomes revealed by m6A-seq. Nature 485, 201–206. doi: 10.1038/nature11112
Du, H., Zhao, Y., He, J., Zhang, Y., Xi, H., Liu, M., et al. (2016). YTHDF2 destabilizes m(6)a-containing RNA through direct recruitment of the CCR4-NOT deadenylase complex. Nat. Commun. 7:12626. doi: 10.1038/ncomms12626
Duan, H. C., Wei, L. H., Zhang, C., WangG, Y., Chen, L., Lu, Z., et al. (2017). ALKBH10B is an RNA N(6)-methyladenosine demethylase affecting arabidopsis floral transition. Plant Cell 29, 2995–3011. doi: 10.1105/tpc.16.00912
Fu, Y., Dominissini, D., Rechavi, G., and He, C. (2014). Gene expression regulation mediated through reversible m(6)A RNA methylation. Nat. Rev. Genet. 15, 293–306. doi: 10.1038/nrg3724
Guo, T., Liu, C., Meng, F., Hu, L., Fu, X., Yang, Z., et al. (2021). The M6a reader MhYTP2 regulates MdMLO19 mRNA stability and antioxidant genes translation efficiency conferring powdery mildew resistance in apple. Plant Biotechnol. J. [Epub ahead of print], doi: 10.1111/pbi.13733
Hofmann, N. R. (2017). Epitranscriptomics and flowering: mRNA methylation/demethylation regulates flowering time. Plant Cell 29, 2949–2950. doi: 10.1105/tpc.17.00929
Jaillon, O., Aury, J. M., Noel, B., Policriti, A., Clepet, C., Casgrande, A., et al. (2007). The grapevine genome sequence suggests ancestral hexaploidization in major angiosperm phyla. Nature 449, 463–467. doi: 10.1038/nature06148
Jia, G., Fu, Y., and He, C. (2013). Reversible RNA adenosine methylation in biological regulation. Trends Genet. 29, 108–115. doi: 10.1016/j.tig.2012.11.003
Jia, G., Fu, Y., Zhao, X., Dai, Q., Zheng, G., Yang, Y., et al. (2011). N6-methyladenosine in nuclear RNA is a major substrate of the obesity-associated FTO. Nat. Chem. Biol. 7, 885–887. doi: 10.1038/nchembio.687
Kamber, T., Buchmann, J. P., Pothier, J. F., Smits, T. H., Wicker, T., and Duffy, B. (2016). Fire blight disease reactome: RNA-seq transcriptional profile of apple host plant defense responses to Erwinia amylovora pathogen inoculation. Sci. Rep. 6:21600. doi: 10.1038/srep21600
Kan, L., Grozhik, A. V., Vedanayagam, J., Patil, D. P., Pang, N., Lim, K. S., et al. (2017). The m(6)a pathway facilitates sex determination in Drosophila. Nat. Commun. 8:15737. doi: 10.1038/ncomms15737
Kierzek, E., and Kierzek, R. (2003). The thermodynamic stability of RNA duplexes and hairpins containing N6-alkyladenosines and 2-methylthio-N6-alkyladenosines. Nucleic. Acids. Res. 31, 4472–4480. doi: 10.1093/nar/gkg633
Kim, D., Langmead, B., and Salzberg, S. L. (2015). HISAT: a fast spliced aligner with low memory requirements. Nat. Methods. 12, 357–360. doi: 10.1038/nmeth.3317
Li, Y., Wang, X., Li, C., Hu, S., Yu, J., and Song, S. (2014). Transcriptome-wide N(6)-methyladenosine profiling of rice callus and leaf reveals the presence of tissue-specific competitors involved in selective mRNA modification. RNA Biol. 11, 1180–1188. doi: 10.4161/rna.36281
Li, Z., ShI, J., Yu, L., Zhao, X., Ran, L., Hu, D., et al. (2018). N (6) -methyl-adenosine level in Nicotiana tabacum is associated with tobacco mosaic virus. Virol. J. 15:87. doi: 10.1186/s12985-018-0997-4
Liao, Y., Smyth, G. K., and Shi, W. (2013). Feature counts: an efficient general purpose program for assigning sequence reads to genomic features. Bioinformatics 30, 923–930. doi: 10.1093/bioinformatics/btt656
Liu, C., Qiao, X., Li, Q., Zeng, W., Wei, S., Wang, X., et al. (2020). Genome-wide comparative analysis of the BAHD superfamily in seven Rosaceae species and expression analysis in pear (Pyrus bretschneideri). BMC Plant Biol. 20:14. doi: 10.1186/s12870-019-2230-z
Liu, J., Yue, Y., Han, D., Wang, X., Fu, Y., Zhang, L., et al. (2014). A METTL3-METTL14 complex mediates mammalian nuclear RNA N6-adenosine methylation. Nat. Chem. Biol. 10, 93–95. doi: 10.1038/nchembio.1432
Luo, G. Z., Macqueen, A., Zheng, G., Duan, H., Dore, L. C., Lu, Z., et al. (2014). Unique features of the m6A methylome in Arabidopsis thaliana. Nat. Commun. 5:5630. doi: 10.1038/ncomms6630
Ma, L., Zhao, B., Chen, K., Thomas, A., Tuteja, J. H., He, X., et al. (2017). Evolution of transcript modification by N(6)-methyladenosine in primates. Genome Res. 27, 385–392. doi: 10.1101/gr.212563.116
Martinez-Perez, M., Aparicio, F., Lopez-Gresa, M. P., Belles, J. M., Sanchez-Navarro, J. A., and Pallas, V. (2017). Arabidopsis m(6)a demethylase activity modulates viral inoculation of a plant virus and the m(6)a abundance in its genomic RNAs. Proc. Natl. Acad. Sci. U.S.A. 114, 10755–10760. doi: 10.1073/pnas.1703139114
Mauer, J., Luo, X., Blanjoie, A., Jiao, X., Grozhik, A. V., Patil, D. P., et al. (2017). Reversible methylation of m(6)Am in the 5’ cap controls mRNA stability. Nature 541, 371–375. doi: 10.1038/nature21022
McNally, R. R., Toth, I. K., Cock, P. J., Pritchard, L., Hedley, P. E., Morris, J. A., et al. (2012). Genetic characterization of the HrpL regulon of the fire blight pathogen Erwinia amylovora reveals novel virulence factors. Mol. Plant Pathol. 13, 160–173. doi: 10.1111/j.1364-3703.2011.00738.x
Miao, Z., Zhang, T., Qi, Y., Song, J., Han, Z., and Ma, C. (2020). Evolution of the RNA N (6)-methyladenosine methylome mediated by genomic duplication. Plant Physiol. 182, 345–360. doi: 10.1104/pp.19.00323
Parker, M. T., Knop, K., Sherwood, A. V., Schurch, N. J., MackinnoN, K., Gould, P. D., et al. (2020). Nanopore direct RNA sequencing maps the complexity of arabidopsis mRNA processing and M6a modification. eLife 9:e49658. doi: 10.7554/eLife.49658
Patil, D. P., Pickering, B. F., and Jaffrey, S. R. (2018). Reading m(6)a in the transcriptome: m(6)a-binding proteins. Trends Cell. Biol. 28, 113–127. doi: 10.1016/j.tcb.2017.10.001
Qiao, X., Li, Q., Yin, H., Qi, K., Li, L., Wang, R., et al. (2019). Gene duplication and evolution in recurring polyploidization-diploidization cycles in plants. Genome Biol. 20:38. doi: 10.1186/s13059-019-1650-2
Ruzicka, K., Zhang, M., Campilho, A., Bodi, Z., Kashif, M., Saleh, M., et al. (2017). Identification of factors required for m(6)A mRNA methylation in arabidopsis reveals a role for the conserved E3 ubiquitin ligase HAKAI. New Phytol. 215, 157–172. doi: 10.1111/nph.14586
Schachterle, J. K., and Sundin, G. W. (2019). The leucine-responsive regulatory protein Lrp participates in virulence regulation downstream of small RNA ArcZ in Erwinia amylovora. mBio 10, 3. doi: 10.1128/mBio.00757-19
Schwartz, S., Agarwala, S. D., Mumbach, M. R., Jovanovic, M., Mertins, P., Shishkin, A., et al. (2013). High-resolution mapping reveals a conserved, widespread, dynamic mRNA methylation program in yeast meiosis. Cell 155, 1409–1421. doi: 10.1016/j.cell.2013.10.047
Scutenaire, J. K., Deragon, J. M., Jean, V., Benhamed, M., Raynaud, C., Favory, J. J., et al. (2018). The YTH domain protein ECT2 is an m(6)a reader required for normal trichome branching in arabidopsis. Plant Cell 30, 986–1005. doi: 10.1105/tpc.17.00854
Shen, L., Shao, N. Y., Liu, X., Maze, I., Feng, J., and Nestler, E. J. (2013). DiffReps: detecting differential chromatin modification sites from ChIP-seq data with biological replicates. PLoS One 8:e65598. doi: 10.1371/journal.pone.0065598
Shi, H., Wang, X., Lu, Z., Zhao, B. S., Ma, H., Hsu, P. J., et al. (2017). YTHDF3 facilitates translation and decay of N(6)-methyladenosine-modified RNA. Cell Res. 27, 315–328. doi: 10.1038/cr.2017.15
Vespa, L., Vachon, G., Berger, F., Perazza, D., Faure, J. D., and Herzog, M. (2004). The immunophilin-interacting protein AtFIP37 from arabidopsis is essential for plant development and is involved in trichome endoreduplication. Plant Physiol. 134, 1283–1292. doi: 10.1104/pp.103.028050
Wan, Y., Tang, K., Zhang, D., Xie, S., Zhu, X., Wang, Z., et al. (2015). Transcriptome-wide high-throughput deep m(6)a-seq reveals unique differential m(6)a methylation patterns between three organs in Arabidopsis thaliana. Genome Biol. 16:272. doi: 10.1186/s13059-015-0839-2
Wang, D., Zhang, Y., Zhang, Z., Zhu, J., and Yu, J. (2010). KaKs_calculator 2.0: a toolkit incorporating gamma-series methods and sliding window strategies. Genom. Proteom. Bioinf. 8, 77–80. doi: 10.1016/S1672-0229(10)60008-3
Wang, Y., Li, Y., Yue, M., Wang, J., Kumar, S., Wechsler-Reya, R. J., et al. (2018). N(6)-methyladenosine RNA modification regulates embryonic neural stem cell self-renewal through histone modifications. Nat. Neurosci. 21, 195–206.
Wei, L. H., Song, P., Wang, Y., Lu, Z., Tang, Q., Yu, Q., et al. (2018). The m(6)a reader ECT2 controls trichome morphology by affecting mRNA stability in arabidopsis. Plant Cell 30, 968–985. doi: 10.1105/tpc.17.00934
Wu, J., Wang, Z., Shi, Z., Zhang, S., Ming, R., Zhu, S., et al. (2013). The genome of the pear (Pyrus bretschneideri Rehd.). Genome Res. 23, 396–408. doi: 10.1101/gr.144311.112
Xie, C., Mao, X., Huang, J., Ding, Y., Wu, J., Dong, S., et al. (2011). KOBAS 2.0: a web server for annotation and identification of enriched pathways and diseases. Nucleic Acids Res. 39, W316–W322. doi: 10.1093/nar/gkr483
Yue, H., Nie, X., Yan, Z., and Weining, S. (2019). N6-methyladenosine regulatory machinery in plants: composition, function and evolution. Plant Biotechnol. J. 17, 1194–1208. doi: 10.1111/pbi.13149
Zhang, Y., Liu, T., Meyer, C. A., Eeckhoute, J., Johnson, D. S., Bernstein, B. E., et al. (2008). Model-based analysis of ChIP-Seq (MACS). Genome Biol. 9:R137.
Zheng, G., Dahl, J. A., Niu, Y., Fedorcsak, P., Huang, C. M., Li, C. J., et al. (2013). ALKBH5 is a mammalian RNA demethylase that impacts RNA metabolism and mouse fertility. Mol. Cell 49, 18–29. doi: 10.1016/j.molcel.2012.10.015
Zheng, H., Li, S., Zhang, X., and Sui, N. (2020). Functional implications of active N(6)-methyladenosine in plants. Front. Cell Dev. Biol. 8:291. doi: 10.3389/fcell.2020.00291
Zheng, H., Su, X., Li, J., Song, Y., Song, J., Wang, F., et al. (2021). Analysis of N(6)-methyladenosine reveals a new important mechanism regulating the salt tolerance of sweet sorghum. Plant Sci. 304:110801. doi: 10.1016/j.plantsci.2020.110801
Keywords: transcriptomics, MeRIP-seq, plant defense, fire blight, mRNA stability, N6-methyladenosine (m6A)
Citation: Han C, Zhang F, Qiao X, Zhao Y, Qiao Q, Huang X and Zhang S (2022) Multi-Omics Analysis Reveals the Dynamic Changes of RNA N6-Methyladenosine in Pear (Pyrus bretschneideri) Defense Responses to Erwinia amylovora Pathogen Infection. Front. Microbiol. 12:803512. doi: 10.3389/fmicb.2021.803512
Received: 28 October 2021; Accepted: 30 December 2021;
Published: 10 February 2022.
Edited by:
Jianuan Zhou, South China Agricultural University, ChinaReviewed by:
Zongtao Sun, Ningbo University, ChinaMeng Yuan, Huazhong Agricultural University, China
Copyright © 2022 Han, Zhang, Qiao, Zhao, Qiao, Huang and Zhang. This is an open-access article distributed under the terms of the Creative Commons Attribution License (CC BY). The use, distribution or reproduction in other forums is permitted, provided the original author(s) and the copyright owner(s) are credited and that the original publication in this journal is cited, in accordance with accepted academic practice. No use, distribution or reproduction is permitted which does not comply with these terms.
*Correspondence: Xiaosan Huang, huangxs@njau.edu.cn; Shaoling Zhang, nnslz@njau.edu.cn
†These authors have contributed equally to this work