 Yoshihiro Ojima
 Tomomi Sawabe
 Mao Nakagawa1
 Makoto Miyata
- 1Department of Applied Chemistry and Bioengineering, Graduate School of Engineering, Osaka City University, Osaka, Japan
- 2Graduate School of Science, Osaka City University, Osaka, Japan
- 3The OCU Advanced Research Institute for Natural Science and Technology (OCARINA), Osaka City University, Osaka, Japan
Escherichia coli produces extracellular vesicles called outer membrane vesicles (OMVs) by releasing a part of its outer membrane. We previously reported that the combined deletion of nlpI and mlaE, related to envelope structure and phospholipid accumulation in the outer leaflet of the outer membrane, respectively, resulted in the synergistic increase of OMV production. In this study, the analysis of ΔmlaEΔnlpI cells using quick-freeze, deep-etch electron microscopy (QFDE-EM) revealed that plasmolysis occurred at the tip of the long axis in cells and that OMVs formed from this tip. Plasmolysis was also observed in the single-gene knockout mutants ΔnlpI and ΔmlaE. This study has demonstrated that plasmolysis was induced in the hypervesiculating mutant E. coli cells. Furthermore, intracellular vesicles and multilamellar OMV were observed in the ΔmlaEΔnlpI cells. Meanwhile, the secretion of recombinant green fluorescent protein (GFP) expressed in the cytosol of the ΔmlaEΔnlpI cells was more than 100 times higher than that of WT and ΔnlpI, and about 50 times higher than that of ΔmlaE in the OMV fraction, suggesting that cytosolic components were incorporated into outer-inner membrane vesicles (OIMVs) and released into the extracellular space. Additionally, QFDE-EM analysis revealed that ΔmlaEΔnlpI sacculi contained many holes noticeably larger than the mean radius of the peptidoglycan (PG) pores in wild-type (WT) E. coli. These results suggest that in ΔmlaEΔnlpI cells, cytoplasmic membrane materials protrude into the periplasmic space through the peptidoglycan holes and are released as OIMVs.
Introduction
Outer membrane vesicles (OMVs) are nanosized, spherical, bilayered membranous structures with a diameter of 20–250 nm. OMVs are normally discharged from the surface of Gram-negative bacteria, including Escherichia coli (Schwechheimer and Kuehn, 2015; Toyofuku et al., 2019). OMVs contain outer membrane proteins, lipids, periplasmic proteins, lipopolysaccharides, RNA, and DNA.
Vesicle formation is promoted by a disturbance in growth, turnover in cell wall components, or exposure to antibiotics (Schwechheimer and Kuehn, 2015; Toyofuku et al., 2019). Particularly, envelope stress and phospholipid accumulation in the outer membrane have been established as the dominant factors of OMV production in Gram-negative bacteria (Toyofuku et al., 2019). The cell envelope, comprising a peptidoglycan (PG)-containing cell wall and a lipopolysaccharide-containing outer membrane, is organized in wild-type (WT) Gram-negative bacteria. In E. coli, the nlpI gene encodes an outer membrane lipoprotein (Lpp; Ohara et al., 1999). The deletion of nlpI gene decreases the crosslinks lipoprotein–peptidoglycan (Lpp-PG): the amount of Lpp-PG crosslinks is approximately 40% lower in the hypervesiculating nlpI mutant than in the WT strain and caused changes in envelope structure (McBroom and Kuehn, 2007; Schwechheimer et al., 2015). The balance between the breakdown and synthesis of PG is modified in the nlpI mutant, preventing the formation of proper crosslinks indirectly leading to OMV production (Schwechheimer and Kuehn, 2015). Other studies showed phospholipid accumulation in the outer leaflet of the outer membrane causes the dysfunction associated with disruption of VacJ (also known as MlaA) and Yrb, which encodes an ATP-binding cassette transport system, thus increasing OMV production in Gram-negative bacteria Haemophilus influenzae and Vibrio cholerae (Roier et al., 2016). This observation confirms a genome-wide assessment of OMV production in E. coli that demonstrated the increase in vesiculation in the mlaA (vacJ) and mlaE (yrbE) mutants (Kulp et al., 2015). Thus, both changes in envelope structure and phospholipid accumulation are essential endogenous factors promoting OMV production. Even more interesting, in our previous study, the double-gene knockout mutant ΔmlaEΔnlpI of E. coli that has both properties of changes in envelope structure and phospholipid accumulation demonstrated the synergistic increase of OMV production (Ojima et al., 2020). Furthermore, green fluorescent protein (GFP) fused with the outer membrane protein W (OmpW) was expressed in OMVs to evaluate their capacity for protein secretion. Western blot analysis showed that OmpW-GFP secretion by the OMVs in the culture medium of ΔmlaEΔnlpI strain reached 3.3 mg/L; 500 times that of the WT strain (Ojima et al., 2020). Since the OMV production by ΔmlaEΔnlpI was 30 times that of the WT strain, a 500-fold increase in OmpW-GFP secretion by ΔmlaEΔnlpI could not be fully explained by an increase in OMV production.
Several types of novel OMV, such as outer-inner membrane vesicles (OIMVs) or explosive outer membrane vesicles (EOMVs), have been reported (Toyofuku et al., 2019). The first evidence for OIMVs was provided via a transmission electron cryomicroscopy study of the supernatant of Shewanella vesiculosa M7 that clearly demonstrated the production of double bilayered OMVs (Pérez-Cruz et al., 2013). Moreover, this study showed that the OIMVs contained intracellular molecules such as DNA. Conversely, the ΔtolB mutant of Buttiauxella agrestis produced multilamellar and multivesicular OMVs (M-OMVs). M-OMV is defined to contain triple-lamellar membrane vesicles and multiple vesicle-incorporating vesicles. The deletion of tolB, which encodes part of the Tol-Pal system, causes the production of multiple types of vesicles and increases the overall vesicle production in JCM 1090 T, a hypervesiculating strain of B. agrestis (Takaki et al., 2020). The visualization of the intracellular compartments of the ΔtolB cells by quick-freeze deep-etch electron microscopy (QFDE-EM) showed that vesicles had accumulated in the broad periplasm, likely because of the dissociation of the outer membrane from the underlying PG. The outer membrane was invaginating to create vesicles, and the precursor of M-OMVs was present in the cell. Considering these reports together with our previous results, the double-deletion strain of E. coli ΔmlaEΔnlpI may produce M-OMVs, including OIMVs. Such a phenomenon may explain the 500-fold increase in GFP secretion that cannot be explained only by increased OMV production.
In this study, we investigated the mechanism underlying the OMV hypervesiculation in the single-deletion mutants ΔmlaE and ΔnlpI and the double-deletion mutant ΔmlaEΔnlpI, using QFDE-EM. We also examined the properties of the OMVs produced by a double-deletion mutant. Finally, we discussed the possibility of OIMV production in E. coli.
Materials and Methods
Bacterial Strains and Culture Conditions
The strains and plasmids used in this study were listed (Table 1). The WT E. coli K-12 strain BW25113 and its derivatives were obtained from the National BioResource Project [National Institute of Genetics (NIG), Mishima, Japan; Baba et al., 2006]. The double-gene knockout mutants were constructed by P1 transduction using the P1kc phage (Ojima et al., 2020). Each strain was transformed with pCA24N-gfp (Ojima et al., 2018) to express the His-tagged GFP in the cytosol.
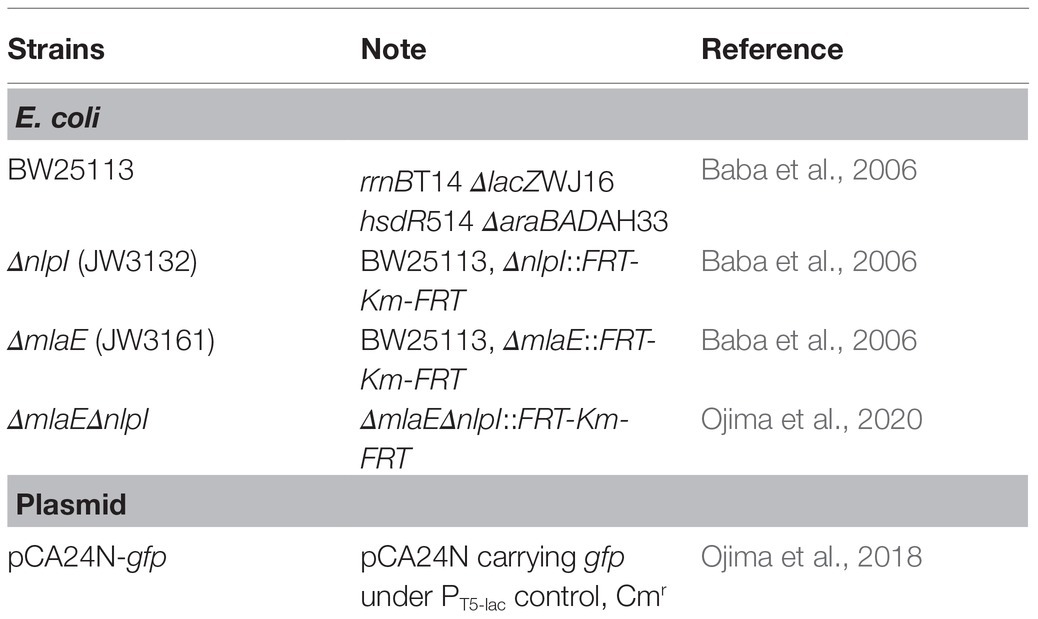
Table 1. Escherichia coli strains and plasmid used in this study.
The E. coli cells were cultured in lysogeny broth (LB; 10 g/L Bacto™ Tryptone, 5 g/L yeast extract, and 10 g/L NaCl). The culture medium for the strains harboring pCA24N-gfp was supplemented with 50 mg/L chloramphenicol and 1 mM IPTG. All the test cultures were precultured in LB for 18 h at 37°C and inoculated into 100 ml of fresh LB in a 500 ml baffled conical flask to achieve the optical density at 660 nm (OD660) of 0.01. The cultures were incubated on an NR-30 rotary shaker (Taitec, Osaka, Japan) at 140 strokes/min. Cell growth was measured at OD660.
Cell Volume Distribution Analysis Using qNano System via Scanning Ion Occlusion Sensing
Cells of each strain were harvested at 3 and 24 h after inoculation by centrifugation at 10,000 × g and 4°C for 10 min. Cells were washed by filtrated PBS (pH7.5) and resuspended in PBS. Cell size distribution analysis was conducted using the qNano system (qNano, IZON Science Ltd., Christchurch, New Zealand) equipped with Nanopore NP-1000. Scanning ion occlusion sensing allows single-particle measurements since colloids or biomolecular analytes or both are driven through pores one at a time. Particles crossing the nanopore are detected as a transient change in the ionic current flow, also denoted as a blockade event whose amplitude is the blockade magnitude. As blockade magnitude is proportional to particle size, accurate particle sizing can be achieved after calibration with a known standard. Here, size calibration was conducted using CPC1000 standard particles.
Quick-Freeze, Deep-Etch EM
For QFDE-EM analysis, bacterial cells were first washed with PBS (pH 7.5) twice, resuspended in HEPES-NaCl buffer or 15% (v/v) glycerol solution, and centrifuged (Tulum et al., 2019; Takaki et al., 2020). Then, a rabbit lung slab, mica flakes, and bacterial cell pellets were placed in this order onto a paper disk attached to an aluminum disk, and the samples were quickly frozen using liquid helium with a CryoPress (Valiant Instruments, St. Louis, MO, United States). The rabbit lung slab and the mica flakes function as shock absorber in quick freezing and flat background in observation, respectively. The specimens were stored in a chamber at −180°C using a JFDV freeze-etching device (JEOL, Tokyo, Japan). After the samples’ temperature was increased to −120°C, they were freeze-fractured with a knife and freeze-etched at −104°C for 15 min. The freeze-etched step was omitted when 15% (v/v) glycerol was used as the solvent. Subsequently, the samples were coated with platinum at a thickness of 2 nm and a rotary shadowing angle of 20° and then coated with carbon at a rotary shadowing angle of 80°. Next, the replicas were floated on full-strength hydrofluoric acid, rinsed in water, cleansed with commercial bleach containing sodium hypochlorite, rinsed in water, and finally placed onto 400-mesh Cu grids. The replica specimens were observed with transmission electron microscopy (TEM) using a JEM-1010 (JEOL).
Isolation and Observation of Outer Membrane Vesicles
Outer membrane vesicles were isolated as previously described (Gujrati et al., 2014) with some modifications. After incubation for 24 h, 100 ml of the E. coli culture was centrifuged at 10,000 × g for 10 min at 4°C to remove the cells. Then, the supernatant was passed through a 0.45 μm filter. Ammonium sulfate was added at the final concentration of 400 g/L to incubate for 1 h at room temperature to precipitate the contents. Crude OMVs were obtained via centrifugation at 11,000 × g for 30 min at 4°C. The crude extracts were dissolved in 500 μl of 15% (v/v) glycerol and concentrated using a CS100FNX ultracentrifuge (Hitachi Koki Co., Tokyo, Japan) at 109,000 × g for 1 h. The OMV pellets were resuspended in 100 μl of 15% (v/v) glycerol. The resulting OMV samples were 1,000 times more concentrated than that in the original culture because of the volume decreasing from 100 ml to 100 μl. The OMV samples were placed onto a 200-mesh copper grid and negatively stained with 4% uranyl acetate for TEM observation under a JEM-2100 (JEOL).
Evaluation of OMV Production and GFP Secretion Through OMVs
Ten microliters of the isolated OMVs or a culture of E. coli cells was analyzed via sodium dodecyl sulfate–polyacrylamide gel electrophoresis (SDS-PAGE) and Coomassie Blue staining. OMV production was quantified as previously described (Schwechheimer and Kuehn, 2013) with some modifications. The OMV concentration was measured by quantifying the band at approximately 37 kDa in the SDS-PAGE gel using the Image J software (National Institutes of Health, Bethesda, MD, United States). The OMV production of each mutant was shown as relative value to WT.
Outer membrane vesicles were also quantified with a lipophilic dye FM4-64 according to a previously described method with minor modifications (McBroom et al., 2006; Manning and Kuehn, 2011; Klimentová and Stulík, 2015). Isolated OMVs were incubated with 5 μg/ml FM4-64 (Molecular Probes/Thermo Fisher, Waltham, MA, United States) in PBS (pH 7.5) for 20 min. Then, OMVs were measured at the excitation and emission wavelengths of 558 and 734 nm, respectively, using an INFINITE 200 PRO spectrofluorophotometer (TECAN, Switzerland). The OMV sample without staining by a lipophilic dye (FM4-64) or the lipophilic dye alone was used as the negative controls.
The His-tagged GFP included in OMV samples was analyzed via western blotting by first transferring the protein from a gel to an Immobilon-P membrane sheet (Merck Millipore, Billerica, MA, United States) using the semidry transfer method. The blot was hybridized with an anti-histidine-tag primary monoclonal antibody (Medical & Biological Laboratories Co., Nagoya, Japan) and then a secondary antibody, the anti-mouse immunoglobulin G (whole molecule)–alkaline phosphatase (Sigma-Aldrich, St. Louis, MO, United States). The hybridization signals were detected using a BCIP-NBT Solution Kit for Alkaline Phosphatase Stain (Nacalai Tesque, Kyoto, Japan). The level of the target protein was quantified by analyzing the bands on the western blot band using densitometry. GFP secretion was quantified on the basis of the intensity of a GFP standard sample (50 μg/L) with a His-tag (Sino Biological Inc., Beijing, China). The GFP produced in each E. coli cell was also analyzed via western blotting. In the case of cell analysis, a 10 μl sample at OD660 = 0.3 was loaded into each well of gel to include the same amount of cells.
The GFP-derived fluorescence of the OMV samples was observed at an excitation wavelength of 488 nm using a confocal laser scanning microscope (CLSM; DM6000B, Leica, Wetzlar, Germany) with the TCS SP8 software.
Determination of OMV Size Using Dynamic Light Scattering
Outer membrane vesicles isolated by ultracentrifugation as described above were resuspended in PBS buffer (pH 7.5). After dilution of OMV samples with pure water, dynamic light scattering (DLS) measurements were conducted at 25°C using a ZetaSizer NanoSeries equipped with a HeNe laser source (λ = 633 nm; Malvern Instruments Ltd., Worcestershire, United Kingdom) and analyzed using the Dispersion Technology Software (Malvern Instruments Ltd.). For each sample, the autocorrelation function was the average of five 10 s runs and then repeated approximately 3–6 times. CONTIN analysis was subsequently used for the number vs. hydrodynamic size profiles to study the dispersions.
Preparation of E. coli Sacculi and Observation via TEM or QFDE-EM
After 24 h in culture, the E. coli cells were collected via centrifugation at 10,000 × g and 4°C for 10 min and suspended in PBS buffer (pH 7.5). These steps were repeated once. Then, the cells were resuspended in 10% SDS (w/v) and incubated at 95°C for 12 h. The sacculi were harvested via centrifugation at 200,000 × g and 20°C for 40 min, washed three times in Milli-Q water, and observed using TEM with negative staining or QFDE-EM.
Results
Properties of Cells and OMVs in Each E. coli Mutant
The cell growth, cell volume, relative OMV production, and average OMV size of each strain of hypervesiculating E. coli, including the single-deletion mutants ΔmlaE and ΔnlpI and the double-deletion mutant ΔmlaEΔnlpI at the end of a 24 h culture, were measured (Table 2). The OD660 and relative OMV production based on the SDS-PAGE analysis were taken from our previous study (Ojima et al., 2020).
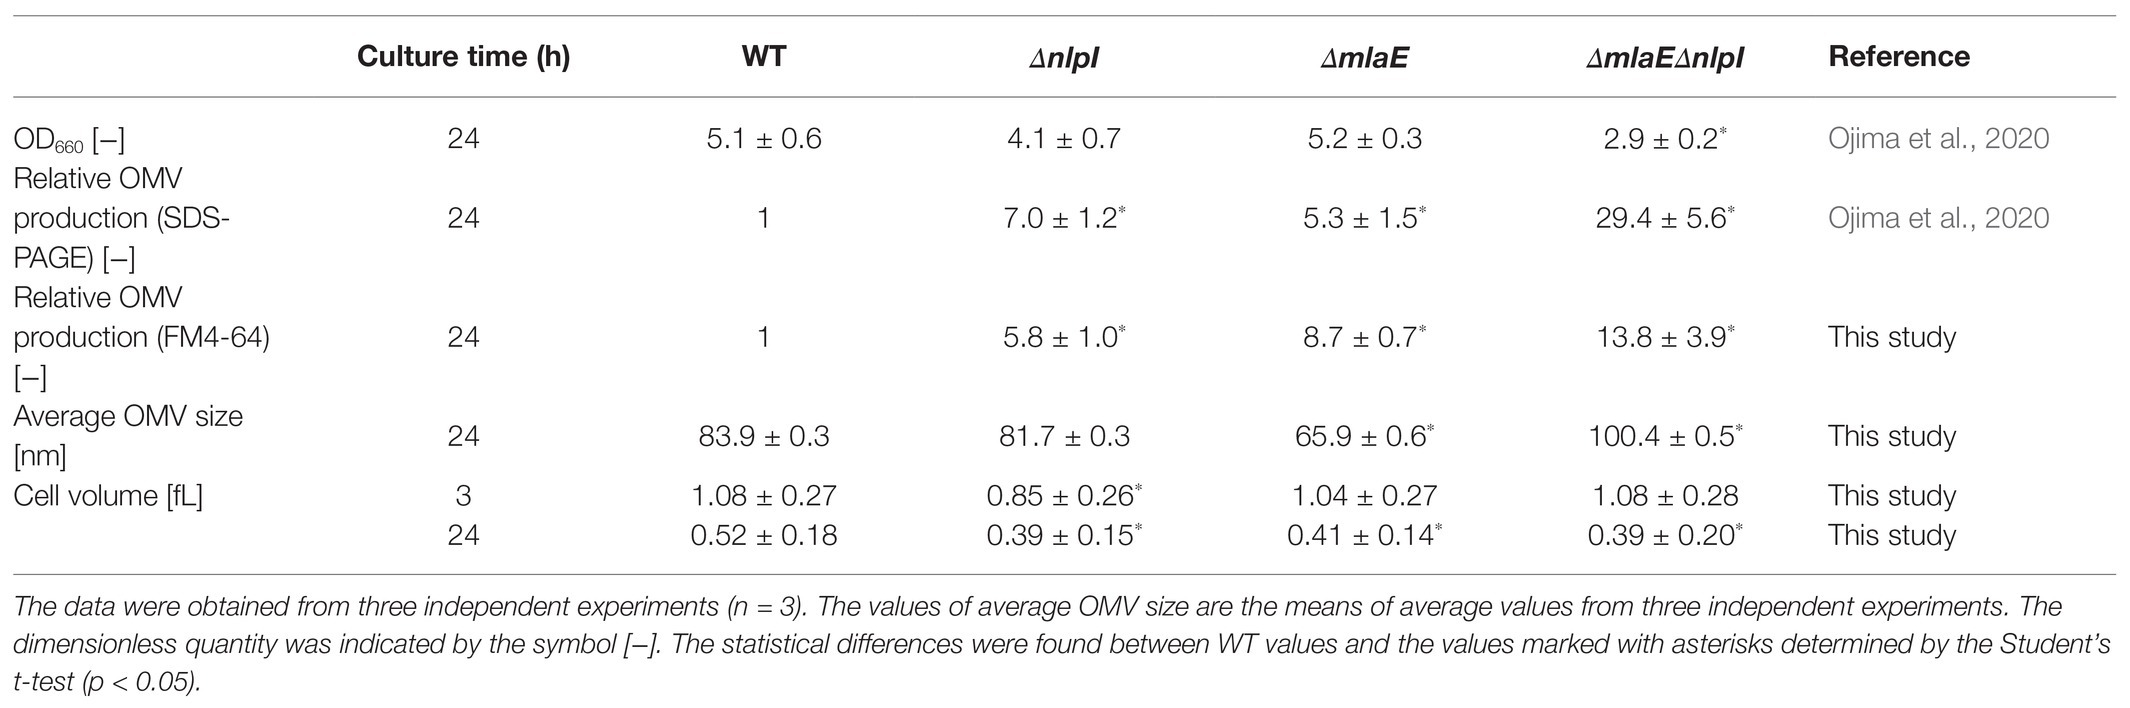
Table 2. Summary of cell growth, cell size, relative OMV production, and OMV size of each E. coli strain.
In this study, OMV production was quantified with a lipophilic dye, FM4-64. The relative OMV production by ΔnlpI and ΔmlaE strains assayed with FM4-64 was 5.8 and 8.7 times, respectively, that of the WT strain (Table 2), consistent with the results from the SDS-PAGE analysis in our previous study. Meanwhile, the OMV production by ΔmlaEΔnlpI strain was determined to be approximately 14 times higher than that of the WT strain, in contrast to the 30-fold difference revealed via the SDS-PAGE in the previous study. Although there was a deviation depending on the measurement method, it was again confirmed that the OMV production was significantly increased in ΔmlaEΔnlpI.
Next, the diameter of the OMVs in each strain was measured via DLS, and the size distribution of the OMVs was plotted (Figure 1). The WT strain had a normal size distribution, with a peak value of approximately 8% at approximately 90 nm; this distribution agreed with previous research (Alves et al., 2016). The average OMV size was 83.9 ± 0.3 nm (Table 2). The values are the means of average values from three independent experiments. The distribution of the OMVs of ΔnlpI strain almost overlapped with that of WT strain; the average size of ΔnlpI OMVs was 81.7 ± 0.3 nm, comparable with that of the WT strain. Meanwhile, the distribution of the ΔmlaE OMVs shifted to a smaller value, with a peak value of 8% at approximately 60 nm. The average OMV size of ΔmlaE was 65.9 ± 0.6 nm. These data suggested that ΔmlaE produced smaller OMVs. By contrast, the distribution of ΔmlaEΔnlpI shifted to a larger value, with the peak value of 10% at approximately 100 nm. Furthermore, the plot of ΔmlaEΔnlpI strain was not a normal distribution; it had a shoulder at approximately 70 nm. The average OMV size was 100.4 ± 0.5 nm, significantly larger than that of WT strain. Therefore, the size distributions of the OMVs differ between the knockout mutant strains.
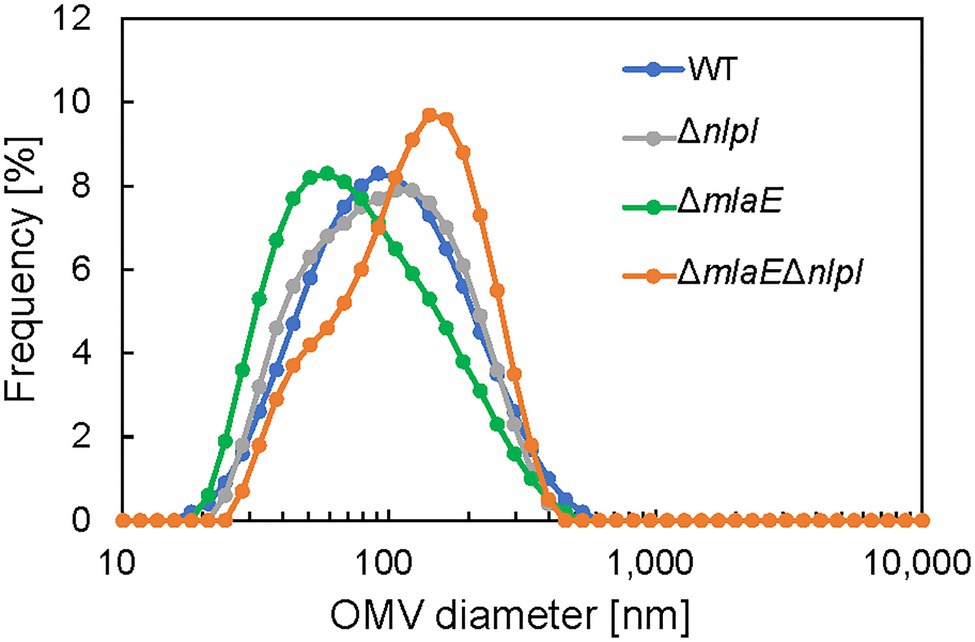
Figure 1. Distribution of outer membrane vesicle (OMV) diameter in each Escherichia coli strain. The OMV samples were collected after 24 h in culture. The diameter of the OMVs was determined using dynamic light scattering (DLS).
The cell volume of each strain was measured at 3 and 24 h postinoculation using qNano and plotted in histograms (Supplementary Figure S1). At 3 h, the plot of ΔnlpI shifted to a smaller value than the others. The cell volume of the WT strain was 1.08 ± 0.27 fL, consistent with that observed in E. coli cells, at 1.16 fL, in a previous study (Yamada et al., 2017). The cell volumes of ΔmlaE and ΔmlaEΔnlpI strains were 1.04 ± 0.27 and 1.08 ± 0.28 fL, respectively. The deletion of these genes likely did not affect the cell volume in the growth phase. By contrast, the cell size of ΔnlpI was slightly smaller than the others at 0.85 ± 0.26 fL.
At 24 h, all the cell volume plots also followed a normal distribution; however, the plots of the mutant strains shifted to a smaller value compared with that of the WT strain. The cell volume of WT was 0.52 ± 0.18 fL, smaller than its volume at 3 h, consistent with a previous report that the cell volume of E. coli decreased to approximately 0.5 fL in a medium with poor nutrients (Kubitschek, 1990). Thus, it is reasonable that the cell size decreases in the stationary phase. The cell volumes of ΔnlpI, ΔmlaE, and ΔmlaEΔnlpI were 0.39 ± 0.15, 0.41 ± 0.14, and 0.39 ± 0.20 fL, respectively. Therefore, the cell volume was significantly smaller in the mutant strains at the end of the culture.
Observation of E. coli Cells Using Quick-Freeze, Deep-Etch EM
Since the cell size changed in the hypervesiculating strains, there might be a major change in the appearance of the cells. QFDE-EM is a powerful tool for investigating the spatial structure of bacterial envelopment (Tulum et al., 2019); it has been applied to analyze the biogenesis of OMV in B. agrestis (Takaki et al., 2020). Here, the cell structure of each E. coli strain was visualized using QFDE-EM. The cells at 24 h were collected, centrifuged, placed on glass, frozen, fractured, deeply etched, and shadowed with platinum. Then, the platinum replicas were recovered and observed.
The shape and dimensions of the WT cells were consistent with the images of living WT cells obtained by optical microscopy (Figures 2A,C). The surface of the WT cells was observed using QFDE-EM (Figures 2C,D). The ΔmlaEΔnlpI cells appeared longer than the WT cells (Figures 2B,E,F); furthermore, several mutant cells were observed to form vesicles (Figure 2E). The magnified images demonstrated that the ΔmlaEΔnlpI cells generated OMVs from the tip of their long axis; the diameters of the OMVs were approximately 400 (Figure 2G) and 200 nm (Figure 2H). The size of these OMVs is relatively larger but in the range of the size distribution (Figure 1).
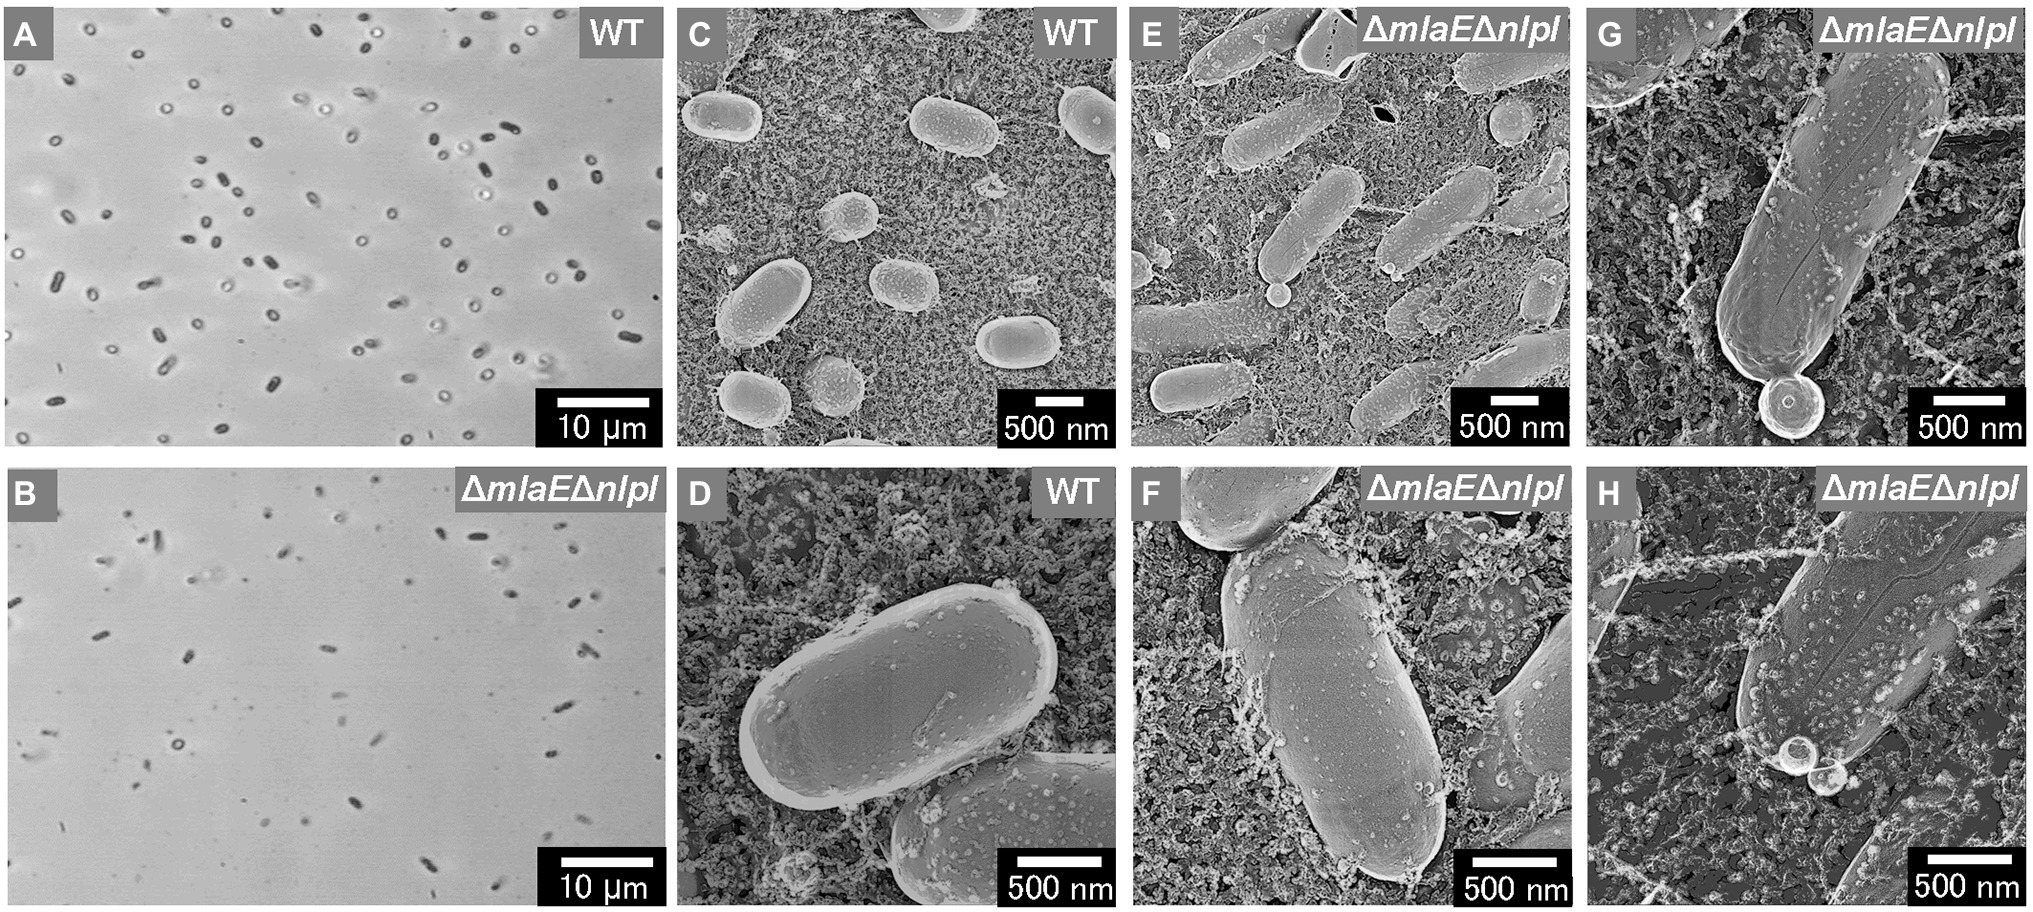
Figure 2. Surface structure of the wild-type (WT) E. coli BW25113 and ΔmlaEΔnlpI cells visualized via quick-freeze, deep-etch electron microscopy (QFDE-EM). (A,B) Phase-contrast optical microscopy image of the WT (A) and ΔmlaEΔnlpI cells (B). (C) Field image of the WT cells. (D) Magnified image of the surface of WT cells. (E) Field image of the ΔmlaEΔnlpI cells. (F–H) Magnified image of the surface of ΔmlaEΔnlpI cells.
The intracellular compartments, i.e., outer membrane, inner membrane, and cytoplasm (CP), of the WT cells were visualized using the freeze-fractured sections without the freeze-etched step (Figures 3A,B). The ΔmlaEΔnlpI cells were elongated, and large periplasmic spaces were observed in most cells (Figures 3C,D). The magnified images revealed that plasmolysis was induced in these mutant cells (Figures 3E,F). Plasmolysis is the shrinking of protoplasm away from the cell wall of a plant or bacterium (Woldringh, 1994; Lang et al., 2014). The protoplasmic shrinking is often due to water loss via exosmosis, thereby resulting in gaps between the cell wall and the plasma membrane. Clear plasmolysis was observed in approximately 50% or more of the ΔmlaEΔnlpI cells. Meanwhile, plasmolysis was also observed in the single-deletion mutants ΔnlpI and ΔmlaE, although less frequently than in the double-deletion mutant (Figures 3G,H). These results indicate that plasmolysis is a key factor for OMV production.
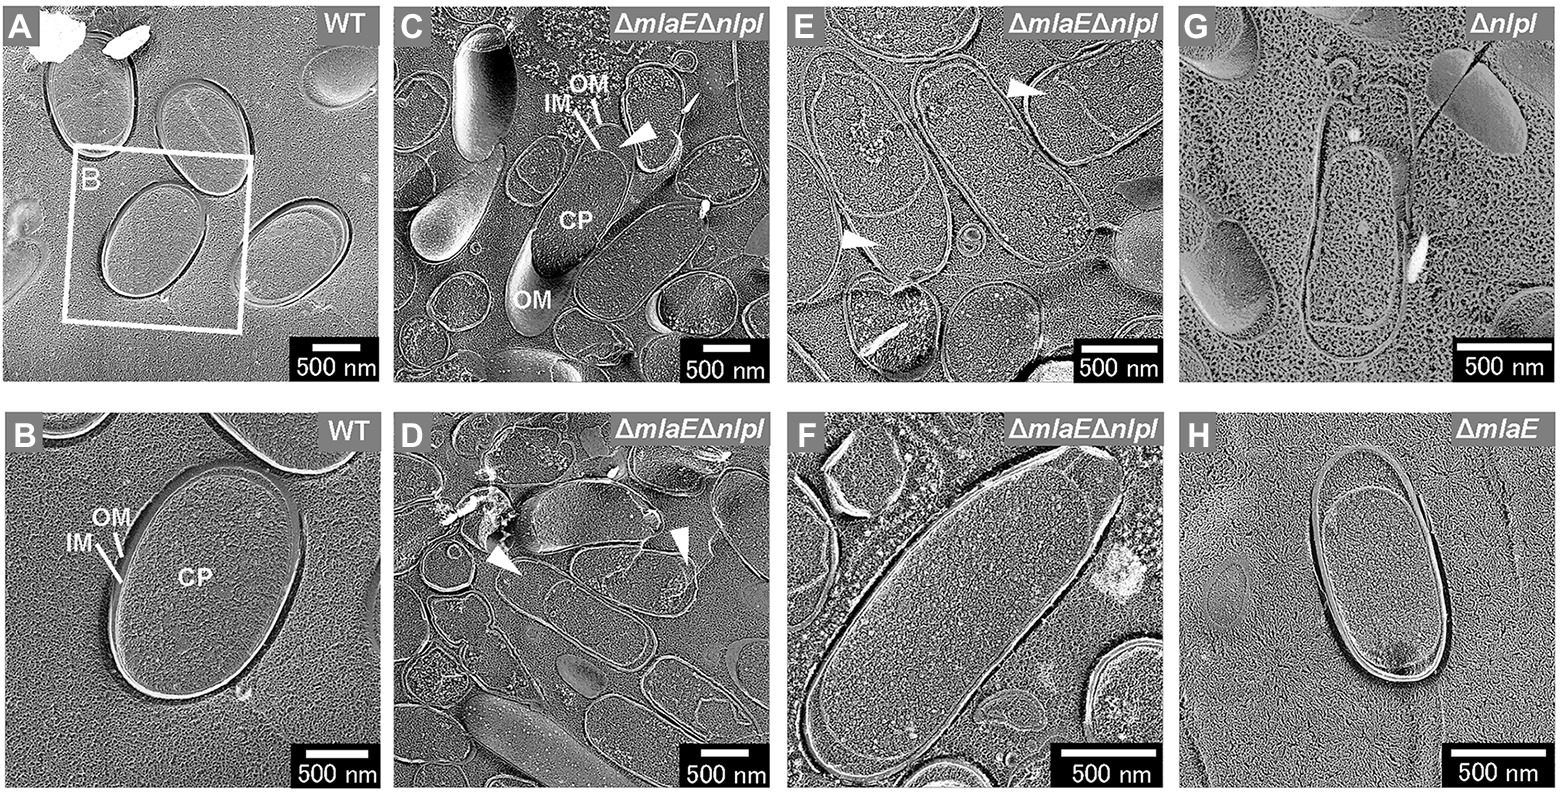
Figure 3. Cross-section of various fractured E. coli cells visualized by QFDE-EM. (A) Field image of cells. (B) Magnified image of the structure of the WT cells. (C) Field image of the ΔmlaEΔnlpI cells. OM, outer membrane; IM, inner membrane; and CP, cytoplasm. (D–F) Magnified image of the structure of the ΔmlaEΔnlpI cells. The arrowheads indicate the plasmolysis. (G) Magnified image of the structure of the ΔnlpI cells. (H) Magnified image of the structure of the ΔmlaE cell.
Further observation revealed that the tip of the plasmolyzed ΔmlaEΔnlpI cells was elongated, and OMVs were generated (Figures 4A,B). Since this phenomenon was frequently confirmed in many other cells (Figures 4C,D), it may be the main route of OMV production in the ΔmlaEΔnlpI cells. Interestingly, intracellular vesicles in the enlarged periplasmic space were observed in the ΔmlaEΔnlpI cells (Figure 4D). In the left cell of Figure 4D; the intracellular vesicle appeared to be produced by the destruction of the inner membrane. By contrast, these intracellular vesicles were observed at an exceptionally low frequency in the ΔnlpI cells (Figure 4E), and never observed in the WT and ΔmlaE cells. Even more interesting, multilamellar OMVs were observed in the ΔmlaEΔnlpI cells (Figure 4F). To further confirm the existence of multilamellar OMVs, the OMVs were isolated by ultracentrifugation and negatively stained with uranyl acetate (Figure 5). The multilamellar OMVs were observed in the ΔmlaEΔnlpI sample (Figure 5B). In addition, the multilamellar OMVs were observed in ΔnlpI samples at an extremely low frequency (Figure 5C). By contrast, multilamellar OMVs were not observed in the WT and ΔmlaE cells (Figures 5A,D). These results are consistent with those from QFDE-EM that intracellular vesicles were observed in the ΔmlaEΔnlpI cells, at a low frequency in the ΔnlpI, and never observed in the WT and ΔmlaE cells.
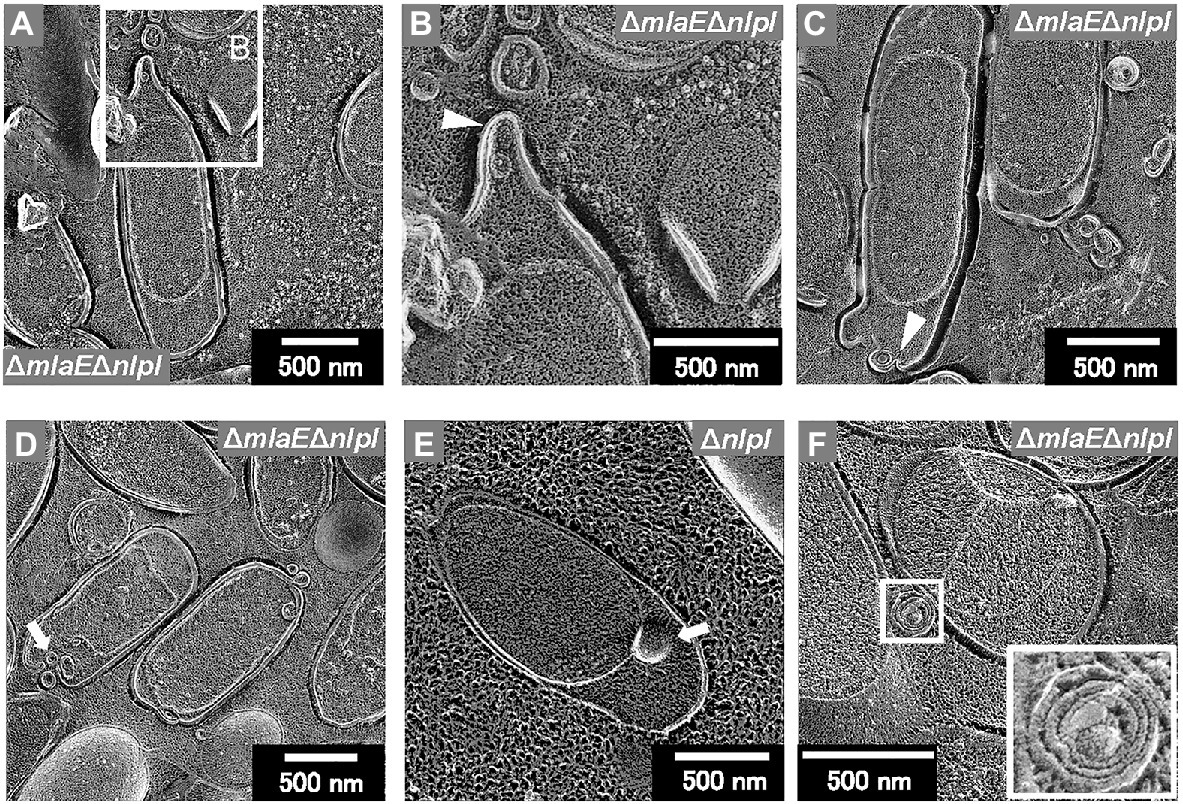
Figure 4. Cross-section of plasmolyzed E. coli cells. (A–D) Magnified image of the structure of the plasmolyzed ΔmlaEΔnlpI cells. The arrowheads indicate the blebbing from the outer membrane. (E) Magnified image of the structure of the plasmolyzed ΔnlpI cells. The arrows indicate the intracellular vesicle. (F) The multilamellar OMV generated from the ΔmlaEΔnlpI cells.
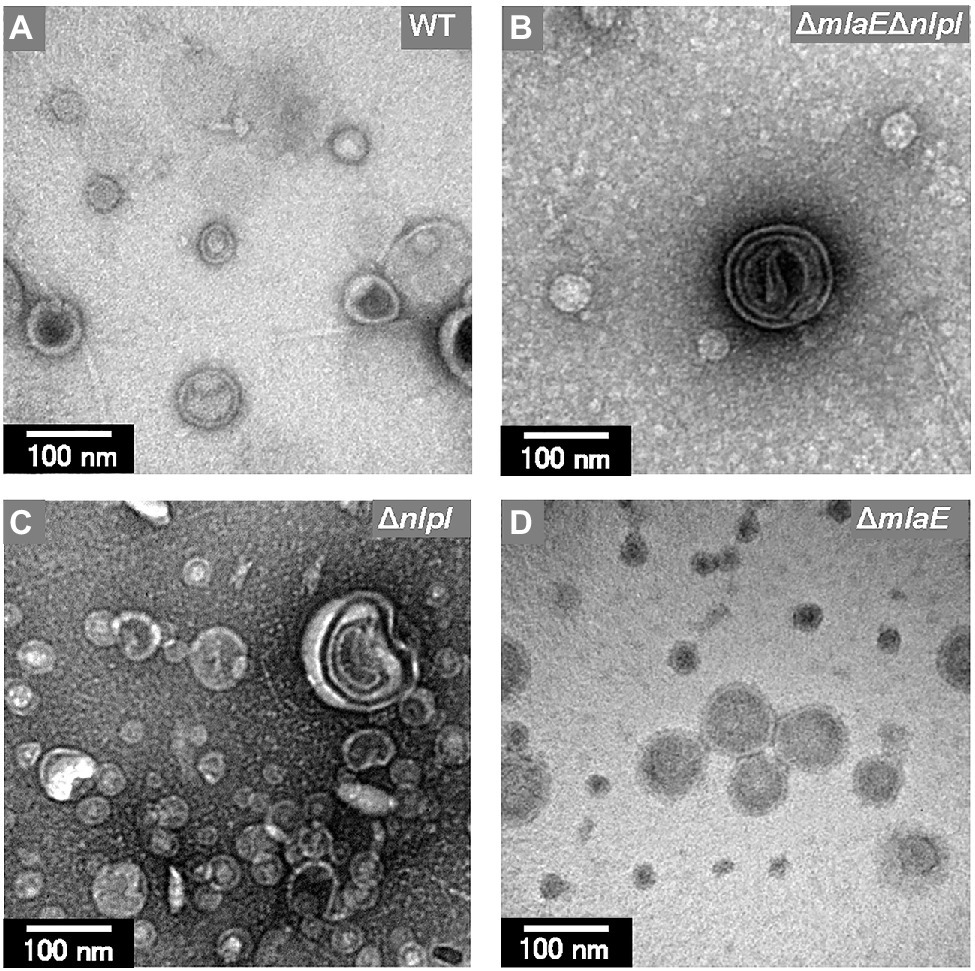
Figure 5. Transmission electron microscopy (TEM) images of the OMVs isolated from E. coli. (A) WT. (B) ΔmlaEΔnlpI. (C) ΔnlpI. (D) ΔmlaE strains. The OMVs were stained with uranyl acetate.
Secretion of Intracellularly Expressed GFP Through OMVs
To investigate the possibility that the multilamellar OMVs in ΔmlaEΔnlpI are OIMVs, the presence of cytosolic components in the multilamellar OMVs was examined by expressing recombinant GFP protein in the cytosol of each E. coli strain. In this case, recombinant GFP is not normally incorporated into OMVs because of its lack of a signal peptide. The OD660 values of the WT, ΔnlpI, ΔmlaE, and ΔmlaEΔnlpI strains expressing the pCA24N-gfp plasmid were measured (Figure 6A). The OD660 values of ΔnlpI and ΔmlaE were 4.6 ± 0.2 and 4.5 ± 0.1, respectively, lower than that of the WT strain at 6.0 ± 0.2. ΔmlaEΔnlpI mutant had the lowest OD660 at 2.7 ± 0.2.
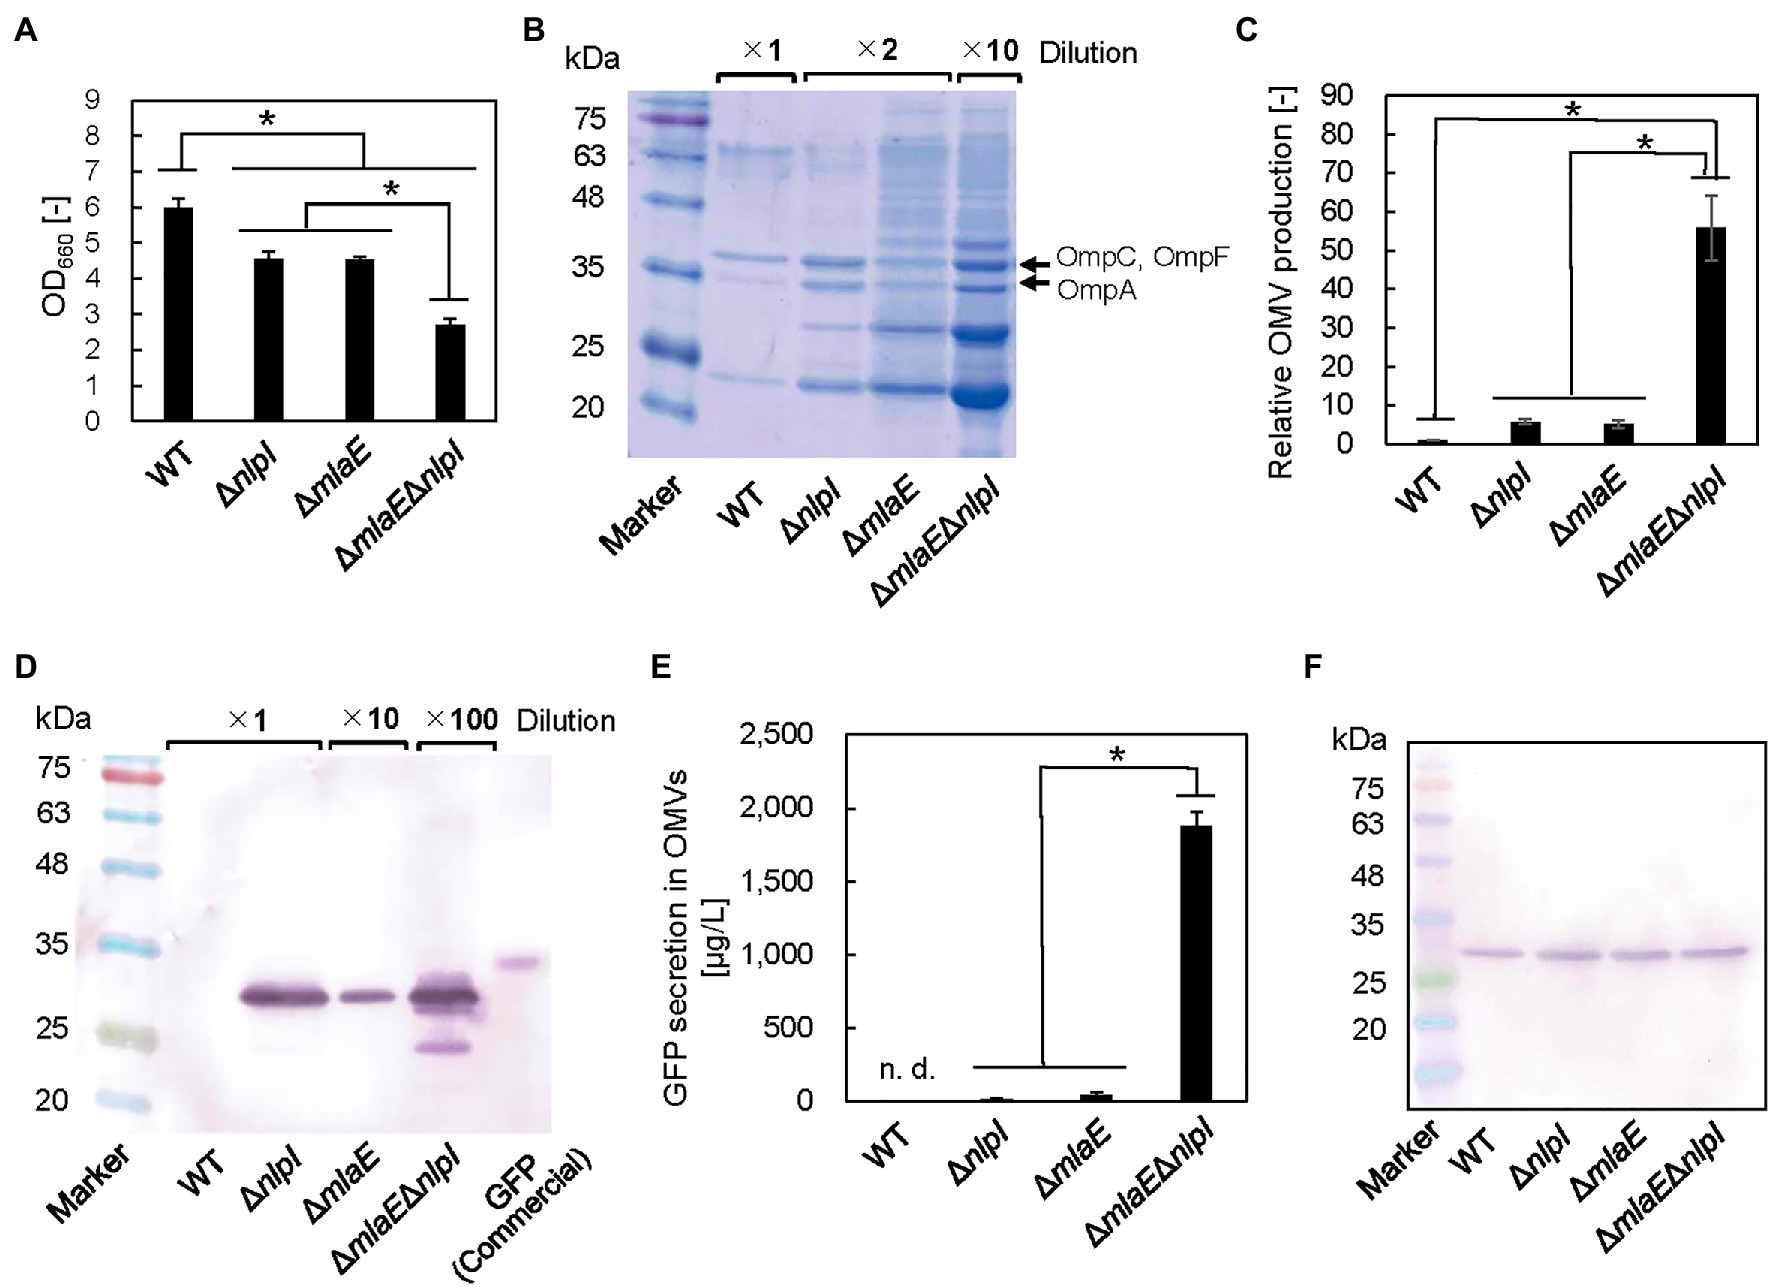
Figure 6. Green fluorescent protein (GFP) secretion in the OMV fraction isolated from each E. coli strain. (A) OD660 of each E. coli strain after 24 h in culture. (B) Sodium dodecyl sulfate–polyacrylamide gel electrophoresis (SDS-PAGE) analysis of the OMVs isolated from each E. coli strain. (C) Relative OMV production by each E. coli strain normalized to that by the WT strain. (D) Western blot analysis of secreted GFP using an anti-His-tag primary antibody. (E) Quantitative evaluation of GFP secretion in the OMV fractions of corresponding E. coli strains. (F) Western blot analysis of the GFP produced in each E. coli strain. Loading samples were prepared on an OD660 basis to include the same quantity of cells. Values were quantified on the basis of a GFP standard sample. The data are expressed as the mean of three independent experiments (n = 3) and SD (vertical bar). An asterisk indicates the statistical significance as determined by ANOVA with Tukey’s test (p < 0.05).
We also estimated OMV production on the basis of the densitometric analysis of the protein band at approximately 37 kDa that included OmpC, F combined with OmpA (Figures 6B,C). Although the OMV production by ΔnlpI/gfp and ΔmlaE/gfp strains was 5.7 ± 0.6 and 5.1 ± 1.0 times, respectively, that of the WT/gfp strain, the OMV production by ΔmlaEΔnlpI/gfp strain was found to be 55.8 ± 8.3 times that of the WT strain. These results suggested that introducing the pCA24N-gfp plasmid did not substantially affect the OMV production.
Figure 6D shows the results of western blots of GFP in the OMV fraction. Here, the OMV fraction was first collected as ammonium sulfate precipitate before ultracentrifugation step, which could have also precipitated soluble GFP from the culture supernatants if there were damaged cells and may not necessarily mean that the GFP is located inside the vesicles. However, in the preliminary experiments, the viability for each strain was similar; therefore, the E. coli cells were considered to be intact. Additionally, the OMV fraction was washed at ultracentrifugation step. These facts together indicate that the possibility of coprecipitation of soluble GFP is low. As the result, the bands appeared at the expected molecular mass of GFP protein at approximately 27 kDa, except for the WT strain (Figure 6D), suggesting that the OMV fraction from the WT strain did not contain detectable GFP. In the ΔnlpI/gfp and ΔmlaE/gfp strains, the same band appeared. This band was much more intense in ΔmlaEΔnlpI/gfp strain, even after a 1:100 dilution. The amount of GFP secreted through OMVs in the culture medium was quantified on the basis of the densitometry of the band in the western blot against the commercial GFP with a known concentration. Here, the commercial GFP band migrated at approximately 34 kDa. GFP was not detectable in the OMV fraction of the WT/gfp strain (Figure 6E). Since the recombinant GFP was produced in the cytosol, it is reasonable that the WT did not secrete GFP via OMV. Conversely, GFP secretion by ΔnlpI and ΔmlaE strains was 14.3 ± 6.8 and 36.5 ± 21.3 μg/L, respectively. The double-deletion mutant ΔmlaEΔnlpI/gfp secreted GFP at 1.8 ± 0.1 mg/L in the medium, significantly more than other strains. Considering that the secretion of GFP by WT was not detectable and less than that of ΔnlpI (14.3 ± 6.8 μg/L), the GFP secretion of ΔmlaEΔnlpI is more than 100 times higher than that of WT or ΔnlpI, and about 50 times higher than that of ΔmlaE. The OMV samples of WT/gfp and ΔmlaEΔnlpI/gfp cultures were observed using CLSM (Supplementary Figure S2). The OMV sample of ΔmlaEΔnlpI/gfp culture was much more fluorescent, consistent with the results from the western blots.
Because of the extremely high secretion of GFP by the ΔmlaEΔnlpI/gfp strain, we hypothesized that besides enhancing the OMV production, the deletion of both mlaE and nlpI genes increased the level of GFP in the E. coli cell. The same amount of whole-cell lysates was analyzed in western blotting to compare the GFP production in different cells (Figure 6F). The bands were similarly intense among the strains, suggesting that GFP production per cell unit was comparable. These results indicate that the increased amount of GFP in the OMV fraction of the ΔmlaEΔnlpI mutant was due to a promoted secretion of GFP rather than a high expression level in the cells.
Observation of PGs Using QFDE-EM
The existence of intracellular and multilamellar vesicles in the ΔmlaEΔnlpI cells was confirmed. Also, the secretion of an unusual amount of cytosolic GFP into the medium by the ΔmlaEΔnlpI cells was verified. These results suggested the generation of a hole in the PG layer might allow the release of the inner membrane with cytosolic components, followed by the formation of intracellular and multilamellar vesicles.
Thus, the sacculi of each E. coli strain were prepared according to previous research (Vollmer et al., 2008; Jeske et al., 2015). After negative staining with uranyl acetate, the thin sacculi of WT appeared as flat, empty cell envelopes (Figure 7A), as reported previously (Vollmer et al., 2008). The WT sacculi were further observed using QFDE-EM (Figures 7B–F). The surface of the typical WT sacculi appeared remarkably smooth (Figures 7B,C,E). The magnified images confirmed the roughness of the surface of the PG network (Figures 7D,F); however, no obvious holes were observed.
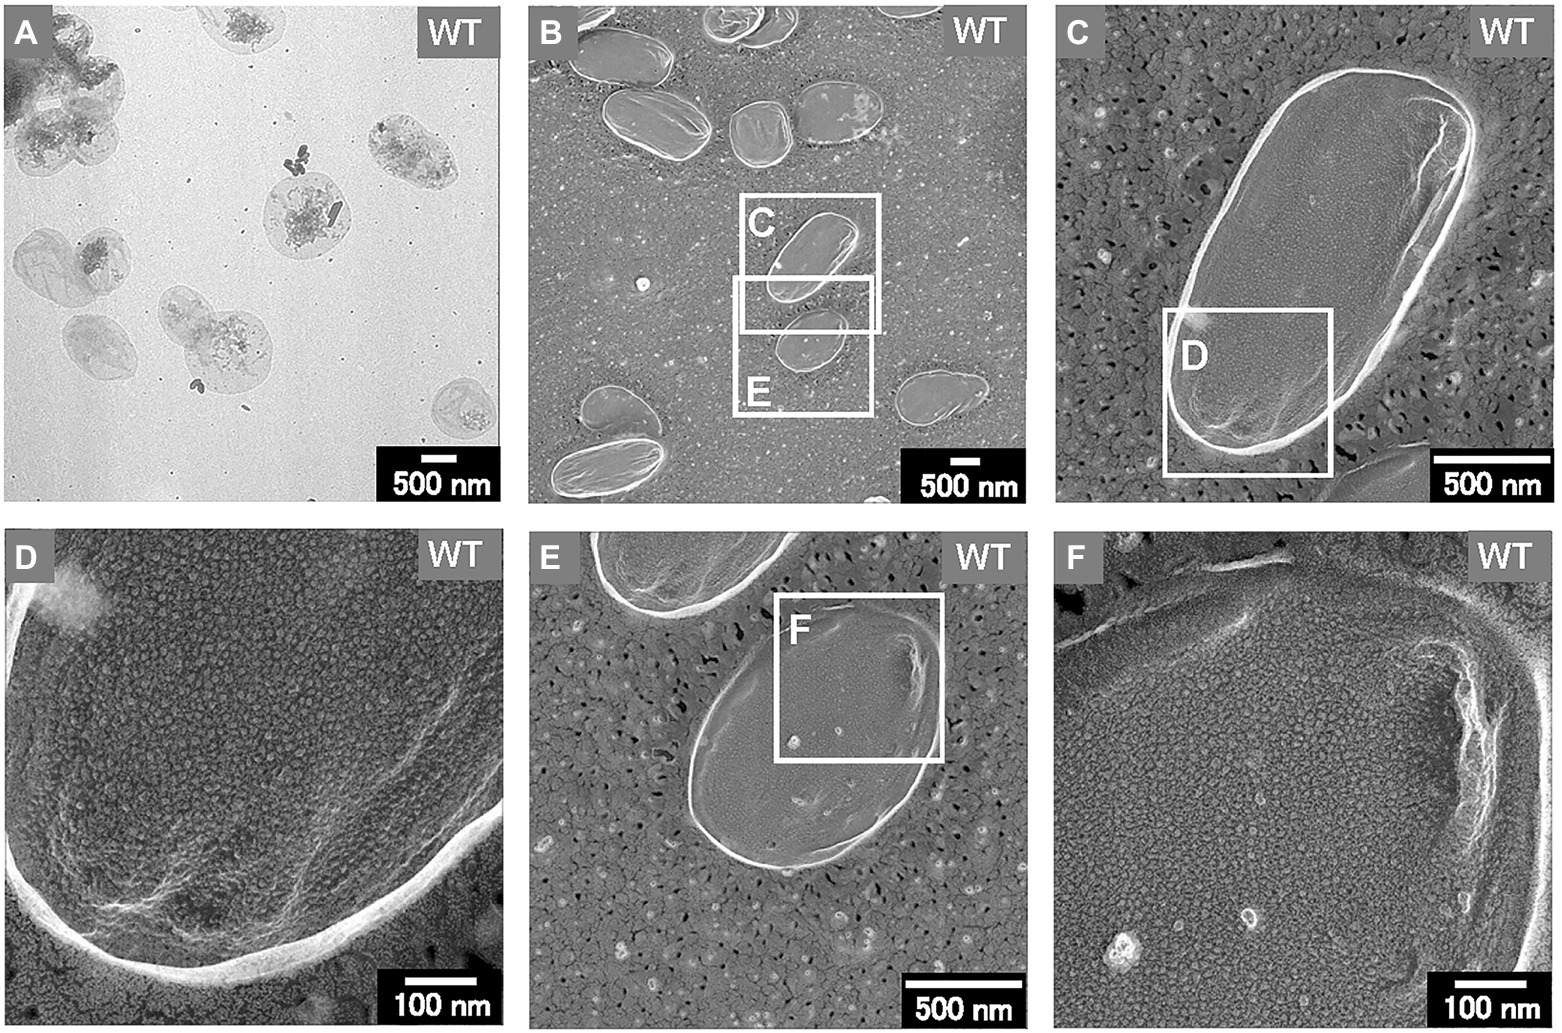
Figure 7. Sacculi of the WT E. coli cells. (A) The TEM image of the sacculi stained with uranyl acetate. (B–F) The surface structures of the sacculi were visualized by QFDE-EM.
Sacculi were also successfully prepared from the ΔmlaEΔnlpI cells (Figures 8A,B). The sacculi of the double-deletion mutant were longer on the long axis. The magnified QFDE-EM images showed that the ΔmlaEΔnlpI sacculi had several holes at the tip of the long axis (Figure 8C). The diameter of the largest hole was more than 50 nm (Figure 8D), substantially larger than the mean radius of the pores for E. coli PG, at 2.06 nm, in a previous report (Demchick and Koch, 1996). The holes at the tip of the long axis in the sacculi were confirmed in many other cells (Figure 8E). A magnified image revealed that although the sacculi appeared intact at lower magnifications, they had smaller holes that were noticeably larger than the pores for E. coli PG (Figure 8F). Such smaller holes were not observed in the WT sacculi. These results suggested that the generation of the holes in the PG layer of the ΔmlaEΔnlpI cells allowed the release of the inner membrane, followed by the intracellular and multilamellar vesicles.
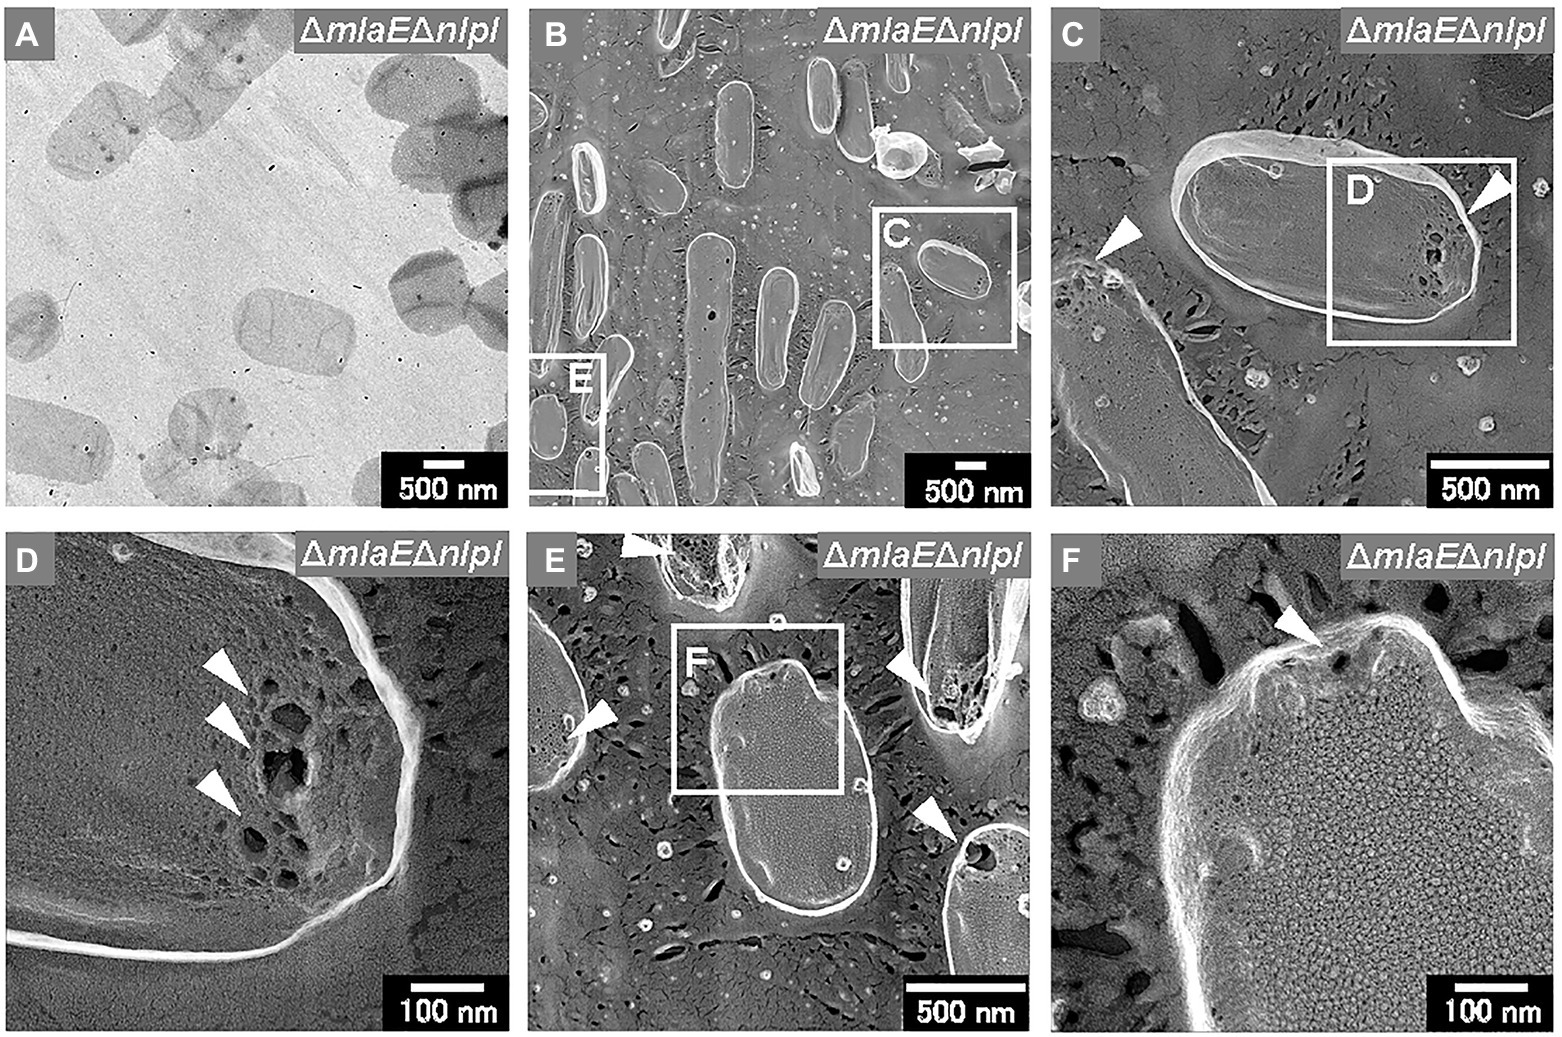
Figure 8. Sacculi of the ΔmlaEΔnlpI cells. (A) TEM image of sacculi stained with uranyl acetate. (B–F) Surface structures of the sacculi were visualized via QFDE-EM. The holes on the peptidoglycan (PG) surface are marked by arrowheads.
Discussion
Here, the properties of ΔmlaEΔnlpI cells and OMVs were compared with those of the WT and the single-deletion mutants, and an associated mechanism of hypervesiculation and OIMV production was proposed. First, the cell volume of each strain was measured to examine the relationship between OMV production and cell volume. The single and double-gene knockout mutants were shown to have a smaller cell volume at the end of the culture than the WT. However, there was no correlation between cell volume and OMV production in any strain.
Next, the cell structure of the strains was observed. The ΔmlaEΔnlpI cells were elongated and vesicles formed from the tip of their long axis. The formation of OMVs from cell tips has rarely been reported. The cross-sections of the fractured cytosol and membrane surface showed that the elongated ΔmlaEΔnlpI cells had been plasmolyzed, having large periplasmic spaces. Plasmolysis was also observed in the single-gene knockout mutant ΔnlpI and ΔmlaE cells, albeit at lower frequency than in the double-gene knockout mutant. Furthermore, intracellular vesicles were frequently observed in the ΔmlaEΔnlpI cells, at a low frequency in the ΔnlpI, and never observed in the WT and ΔmlaE cells.
Thus, this study has demonstrated that plasmolysis and intracellular vesicle production were induced in the hypervesiculating mutant E. coli cells. In the case of Gram-negative bacteria, plasmolysis has been observed in the response to moderated hyperosmotic stress with non-permeating solutes (Koch, 1998) and, at least transiently, in the case of higher osmotic shifts with permeating solutes like glycerol (Mille et al., 2002). In the presence of glycerol at approximately 50% (v/v), the E. coli cells maintained intact cytoplasmic membrane and produced small intracellular vesicles (Mille et al., 2002). Membrane vesiculation was also observed following severe dehydration involving cell death of E. coli (Schwarz and Koch, 1995) and could be facilitated by membrane structural changes like transition from lamellar to non-lamellar phases, combined with the increase in the surface/volume ratio related to water exit (Steponkus, 1999). The characteristics of ΔmlaEΔnlpI cells clarified in the study such as plasmolysis and intracellular vesicle production are similar to those when E. coli cells are exposed to high osmotic pressure.
Transmission electron microscopy analysis revealed the production of multilamellar OMVs by the ΔmlaEΔnlpI cells. These multilamellar OMVs were also confirmed in the ΔnlpI cells, albeit at a low level. The multilamellar OMVs may explain why the distribution of OMV size from ΔmlaEΔnlpI shifted to a larger value and that the plots did not follow a normal distribution, exhibiting a shoulder at approximately 70 nm.
It is notable that extracellular vesicles produced by Gram-negative bacteria include not only those originating from the outer membrane (OMVs), but also OIMVs and EOMVs, which are defined as OIMVs or EOMVs, respectively (Toyofuku et al., 2019). The first experimental evidence for OIMVs was provided by a transmission electron cryomicroscopy study of S. vesiculosa M7 supernatant (Pérez-Cruz et al., 2013) that clearly demonstrated the production of double bilayered OMVs. Meanwhile, the latest study reported that the deletion of tolB, encoding part of the Tol-Pal system, led to the production of multiple types of vesicles and increased overall vesicle production in the high vesicle-forming strain Buttiauxella agrestis JCM 1090 T (Takaki et al., 2020). The ΔtolB mutant strain produces M-OMVs. The visualization of the intracellular compartments of the ΔtolB cells via QFDE-EM showed that vesicles had accumulated in the large periplasm. The outer membrane formed invaginations to create vesicles, and the precursor of M-OMVs was present in the cell. Hence, multilamellar vesicles may be a characteristic of hypervesiculating strains.
Considering that the deletion of the nlpI gene prevented the formation of typical numbers of Lpp-PG crosslinks, there may be holes in the PG of the ΔmlaEΔnlpI cells. Through these openings, cytoplasmic membrane material may protrude into the periplasmic space, further releasing these intracellular vesicles into the extracellular space as OIMVs. This hypothesis was tested by expressing recombinant GFP in the cytosol of the ΔmlaEΔnlpI cells. As expected, the GFP secretion of ΔmlaEΔnlpI is more than 100 times higher than that of WT or ΔnlpI, and about 50 times higher than that of ΔmlaE, suggesting that cytosolic components were incorporated into OIMVs and discharged into the extracellular space.
Finally, the PG of the WT and ΔmlaEΔnlpI cells was isolated and observed using QFDE-EM. The PG of the WT cells had an exceptionally smooth appearance. By contrast, the surface of a typical ΔmlaEΔnlpI PG appeared very wrinkly and contained holes located at the tip of the long axis; a range of diameters of the holes are 10–50 nm. Interestingly, the critical pore size in the Gram-negative PG layer to initiate the bulging of the cytoplasmic membrane has been calculated to be approximately 20 nm (Daly et al., 2011). Some of the holes observed on the ΔmlaEΔnlpI PG were larger than 20 nm, indicating that the bulging of the cytoplasmic membrane occurred through large holes and intracellular vesicles was produced. On the basis of these findings, a model of the mechanism underlying the production of OMVs and the release of OIMVs in the ΔmlaEΔnlpI strain is proposed (Figure 9). In this model, plasmolysis frequently happens in ΔmlaEΔnlpI cells because of the malfunction of Lpp-PG crosslinking. Thus, the extra membrane is removed for producing OMVs. As for the release of the OIMVs, the cytoplasmic membrane material protrudes into the periplasmic space through the PG holes and is released as intracellular vesicles in ΔmlaEΔnlpI cells at the first step. Next, the intracellular vesicles are released with the outer membrane, forming multilamellar vesicles. This study provides the microscopic details of the mechanism by which OIMVs are produced by a multigene knockout mutant E. coli strain.
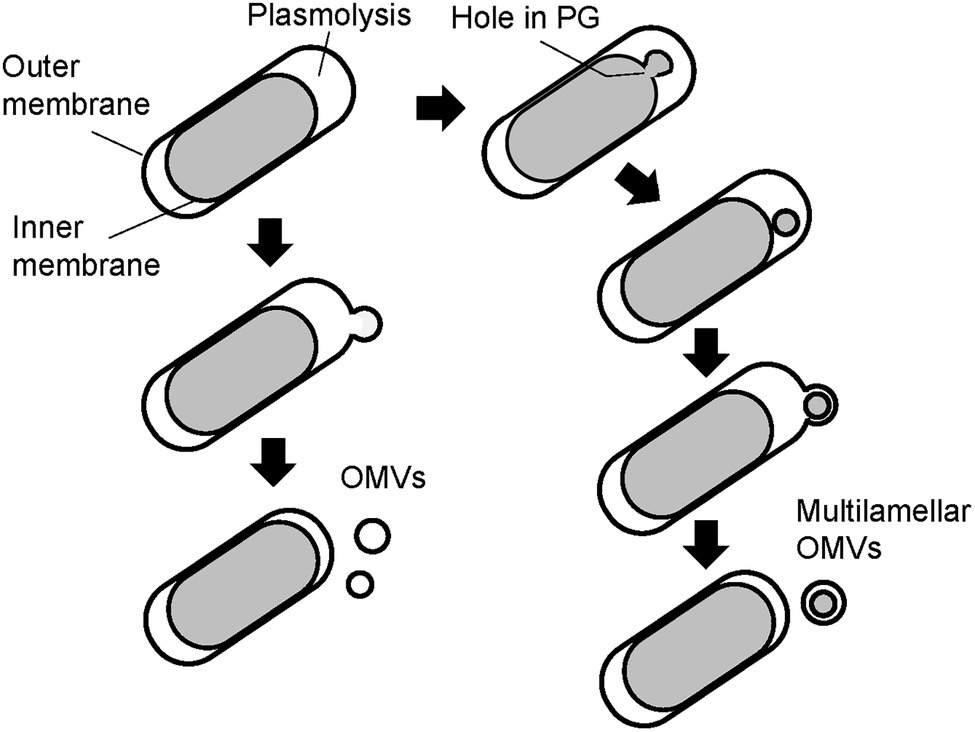
Figure 9. Possible models of the mechanism underlying vesicle formation by ΔmlaEΔnlpI cells. Left side: model for mechanism in the promoted unilamellar OMV production. Right side: model for mechanism in OIMV production.
Conclusion
The observation of ΔmlaEΔnlpI cells using QFDE-EM revealed that plasmolysis occurred at the tip of the long axis of the cells and that OMVs formed from this tip. Intracellular vesicles and multilamellar OMVs were also observed in the ΔmlaEΔnlpI cells. The secretion of recombinant GFP expressed in the cytosol of the ΔmlaEΔnlpI cells was more than 100 times higher than that of WT or ΔnlpI, and about 50 times higher than that of ΔmlaE in the OMV fraction. Additionally, QFDE-EM analysis revealed that the surface of a typical PG layer in the ΔmlaEΔnlpI cells had a very wrinkled appearance and many holes. These data suggest that in the ΔmlaEΔnlpI cells, cytoplasmic membrane materials protrude into the periplasmic space through the PG holes and are released as intracellular vesicles. Together, the results suggest a mechanism by which the OIMVs produced by ΔmlaEΔnlpI cells can include cytosolic components.
Data Availability Statement
The original contributions presented in the study are included in the article/Supplementary Material; further inquiries can be directed to the corresponding author.
Author Contributions
YO, MA, and MM proposed the research concept and provided necessary tools for experiments and experimental instructions. YO wrote the manuscript. TS designed and conducted the experiments and analyzed the data. YT and MN conducted the experiments and analyzed the data. All authors contributed to the article and approved the submitted version.
Funding
This work was supported by a Grant-in-Aid for Scientific Research (C; No. JP19K05170) from the Japan Society for the Promotion of Science, and Institute for Fermentation, Osaka, to YO. This work was also supported by the Osaka City University (OCU) Strategic Research Grant 2017 for top priority researches, and JST CREST (Grant Number JPMJCR19S5) to MM.
Conflict of Interest
The authors declare that the research was conducted in the absence of any commercial or financial relationships that could be construed as a potential conflict of interest.
Publisher’s Note
All claims expressed in this article are solely those of the authors and do not necessarily represent those of their affiliated organizations, or those of the publisher, the editors and the reviewers. Any product that may be evaluated in this article, or claim that may be made by its manufacturer, is not guaranteed or endorsed by the publisher.
Supplementary Material
The Supplementary Material for this article can be found online at: https://www.frontiersin.org/articles/10.3389/fmicb.2021.706525/full#supplementary-material
Supplementary Figure S1 | Distribution of cell volumes in each E. coli strain. The cells were harvested after 24 h in culture. Cell volume was determined using qNano.
Supplementary Figure S2 | CLSM images of OMV samples isolated from the WT (A) and ΔmlaEΔnlpI (B) strains. The fluorescence levels of OMV in the WT and mutant strains were adjusted to the same range.
References
Alves, N. J., Turner, K. B., Medintz, I. L., and Walper, S. A. (2016). Protecting enzymatic function through directed packaging into bacterial outer membrane vesicles. Sci. Rep. 6:24866. doi: 10.1038/srep24866
Baba, T., Ara, T., Hasegawa, M., Takai, Y., Okumura, Y., Baba, M., et al. (2006). Construction of Escherichia coli K-12 in-frame, single-gene knockout mutants: the Keio collection. Mol. Syst. Biol. 2:2006.0008. doi: 10.1038/msb4100050
Daly, K. E., Huang, K. C., Wingreen, N. S., and Mukhopadhyay, R. (2011). Mechanics of membrane bulging during cell-wall disruption in gram-negative bacteria. Phys. Rev. E 83:041922. doi: 10.1103/PhysRevE.83.041922
Demchick, P., and Koch, A. L. (1996). The permeability of the wall fabric of Escherichia coli and Bacillus subtilis. J. Bacteriol. 178:768. doi: 10.1128/jb.178.3.768-773.1996
Gujrati, V., Kim, S., Kim, S. H., Min, J. J., Choy, H. E., Kim, S. C., et al. (2014). Bioengineered bacterial outer membrane vesicles as cell-specific drug-delivery vehicles for cancer therapy. ACS Nano 8, 1525–1537. doi: 10.1021/nn405724x
Jeske, O., Schüler, M., Schumann, P., Schneider, A., Boedeker, C., Jogler, M., et al. (2015). Planctomycetes do possess a peptidoglycan cell wall. Nat. Commun. 6:7116. doi: 10.1038/ncomms8116
Klimentová, J., and Stulík, J. (2015). Methods of isolation and purification of outer membrane vesicles from gram-negative bacteria. Microbiol. Res. 170, 1–9. doi: 10.1016/j.micres.2014.09.006
Koch, A. L. (1998). The biophysics of the gram-negative periplasmic space. Crit. Rev. Microbiol. 24, 23–59.
Kubitschek, H. E. (1990). Cell volume increase in Escherichia coli after shifts to richer media. J. Bacteriol. 172, 94–101. doi: 10.1128/jb.172.1.94-101.1990
Kulp, A. J., Sun, B., Ai, T., Manning, A. J., Orench-Rivera, N., Schmid, A. K., et al. (2015). Genome-wide assessment of outer membrane vesicle production in Escherichia coli. PLoS One 10:e0139200. doi: 10.1371/journal.pone.0139200
Lang, I., Sassmann, S., Schmidt, B., and Komis, G. (2014). Plasmolysis: loss of turgor and beyond. Plan. Theory 3, 583–593. doi: 10.3390/plants3040583
Manning, A. J., and Kuehn, M. J. (2011). Contribution of bacterial outer membrane vesicles to innate bacterial defense. BMC Microbiol. 11:258. doi: 10.1186/1471-2180-11-258
McBroom, A. J., Johnson, A. P., Vemulapalli, S., and Kuehn, M. J. (2006). Outer membrane vesicle production by Escherichia coli is independent of membrane instability. J. Bacteriol. 188, 5385–5392. doi: 10.1128/JB.00498-06
McBroom, A. J., and Kuehn, M. J. (2007). Release of outer membrane vesicles by gram-negative bacteria is a novel envelope stress response. Mol. Microbiol. 63, 545–558. doi: 10.1111/j.1365-2958.2006.05522.x
Mille, Y., Beney, L., and Gervais, P. (2002). Viability of Escherichia coli after combined osmotic and thermal treatment: a plasma membrane implication. Biochim. Biophys. Acta 1567, 41–48. doi: 10.1016/s0005-2736(02)00565-5
Ohara, M., Wu, H. C., Sankaran, K., and Rick, P. D. (1999). Identification and characterization of a new lipoprotein, NlpI, in Escherichia coli K-12. J. Bacteriol. 181, 4318–4325. doi: 10.1128/JB.181.14.4318-4325.1999
Ojima, Y., Nunogami, S., Azuma, M., and Taya, M. (2018). Displaying a recombinant protein on flocs self-produced by Escherichia coli through fused expression with elongation factor Ts. Enzym. Microb. Technol. 108, 21–25. doi: 10.1016/j.enzmictec.2017.08.010
Ojima, Y., Sawabe, T., Konami, K., and Azuma, M. (2020). Construction of hypervesiculation Escherichia coli strains and application for secretory protein production. Biotechnol. Bioeng. 117, 701–709. doi: 10.1002/bit.27239
Pérez-Cruz, C., Carrión, O., Delgado, L., Martinez, G., López-Iglesias, C., and Mercade, E. (2013). New type of outer membrane vesicle produced by the gram-negative bacterium Shewanella vesiculosa M7T: implications for DNA content. Appl. Environ. Microbiol. 79, 1874–1881. doi: 10.1128/AEM.03657-12
Roier, S., Zingl, F. G., Cakar, F., Durakovic, S., Kohl, P., Eichmann, T. O., et al. (2016). A novel mechanism for the biogenesis of outer membrane vesicles in gram-negative bacteria. Nat. Commun. 7:10515. doi: 10.1038/ncomms10515
Schwarz, H., and Koch, A. L. (1995). Phase and electron microscopic observations of osmotically induced wrinkling and the role of endocytotic vesicles in the plasmolysis of the gram-negative cell wall. Microbiology 141, 3161–3170. doi: 10.1099/13500872-141-12-3161
Schwechheimer, C., and Kuehn, M. J. (2013). Synthetic effect between envelope stress and lack of outer membrane vesicle production in Escherichia coli. J. Bacteriol. 195, 4161–4173. doi: 10.1128/JB.02192-12
Schwechheimer, C., and Kuehn, M. J. (2015). Outer-membrane vesicles from gram-negative bacteria: biogenesis and functions. Nat. Rev. Microbiol. 13, 605–619. doi: 10.1038/nrmicro3525
Schwechheimer, C., Rodriguez, D. L., and Kuehn, M. J. (2015). NlpI-mediated modulation of outer membrane vesicle production through peptidoglycan dynamics in Escherichia coli. Microbiology 4, 375–389. doi: 10.1002/mbo3.244
Steponkus, P. L. (1999). “Freeze-induced dehydration and the cryostability of biological membranes,” in Water Management in the Design and Distribution Quality of foods. eds. Y. H. Roos, L. B. Leslie, and P. J. Liffford (Lancaster: Technomic Publishing Company Inc.), 53–85.
Takaki, K., Tahara, Y. O., Nakamichi, N., Hasegawa, Y., Shintani, M., Ohkuma, M., et al. (2020). Multilamellar and multivesicular outer membrane vesicles produced by a Buttiauxella agrestis tolB mutant. Appl. Environ. Microbiol. 86, e01131–e01120. doi: 10.1128/AEM.01131-20
Toyofuku, M., Nomura, N., and Eberl, L. (2019). Types and origins of bacterial membrane vesicles. Nat. Rev. Microbiol. 17, 13–24. doi: 10.1038/s41579-018-0112-2
Tulum, I., Tahara, Y. O., and Miyata, M. (2019). Peptidoglycan layer and disruption processes in Bacillus subtilis cells visualized using quick-freeze, deep-etch electron microscopy. Microscopy 68, 441–449. doi: 10.1093/jmicro/dfz033
Vollmer, W., Blanot, D., and De Pedro, M. A. (2008). Peptidoglycan structure and architecture. FEMS Microbiol. Rev. 32, 149–167. doi: 10.1111/j.1574-6976.2007.00094.x
Woldringh, C. L. (1994). Significance of plasmolysis spaces as markers for periseptal annuli and adhesion sites. Mol. Microbiol. 14, 597–607. doi: 10.1111/j.1365-2958.1994.tb01299.x
Keywords: Escherichia coli, outer membrane vesicle, quick-freeze deep-etch electron microscopy, plasmolysis, multilamellar outer membrane vesicle
Citation: Ojima Y, Sawabe T, Nakagawa M, Tahara YO, Miyata M and Azuma M (2021) Aberrant Membrane Structures in Hypervesiculating Escherichia coli Strain ΔmlaEΔnlpI Visualized by Electron Microscopy. Front. Microbiol. 12:706525. doi: 10.3389/fmicb.2021.706525
Edited by:
Hari S. Misra, Bhabha Atomic Research Center (BARC), IndiaReviewed by:
Meta J. Kuehn, Duke University, United StatesDavid Edward Whitworth, Aberystwyth University, United Kingdom
Copyright © 2021 Ojima, Sawabe, Nakagawa, Tahara, Miyata and Azuma. This is an open-access article distributed under the terms of the Creative Commons Attribution License (CC BY). The use, distribution or reproduction in other forums is permitted, provided the original author(s) and the copyright owner(s) are credited and that the original publication in this journal is cited, in accordance with accepted academic practice. No use, distribution or reproduction is permitted which does not comply with these terms.
*Correspondence: Yoshihiro Ojima, ojima@osaka-cu.ac.jp
†These authors have contributed equally to this work