 Yi-Yun Liu1,2,3
 Yan Zhu2
 Hasini Wickremasinghe2
 Phillip J. Bergen2
 Jing Lu2Xiao-Qing Zhu1Qiao-Li Zhou1
 Mohammad Azad2
 Sue C. Nang2
 Mei-Ling Han2
 Tao Lei4
 Jian Li2*
 Jian-Hua Liu1,3*
- 1National Risk Assessment Laboratory for Antimicrobial Resistance of Animal Original Bacteria, Guangdong Provincial Key Laboratory of Veterinary Pharmaceutics Development and Safety Evaluation, Key Laboratory of Zoonosis of Ministry of Agricultural and Rural Affairs, College of Veterinary Medicine, South China Agricultural University, Guangzhou, China
- 2Biomedicine Discovery Institute and Department of Microbiology, School of Biomedical Sciences, Monash University, Clayton, VIC, Australia
- 3Guangdong Laboratory for Lingnan Modern Agriculture, Guangzhou, China
- 4State Key Laboratory of Applied Microbiology Southern China, Guangdong Institute of Microbiology, Guangdong Academy of Sciences, Guangzhou, China
Rapid dissemination of the plasmid-born polymyxin resistance gene mcr-1 poses a critical medical challenge. MCR-1 expression is tightly controlled and imposes a fitness cost on the bacteria. We used growth studies and metabolomics to examine growth and metabolic changes within E. coli TOP10 at 8 and 24 h in response to different levels of expression of mcr-1. Induction of mcr-1 greatly increased expression at 8 h and markedly reduced bacterial growth; membrane disruption and cell lysis were evident at this time. At 24 h, the expression of mcr-1 dramatically declined with restored growth and membrane integrity, indicating regulation of mcr-1 expression in bacteria to maintain membrane homeostasis. Intermediates of peptide and lipid biosynthesis were the most commonly affected metabolites when mcr-1 was overexpressed in E. coli. Cell wall biosynthesis was dramatically affected with the accumulation of lipids including fatty acids, glycerophospholipids and lysophosphatidylethanolamines, especially at 8 h. In contrast, levels of intermediate metabolites of peptides, amino sugars, carbohydrates and nucleotide metabolism and secondary metabolites significantly decreased. Moreover, the over-expression of mcr-1 resulted in a prolonged reduction in intermediates associated with pentose phosphate pathway and pantothenate and CoA biosynthesis. These findings indicate that over-expression of mcr-1 results in global metabolic perturbations that mainly involve disruption to the bacterial membrane, pentose phosphate pathway as well as pantothenate and CoA biosynthesis.
Introduction
The emergence and spread of multidrug-resistant (MDR) and extensively drug-resistant (XDR) Gram-negative bacteria represents an increasing threat to global public health (McEwen and Collignon, 2018; Lerminiaux and Cameron, 2019). Due to a shortage of effective antimicrobial drugs to combat these “superbugs,” particularly carbapenemase-producing Enterobacteriaceae, use of the once sidelined polymyxin antibiotics (polymyxin B and colistin) has dramatically increased over the last two decades (Falagas and Kasiakou, 2005; Karaiskos and Giamarellou, 2014). The bactericidal activity of the polymyxins begins with their binding to the lipid A component of lipopolysaccharides (LPS) in the Gram-negative bacterial outer membrane (OM) via both electrostatic and hydrophobic interactions, which is followed by membrane disorganization and cell lysis (Velkov et al., 2013; Olaitan et al., 2014). Intrinsic resistance involves sensing the presence of polymyxins in the environment via two-component regulatory systems (TCSs, e.g., PmrAB and PhoPQ). These TCSs upregulate the expression of pmrC and/or arnBCADTEF-ugd leading to the modification of the phosphate groups of lipid A via the addition of cationic 4-amino-4-deoxy-L-arabinose (L-Ara4N) and/or phosphoethanolamine (pEtN) moieties, thereby attenuating the disorganization of the OM (Falagas and Kasiakou, 2005; Olaitan et al., 2014). Alarmingly, reports of polymyxin resistance are increasing worldwide (Velkov et al., 2013; Karaiskos and Giamarellou, 2014; Olaitan et al., 2014; Bonomo et al., 2018). The mechanisms of polymyxin resistance in these organisms include mutations in pmrAB and phoPQ and the negative regulator mgrB (in Klebsiella pneumoniae) that lead to constitutive expression of lipid A modification genes, and mutations in lipid A biosynthesis genes (e.g., lpxACD) that cause the loss of LPS and therefore prevent polymyxin binding (Cannatelli et al., 2013; Olaitan et al., 2014).
All the aforementioned resistance mechanisms are chromosomally mediated; however, this paradigm has changed significantly since we reported the first case of plasmid-mediated polymyxin resistance in 2015 (Liu et al., 2016). The mobilized colistin resistance gene, mcr-1, has been detected globally in various Gram-negative bacteria collected from food, live-stock, companion animals, rivers, vegetables and humans (Liu and Liu, 2018). Other mcr family genes (mcr-2 to mcr-10) that confer polymyxin resistance have also been reported worldwide (Carroll et al., 2019; Nang et al., 2019; Wang et al., 2020). MCR-1 is an inner-membrane-anchored protein consisting of a periplasmic C-terminal domain and an N-terminal transmembrane domain (Liu et al., 2016). Belonging to the phosphoethanolamine (pEtN) transferase family, MCR-1 catalyzes the transfer of pEtN from phosphatidylethanolamine (PE) to the phosphate groups of lipid A (Liu et al., 2017). Compared to chromosomally mediated high-level polymyxin resistance that typically results in polymyxin minimum inhibitory concentrations (MICs) in the range of 8–256 mg/L, increases in polymyxin MICs mediated by mcr-1 are more modest (generally 2–8 mg/L) indicating a potential fitness cost owing to mcr-1 expression (Bontron et al., 2016; Denervaud Tendon et al., 2017); though organism dependent, the MIC breakpoint for polymyxin susceptibility is typically ≤2 mg/L. Indeed, significant damages to the cell envelope, slow growth rates and cell lysis have been observed following induced expression of mcr-1 in E. coli (Yang et al., 2017; Tietgen et al., 2018); however, the underlying mechanisms of such defects caused by mcr-1 expression remain unclear.
Metabolomics is able to identify critical bacterial metabolic changes in response to antibiotic treatments at the network level (Jozefczuk et al., 2010; Zampieri et al., 2017). Using metabolomics, Li H. et al. (2019) found that mcr-1 primarily affected metabolic pathways involved in glycerophospholipid metabolism and biosynthesis of LPS and phosphatidylethanolamine (PE). It is likely that clinical isolates of E. coli containing mcr-1 have already undergone long-term adaptation via antibiotic selection and that cellular metabolism has been fine-tuned to cope with moderate mcr-1 expression. In the present study, we employed metabolomics to investigate the dynamic metabolic changes occurring in response to different levels of mcr-1 expression in E. coli and elucidate the mechanisms of metabolomic adaptation. This is the first comprehensive study of metabolic changes in response to mcr-1 expression in E. coli. Our findings will assist in the prevention of mcr-1 dissemination and facilitate the optimization of polymyxin therapy.
Materials and Methods
Strains and Plasmids
E. coli TOP10 was used as the recipient strain of different plasmids (Supplementary Table S1). The expression vector pBAD-hisA (Thermo Fisher Scientific, United States) was used to construct recombinant plasmids. pBAD-hisA contains a promoter for the araBAD (arabinose) operon that controls the expression of genes, which can be regulated with L-Arabinose (Guzman et al., 1995). mcr-1 was cloned from pHNSHP45 (GenBank: KP347127.1) using primer pair (mcr-1-NS) to pBAD-hisA, yielding pBAD-mcr-1 (Supplementary Tables S1, S2). The recombinant plasmid was confirmed by Sanger sequencing and used to transform E. coli TOP10 by electroporation (Liu et al., 2017). E. coli TOP10 were transformed with empty vector pBAD as controls. Cells were plated on lysogeny broth (LB) agar plates containing ampicillin at 100 mg/L. The introduction of pBAD, pBAD-mcr-1 was confirmed by PCR using primers mcr-1-NS and pBAD-NS (Supplementary Table S2), respectively. Minimum inhibitory concentrations (MICs) of colistin (sulfate; Beta Pharma, Shanghai, China) were determined by broth microdilution in cation-adjusted Mueller-Hinton broth (CAMHB; Oxoid, VIC, Australia) containing 25 mg/L Ca2+ and 12.5 mg/L Mg2+ supplemented with different concentrations of L-arabinose (0, 0.02, 0.2, and 2%, w/v). E. coli ATCC 25922 was used as the reference strain for MIC measurement (Clinical and Laboratory Standards Institute, 2017).
Quantitative Real-Time PCR (qRT-PCR)
Overnight cultures of strain E. coli TOP10 carrying pBAD-mcr-1 were diluted (1:100) in 5 mL of fresh CAMHB (containing 25 mg/L Ca2+ and 12.5 mg/L Mg2+) containing different concentrations of L-arabinose (0, 0.02, 0.2, and 2%, w/v) and incubated with shaking (180 rpm) at 37°C for 24 h. Bacterial samples (n = 3) were collected at 0, 4, 8, and 24 h for viable cell counting and at 4 and 8 h for RNA extraction. Trizol (Invitrogen, United States) was employed to extract RNA. RNase-free DNase (QIAGEN, Germany) was added to remove DNA residue and a secondary phenol:chloroform purification by 5PRIME Phase Lock Gel tubes (Quanta Biosciences, United States) was then performed (Gulliver et al., 2018). Complementary DNA was synthesized using the prepared RNA and an AffinityScript qPCR cDNA synthesis kit (Agilent Technologies, United States). qPCR was conducted using QuantiNova SYBR Green RT-PCR Kit (QIAGEN, Germany) and an Agilent AriaMx real-time PCR system (Agilent Stratagene, United States); rpoB was used as a reference gene. The primer sequences are shown in Supplementary Table S2. Relative expression results were normalized by the ΔΔCT analysis method using mean CT value. Data acquisition and analysis were performed using a non-parametric Mann-Whitney U test or one-way ANOVA according to Dunn’s multiple comparison test.
Cellular Morphology Analysis
Overnight cultures of E. coli TOP10 carrying pBAD and pBAD-mcr-1 were diluted (1:100) in 5 mL fresh CAMHB (25 mg/L Ca2+ and 12.5 mg/L Mg2+) without or with L-arabinose (0.2%) and incubated with shaking (180 rpm) at 37°C for 24 h. Bacterial samples were collected at 8 and 24 h for observation of cell membrane integrity by transmission electron microscope (TEM). In brief, samples were collected and washed twice with cold 0.9% sterile saline then centrifuged for 10 min at 3,220 g and 4°C. The supernatant was then discarded leaving the cell pellet which was subsequently re-suspended with 2.5% glutaraldehyde fixative, fixed at 4°C for 2 h, washed for 4 × 30 min in phosphate buffer saline (PBS) and then fixed in osmic acid followed by dehydration using graded ethanol (30, 45, 60, 75, 85, and 95% for 15 min each, 100% for 2 × 20 min). The precipitates were twice washed with acetone for 20 min, once with acetone:resin (3:1) for 12 h, once with acetone:resin (1:1) for 4 h and once with resin for 1 h before embedding in Epon812 resin. The samples were sectioned into slices of approximately 50 nm width with an ultramicrotome before staining with lead citrate and imaged using TEM at 80 kV.
Metabolite Extraction
Cellular metabolites were extracted as described previously with minor modifications (Han et al., 2018). In brief, 100 mL bacterial cultures (n = 5) with and without 0.2% L-arabinose induction were harvested at 8 and 24 h and immediately transferred to an ethanol:dry ice bath for 30-s quenching. The samples were then normalized to OD600 0.50 ± 0.02 (600 nm optical density). Cells were pelleted from 20 mL of the normalized sample by centrifugation (3,220 × g, 4°C, 10 min), washed twice with cold 0.9% sterile saline, and resuspended in 0.5 mL chloroform:methanol:water (1:3:1, v/v) containing 1 μM generic internal standards (CHAPS, CAPS, PIPES, and TRIS). Three freeze-thaw cycles were conducted in liquid nitrogen to lyse the cells and completely release cellular metabolites. The solvents were then centrifuged for 10 min at 3,220 g and 4°C after which 0.3 mL of the supernatant was subject to a secondary centrifugation at 14,000 g for 15 min at 4°C to obtain 0.2 mL particle-free supernatants for LC-MS analysis.
LC-MS Analysis
The particle-free supernatant samples were analyzed on a Q-Exactive Orbitrap mass spectrometer (MS, Thermo Fisher Scientific), in tandem with a DionexU3000 high-performance liquid chromatograph (HPLC, Thermo Fisher Scientific) with a ZIC-pHILIC column (5 μm, polymeric, 150 × 4.6 mm; SeQuant, Merck). The MS system was operated in both positive and negative electrospray ionization (ESI) ion mode with a resolution at 35,000 and a detection range of 85 to 1,275 m/z. Samples were eluted by a multi-step gradient system at a flow rate of 0.3 mL/min beginning with 20% mobile phase A (20 mM ammonium carbonate) and 80% mobile phase B (acetonitrile) to 50% mobile phase A and 50% mobile phase B over 15 min, followed 5% mobile phase B for 3 min. Re-equilibration with 20% mobile phase A and 80% mobile phase B for 8 min was then performed. All sample with internal standards were separately analyzed in a single LC-MS batch to minimize operational variations. The pooled biological quality control (PBQC) samples (aliquot of 10 μL of each sample) were analyzed throughout the batch to assess chromatographic peaks, signal reproducibility and analyte stability. Mixtures of authentic standards containing about 350 metabolites were analyzed within the same batch for the identification of metabolites.
Data Processing and Statistics Analysis
Raw data were processed by mzMatch and IDEOM1 to determine the intensity of metabolites (Creek et al., 2012). The intensities were normalized by the median, log transformed, auto scaled, then analyzed by principal-component analysis (PCA) and one-way analysis of variance (ANOVA, Tukey’s honestly significant difference [HSD] post-hoc test) using MetaboAnalyst 4.0 (Chong et al., 2018). Differentially abundant metabolites (false discovery rate [FDR] adjusted P < 0.05, fold change [FC] ≥ 2) were used for pathway analysis using Kyoto Encyclopedia of Genes and Genomes (KEGG) (Kanehisa and Goto, 2000) and BioCyc (Caspi et al., 2018) databases.
Results
Over-Expression of mcr-1 Reduced Bacterial Growth
Colistin MICs in the absence or presence of L-arabinose are shown in Supplementary Table S1. The MICs of the vector control strain E. coli pBAD were 0.5 mg/L in the absence of L-arabinose and in the presence of all three L-arabinose concentrations tested (0.02, 0.2, and 2%). While the MIC of E. coli TOP10 + pBAD-mcr-1 similarly remained 0.5 mg/L with 0 and 0.02% L-arabinose, the MIC increased 4-fold to 2 mg/L in the presence of 0.2% L-arabinose but dropped to 1 mg/L in the presence of 2% L-arabinose.
Bacterial growth and the level of expression of mcr-1 in the absence and presence of L-arabinose are shown in Figure 1. Growth of E. coli pBAD (containing the empty vector) was completely unaffected by L-arabinose (Figure 1A). In E. coli TOP10 + pBAD-mcr-1 strains, growth in the absence of L-arabinose approximated that of E. coli pBAD (Figures 1A,B). However, unlike the vector control strain, the growth of E. coli TOP10 + pBAD-mcr-1 was markedly decreased at 4 and 8 h by 0.02% and, especially, 0.2 and 2% L-arabinose (Figure 1B). By 24 h the growth of E. coli TOP10 + pBAD-mcr-1 had recovered to that observed in the absence of L-arabinose. qPCR results clearly demonstrated mcr-1 was significantly over-expressed at 8 h following L-arabinose induction at all concentrations (0.02–2%, Figure 1B); however, over-expression was retained at 24 h only in the presence of 0.02% L-arabinose (Figure 1D). Together, these results suggest that mcr-1 over-expression may cause a significant fitness cost during bacterial exponential growth, and that the bacterial cells may undergo metabolic changes to overcome such a burden and achieve a similar level of viability after 24 h to that of cells which did not express mcr-1.
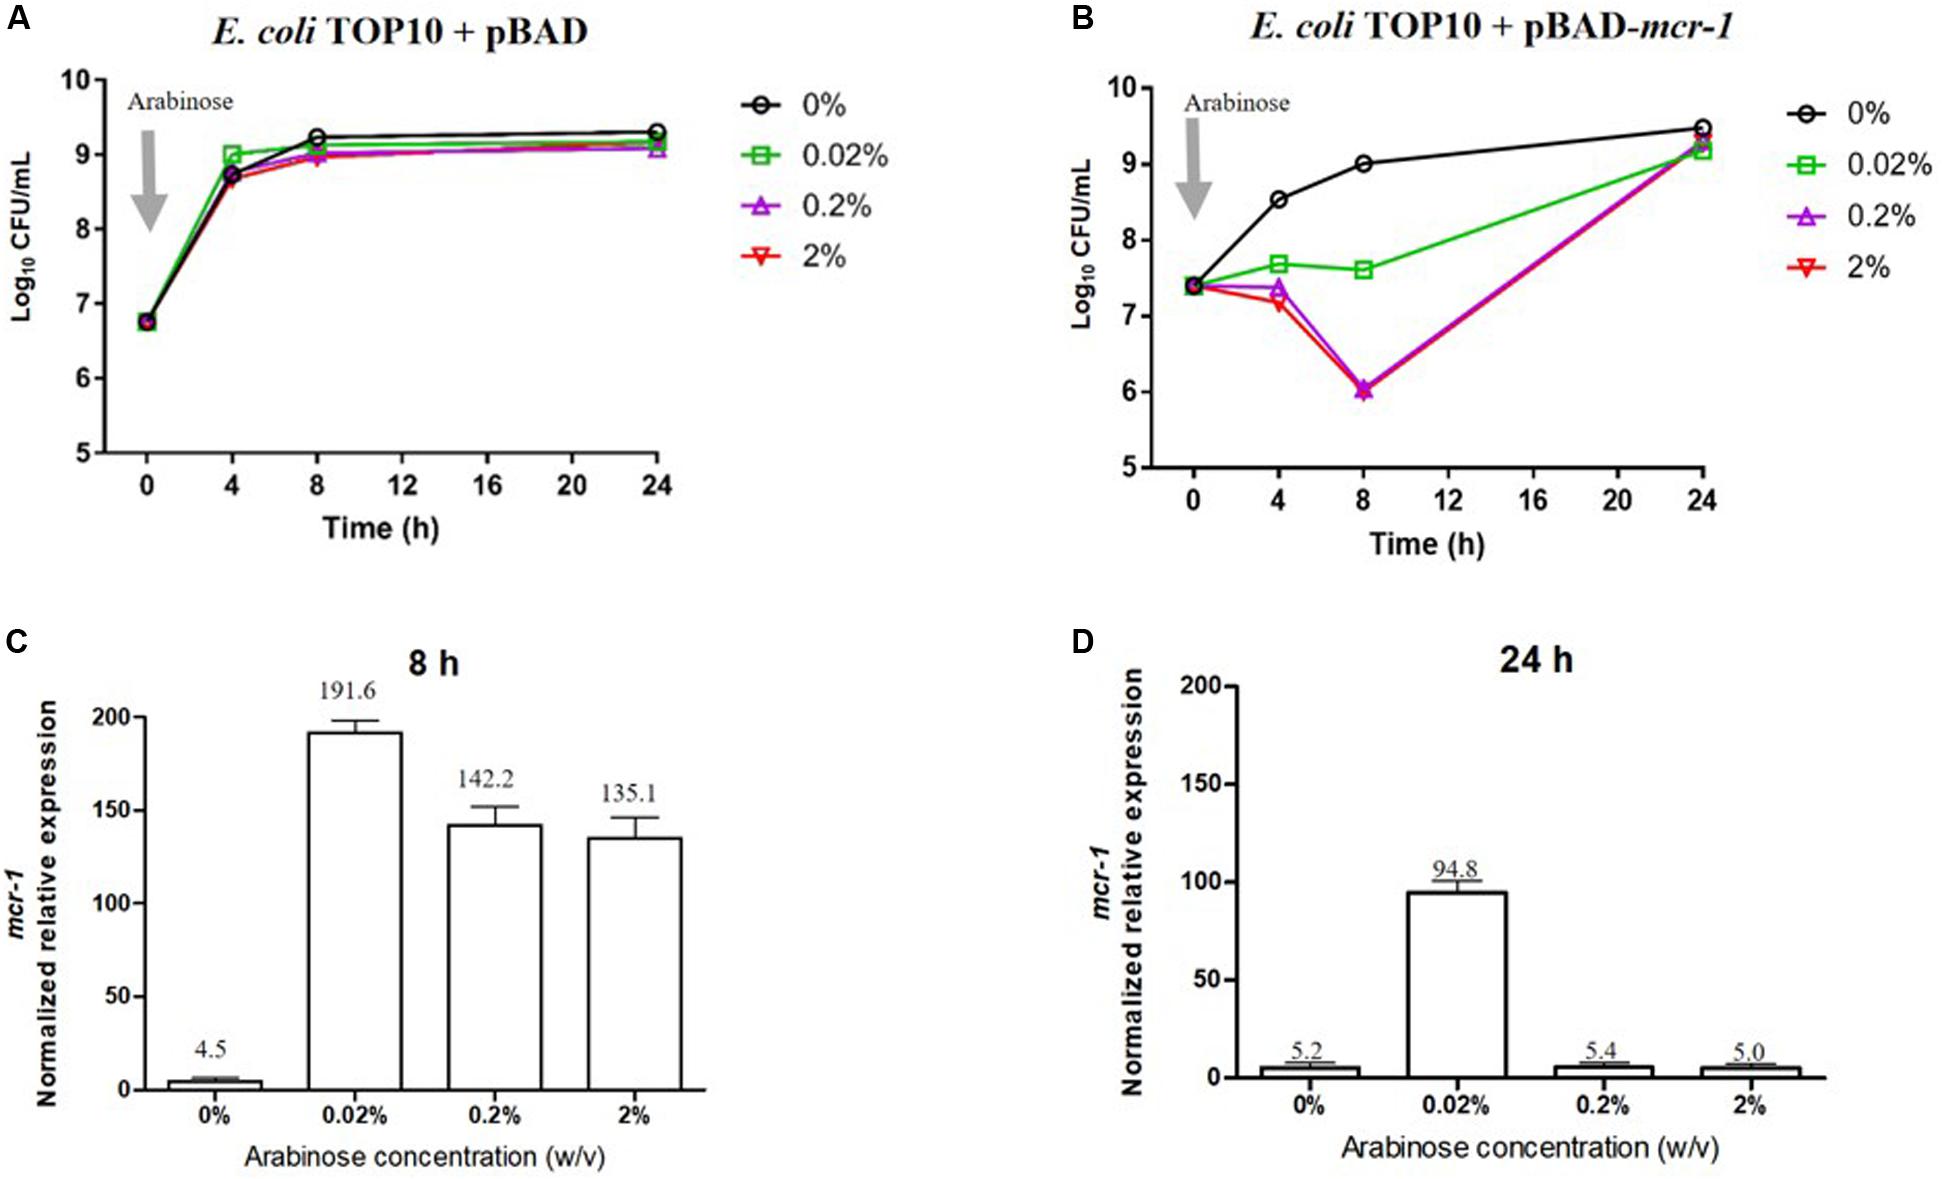
Figure 1. Impact of mcr-1 expression on bacterial growth. Bacterial growth curves of E. coli TOP10 carrying (A) the empty vector pBAD and (B) pBAD-mcr-1 under different levels of Arabinose induction. The expression levels of mcr-1 were measured by qRT-PCR. The normalized relative expression (mean ± SD, n = 3) of mcr-1 in E. coli TOP10 + pBAD-mcr-1 under different levels of Arabinose induction at (C) 8 h and (D) 24 h.
Over-Expression of mcr-1 Affected Cell Morphology
TEM micrographs of E. coli TOP10 + pBAD and E. coli TOP10 + pBAD-mcr-1 in both the induced (0.2% [w/v] L-arabinose) and uninduced (0% L-arabinose) state are shown in Figure 2 (after 8 h induction) and S1 (after 24 h induction). For E. coli TOP10 + pBAD (vector control), at both 8 and 24 h the cell membrane remained intact and the cytoplasm remained compact and homogenous irrespective of the induction by L-arabinose. Similarly, no changes in cellular architecture were observed with uninduced E. coli TOP10 + pBAD-mcr-1 at either time. However, changes in cell morphology of E. coli TOP10 + pBAD-mcr-1 were observed at 8 h following the induction of mcr-1 by L-arabinose (Figures 2D,H). With these cells, the structural integrity of the membrane was altered as evidenced by the change in a lack of demarcation between the outer and inner membranes (Figure 2H). Cytoplasmic changes including granular degeneration (Figure 2H) and vacuolation (Figure 2D) were also observed, and most cells were lysed. At 24 h, cells that survived this initial perturbation showed normal cellular architecture indistinguishable from uninduced cells (Supplementary Figure S1).
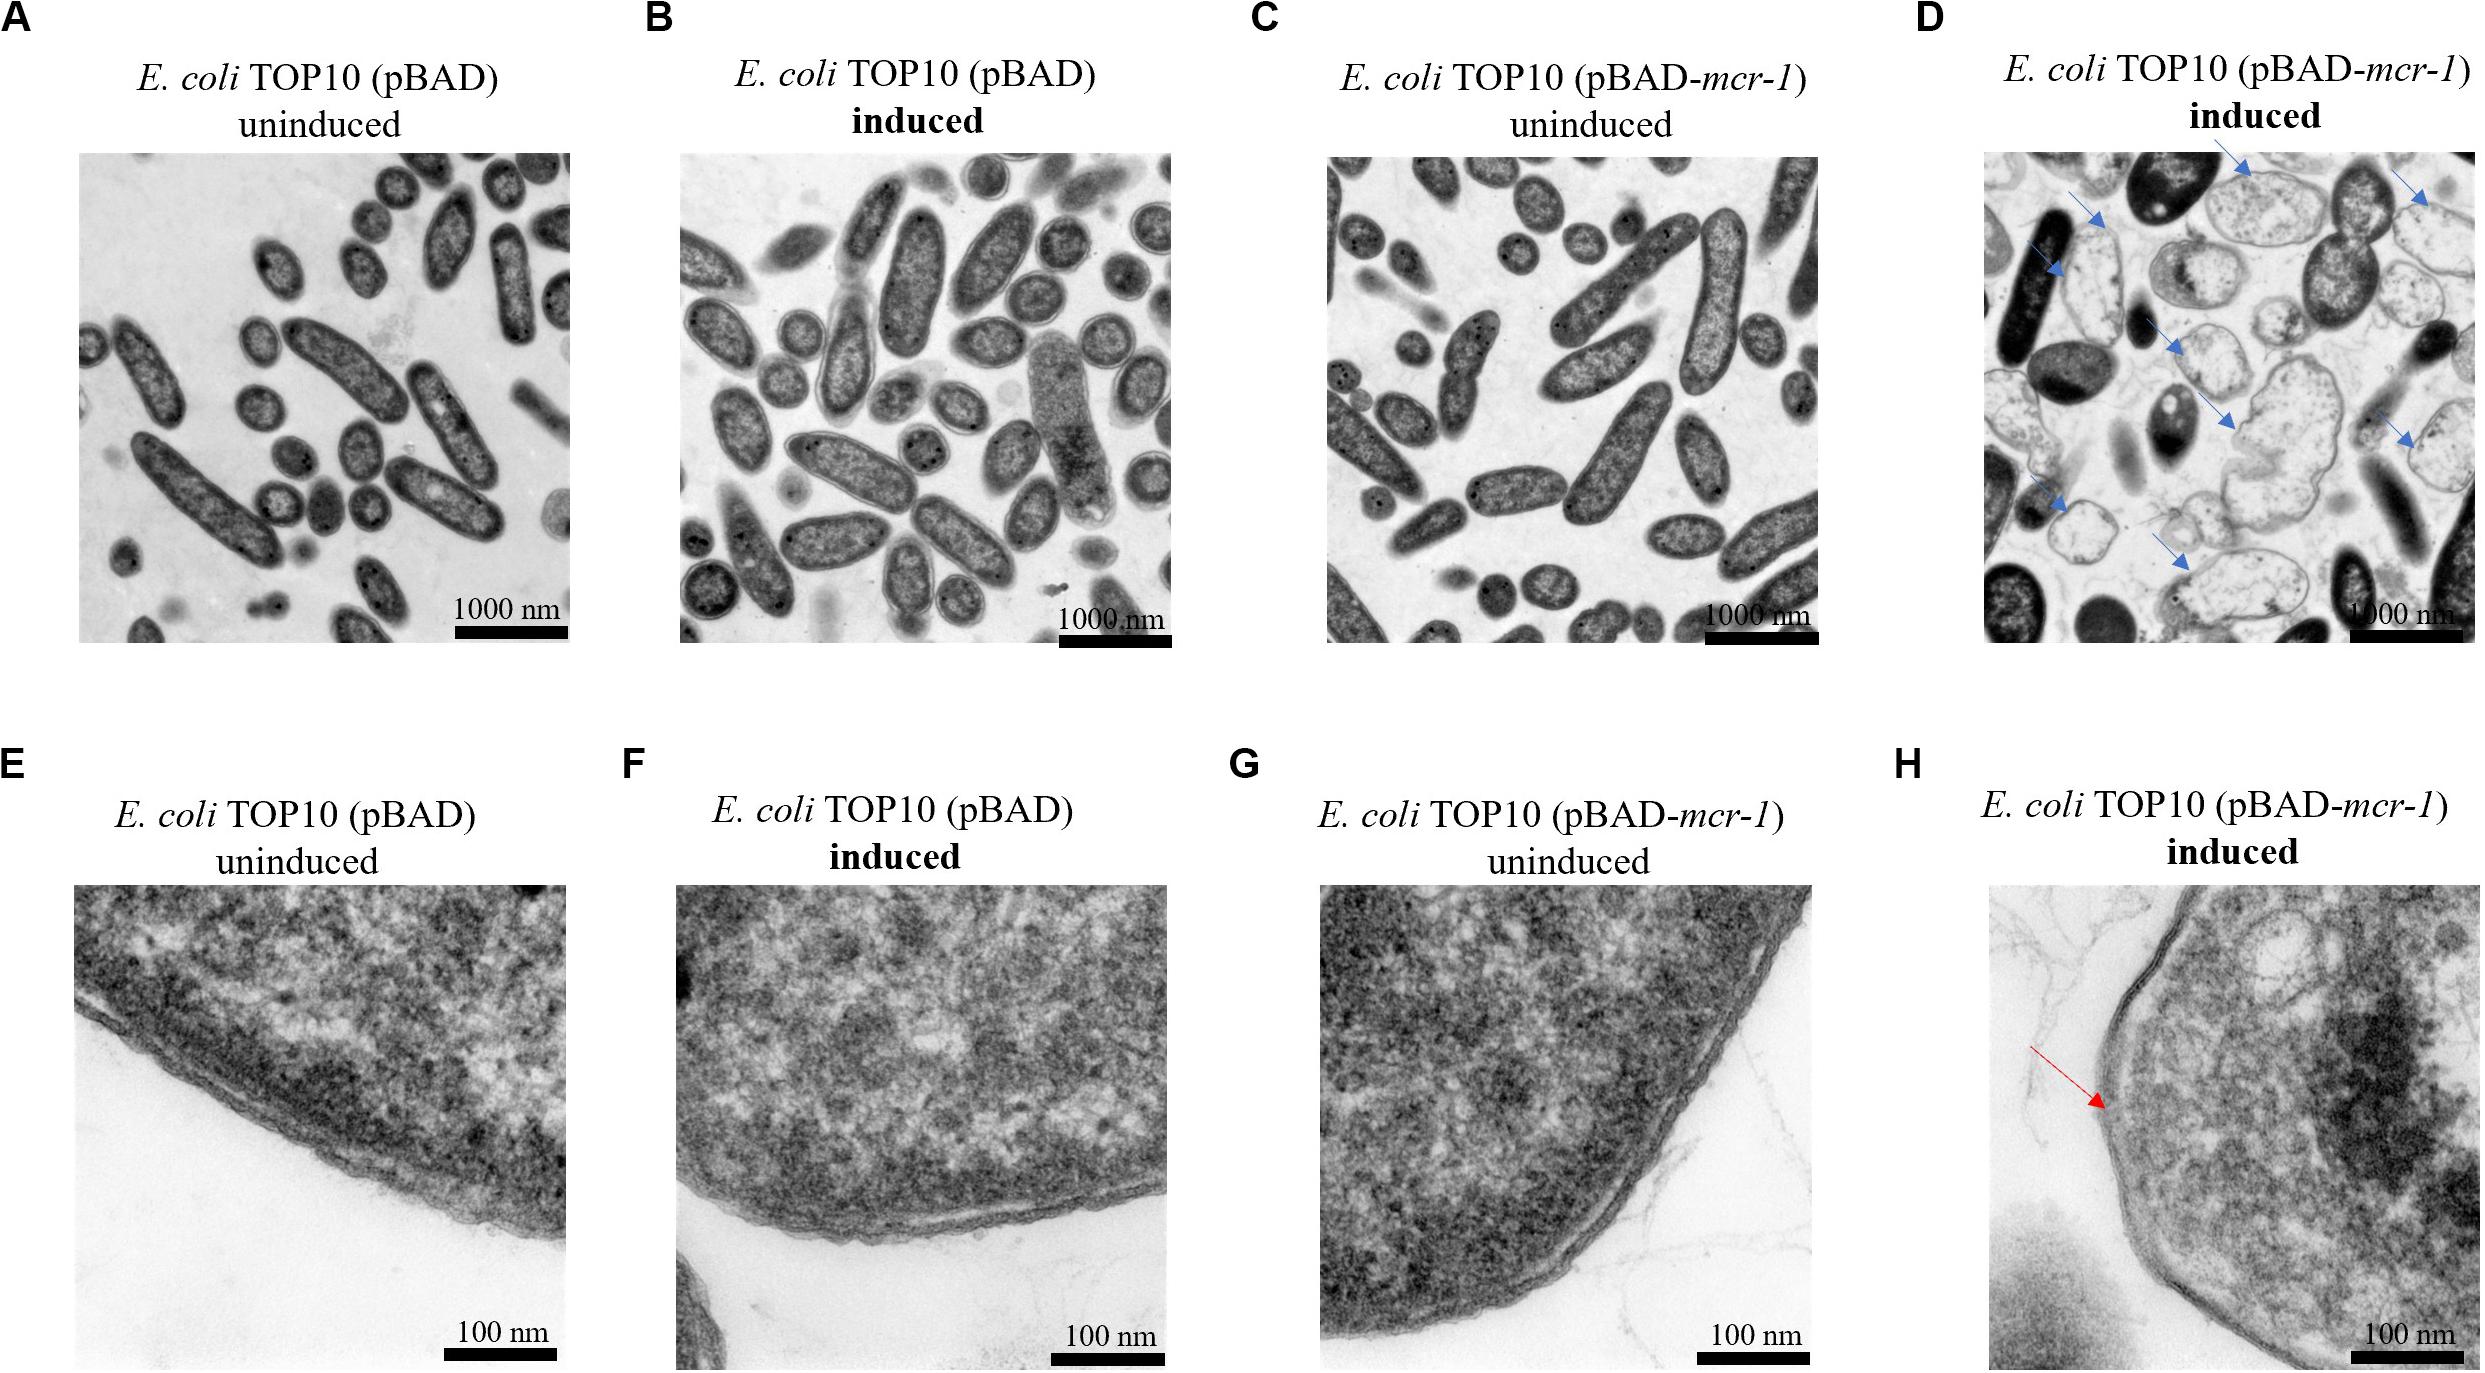
Figure 2. TEM micrographs of E. coli at 8 h with or without induction by 0.2% L-arabinose. (A,B) show E. coli TOP10 + pBAD (the vector control) and (C,D) E. coli TOP10 + pBAD mcr-1. (E–H) show partially magnified images of figures (A–D), respectively. All cells in (A–C) have an intact membrane and the electron density of cytoplasmic region is homogeneous. Over-expression of mcr-1 in (D) was associated with membrane damage (red arrow) and cell lysis (blue arrows).
Global Metabolic Variations in Response to mcr-1 Over-Expression in E. coli
LC-MS based metabolomics was conducted to identify metabolic changes in E. coli TOP10 + pBAD and TOP10 + pBAD-mcr-1 in the absence and presence of 0.2% L-arabinose induction at 8 h and 24 h. A total of 1,101 unique metabolites were putatively identified (Supplementary Dataset S1). The median relative standard deviation (RSD) was 16.5% for PBQC samples, and 20.0–37.0% for sample groups, indicating a well-control technical variation (Supplementary Table S3) (Kirwan et al., 2014). PCA plots revealed that significant metabolic changes occurred in the over-expression strains (TOP10 + pBAD-mcr-1) following induction at 8 and 24 h (Figures 3A,B). Further, the significantly changed metabolites (FDR < 0.05, p < 0.05, and fold change ≥ 2, ANOVA) were sorted out for further analysis. In detail, in the absence of L-arabinose, only 3 and 1 changed metabolites were induced by pBAD-mcr-1 in E. coli TOP10 at 8 and 24 h (Figures 3C,D), relative to pBAD. In the presence of L-arabinose, compared to pBAD, overexpression of mcr-1 resulted in 634/256 differentially abundant metabolite in E. coli (TOP10 + pBAD-mcr-1) at 8/24 h (Figures 3C,D), indicating that over-expression of mcr-1 caused dramatic perturbations of metabolites in E. coli. To eliminate these observations being singularly due to L-arabinose induction, comparative analysis of E. coli TOP10 + pBAD to remove changes caused by L-arabinose induction.
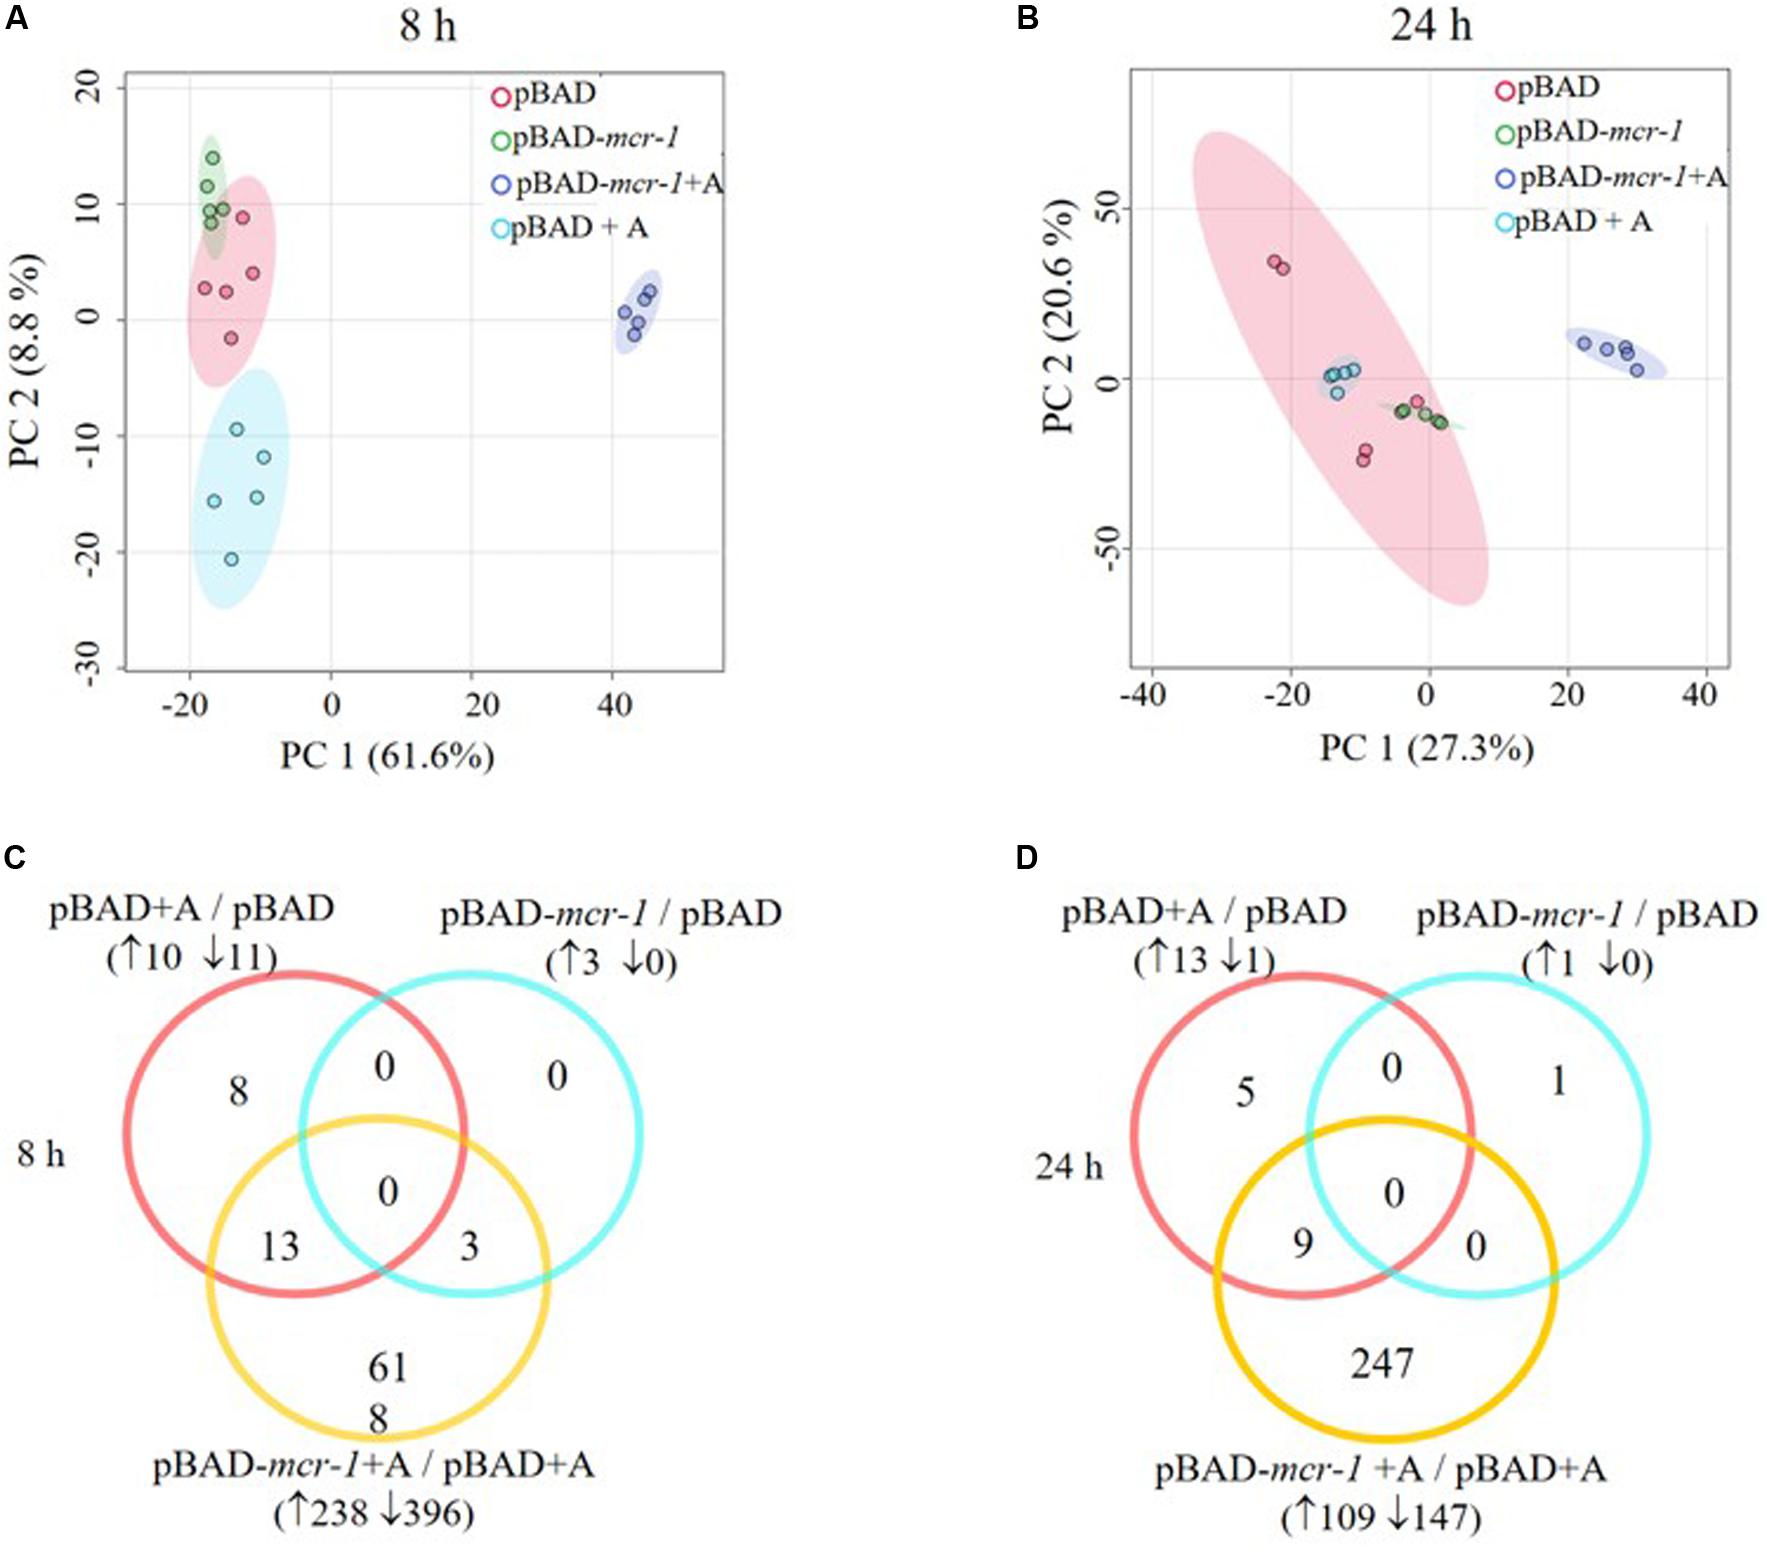
Figure 3. Multivariate and univariate analyses of global metabolic changes. PCA score plots of the first two principle components for metabolite levels from samples (E. coli TOP10 carrying different recombinant plasmids) with or without 0.2% Arabinose induction at (A) 8 h and (B) 24 h. Each dataset represents a total of 30 samples of 5 biological replicates of each condition. Empty vector pBAD without induction = Red (pBAD), with induction = Blue (pBAD + A); pBAD-mcr-1 without induction = Purple (pBADm_0), with induction = Yellow (pBADm_A). Venn diagrams display the number of metabolites significantly affected by pBAD-mcr-1, over-expression of pBAD, or over-expression of pBAD-mcr-1 at (C) 8 h and (D) 24 h, relative to the control group. Significant metabolites were selected with FDR < 0.05, p < 0.05 and fold change ≥ 2 (one-way ANOVA).
Over-Expression of mcr-1 Mainly Caused Changes of Bacterial Lipid and Peptide Metabolism
Overall, intermediates of lipids and peptides were the most affected metabolites in the over-expression of mcr-1 strain (E. coli TOP10 + pBAD-mcr-1) at 8 and 24 h following L-arabinose induction compared to E. coli TOP10 + pBAD (Figure 4). In particular, at 8 h, the accumulation of the medium-chain fatty acids (FA tetradecenoic acid, tridecenoic acid, nonanoic acid, hexadecanoic acid, and dodecanoic acid) was observed (Figure 5). In contrast, the shorter-chain fatty acids [FA (8:0), FA hydroxy (8:0), FA hydroxyl (10:0 and 12:0), and FA (13:1) tridecenoic acid] were depleted at 8 h. Additionally, the level of many glycerophospholipids (GPLs) were significantly increased, including glycerophosphates [PA (26:1, 27:1, 32:1, 37:4, and 39:5)], phosphatidylcholine [PC (9:0, 12:1, 12:0/17:1, 15:0, 18:0/11:1, 26:0)], phosphatidylethanolamine [PE (28:1, 30:1, 32:1, 32:2, and 34:1 and 34:2)], phosphatidylglycerol [PG (32:2)], phosphatidylserine [PS (35:0)], lysophosphatidylcholine [LysoPC (10:1, 12:0, 18:0, and 18:1)], lysophosphatidylethanolamines [LysoPE (14:1, 16:0, 16:1, 18:1, and 18:2)], sn-glycero-3-phosphoethanolamine and sn-glycerol 3-phosphate (Figure 5). By comparison, other metabolite intermediates for GPL metabolism [e.g., Butanoyl-CoA, PC (30:1), PE (35:1), and PG (17:1, 33:1, 35:0, 35:2, and 37:2] and prenols metabolism were dramatically decreased. At 24 h, over-expression of mcr-1 mainly involved enrichment of FAs and GPLs, predominantly GLPs [long-chain PC, PE, and PG] and medium-chain fatty acids. Obviously, the over-expression of proteins MCR-1 induced a greater metabolic response in the level of lipid metabolism at 8 h compared to 24 h (Figure 4).
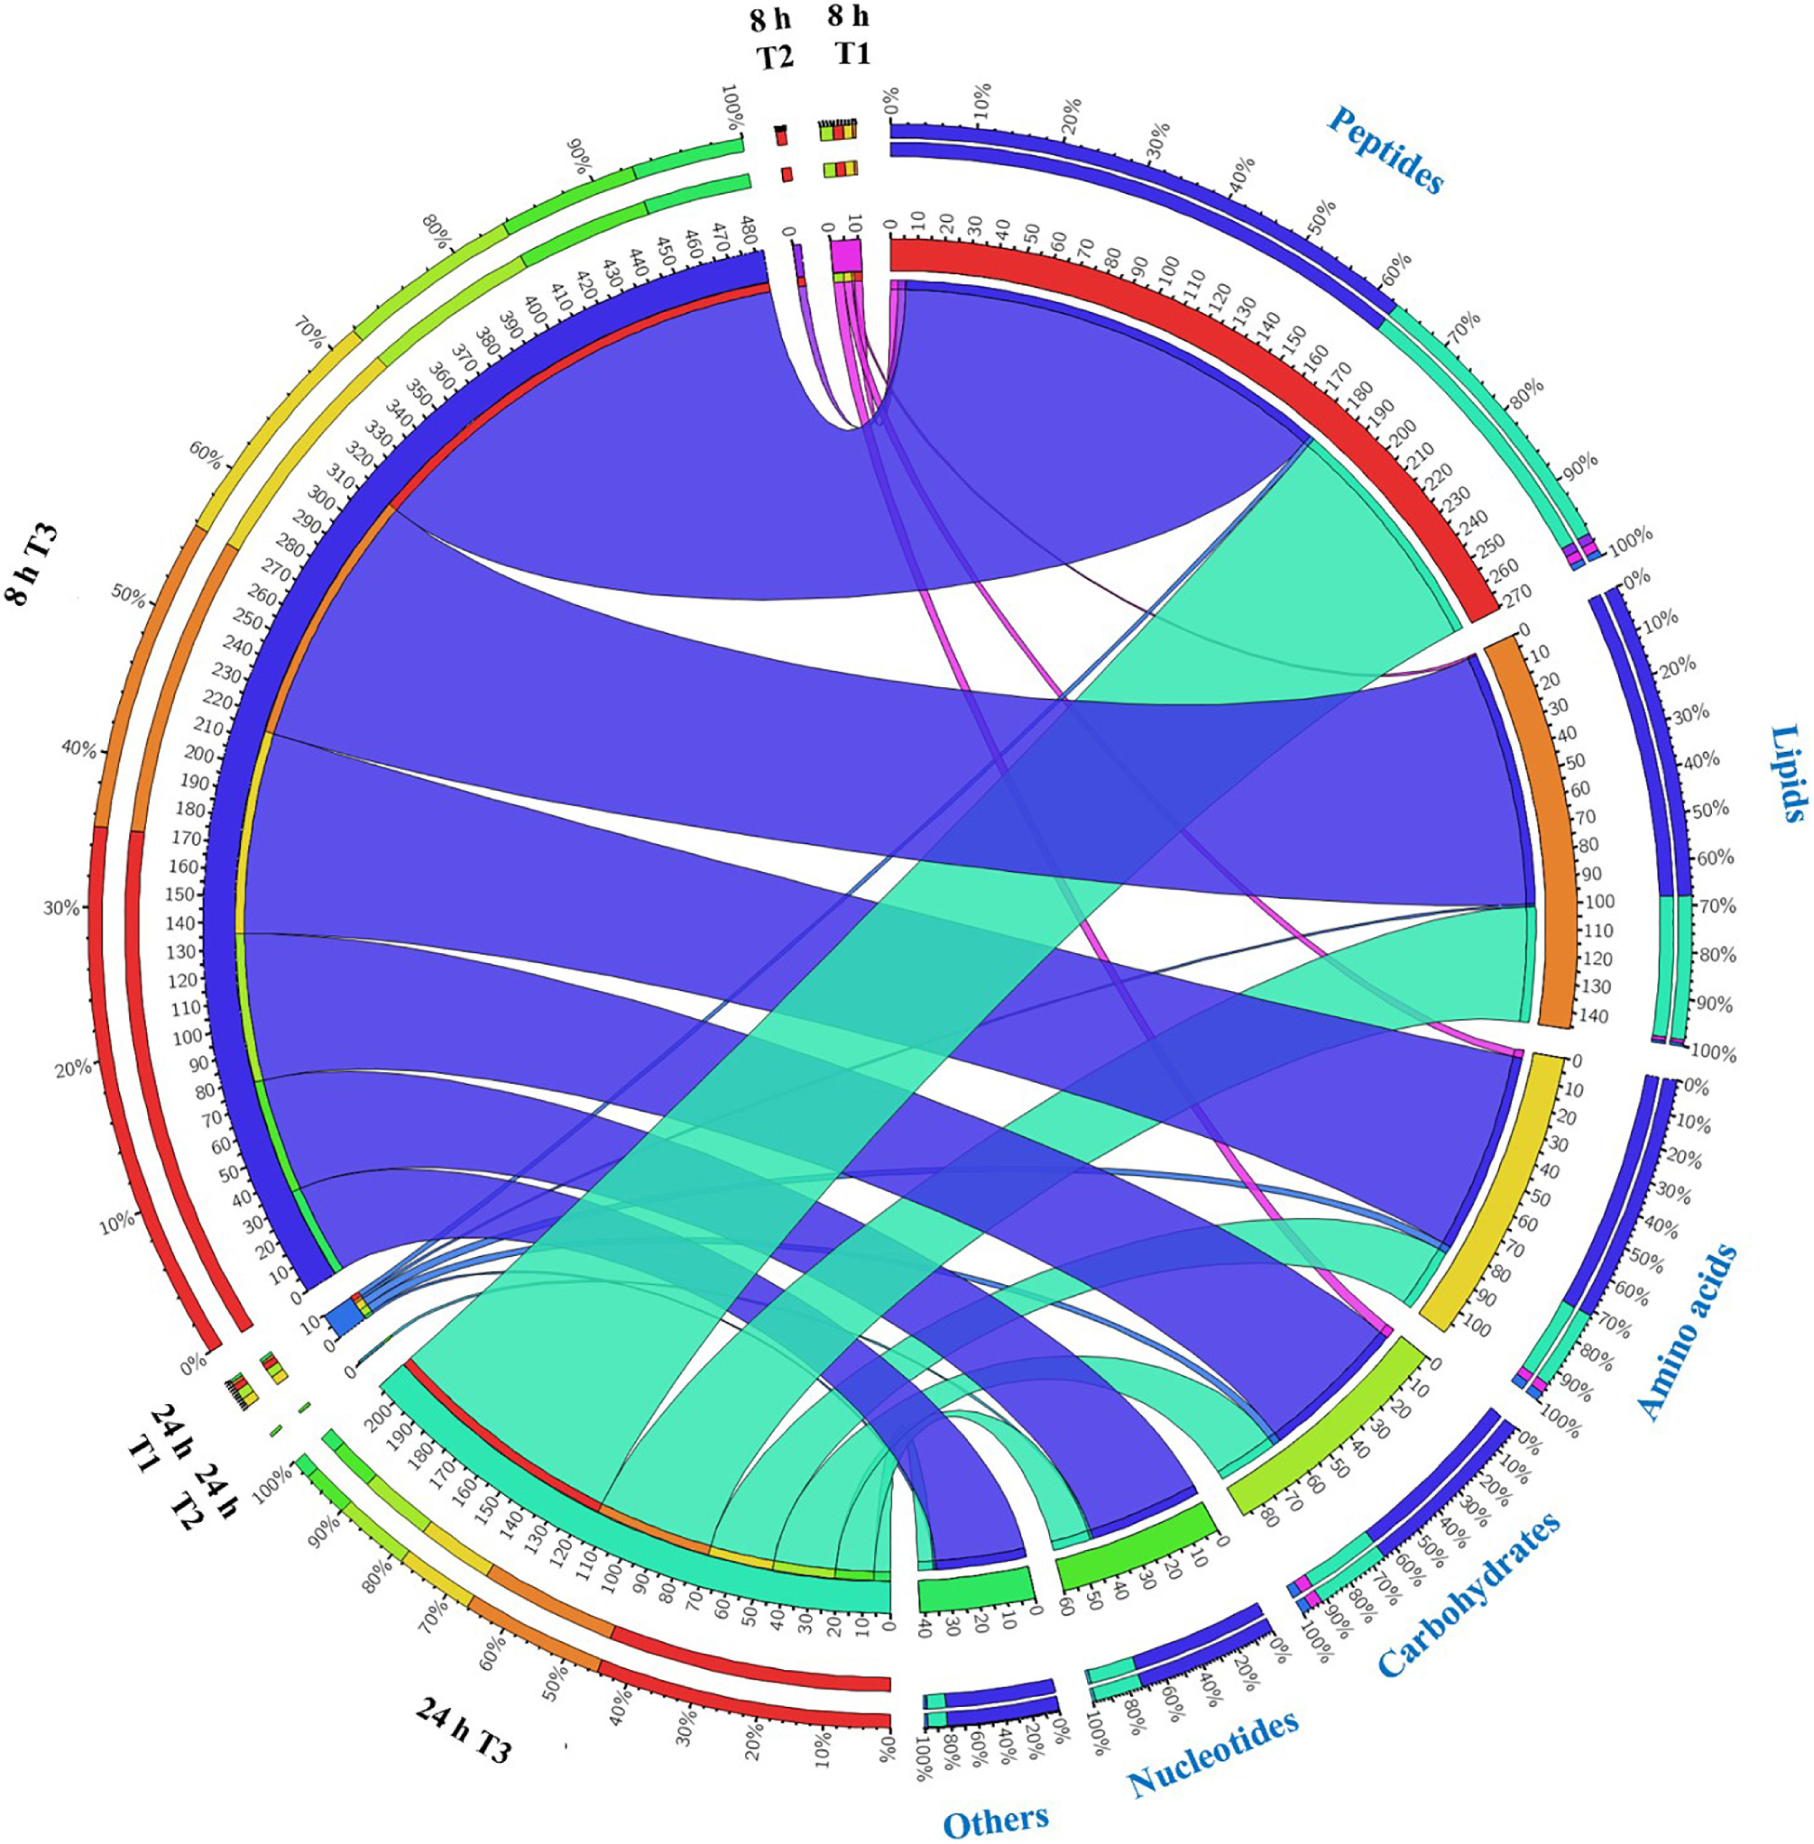
Figure 4. Metabolome response of E. coil at 8 h and 24 h. Bipartite graph exhibits correlations between the number of significant metabolites (left side) and significantly affected metabolites (FDR < 0.05, p < 0.05 and fold change ≥ 2) (right side, the quantity and proportion). The number of metabolites significantly affected by over-expression of pBAD (T1 = pBAD + Arabinose vs. pBAD), pBAD-mcr-1 (T2 = pBAD-mcr-1 vs. pBAD), or over-expression of pBAD-mcr-1 (T3 = pBAD-mcr-1 + Arabinose vs. pBAD + Arabinose).
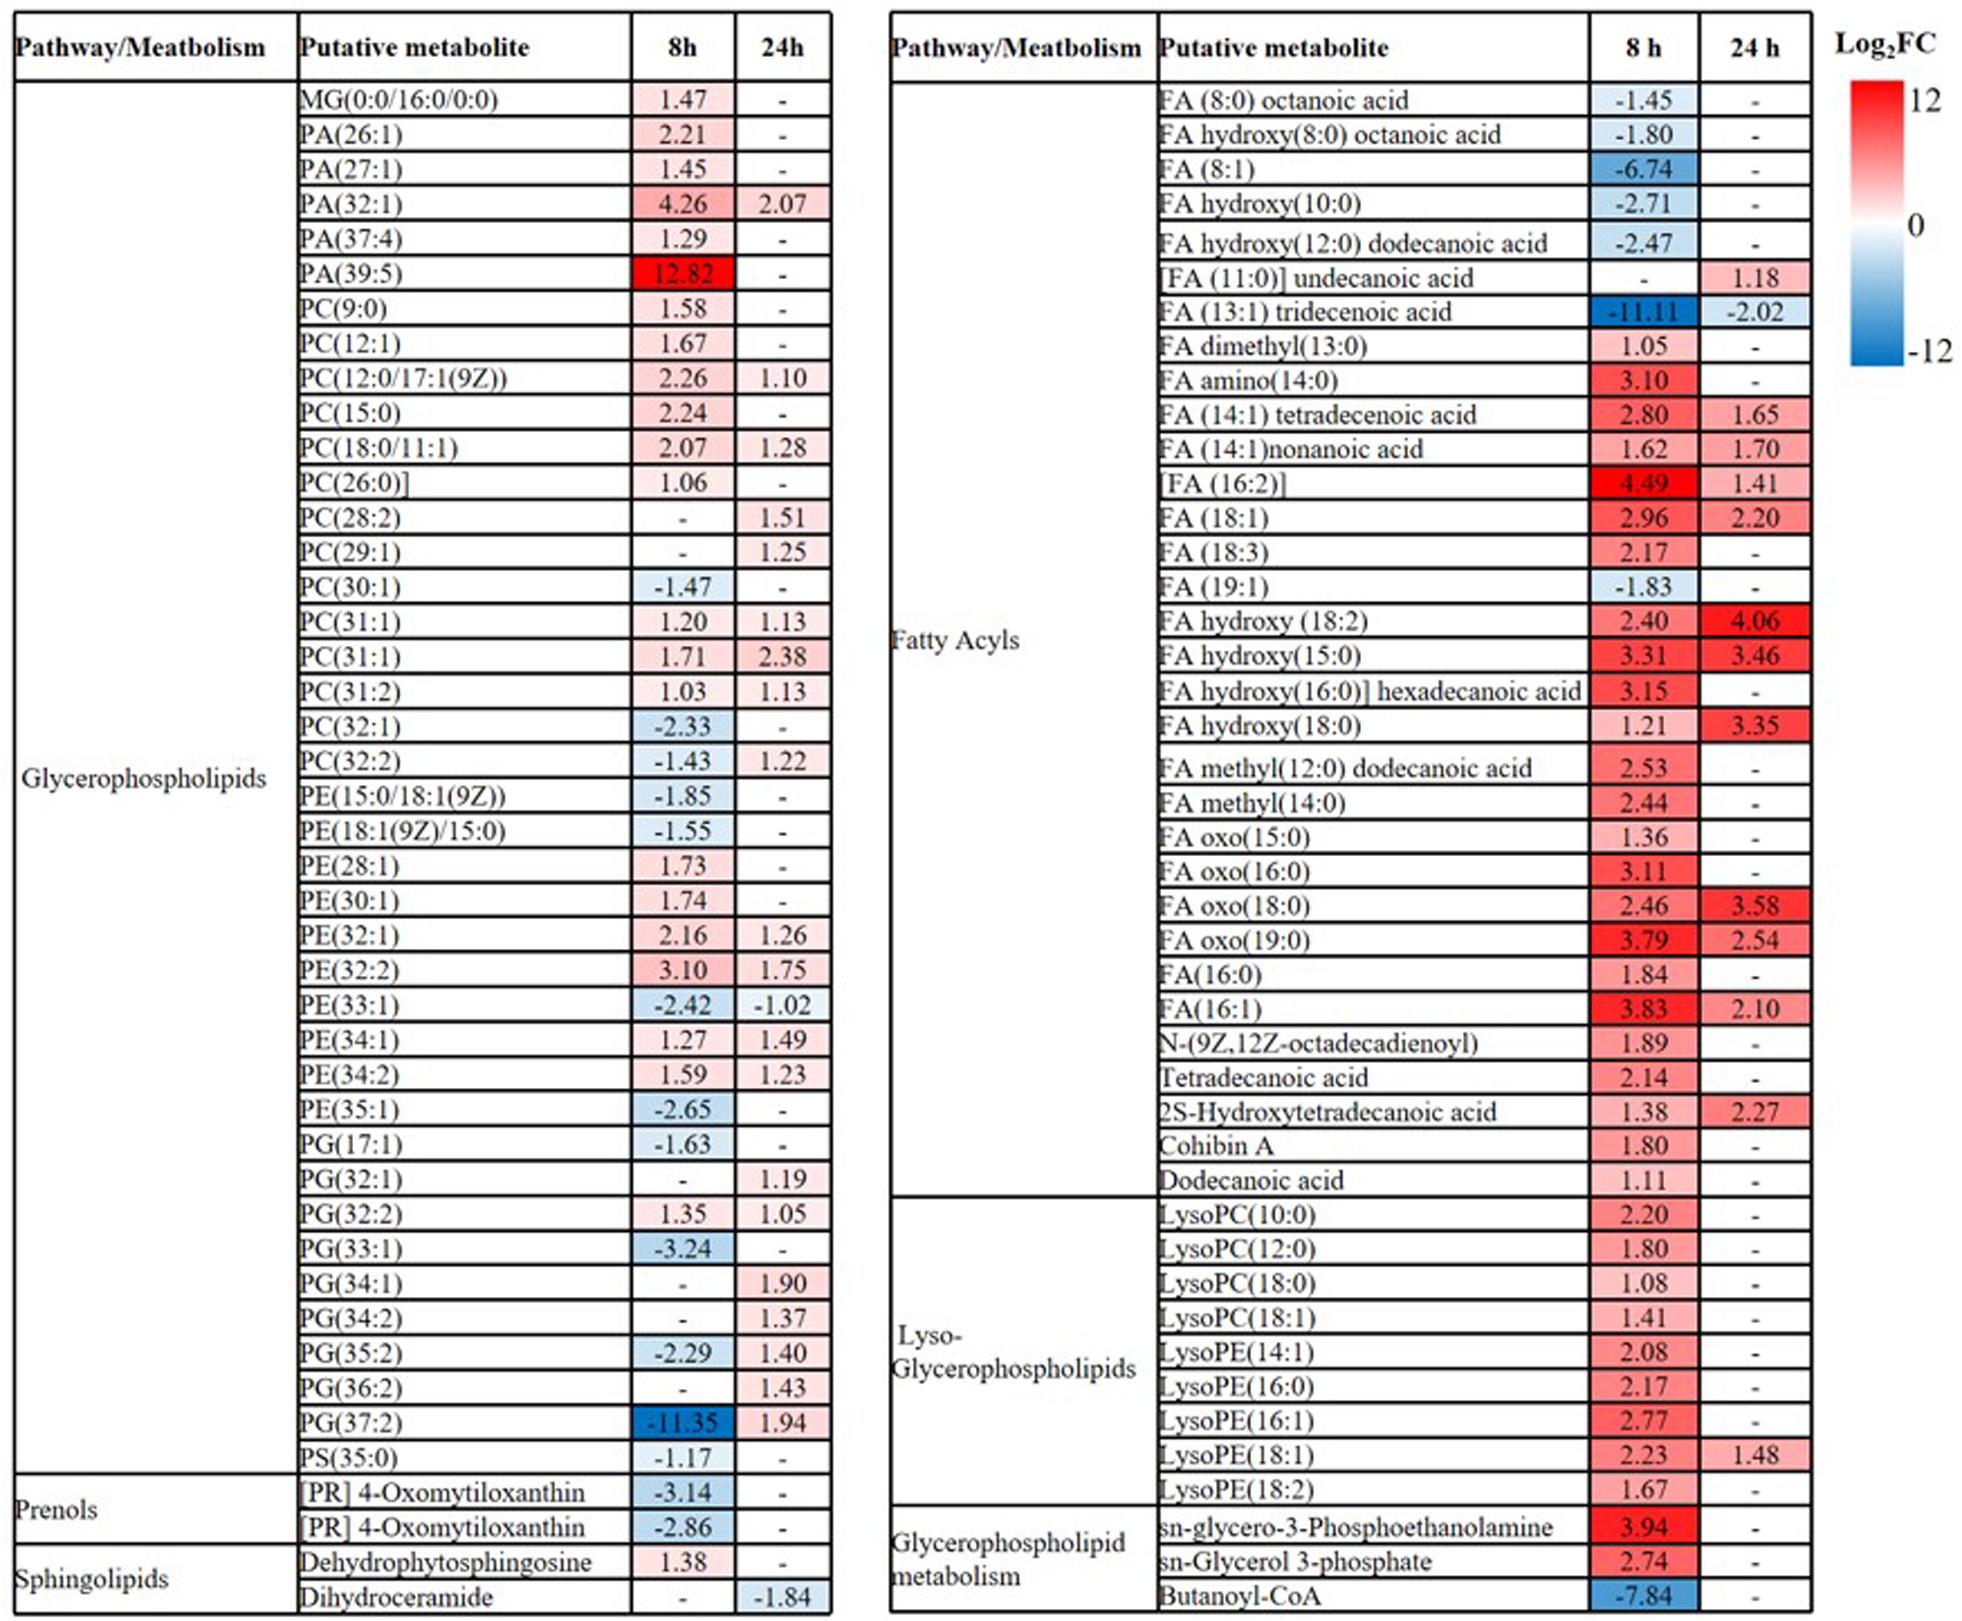
Figure 5. Perturbations of lipids and related metabolites. Lipid names are putatively assigned based on accurate mass. The values and whether metabolite level decreased (blue) or increased (red) are shown. The heatmap is shown to the right of the table with the log2 fold change (FC) values. FDR < 0.05, p < 0.05 and fold change ≥ 2.
Substantial metabolic variations in the amounts of short-chain peptides were consistently detected (Figure 4). The over-expression of proteins MCR-1 caused greater metabolic changes in peptide levels at 8 h compared to at 24 h. Besides, a number of other metabolic pathways were also affected by MCR-1 over-expression at 8 h yet had returned close to control values by 24 h (Supplementary Dataset S1). For example, at 8 h, a decrease in the levels of xanthosine (FC = 159) indicated a reduction in nucleotide metabolism, whereas reductions in secondary metabolites such as O-beta-D-Glucopyranosyl-cis-zeatin (FC = 219) indicated developmental or morphological changes. By 24 h, the levels of these metabolites had increased and approximated to those of the vector control (Supplementary Dataset S1).
Over-Expression of mcr-1 Induced Metabolic Disruptions in Pentose Phosphate Pathway and Pantothenate and CoA Biosynthesis
Carbohydrate metabolism was significantly decreased by over-expression of mcr-1, with major changes observed for the metabolites of the pentose phosphate pathway (PPP) at 8 h (Figures 4, 6A). A number of key metabolites (e.g., D-gluconate, D-glucose, D-erythrose-4P, 2-deoxy-D-ribose-5P, and deoxyribose) were significantly decreased, whereas the increased relative abundance of three metabolites (e.g., pyruvate, D-ribulose-5P, and D-ribose) were detected (Figures 7A,B). Moreover, the levels of succinate, thiamin diphosphate and phosphoenolpyruvate related to citrate cycle (TCA cycle) were also significantly decreased in response to over-expression of mcr-1 at 8 h (Figure 7B). By 24 h, the levels of these metabolites had gotten back to those of the control (Supplementary Dataset S1).
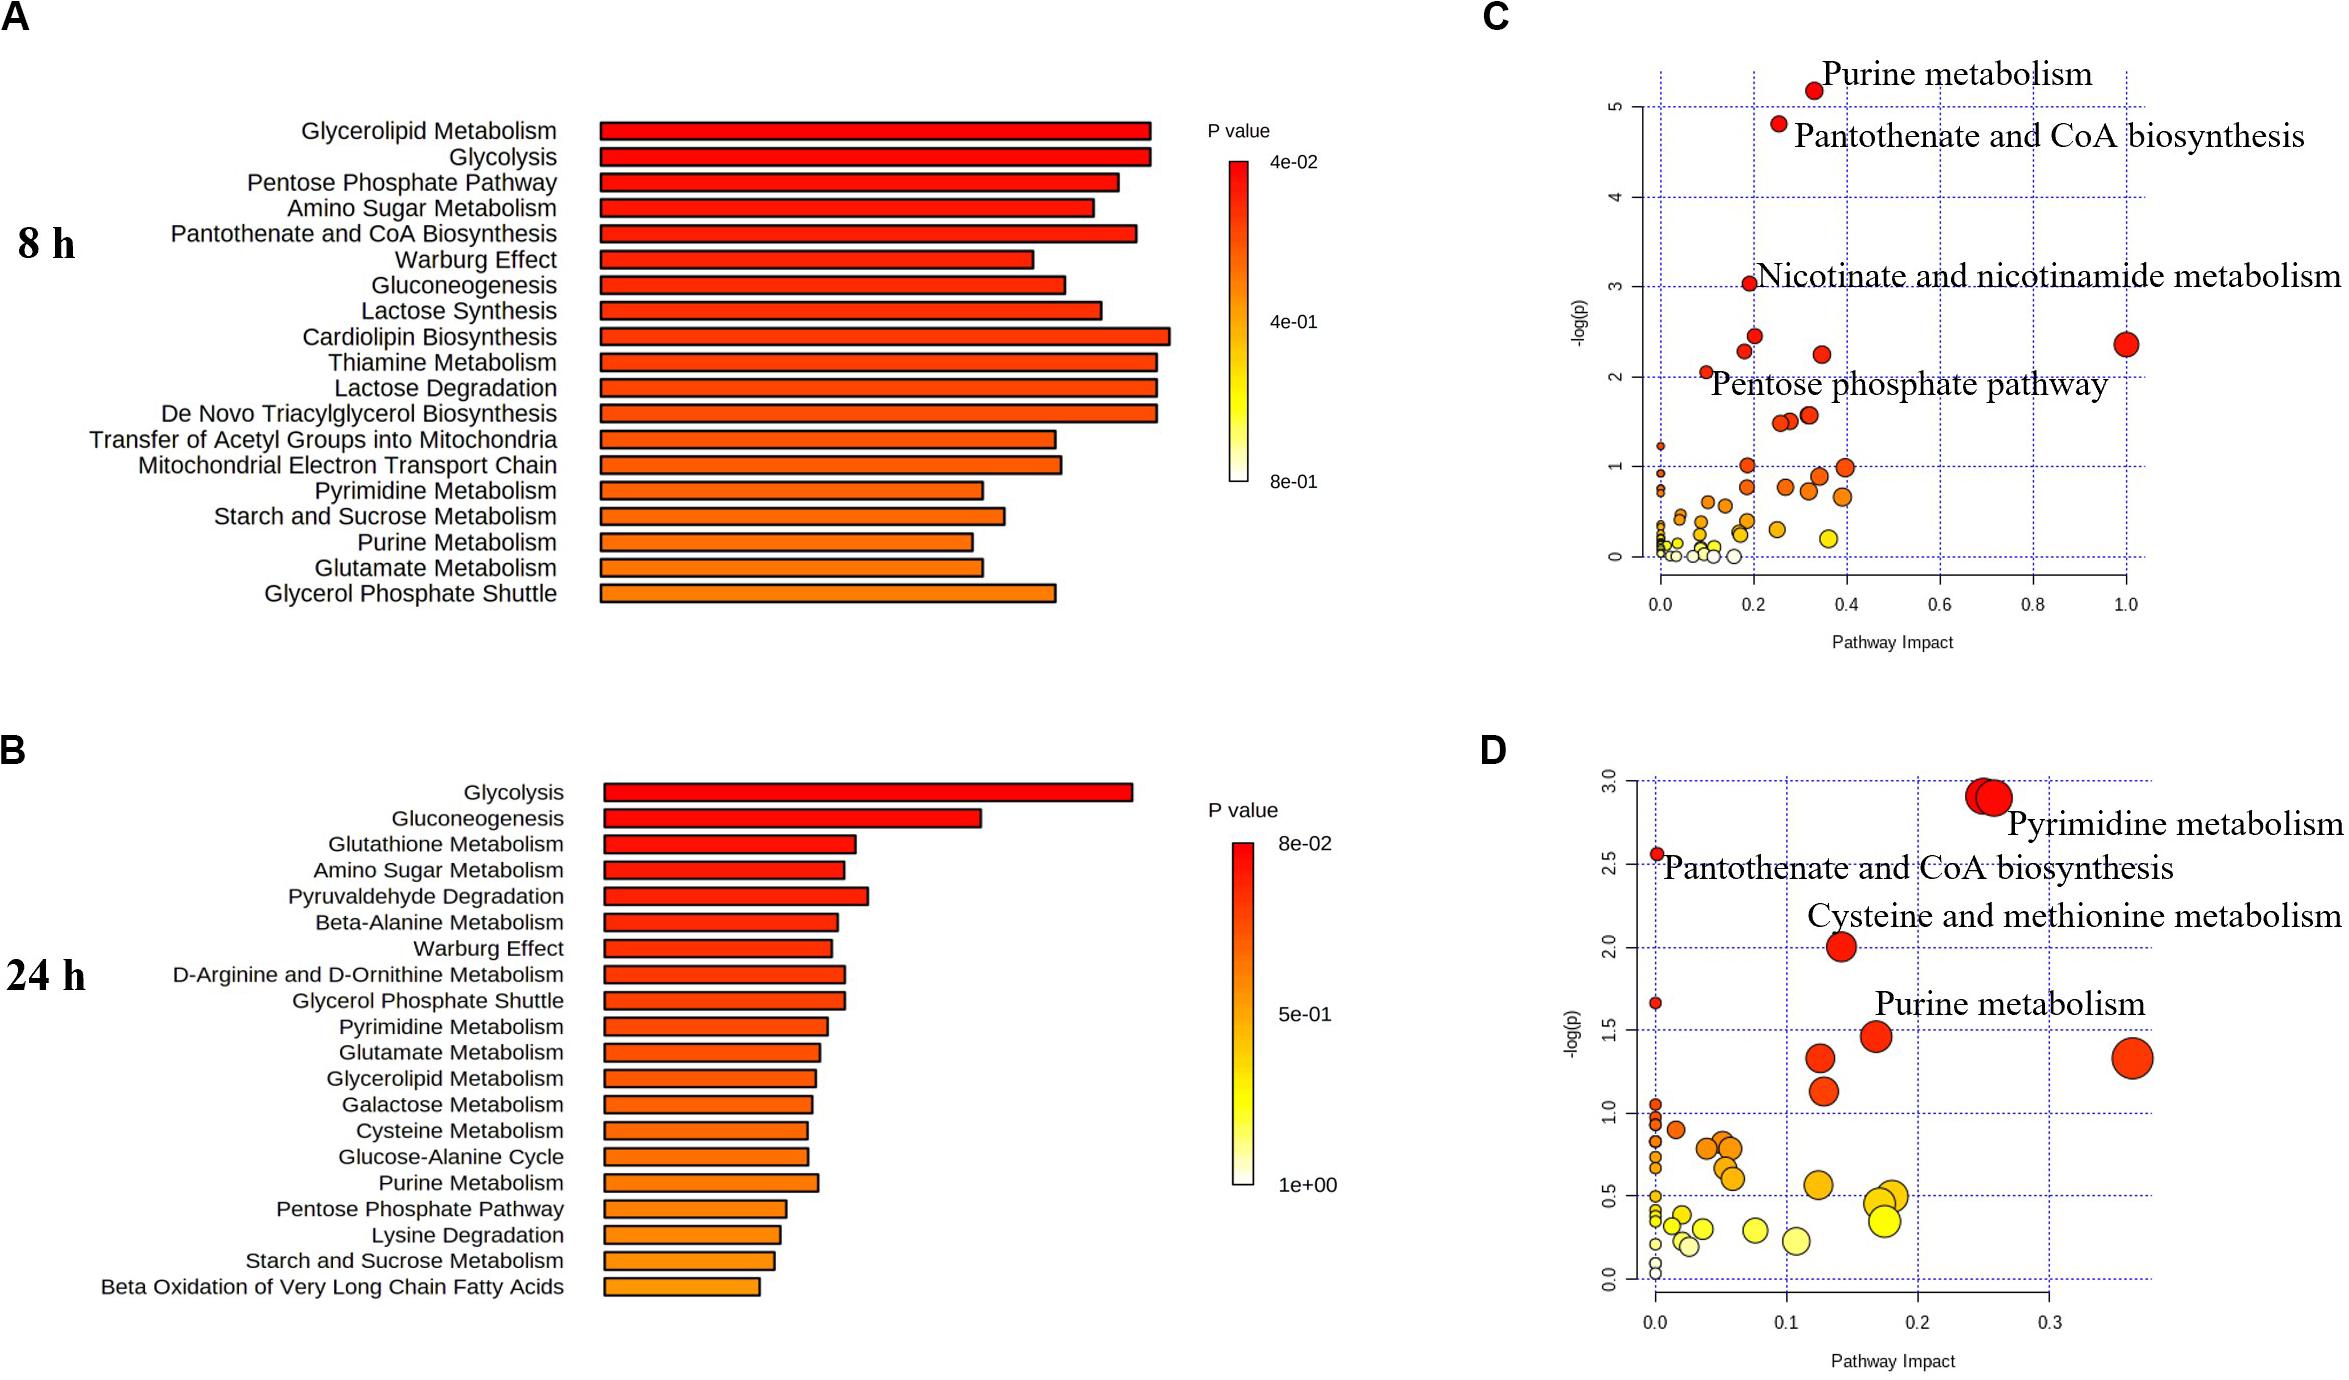
Figure 6. Perturbations of lipids and related metabolites. Enrichment analysis (A,B) and pathway analysis of significantly altered metabolites (C,D) in E. coli TOP10 with over-expression of mcr-1 at 8 and 24 h, respectively. FDR < 0.05, p < 0.05 and fold change ≥ 2, one-way ANOVA. The pathway enrichment analysis was based on KEGG Pathway with reference to E. coli K-12. The figures were produced by MetaboAnalyst 4.0 (https://www.metaboanalyst.ca/).
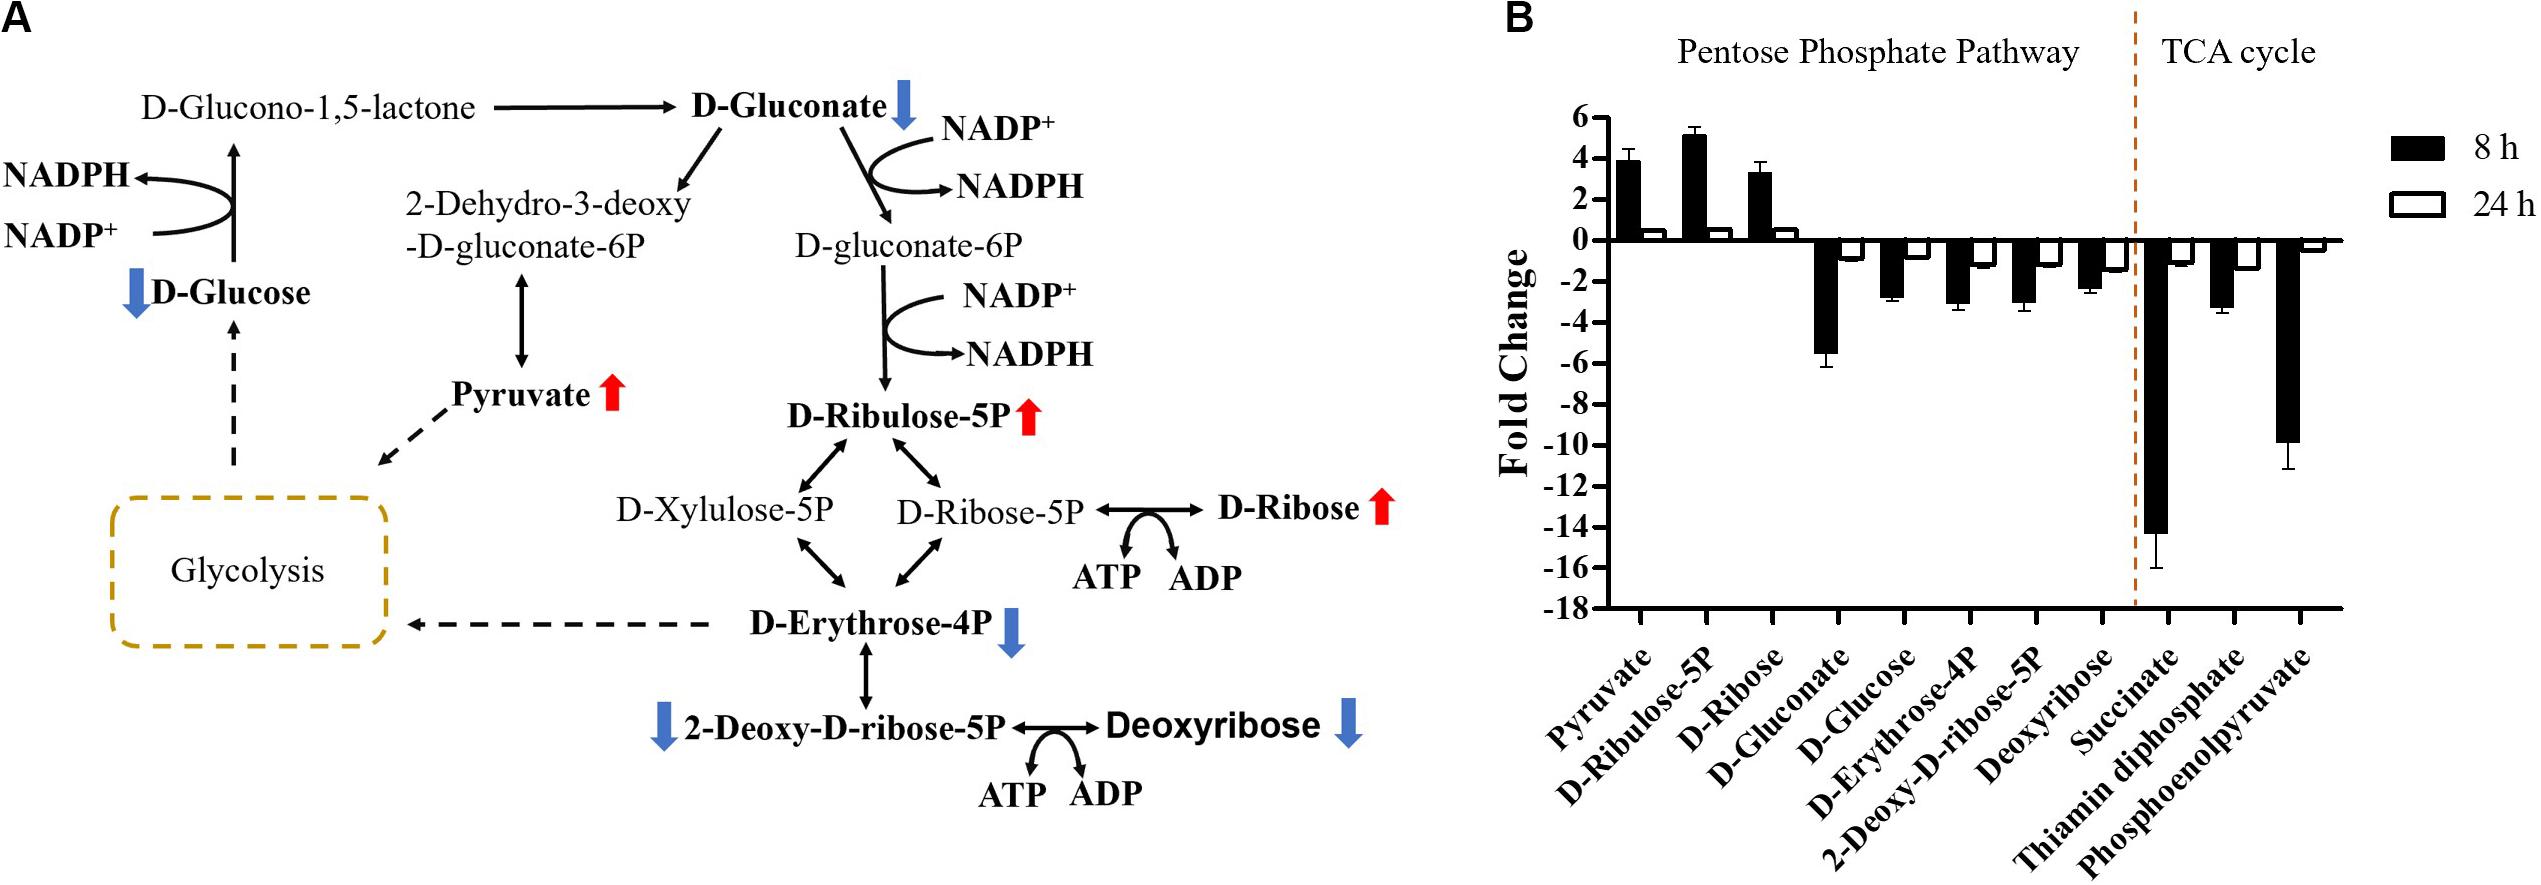
Figure 7. Central metabolic changes in pentose phosphate pathway. (A) In the pathway flow charts (adapted from KEGG Pathway with reference to E. coli K-12), red arrows and blue arrows indicate that the metabolites were significantly increased or decreased, respectively. (B) Metabolites associated with this pathway and TCA cycles at 8 and 24 h. FDR < 0.05, p < 0.05 and fold change ≥ 2.
Pathway enrichment analysis revealed that over-expression of mcr-1 following arabinose induction resulted in significant decreases in pantothenate and CoA biosynthesis (Figure 6). For example, at 8 h, the amounts of intermediate metabolites in pantothenate and CoA biosynthesis (e.g., 5,6-dihydrouracil, 2-acetolactate, 3-Methyl-2-oxobutanoate, L-cysteine, pantetheine, phospho-pantetheine, dephospho-CoA, coenzyme A, 3’,5’-ADP) were dramatically reduced (FC > 2), whereas significant accumulation of pyruvate (related to glycolysis) was observed (Figures 8A,B). At 24 h, over-expression only caused four significant changes related to propanoate and glycolysis metabolism, including 5,6-dihydrouracil, pyruvate, uracil, and 3-ureidopropionate (Figures 8A,B), the levels of other metabolites involved in coenzyme A synthesis were roughly equal to the control (Figure 8B and Supplementary Dataset S1).
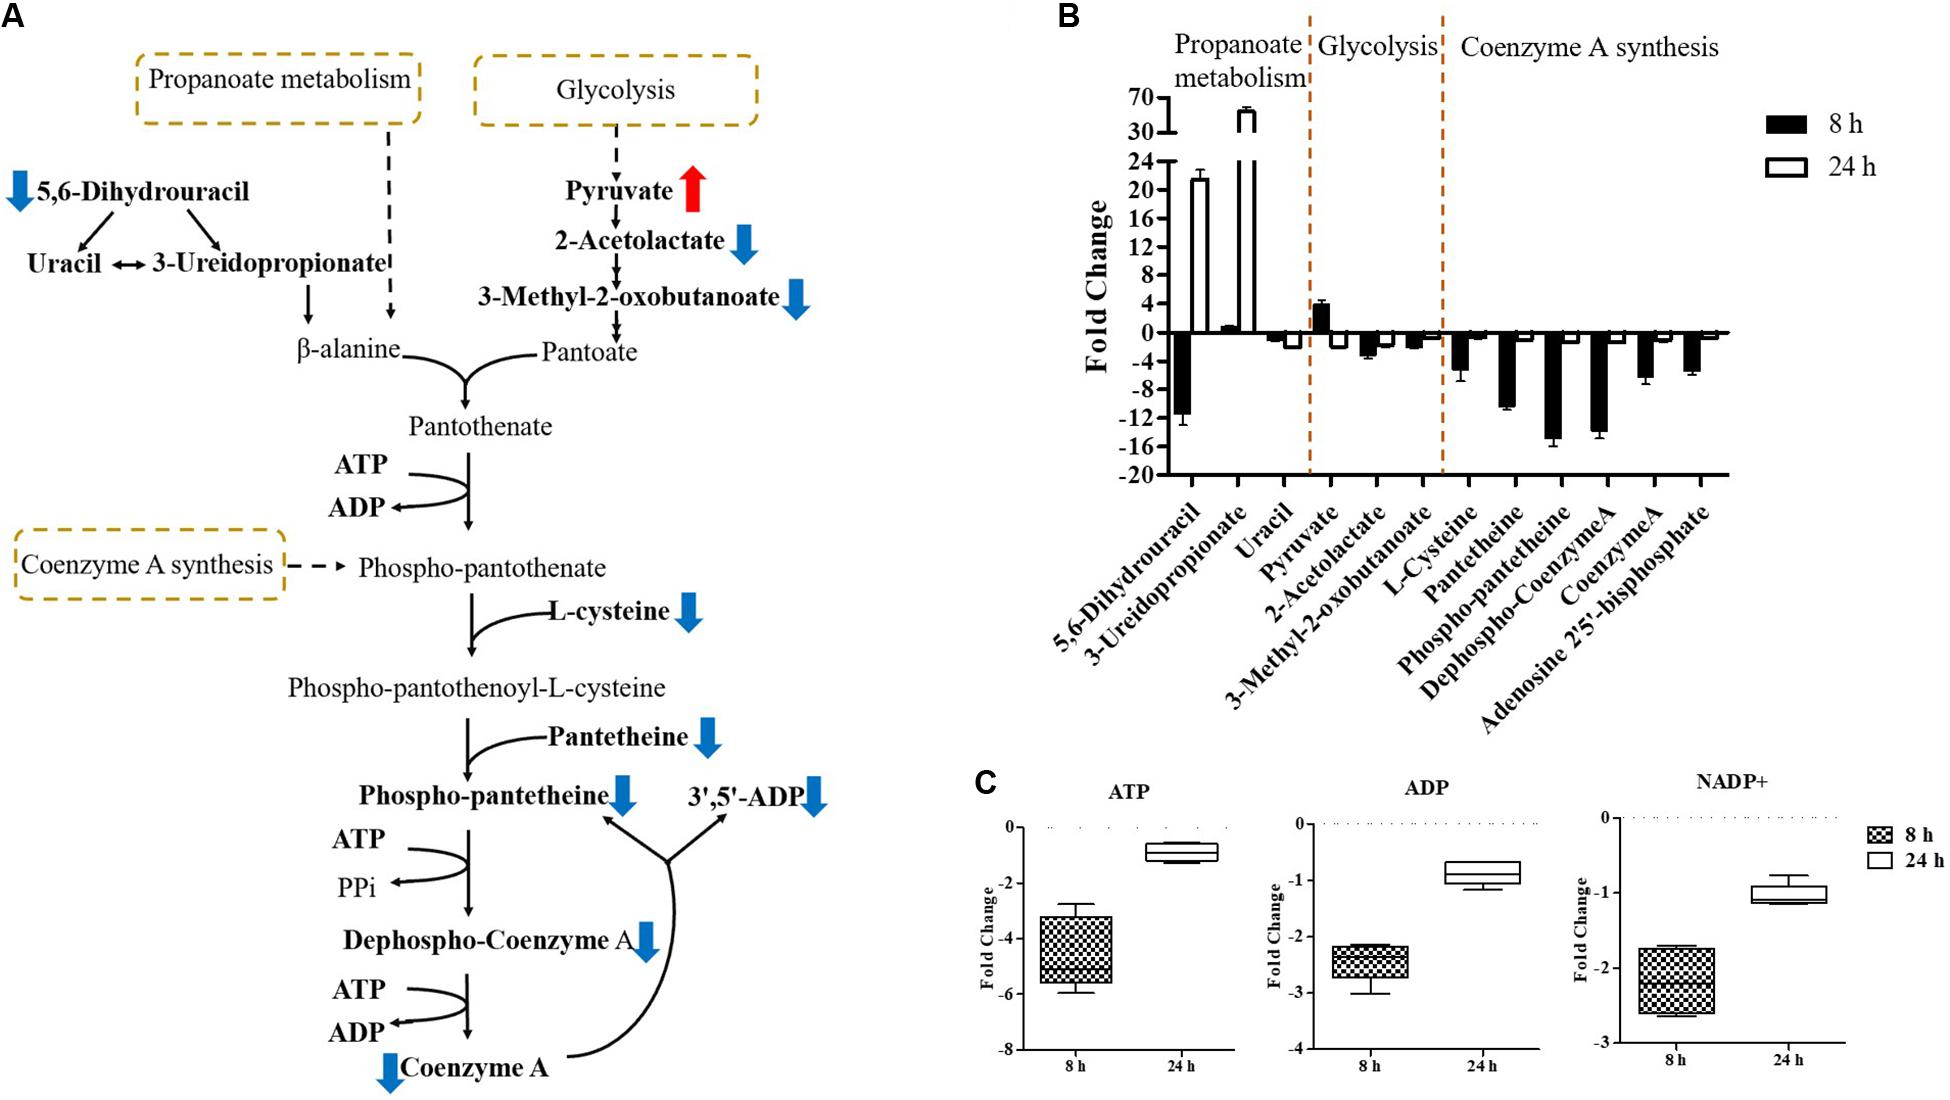
Figure 8. Central metabolic changes in pantothenate and CoA biosynthesis. (A) In the pathway flow charts (adapted from KEGG Pathway with reference to E. coli K-12), red arrows and blue arrows indicate that the metabolites were significantly increased or decreased, respectively. (B) Metabolites associated with this pathway and (C) decreased levels of key energy-associated metabolites in E. coli TOP10 with over-expression of mcr-1 at 8 and 24 h. FDR < 0.05, p < 0.05 and fold change ≥ 2.
Important cofactors such as ADP, ATP, and NADP+ were also significantly depleted (Figures 7A, 8A,C). Notably, pathway analysis revealed that changes in PPP and pantothenate and CoA biosynthesis made the greatest contribution to compensate for the fitness cost caused by overexpression of mcr-1 (Figures 6–8).
Discussion
The emergence of mcr genes has heightened concerns surrounding polymyxin resistance due to the potential for horizontal transfer (Andersson et al., 2020). It is now clear that mcr-1 encodes a phosphoethanolamine transferase, an inner membrane protein which attaches phosphoethanolamine to the lipid A, reducing susceptibility to polymyxins (Liu et al., 2017). However, the expression of mcr-1 also imposes a biological fitness burden on bacteria (Yang et al., 2017; Ma et al., 2018; Tietgen et al., 2018). Although many studies have examined the epidemiology of mcr-1, little is known about the downstream metabolic changes that occur in response to its expression. In this study we examined the impact of different levels of expression of mcr-1 on bacterial growth at 8 and 24 h and investigated the dynamics of adaptive metabolic responses to its over-expression.
Similar to previous studies (Denervaud Tendon et al., 2017; Yang et al., 2017; Zhang et al., 2019), we found that the expression of mcr-1 was orchestrated and associated with an initial fitness cost (reduced growth at 8 h). However, to the best of our knowledge our study is the first to examine in any bacterial species the impact of the over-expression of the mcr-1 on bacterial metabolism. It has been shown that MCR-1 contains a periplasmic C-terminal domain and an N-terminal transmembrane domain, anchoring the protein within the inner membrane (Wanty et al., 2013; Ma et al., 2016). The MIC of colistin increased 4-fold to 2 mg/L in the presence of 0.2% L-arabinose while dropped to 1 mg/L in the presence of 2% L-arabinose. It is possible that the more over-expression of mcr-1 will form non-functional MCR-1 protein and then reduce the MIC value and the transmembrane domain of MCR-1 triggers the destruction of the membrane (Eckert and Beck, 1989; Coyne et al., 2011). Over-expression of membrane protein affects membrane integrity and consequently cell viability (Wagner et al., 2006), and saturation of the translocon during membrane protein over-expression may lead to the accumulation of cytoplasmic aggregates and broad perturbations in the proteome (Gubellini et al., 2011). Furthermore, the observed fitness cost at 8 h associated with over-expression of mcr-1 was associated with changes in cell morphology (Figures 2D,H), leading to alterations in cell permeability and leakage of intercellular cytoplasm (Yang et al., 2017; Li B. et al., 2019). Overall, our observations suggest that the presence of the MCR-1 protein in the bacterial membrane plays the dominant role in the initial reduction in cell growth.
While the over-expression of mcr-1 resulted in reductions in bacterial growth over the first 8 h as described above, in each case growth had returned to control levels by 24 h (Figure 1B). This observation correlated well with our RT-PCR data that showed the expression of mcr-1 was high at 8 h but had markedly dropped at 24 h (Figures 1C,D). This suggests that over-expression of mcr-1 has a detrimental impact on bacterial viability and also that to relieve the associated burden bacteria defend themselves by limiting the expression of mcr-1, eventually returning to normal levels of growth (Bontron et al., 2016; Denervaud Tendon et al., 2017). Specially, at 8 h, the expression of mcr-1 was greatest with 0.02% L-arabinose (Figure 1B), despite greater reductions in growth (∼1.5 log10 CFU/mL) with the higher L-arabinose concentrations (0.2 and 2%; Figure 1D). It is possible that maximizing the production of MCR-1 is accompanied by compensatory responses that enable mcr-1 to be expressed at high levels with relatively low adverse effects (Schlegel et al., 2012; Yang et al., 2017). By 24 h, all bacteria had entered the stationary phase, but no expression of mcr-1 was detected in these bacterial with or without L-arabinose induction (Figure 1D). This may be due to the lack of essential nutrients and the accumulation of metabolic products in stationary phase, which results many metabolism-linked genes including mcr-1 switched off (Nystrom, 2004; Jaishankar and Srivastava, 2017).
Our study focused on the impact of differential expression of mcr-1 on bacterial growth at different times to investigate the dynamics of adaptive metabolic responses to the over-expression of mcr-1. Our metabolomics results demonstrated that the over-expression of mcr-1 led to perturbations in the metabolism of lipids, amino acids, carbohydrates and nucleotides. Major changes were observed in the metabolism of lipids, including fatty acid biosynthesis and elongation, glycerophospholipid (GPL) biosynthesis and degradation (Figures 4, 5). These metabolic changes are primarily associated with cell envelope biosynthesis (Maifiah et al., 2017). This suggests that the over-expression of mcr-1 interferes with the synthetic process of the cell envelope leading to membrane damage and reduced viability (Wagner et al., 2006, 2007). The widely shared metabolomic adaptive changes affecting membrane lipids in MCR-1, especially glycerophospholipid (GPL) metabolism, further demonstrate that the anchoring of the protein within the inner membrane interferes with membrane integrity and imposes a fitness cost. This is consistent with our results (Figures 2, 4, 5) and previous reports that over-expression of mcr-1 alters bacterial morphology (Yang et al., 2017; Li H. et al., 2019).
At 8 h, the over-expression of the proteins MCR-1 on membrane lipids resulted in a large accumulation of the short and medium-chain fatty acids which are important substrates for glycerophospholipid synthesis. In contrast, there was a decline in glycerophospholipid (GPL) metabolism which included decreased levels of phosphatidylethanolamine (PE), phophatidylglycerol (PG), and cardiolipin, the major membrane phospholipids in E. coli (Nikaido and Vaara, 1985; Nikaido, 2003; Tan et al., 2012). The membrane lipid composition is not fixed and a great diversity of amphiphilic lipids are produced by bacteria in order to adapt unfavorable conditions (Sohlenkamp and Geiger, 2016). Therefore, the metabolic changes observed in lipid biosynthesis which results in changes in the lipid composition of the membrane primarily—may assist in overcoming the potential fitness costs due to the over-expression of mcr-1 (Figures 4, 5). Furthermore, at 24 h bacteria carrying mcr-1 displayed equivalent growth rates to that of the control group (mcr-1 negative strain) despite continued changes in their lipid metabolism. Combined with our TEM results that indicated intact membranes at 24 h (Supplementary Figure S1), this shows the bacterial cells were able to synthesize major membrane phospholipids and form intact membranes (Henderson et al., 2016; Sohlenkamp and Geiger, 2016). These data indicate that bacteria with a lower level of mcr-1 expression are more likely to regain membrane integrity at 24 h (Supplementary Figure S1).
Finally, in addition to an increase in lipid metabolism, the over-expression of mcr-1 substantially reduced the levels of purines and pyrimidines, amino sugars, carbohydrates, nucleotides and secondary metabolites (Figure 4). It is likely that the changes observed in lipid metabolism affected other metabolic pathways (Jozefczuk et al., 2010). Interestingly, enrichment and pathway analysis revealed the over-expression of mcr-1 had the most effect on pentose phosphate pathway and pantothenate and CoA biosynthesis at 8 h (Figures 6–8) when over-expression of mcr-1 has a detrimental impact on bacterial viability (Figure 1B). Moreover, the perturbations in pantothenate and CoA biosynthesis, together with a reduction in energy metabolism (ATP, ADP, NADP+), suggests an association between a reduction in pantothenate and CoA biosynthesis and energy with the expression of mcr-1. It has been shown that pantothenate and CoA play crucial roles in membrane lipid synthesis and cellular metabolism in Gram-negative bacteria (Begley et al., 2001). In particular, CoA is essential for the biosynthesis of lipid A through its involvement in short- and long-chain fatty acid biosynthesis (Leonardi et al., 2005; Needham and Trent, 2013). It is currently unclear which reactions or factors are affected by mcr-1 and thereby induce the down regulation of pentose phosphate pathway, pantothenate and CoA biosynthesis and energy. Further experiments to elucidate the mechanisms by which this occurs are warranted.
Conclusion
This study demonstrates that the expression of mcr-1 causes global metabolic perturbations in bacteria that imposes a fitness cost. In order to recover from the physiological burden imposed, bacteria limit the over-expression of mcr-1. The metabolic responses to over-expression in E. coli mainly involve disturbances in cell envelope biogenesis and increased lipid metabolism. Notably, the over-expression of mcr-1 is closely linked to impairment of pentose phosphate pathway, pantothenate and CoA biosynthesis and energy. The multi-level metabolomic changes observed increase understanding of the physiological adaptations that bacteria adopt to cope with mcr-1 expression and therefore coping with colistin resistance. This may lead to the identification of therapeutic targets for future treatment.
Data Availability Statement
All datasets generated for this study are included in the article/Supplementary Material.
Author Contributions
J-HL and JLi designed the study. Y-YL, Q-LZ, JLu, X-QZ, HW, MA, and TL carried out the experiments. Y-YL, YZ, SN, and M-LH analyzed the data. Y-YL, PB, J-HL, and JLi drafted and revised the manuscript. All authors contributed to the article and approved the submitted version.
Funding
This work was funded by the National Natural Science Foundation of China (Nos. 31830099 and 31625026), the Guangdong Special Support Program Innovation Team (No. 2019BT02N054), the 111 Project (No. D20008), and the Innovation Team Project of Guangdong University (No. 2019KCXTD001). Y-YL gratefully acknowledged financial support from China Scholarship Council.
Conflict of Interest
The authors declare that the research was conducted in the absence of any commercial or financial relationships that could be construed as a potential conflict of interest.
Acknowledgments
We would like to thank the Monash Proteomics and Metabolomics Platform for providing LC-MS support.
Supplementary Material
The Supplementary Material for this article can be found online at: https://www.frontiersin.org/articles/10.3389/fmicb.2020.588658/full#supplementary-material
Supplementary Figure S1 | TEM micrographs of E. coli at 24 h with or without induction by 0.2% L-arabinose.
Supplementary Table S1 | Plasmids and strains used in this study.
Supplementary Table S2 | Primers used in this study.
Supplementary Table S3 | The median relative standard deviation (RSD) for all metabolites.
Supplementary Dataset S1 | All of 1,101 putatively identified unique metabolites.
Footnotes
References
Andersson, D. I., Balaban, N. Q., Baquero, F., Courvalin, P., Glaser, P., Gophna, U., et al. (2020). Antibiotic resistance: turning evolutionary principles into clinical reality. FEMS Microbiol. Rev. 44, 171–188. doi: 10.1093/femsre/fuaa001
Begley, T. P., Kinsland, C., and Strauss, E. (2001). The biosynthesis of coenzyme A in bacteria. Vitam. Horm. 61, 157–171. doi: 10.1016/s0083-6729(01)61005-7
Bonomo, R. A., Burd, E. M., Conly, J., Limbago, B. M., Poirel, L., Segre, J. A., et al. (2018). Carbapenemase-producing organisms: a global scourge. Clin. Infect. Dis. 66, 1290–1297. doi: 10.1093/cid/cix893
Bontron, S., Poirel, L., and Nordmann, P. (2016). Real-time PCR for detection of plasmid-mediated polymyxin resistance (mcr-1) from cultured bacteria and stools. J. Antimicrob. Chemother. 71, 2318–2320. doi: 10.1093/jac/dkw139
Cannatelli, A., D’andrea, M. M., Giani, T., Di Pilato, V., Arena, F., Ambretti, S., et al. (2013). In vivo emergence of colistin resistance in Klebsiella pneumoniae producing KPC-type carbapenemases mediated by insertional inactivation of the PhoQ/PhoP mgrB regulator. Antimicrob. Agents Chemother. 57, 5521–5526. doi: 10.1128/aac.01480-13
Carroll, L. M., Gaballa, A., Guldimann, C., Sullivan, G., Henderson, L. O., and Wiedmann, M. (2019). Identification of novel mobilized colistin resistance gene mcr-9 in a multidrug-resistant, colistin-susceptible Salmonella enterica serotype Typhimurium isolate. mBio 10:e00853-19.
Caspi, R., Billington, R., Fulcher, C. A., Keseler, I. M., Kothari, A., Krummenacker, M., et al. (2018). The MetaCyc database of metabolic pathways and enzymes. Nucleic Acids Res. 46, D633–D639.
Chong, J., Soufan, O., Li, C., Caraus, I., Li, S., Bourque, G., et al. (2018). MetaboAnalyst 4.0: towards more transparent and integrative metabolomics analysis. Nucleic Acids Res. 46, W486–W494.
Clinical and Laboratory Standards Institute (2017). Performance Standards for Antimicrobial Susceptibility Testing, 26th Edn. Wayne, PA: CLSI.
Coyne, S., Courvalin, P., and Perichon, B. (2011). Efflux-mediated antibiotic resistance in Acinetobacter spp. Antimicrob. Agents Chemother. 55, 947–953. doi: 10.1128/aac.01388-10
Creek, D. J., Jankevics, A., Burgess, K. E., Breitling, R., and Barrett, M. P. (2012). IDEOM: an excel interface for analysis of LC-MS-based metabolomics data. Bioinformatics 28, 1048–1049. doi: 10.1093/bioinformatics/bts069
Denervaud Tendon, V., Poirel, L., and Nordmann, P. (2017). Transferability of the mcr-1 colistin resistance gene. Microb. Drug Resist. 23, 813–814. doi: 10.1089/mdr.2016.0191
Eckert, B., and Beck, C. F. (1989). Overproduction of transposon Tn10-encoded tetracycline resistance protein results in cell death and loss of membrane potential. J. Bacteriol. 171, 3557–3559. doi: 10.1128/jb.171.6.3557-3559.1989
Falagas, M. E., and Kasiakou, S. K. (2005). Colistin: the revival of polymyxins for the management of multidrug-resistant gram-negative bacterial infections. Clin. Infect. Dis. 40, 1333–1341. doi: 10.1086/429323
Gubellini, F., Verdon, G., Karpowich, N. K., Luff, J. D., Boel, G., Gauthier, N., et al. (2011). Physiological response to membrane protein overexpression in E. coli. Mol. Cell. Proteomics 10:M111.007930.
Gulliver, E. L., Wright, A., Lucas, D. D., Megroz, M., Kleifeld, O., Schittenhelm, R. B., et al. (2018). Determination of the small RNA GcvB regulon in the Gram-negative bacterial pathogen Pasteurella multocida and identification of the GcvB seed binding region. RNA 24, 704–720. doi: 10.1261/rna.063248.117
Guzman, L. M., Belin, D., Carson, M. J., and Beckwith, J. (1995). Tight regulation, modulation, and high-level expression by vectors containing the arabinose PBAD promoter. J. Bacteriol. 177, 4121–4130. doi: 10.1128/jb.177.14.4121-4130.1995
Han, M. L., Zhu, Y., Creek, D. J., Lin, Y. W., Anderson, D., Shen, H. H., et al. (2018). Alterations of metabolic and lipid profiles in polymyxin-resistant Pseudomonas aeruginosa. Antimicrob. Agents Chemother. 62:e02656-17. doi: 10.1128/AAC.02656-17
Henderson, J. C., Zimmerman, S. M., Crofts, A. A., Boll, J. M., Kuhns, L. G., Herrera, C. M., et al. (2016). The power of asymmetry: architecture and assembly of the gram-negative outer membrane lipid bilayer. Annu. Rev. Microbiol. 70, 255–278. doi: 10.1146/annurev-micro-102215-095308
Jaishankar, J., and Srivastava, P. (2017). Molecular basis of stationary phase survival and applications. Front. Microbiol. 8:2000. doi: 10.3389/fmicb.2017.02000
Jozefczuk, S., Klie, S., Catchpole, G., Szymanski, J., Cuadros-Inostroza, A., Steinhauser, D., et al. (2010). Metabolomic and transcriptomic stress response of Escherichia coli. Mol. Syst. Biol. 6:364. doi: 10.1038/msb.2010.18
Kanehisa, M., and Goto, S. (2000). KEGG: Kyoto encyclopedia of genes and genomes. Nucleic Acids Res. 28, 27–30. doi: 10.1093/nar/28.1.27
Karaiskos, I., and Giamarellou, H. (2014). Multidrug-resistant and extensively drug-resistant Gram-negative pathogens: current and emerging therapeutic approaches. Expert Opin. Pharmacother. 15, 1351–1370. doi: 10.1517/14656566.2014.914172
Kirwan, J. A., Weber, R. J., Broadhurst, D. I., and Viant, M. R. (2014). Direct infusion mass spectrometry metabolomics dataset: a benchmark for data processing and quality control. Sci. Data 1:140012. doi: 10.1038/sdata.2014.12
Leonardi, R., Zhang, Y. M., Rock, C. O., and Jackowski, S. (2005). Coenzyme A: back in action. Prog. Lipid Res. 44, 125–153. doi: 10.1016/j.plipres.2005.04.001
Lerminiaux, N. A., and Cameron, A. D. S. (2019). Horizontal transfer of antibiotic resistance genes in clinical environments. Can. J. Microbiol. 65, 34–44. doi: 10.1139/cjm-2018-0275
Li, B., Yin, F., Zhao, X., Guo, Y., Wang, W., Wang, P., et al. (2019). Colistin resistance gene mcr-1 mediates cell permeability and resistance to hydrophobic antibiotics. Front. Microbiol. 10:3015. doi: 10.3389/fmicb.2019.03015
Li, H., Wang, Y., Meng, Q., Wang, Y., Xia, G., Xia, X., et al. (2019). Comprehensive proteomic and metabolomic profiling of mcr-1-mediated colistin resistance in Escherichia coli. Int. J. Antimicrob. Agents 53, 795–804. doi: 10.1016/j.ijantimicag.2019.02.014
Liu, Y., and Liu, J. H. (2018). Monitoring colistin resistance in food animals, an urgent threat. Expert Rev. Anti Infect. Ther. 16, 443–446. doi: 10.1080/14787210.2018.1481749
Liu, Y. Y., Chandler, C. E., Leung, L. M., Mcelheny, C. L., Mettus, R. T., Shanks, R. M. Q., et al. (2017). Structural modification of lipopolysaccharide conferred by mcr-1 in gram-negative ESKAPE pathogens. Antimicrob. Agents Chemother. 61:e00580-17. doi: 10.1128/AAC.00580-17
Liu, Y. Y., Wang, Y., Walsh, T. R., Yi, L.-X., Zhang, R., Spencer, J., et al. (2016). Emergence of plasmid-mediated colistin resistance mechanism MCR-1 in animals and human beings in China: a microbiological and molecular biological study. Lancet Infect. Dis. 16, 161–168. doi: 10.1016/S1473-3099(15)00424-7
Ma, G., Zhu, Y., Yu, Z., Ahmad, A., and Zhang, H. (2016). High resolution crystal structure of the catalytic domain of MCR-1. Sci. Rep. 6:39540. doi: 10.1038/srep39540
Ma, K., Feng, Y., and Zong, Z. (2018). Fitness cost of a mcr-1-carrying IncHI2 plasmid. PLoS One 13:e0209706. doi: 10.1371/journal.pone.0209706
Maifiah, M. H., Creek, D. J., Nation, R. L., Forrest, A., Tsuji, B. T., Velkov, T., et al. (2017). Untargeted metabolomics analysis reveals key pathways responsible for the synergistic killing of colistin and doripenem combination against Acinetobacter baumannii. Sci. Rep. 7:45527. doi: 10.1038/srep45527
McEwen, S. A., and Collignon, P. J. (2018). Antimicrobial resistance: a one health perspective. Microbiol. Spectr. 6:ARBA-0009-2017. doi: 10.1128/9781555819804.ch25
Nang, S. C., Li, J., and Velkov, T. (2019). The rise and spread of mcr plasmid-mediated polymyxin resistance. Crit. Rev. Microbiol. 45, 131–161. doi: 10.1080/1040841X.2018.1492902
Needham, B. D., and Trent, M. S. (2013). Fortifying the barrier: the impact of lipid A remodelling on bacterial pathogenesis. Nat. Rev. Microbiol. 11, 467–481. doi: 10.1038/nrmicro3047
Nikaido, H. (2003). Molecular basis of bacterial outer membrane permeability revisited. Microbiol. Mol. Biol. Rev. 67, 593–656. doi: 10.1128/MMBR.67.4.593-656.2003
Nikaido, H., and Vaara, M. (1985). Molecular basis of bacterial outer membrane permeability. Microbiol. Rev. 49, 1–32. doi: 10.1128/MMBR.49.1.1-32.1985
Nystrom, T. (2004). Stationary-phase physiology. Annu. Rev. Microbiol. 58, 161–181. doi: 10.1146/annurev.micro.58.030603.123818
Olaitan, A. O., Morand, S., and Rolain, J. M. (2014). Mechanisms of polymyxin resistance: acquired and intrinsic resistance in bacteria. Front. Microbiol. 5:643. doi: 10.3389/fmicb.2014.00643
Schlegel, S., Lofblom, J., Lee, C., Hjelm, A., Klepsch, M., Strous, M., et al. (2012). Optimizing membrane protein overexpression in the Escherichia coli strain Lemo21(DE3). J. Mol. Biol. 423, 648–659. doi: 10.1016/j.jmb.2012.07.019
Sohlenkamp, C., and Geiger, O. (2016). Bacterial membrane lipids: diversity in structures and pathways. FEMS Microbiol. Rev. 40, 133–159. doi: 10.1093/femsre/fuv008
Tan, B. K., Bogdanov, M., Zhao, J., Dowhan, W., Raetz, C. R., and Guan, Z. (2012). Discovery of a cardiolipin synthase utilizing phosphatidylethanolamine and phosphatidylglycerol as substrates. Proc. Natl. Acad. Sci. U.S.A. 109, 16504–16509. doi: 10.1073/pnas.1212797109
Tietgen, M., Semmler, T., Riedel-Christ, S., Kempf, V. A. J., Molinaro, A., Ewers, C., et al. (2018). Impact of the colistin resistance gene mcr-1 on bacterial fitness. Int. J. Antimicrob. Agents 51, 554–561. doi: 10.1016/j.ijantimicag.2017.11.011
Velkov, T., Roberts, K. D., Nation, R. L., Thompson, P. E., and Li, J. (2013). Pharmacology of polymyxins: new insights into an ‘old’ class of antibiotics. Future Microbiol. 8, 711–724. doi: 10.2217/fmb.13.39
Wagner, S., Baars, L., Ytterberg, A. J., Klussmeier, A., Wagner, C. S., Nord, O., et al. (2007). Consequences of membrane protein overexpression in Escherichia coli. Mol. Cell. Proteomics 6, 1527–1550. doi: 10.1074/mcp.M600431-MCP200
Wagner, S., Bader, M. L., Drew, D., and De Gier, J. W. (2006). Rationalizing membrane protein overexpression. Trends Biotechnol. 24, 364–371. doi: 10.1016/j.tibtech.2006.06.008
Wang, C., Feng, Y., Liu, L., Wei, L., Kang, M., and Zong, Z. (2020). Identification of novel mobile colistin resistance gene mcr-10. Emerg. Microbes Infect. 9, 508–516. doi: 10.1080/22221751.2020.1732231
Wanty, C., Anandan, A., Piek, S., Walshe, J., Ganguly, J., Carlson, R. W., et al. (2013). The structure of the neisserial lipooligosaccharide phosphoethanolamine transferase A (LptA) required for resistance to polymyxin. J. Mol. Biol. 425, 3389–3402. doi: 10.1016/j.jmb.2013.06.029
Yang, Q., Li, M., Spiller, O. B., Andrey, D. O., Hinchliffe, P., Li, H., et al. (2017). Balancing mcr-1 expression and bacterial survival is a delicate equilibrium between essential cellular defence mechanisms. Nat. Commun. 8:2054. doi: 10.1038/s41467-017-02149-0
Zampieri, M., Zimmermann, M., Claassen, M., and Sauer, U. (2017). Nontargeted metabolomics reveals the multilevel response to antibiotic perturbations. Cell Rep. 19, 1214–1228. doi: 10.1016/j.celrep.2017.04.002
Keywords: colistin, mcr-1, fitness cost, metabolomics, glycerophospholipids, pentose phosphate pathway, pantothenate and CoA biosynthesis
Citation: Liu Y-Y, Zhu Y, Wickremasinghe H, Bergen PJ, Lu J, Zhu X-Q, Zhou Q-L, Azad M, Nang SC, Han M-L, Lei T, Li J and Liu J-H (2020) Metabolic Perturbations Caused by the Over-Expression of mcr-1 in Escherichia coli. Front. Microbiol. 11:588658. doi: 10.3389/fmicb.2020.588658
Received: 29 July 2020; Accepted: 14 September 2020;
Published: 09 October 2020.
Edited by:
Aixin Yan, The University of Hong Kong, Hong KongCopyright © 2020 Liu, Zhu, Wickremasinghe, Bergen, Lu, Zhu, Zhou, Azad, Nang, Han, Lei, Li and Liu. This is an open-access article distributed under the terms of the Creative Commons Attribution License (CC BY). The use, distribution or reproduction in other forums is permitted, provided the original author(s) and the copyright owner(s) are credited and that the original publication in this journal is cited, in accordance with accepted academic practice. No use, distribution or reproduction is permitted which does not comply with these terms.
*Correspondence: Jian Li, jian.li@monash.edu; Jian-Hua Liu, jhliu@scau.edu.cn