 Perrine Cruaud1,2,3*
 Adrien Vigneron1,4,5
 Marie-Stéphanie Fradette1,2,3Caetano C. Dorea6
 Alexander I. Culley1,2,7
 Manuel J. Rodriguez3,8
 Steve J. Charette1,2,9
- 1Institut de Biologie Intégrative et des Systèmes, Université Laval, Québec City, QC, Canada
- 2Département de Biochimie, de Microbiologie et de Bio-Informatique, Faculté des Sciences et de Génie, Université Laval, Québec City, QC, Canada
- 3CRAD, Université Laval, Québec City, QC, Canada
- 4Centre D’Études Nordiques, Université Laval, Québec City, QC, Canada
- 5Département de Biologie, Université Laval, Québec City, QC, Canada
- 6Department of Civil Engineering, University of Victoria, Victoria, BC, Canada
- 7Groupe de Recherche en Ecologie Buccale, Faculté de Médecine Dentaire, Université Laval, Québec City, QC, Canada
- 8École Supérieure D’aménagement du Territoire et de Développement Régional (ESAD), Université Laval, Québec City, QC, Canada
- 9Centre de Recherche de l’Institut Universitaire de Cardiologie et de Pneumologie de Québec, Québec City, QC, Canada
Protists are key stone components of aquatic ecosystems, sustaining primary productivity and aquatic food webs. However, their diversity, ecology and structuring factors shaping their temporal distribution remain strongly misunderstood in freshwaters. Using high-throughput sequencing on water samples collected over 16 different months (including two summer and two winter periods), combined with geochemical measurements and climate monitoring, we comprehensively determined the pico- and nanoeukaryotic community composition and dynamics in a Canadian river undergoing prolonged ice-cover winters. Our analysis revealed a large protist diversity in this fluctuating ecosystem and clear seasonal patterns demonstrating a direct and/or indirect selective role of abiotic factors, such as water temperature or nitrogen concentrations, in structuring the eukaryotic microbial community. Nonetheless, our results also revealed that primary productivity, predatory as well as parasitism lifestyles, inferred from fine phylogenetic placements, remained potentially present over the annual cycle, despite the large seasonal fluctuations and the remodeling of the community composition under ice. In addition, potential interplays with the bacterial community composition were identified supporting a possible contribution of the bacterial community to the temporal dynamics of the protist community structure. Our results illustrate the complexity of the eukaryotic microbial community and provide a substantive and useful dataset to better understand the global freshwater ecosystem functioning.
Introduction
Eukaryotic microorganisms are widespread, diverse and involved in global functioning of ecosystems (Sherr and Sherr, 1988; Caron et al., 2009; Worden et al., 2015; Debroas et al., 2017). As primary producers, global consumers or prey for larger microbial grazers and metazoans, they represent a key link in aquatic food webs (Sherr and Sherr, 1988; Arndt, 1993; Premke and Arndt, 2000; Šlapeta et al., 2005). However, they have received less attention than prokaryotes in microbial ecology (Simon et al., 2015; Debroas et al., 2017) and their diversity has been generally less investigated in freshwaters than in oceans (Nolte et al., 2010; Debroas et al., 2017). Therefore, there is a gap in the current knowledge of the distribution, biodiversity and temporal dynamics of these microorganisms in freshwater environments (Triadó-Margarit and Casamayor, 2012).
From autotrophy (photosynthesizers) to heterotrophy (predators feeding on other eukaryotic or prokaryotic organisms, decomposers, saprophytes, and parasites of other organisms), through mixotrophy, protists cover multiple ecological roles in ecosystems (Arndt et al., 2000; Zubkov and Tarran, 2008). While it was commonly accepted that some eukaryotic phyla were strictly photosynthetic or phagotrophic, numerous studies have demonstrated that many groups are actually more flexible in their nutritional capabilities than initially thought (Laval-Peuto and Febvre, 1986; McManus and Fuhrman, 1986; Stoecker and Silver, 1987; McManus et al., 2018). For example, photosynthetic capability via endosymbiotic associations or chloroplast retention (uptake of chloroplast from their prey, or kleptoplasty) has been observed in a broad range of eukaryotic lineages, such as ciliates, that were previously associated with a phagotrophic non-photosynthetic lifestyle (Stoecker and Silver, 1987; Dolan, 1992; Johnson, 2011; McManus et al., 2018) or dinoflagellates (Minnhagen et al., 2008; Hansen et al., 2016). Likewise, the loss of chloroplasts by lineages within commonly accepted photosynthetic groups has also been detected, such as the Paraphysomonas-clade within Chrysophyceae (Stramenopiles) (Caron et al., 1999; Boenigk et al., 2005; Scoble and Cavalier-Smith, 2014; Grossmann et al., 2016). Mixotrophy, defined as the combination of phagotrophy and photosynthesis in an individual cell, is increasingly recognized as an important trophic mode among aquatic eukaryotes and is likely the rule rather than the exception in microbial food webs (Caron et al., 1999; Stoecker et al., 2017; McManus et al., 2018; Stoecker and Lavrentyev, 2018). In addition, bacterivorous eukaryotes do not feed equally on all microorganisms. Some of them are considered generalists, feeding on a broad range of prey, while others are specialists, feeding on a narrow range of species (Haraguchi, 2018). Thus, each phagotrophic eukaryotic species might have different prey preferences affecting the microbial assemblage differently (Massana et al., 2009). Moreover, growth, grazing and photosynthesis rates as well as prey preferences could be greatly modulated depending on environmental factors such as temperature (Wilken et al., 2013), light (Millette et al., 2017) and nutrient availability (Urabe et al., 1999; Kamjunke et al., 2006; Stoecker and Lavrentyev, 2018) or presence/absence of some microbial lineages (Terrado et al., 2017), adding a supplementary layer of complexity in microeukaryote ecology.
While amplicon sequencing and “omic” analyses allow the identification of prokaryotic microorganisms as well as their functional and nutritional capabilities which might explain temporal and spatial dynamics (Logares et al., 2014; Lima-Mendez et al., 2015; Salcher et al., 2015; Samad and Bertilsson, 2017; Vigneron et al., 2018, 2019; Cruaud et al., 2019), these analyses do not yet allow as easily the assignment of functional roles to complex eukaryotic communities. Over the past few years, increasing efforts have been made to understand their ecological roles using extensive genome-level description and single-cell sequencing revealing genomic elements associated with bacterivorous or photosynthetic lifestyles (Roy et al., 2014; Seeleuthner et al., 2018). However, these studies are still scarce and challenged by the high eukaryotic genome size that leads to highly fragmented assemblies and incomplete genomes (Seeleuthner et al., 2018). Therefore, the understanding of the temporal dynamics of eukaryotic microorganisms and the underlying environmental drivers remains a real challenge in environmental microbial ecology.
Previous studies on freshwater environments showed that seasonal cycles characterized by both abiotic and biotic disturbances may influence the protist community composition and more broadly control the structure of all biota (Kalff and Knoechel, 1978; Carrias et al., 1998; Lepère et al., 2006; Zhao et al., 2011; Sommer et al., 2012; Jones et al., 2013; Simon et al., 2015). For its part, the Plankton Ecology Group (PEG) model propose a standard template to describe the successive stages of the phytoplankton and zooplankton biomasses in lake ecosystems. It also indicates potential factors driving these seasonal successions and emphasizes that further investigations at finer taxonomical level are required to complete this model (Sommer et al., 1986, 2012). Study of the temporal dynamics of eukaryotic microbial community composition in freshwater ecosystems experiencing large fluctuations in environmental parameters, that lead to marked changes in populations, can therefore contribute to a better understanding of the mechanisms driving the dynamics of these communities.
The Saint-Charles River, located in Quebec, Canada, experiences contrasted seasons with long freezing winters and relatively short temperate summers (Cruaud et al., 2019) and might therefore represent an interesting environment to investigate microeukaryotic ecology in freshwaters. The harsh climatic conditions of the region have been shown to induce an annual cycle of bacterial communities in this river with rapid successions of bacterial lineages (Cruaud et al., 2019). Bacterial communities detected during the warm season (WS) were typical of other freshwater ecosystems with high proportions of Limnohabitans and Actinobacteria, such as Sporichthyaceae hgcI/acI lineages, which are frequently reported as prey for eukaryotes (Grujcic et al., 2018; Piwosz et al., 2018; Šimek et al., 2018). By contrast, the bacterial communities changed during winter, with a notable increase in proportions of potential gammaproteobacterial methanotrophs (Cruaud et al., 2019), revealing a deep modification of the microbial ecosystem, with potential consequences on aquatic food webs.
The present study is therefore the eukaryotic counterpart of the bacterial community analysis conducted in the Saint-Charles River (Cruaud et al., 2019) and aim to better understand the dynamics of eukaryotic microbial communities in freshwater ecosystems and the underlying mechanisms of the global functioning of this river.
With these objectives, we have monitored the changes in the community structure of pico- and nanoplanktonic protists (i.e., small microbial eukaryotes of 0.22–20 μm diameter) in the Saint-Charles River water samples collected over 16 different months (including two summer and two winter periods) using massive sequencing of the 18S rRNA gene (rDNA). We then examined these results in the light of environmental parameters, such as geochemical measurements and climate monitoring. After an overall analysis of the entire protist community structure, we focused on a subset of 25 dominant eukaryotic OTUs that explained most of the community variation across samples. We investigated in detail the dynamics and potential trophic modes of these protists using phylogenetic analyses and looked for interplays between eukaryotic, bacterial microbial communities and environmental parameters.
Materials and Methods
Sampling Sites and Methods
The Saint-Charles River, a major drinking water source in the Quebec city region, is evenly fed by the Saint-Charles Lake and two main tributaries (Jaune and Nelson Rivers) (Figure 1). The river flow of the Saint-Charles River is mainly controlled by flood gates at the Saint-Charles Lake dam to ensure adequate supply for the Loretteville Drinking Water Treatment Plant (DWTP – Quebec city, 11 km downstream of the dam) and a minimum ecological flow in the river. The Saint-Charles Lake is stratified during summer and winter and mixed during fall and spring turnovers (Boulé et al., 2010). The lake is ice-covered during winter and usually ice-free after mid-April or early May, before the spring turnover (APEL, 2015). The Saint-Charles River water samples were collected weekly or bimonthly at the raw water intake of the Loretteville DWTP (Figure 1) from May 2016 to June 2017 with two additional sampling on 31 January and 12 February 2018, representing a total of 34 sampling dates. The part of the Saint-Charles River from the dam to the DWTP is a river of order 5, with an average width of 22 m and is characterized by numerous meanders and wetlands (Brodeur et al., 2009). Raw water was collected at the DWTP before any chemical or physical treatments excepted a coarse screening at the water collection point. Water incoming at the DWTP cover a large part of the river water column (∼2 m depth) and could be considered as a representative sample of the full river water column at this point. Water was collected directly in three different sterile and nucleic acid-free 4-liter CubitainersTM (replicates) then transported at 4°C to the laboratory, and processed within 2 h. The sampling strategy and experimental procedures used in this study were detailed in the previous work focusing on the bacterial communities of the Saint-Charles River (Cruaud et al., 2019). Briefly, 400 mL of each CubitainersTM were first passed through a 20 μm mesh and then filtered through a 3 μm pore-size polycarbonate membrane filter (large pore-size filter) in line with a 0.22 μm SterivexTM unit (small pore-size filter). To evaluate replicability of the protocol, filtrations were carried out in duplicate per CubitainersTM, leading in total to 204 large and 204 small pore-size filters.
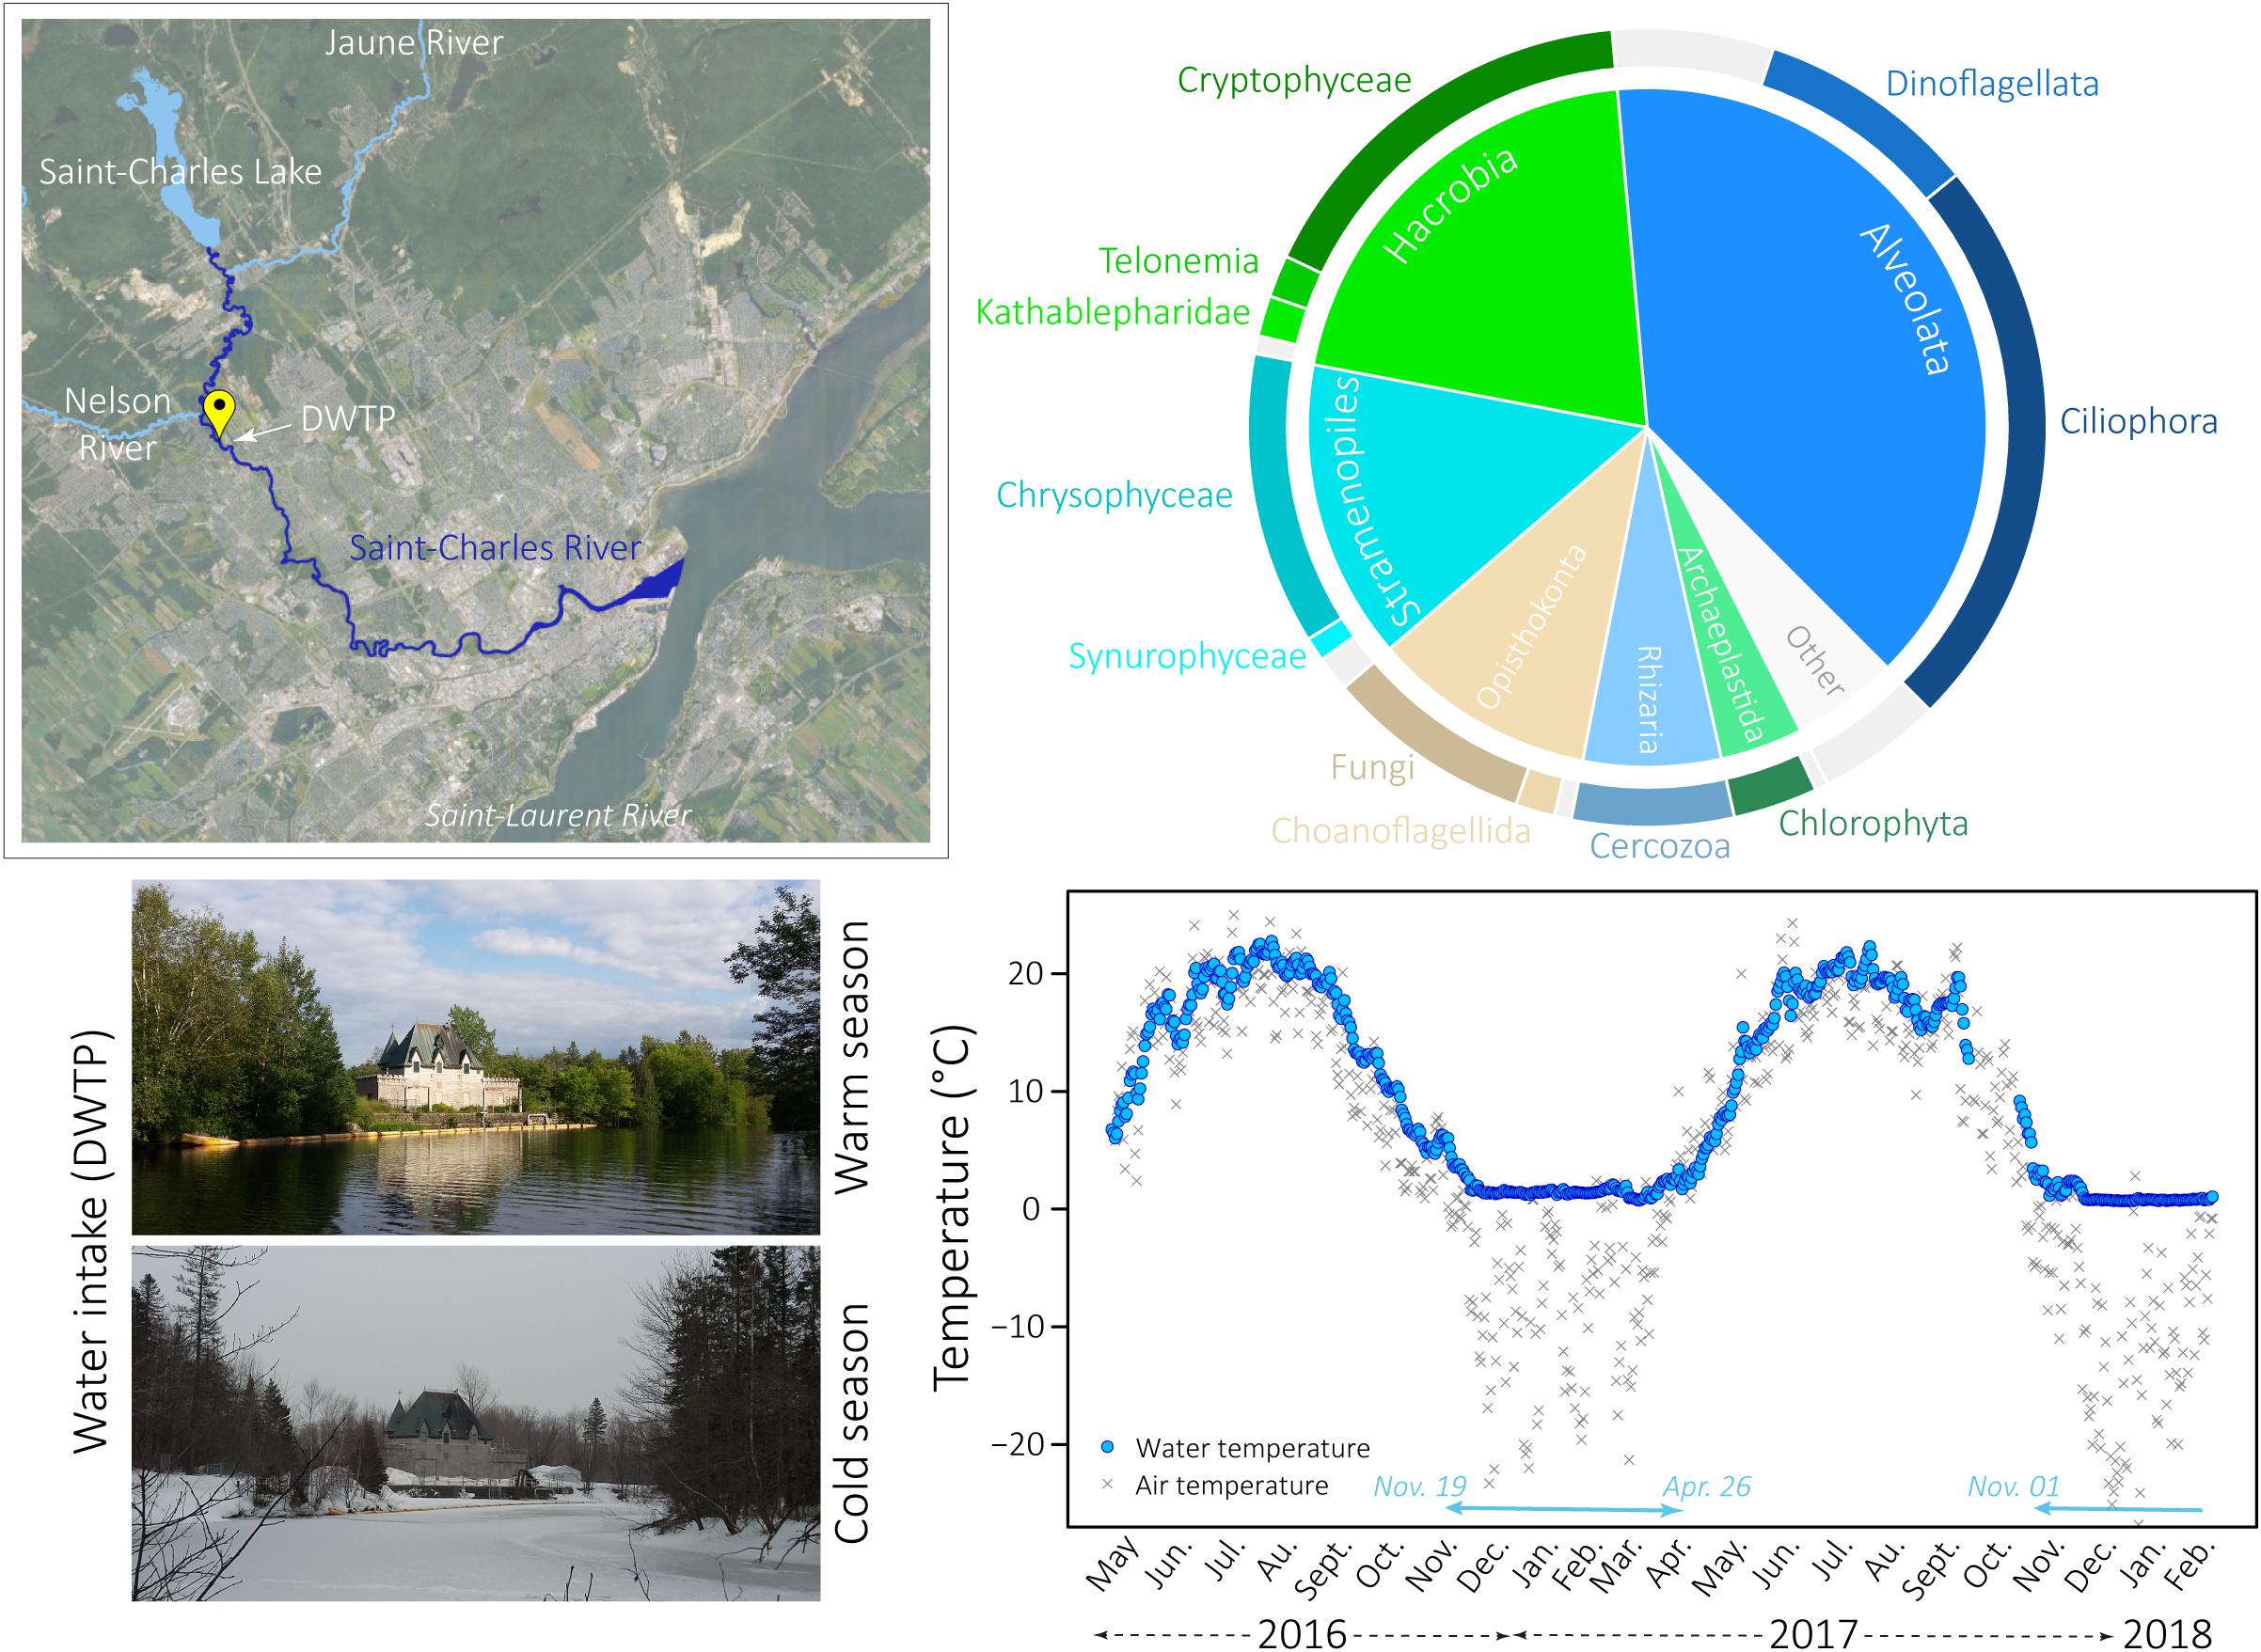
Figure 1. Global eukaryotic microbial community in the Saint-Charles River. Top left: map of the Saint-Charles River showing the principal tributaries (Saint-Charles Lake and Jaune and Nelson Rivers) and the sampling location (DWTP) (QGIS software, v. 2.8.6-Wien, Geoindex + platform with geospatial data from Ville de Quebec held by the Library of the Université Laval). Bottom left: pictures of the Saint-Charles River taken at the sampling location during the warm and the cold season. Bottom right: daily measurements of air and water temperatures at the water intake from May 2016 to February 2018. Turquoise arrows at the bottom of the graph indicate the presence of snow on the ground. Top right: pie charts representing the average proportion of the main microbial eukaryotic communities detected in all samples.
The environmental metadata associated with the samples, including details on the geochemistry and climatic conditions, were previously analyzed in Cruaud et al. (2019), where further information about the measurement procedures can be found. Briefly, during the sampling period (May 2016 – February 2018), the Saint-Charles River experienced large water temperature variations from 0.7°C to 21.7°C (Figure 1 and Supplementary Table S1). Snow was on the ground from 19 November 2016 to 26 April 2017 and for the two sampling dates in January and February 2018 (turquoise arrow on Figure 1 and Supplementary Table S1). The winter period was characterized by an increase in nitrogen and nitrates/nitrites concentrations, reaching 0.88 mg N.L–1 and 0.58 mg N.L–1 on 23 February 2017, respectively (Supplementary Table S1). The sampling period was characterized by some significant rainfall events during spring, summer and autumn. Both snowmelt and rainfall events usually led to an increase in the river flow and to the opening of the floodgates to prevent flooding of the lakefront. These events also led to a decrease in alkalinity and conductivity (Supplementary Table S1).
DNA Extraction, DNA Amplifications and Sequencing
For each sampling date, nucleic acids were extracted from two large pore-size filters and two small pore-size filters coming from two different CubitainersTM using the AllPrep DNA/RNA mini kit (QIAGEN) with modifications, as described in Cruaud et al. (2017b, 2019), for a total of 136 DNA samples. Eukaryotic 18S rRNA genes (rDNA) were amplified and sequenced following a two-step PCR library preparation as detailed in Cruaud et al. (2017a). During the first PCR step, the V4 region of the eukaryotic 18S rDNA was amplified by PCR using primers E572F and E1009R (Comeau et al., 2011). PCR conditions were the same as in Cruaud et al. (2019) with 35 cycles of amplification and a hybridization temperature of 55°C. Illumina MiSeq adaptors and barcodes were subsequently added during the second PCR step, then PCR products were pooled, purified and paired-end sequenced on an Illumina MiSeq sequencer using a V3 MiSeq sequencing kit (2 × 300 bp) at the IBIS sequencing platform (Université Laval, Canada). The raw sequencing data have been submitted to the NCBI database under BioProject accession number PRJNA486319.
Sequencing Analyses
Sequence quality controls were performed on the raw sequence dataset with FastQC v0.11.5 (Andrews, 2012). Paired-end reads were merged using FLASH v2.2.00 (Magoč and Salzberg, 2011) with default parameters and extended maximum overlap length (300). Afterward, CUTADAPT v1.12 (Martin, 2011) was used to remove primers and filter out sequences shorter than 350 bp. Sorted sequences were then dereplicated and clustered into Operational Taxonomic Units (OTUs, 97% similarity), then putative chimeric sequences and singletons were removed using VSEARCH v.2.3.4 (Rognes et al., 2016). Finally, taxonomic assignment of the reads was performed using the Mothur Bayesian classifier (Schloss et al., 2009), on the Protist Ribosomal Reference database (PR2, Version 4.10.0, March 2018,Guillou et al., 2013). Analysis scripts and documentations are available in a GitHub repository1. OTUs affiliated with Bacteria, Archaea or Metazoa were removed and results were normalized so that each sample contained the same number of sequences (5,053 normalized reads per sample corresponding to the lowest number of sequences in one sample for the large-pore size filters). Since eukaryotic communities from duplicate samples strongly clustered together in dendrogram analyses with Unweighted Pair Group Method with Arithmetic mean (UPGMA) (Supplementary Figure S1), an average relative proportion of each OTU was therefore calculated for each sampling date for the subsequent analyses.
Statistical Analyses
All statistical analyses (Bray–Curtis indexes, UPGMA, Non-metric MultiDimensional Scaling (NMDS) analyses, Non-Parametric Multivariate ANalysis Of VAriance (NP-MANOVA) Student t-tests and Pearson’s correlation tables) were conducted using the software environment R (v. 3.4.4) and the RStudio toolkit (v.1.0.143) implemented with Vegan (Oksanen et al., 2007), stringr (Wickham, 2015), dendextend (Galili, 2015), gplots (Warnes et al., 2015), plotrix (Lemon, 2006), and corrplot (Wei et al., 2017) packages.
SIMilarity PERcentage analysis (SIMPER) was performed using the Vegan package on the entire OTU dataset, including sequences obtained from large and small pore-size filters. The 25 OTUs that explained the most of the dissimilarity observed between the eukaryotic community structures of cold and warm season samples were selected for further analyses.
Interplays among these 25 OTUs and between these 25 OTUs and the bacterial OTUs detected in proportions >1% for at least one sampling date in our previous study (Cruaud et al., 2019) were investigated using Pearson’s correlation and local similarity (LS) analyses using the eLSA package (Ruan et al., 2006; Xia et al., 2011, 2016) with default parameters and no delay between sampling dates. While Pearson’s correlation coefficients detect linear relationships between OTUs during the full sampling period, the LS method might capture non-linear associations, such as predator-prey interactions for which successive positive and negative covariance may exist over the course of the time (Ruan et al., 2006; Xia et al., 2011; Carr et al., 2019). Results were represented as networks using the software environment R implemented with the igraph package (Csardi and Nepusz, 2006). For both Pearson’s correlation and LS networks, eukaryotic OTUs were defined as nodes and position of the nodes were determined using a same force-directed layout calculated with the Pearson’s correlations (Fruchterman-Reingold layout algorithm, using the weight parameter defined with Pearson’s correlation coefficient to increase the attraction/repulsion forces among nodes connected by higher coefficients). Connecting links (edges) represented the Pearson or LS scores with a p-value < 0.05. In addition, the bacterial OTUs sharing the highest Pearson and LS scores (p-value < 0.05) with eukaryotic OTUs (top 10 bacterial OTUs from both large and small pore-size filters) were represented around the eukaryotic networks. Correlations between two OTUs can indicate a predictive relationship that can be exploited whether or not these variables are causally related to one another. Thus, the results obtained through these analyses have to be interpreted with caution and were used in this study to search for hypothetical interactions, such as mutualism or competition, that might be experimentally tested in the future (Carr et al., 2019).
Phylogenetic Analyses
Five phylogenetic trees (for Stramenopiles, Cryptomonads, Spirotrichea, Dinophyceae, and Perkinsea) were constructed to assign a finer taxonomic affiliation than obtained with the comparison against PR2 database and to infer potential nutritional capabilities for the 25 OTUs selected by SIMPER analyses (Supplementary Figures S2–S6). Sequences were compared to the GenBank, EMBL, and DDBJ databases, using the NCBI BLAST search program (Altschul et al., 1990). A total of 453 sequences composed of BLAST hits of these OTUs, sequences from PR2 database and reference publications (>1,000 bp in length) (Shalchian-Tabrizi et al., 2008; Bråte et al., 2010b; Thamm et al., 2010; Remias et al., 2013; Fernandes et al., 2016; Piwosz et al., 2016) were downloaded and aligned with MAFFT 7.310 (Katoh and Standley, 2013). Sequences of the 25 selected OTUs were aligned with this reference alignment using the “-addfragments” options in the MAFFT package (Katoh and Frith, 2012). Phylogenetic trees were estimated using maximum likelihood methods performed with RAxML HPC v8 on XSEDE (CIPRES gateway) (Miller et al., 2010; Stamatakis, 2014), using a GTR model with among-site rate variation modeled by a discrete gamma approximation with four categories. GTRCAT approximation of models was used for ML bootstrapping (1,000 replicates). The phylogenetic trees were visualized and annotated according to reference publications and PR2 taxonomic affiliations using the iTOL online tool (Letunic and Bork, 2016). Sequences of these 25 OTUs were deposited in the GenBank nucleotide sequence database under accession numbers MK618733 – MK618757. Based on their phylogenetic proximity with known lineages and considering that proximity in biological evolution could potentially lead to similar trophic mode between organisms, we tentatively classified these OTUs into three potential nutritional strategies: phototrophy, heterotrophy and mixotrophy (Supplementary Figures S2–S6 and Supplementary Table S2), with phototrophy including kleptoplasty, heterotrophy including grazing, predation and parasitism (the latter being distinguished from the heterotrophy in our figures) and mixotrophy gathering both phototrophy and heterotrophy in a same lineage. Since prediction of trophic modes based on 18S rRNA data can be challenging, only large categories of putative trophic modes were considered in this study.
Results
Overall Protist Diversity and Community Composition
The protist diversity was characterized based on 18S rDNA amplicon sequencing from duplicate water samples collected on large (3 μm) and small (0.22 μm) pore-size filters over 2 years from the Saint-Charles River (Figure 1). We obtained a total of 611,413 quality-filtered reads (5,053 reads per sample) that grouped within 10,500 OTUs (97% similarity), with an average of 1,217 OTUs per sampling date. Most OTUs (98.2% of the OTUs) occurred at low abundance (<1% of the reads in all samples), however, predominant OTUs (>1% of the reads in at least one sample) represented the majority of sequences (73.8% of total sequences). Only 48 OTUs (0.5% of the OTUs) were highly abundant (>5% of the reads in at least one sample) representing on average 48.9% of the reads per sample.
Bray–Curtis dissimilarity indices (Bray and Curtis, 1957, ranging from 0: the two samples have the same microbial composition, to 1: the two samples do not share any OTU) were calculated between all pairs of samples. Based on these indices, UPGMA and NMDS analyses revealed a clear seasonal pattern (Figure 2 and Supplementary Figures S7, S8). A significant difference of the eukaryotic community structure was detected between the cold and the WS (Figure 2 and Supplementary Figure S8) (NP-MANOVA, p-value < 0.001) with 45.8 and 48.1% of the predominant OTUs that significantly differing between the two seasons, for the large and the small pore-size filters, respectively (t-test, p-value < 0.05). Only the samples collected on 08 November showed a divergent clustering between the large and the small pore-size filters (with the cold season (CS) for the large and with the WS for the small pore-size filters, Supplementary Figure S7). Thus, the samples collected from 24 May 2016 to 24 October 2016 and from 17 May 2017 to 15 June 2017 were thereafter referred as WS samples (water temperature > 8°C, Supplementary Table S1), whereas the samples collected from 21 November 2016 to 04 May 2017 and the two sampling dates from January and February 2018 were associated to CS samples (Supplementary Figure S7, water temperature < 8°C). Bray–Curtis indices ranged from 0.98 between winter (31/01/2018) and summer (12/07/2016) samples to 0.33 between two summer samples (09/008/2016 and 16/08/2016) with an average of 0.75 over the year.
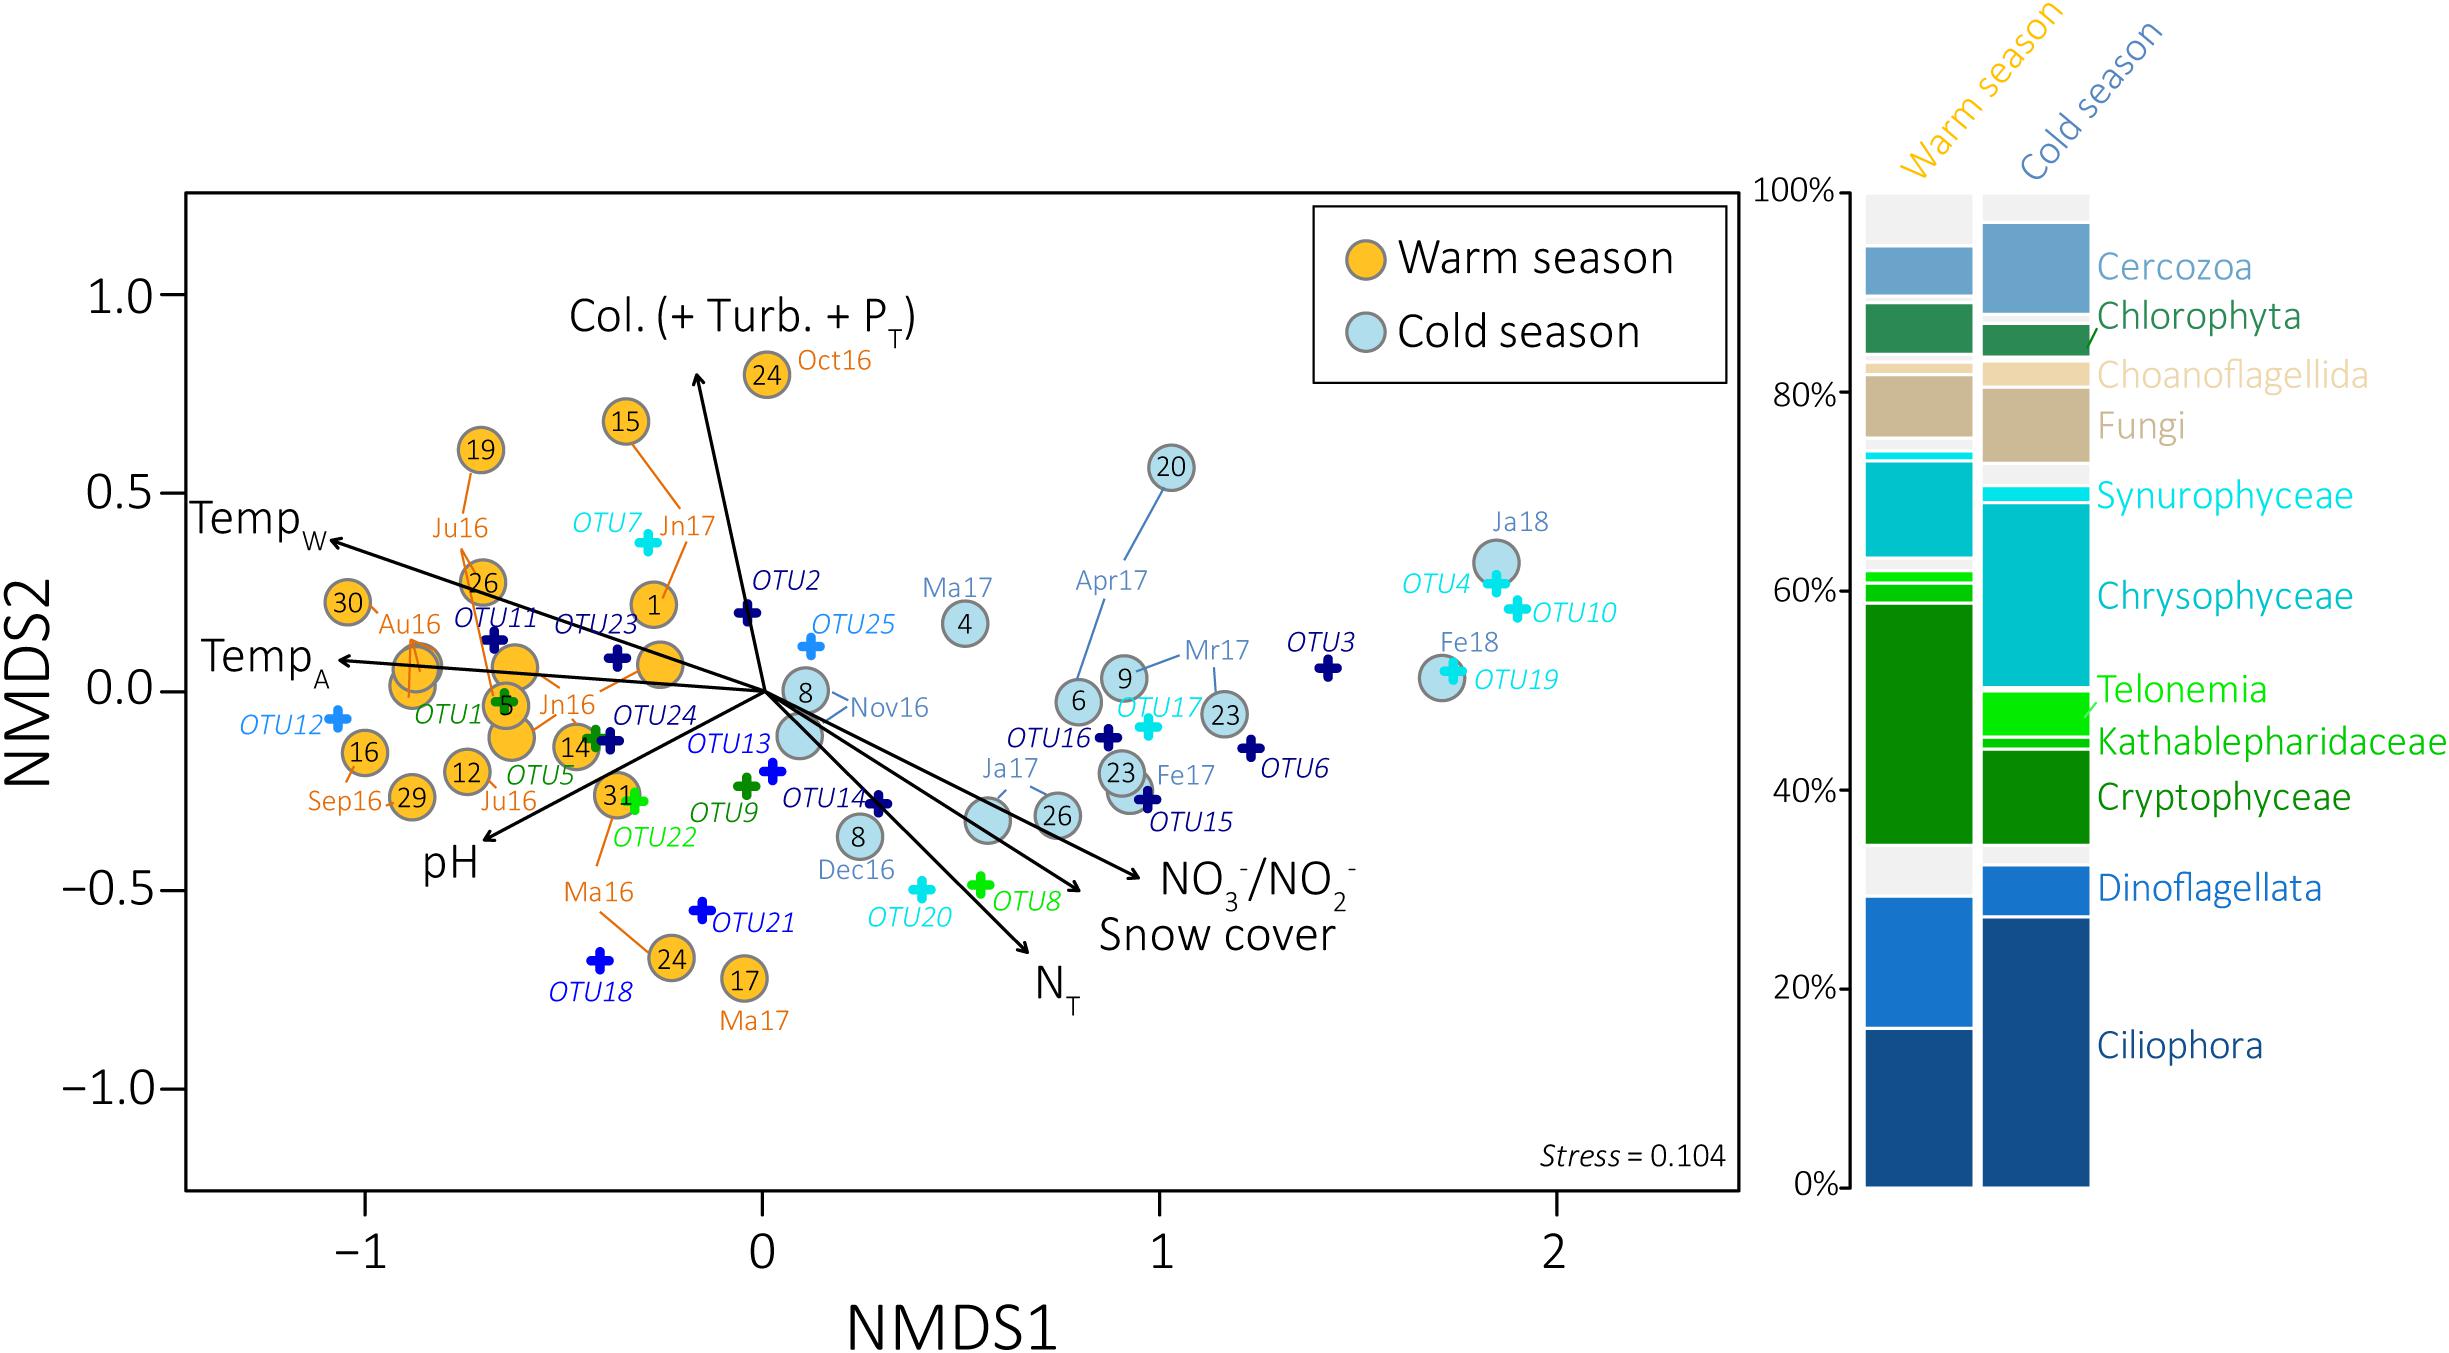
Figure 2. Non-metric multidimensional scaling ordination plot derived from the Bray–Curtis dissimilarity measure between samples collected on the large pore-size filters. Seasons as defined in UPGMA dendrograms are indicated in yellow and blue for the warm and the cold season, respectively. Sampling dates are indicated in black. Fitted vectors (black arrows) were added to the ordinations for the most significant variables (envfit, p-value < 0.001). The length of the arrow is proportional to the correlation between ordination and environmental variable. The 25 eukaryotic OTUs selected by SIMPER analyses were also added to the ordination (cross). The stacked barplot on the right represents the average distribution of the main microbial eukaryotic communities detected in the samples collected during the warm (left) and the cold (rigth) season as defined by UPGMA dendrograms, for the large pore-size filters. PT, Total phosphorus; Turb, Turbidity; Col, Apparent color; TempW, Water temperature; TempA, Air temperature; NT, Total nitrogen, Mr, March; Ma, May; Jn, Juni; Jl, July.
Ordination analyses of the eukaryotic community composition with environmental vector fitting suggest that water temperature and covarying factors, including air temperature, snow cover and nitrogen concentrations, as well as pH, apparent color, turbidity and phosphorus concentrations were among the main drivers of the community structure detected throughout the year (envfit, goodness of fit statistic r2 = 0.86 for water temperature, 0.67 for air temperature, 0.61 for snow cover, 0.47 for nitrogen concentrations, 0.44 for pH, 0.42 for apparent color, 0.39 for phosphorus concentrations and 0.38 for turbidity, p-value < 0.001, Figure 2, Supplementary Figure S8, and Supplementary Table S1).
Overall, Alveolates (mainly Ciliophora, Dinoflagellata, and Perkinsea), Hacrobia (mainly Cryptophyceae, Telonemia and Katablepharidophyta), Stramenopiles (mainly Chrysophyceae and Synurophyceae), Opisthokonta (mainly Fungi), Rhizaria (mainly Cercozoa), and Archaeplastida (mainly Chlorophyta) were the most predominant groups detected in our samples, both on the large and the small pore-size filters (Figure 1). Higher proportions of Ciliophora and Telonemia were detected during the CS (Figure 2 and Supplementary Figure S11) (t-test, p-value < 0.005, 27.2% in CS vs. 16.0% in WS and 4.6% in CS vs. 1.2% in WS, respectively, for the large pore-size filters, and 44.4% in CS vs. 20.9% in WS and 7.5% in CS vs. 3.8% in WS, respectively, for the small pore-size filters). Chrysophyceae were also detected in higher proportions during the CS but the difference was not statistically significant (Figure 2, 18.6% vs. 9.8% for the large pore-size filters and 14.2% vs. 7.5% for the small pore-size filters). In contrast, Cryptophyta and Dinoflagellata were detected in higher proportions during the WS (Figure 2 and Supplementary Figure S1, t-test, p-value < 0.005, 24.3% vs. 9.7% and 13.3% vs. 5.2%, respectively, for the large pore-size filters and 24.3% vs. 9.7% and 9.6% vs. 2.1%, respectively, for the small pore-size filters).
Large Versus Small Pore-Size Filters
Results obtained from the large and the small pore-size filters were quite similar (Figures 2, 3, Supplementary Figures S7–S10, and Supplementary Table S2). Many published works considered eukaryotic cells smaller than 3 μm as important component of the eukaryotic community (e.g., Medlin et al., 2006; Newbold et al., 2012; Marquardt et al., 2016). However, a large number of sequences affiliated with organisms that are well known to be bigger than the pore-size of the large pore-size filters (e.g., ciliates and dinoflagellates) was detected on the small pore-size filters (0.2–3 μm). This observation could result from potential methodological bias maybe associated with filtration failures, although different bacterial communities were observed between small and large pore-size filters (Cruaud et al., 2019). It could also result from cell plasticity and disruption. Furthermore, low PCR amplifications and insufficient sequence numbers, leading to the removal of four samples from our datasets, were observed for the small pore-size filters. For these reasons, results from the two size fractions were not averaged or pooled to avoid assignment of the same weight for the large and the small pore-size filters in our dataset. Consequently, results for the small pore-size filters are presented as Supplementary Files (Supplementary Figures S1, S7–S10), while results for the large pore-size filters are presented in the main text.
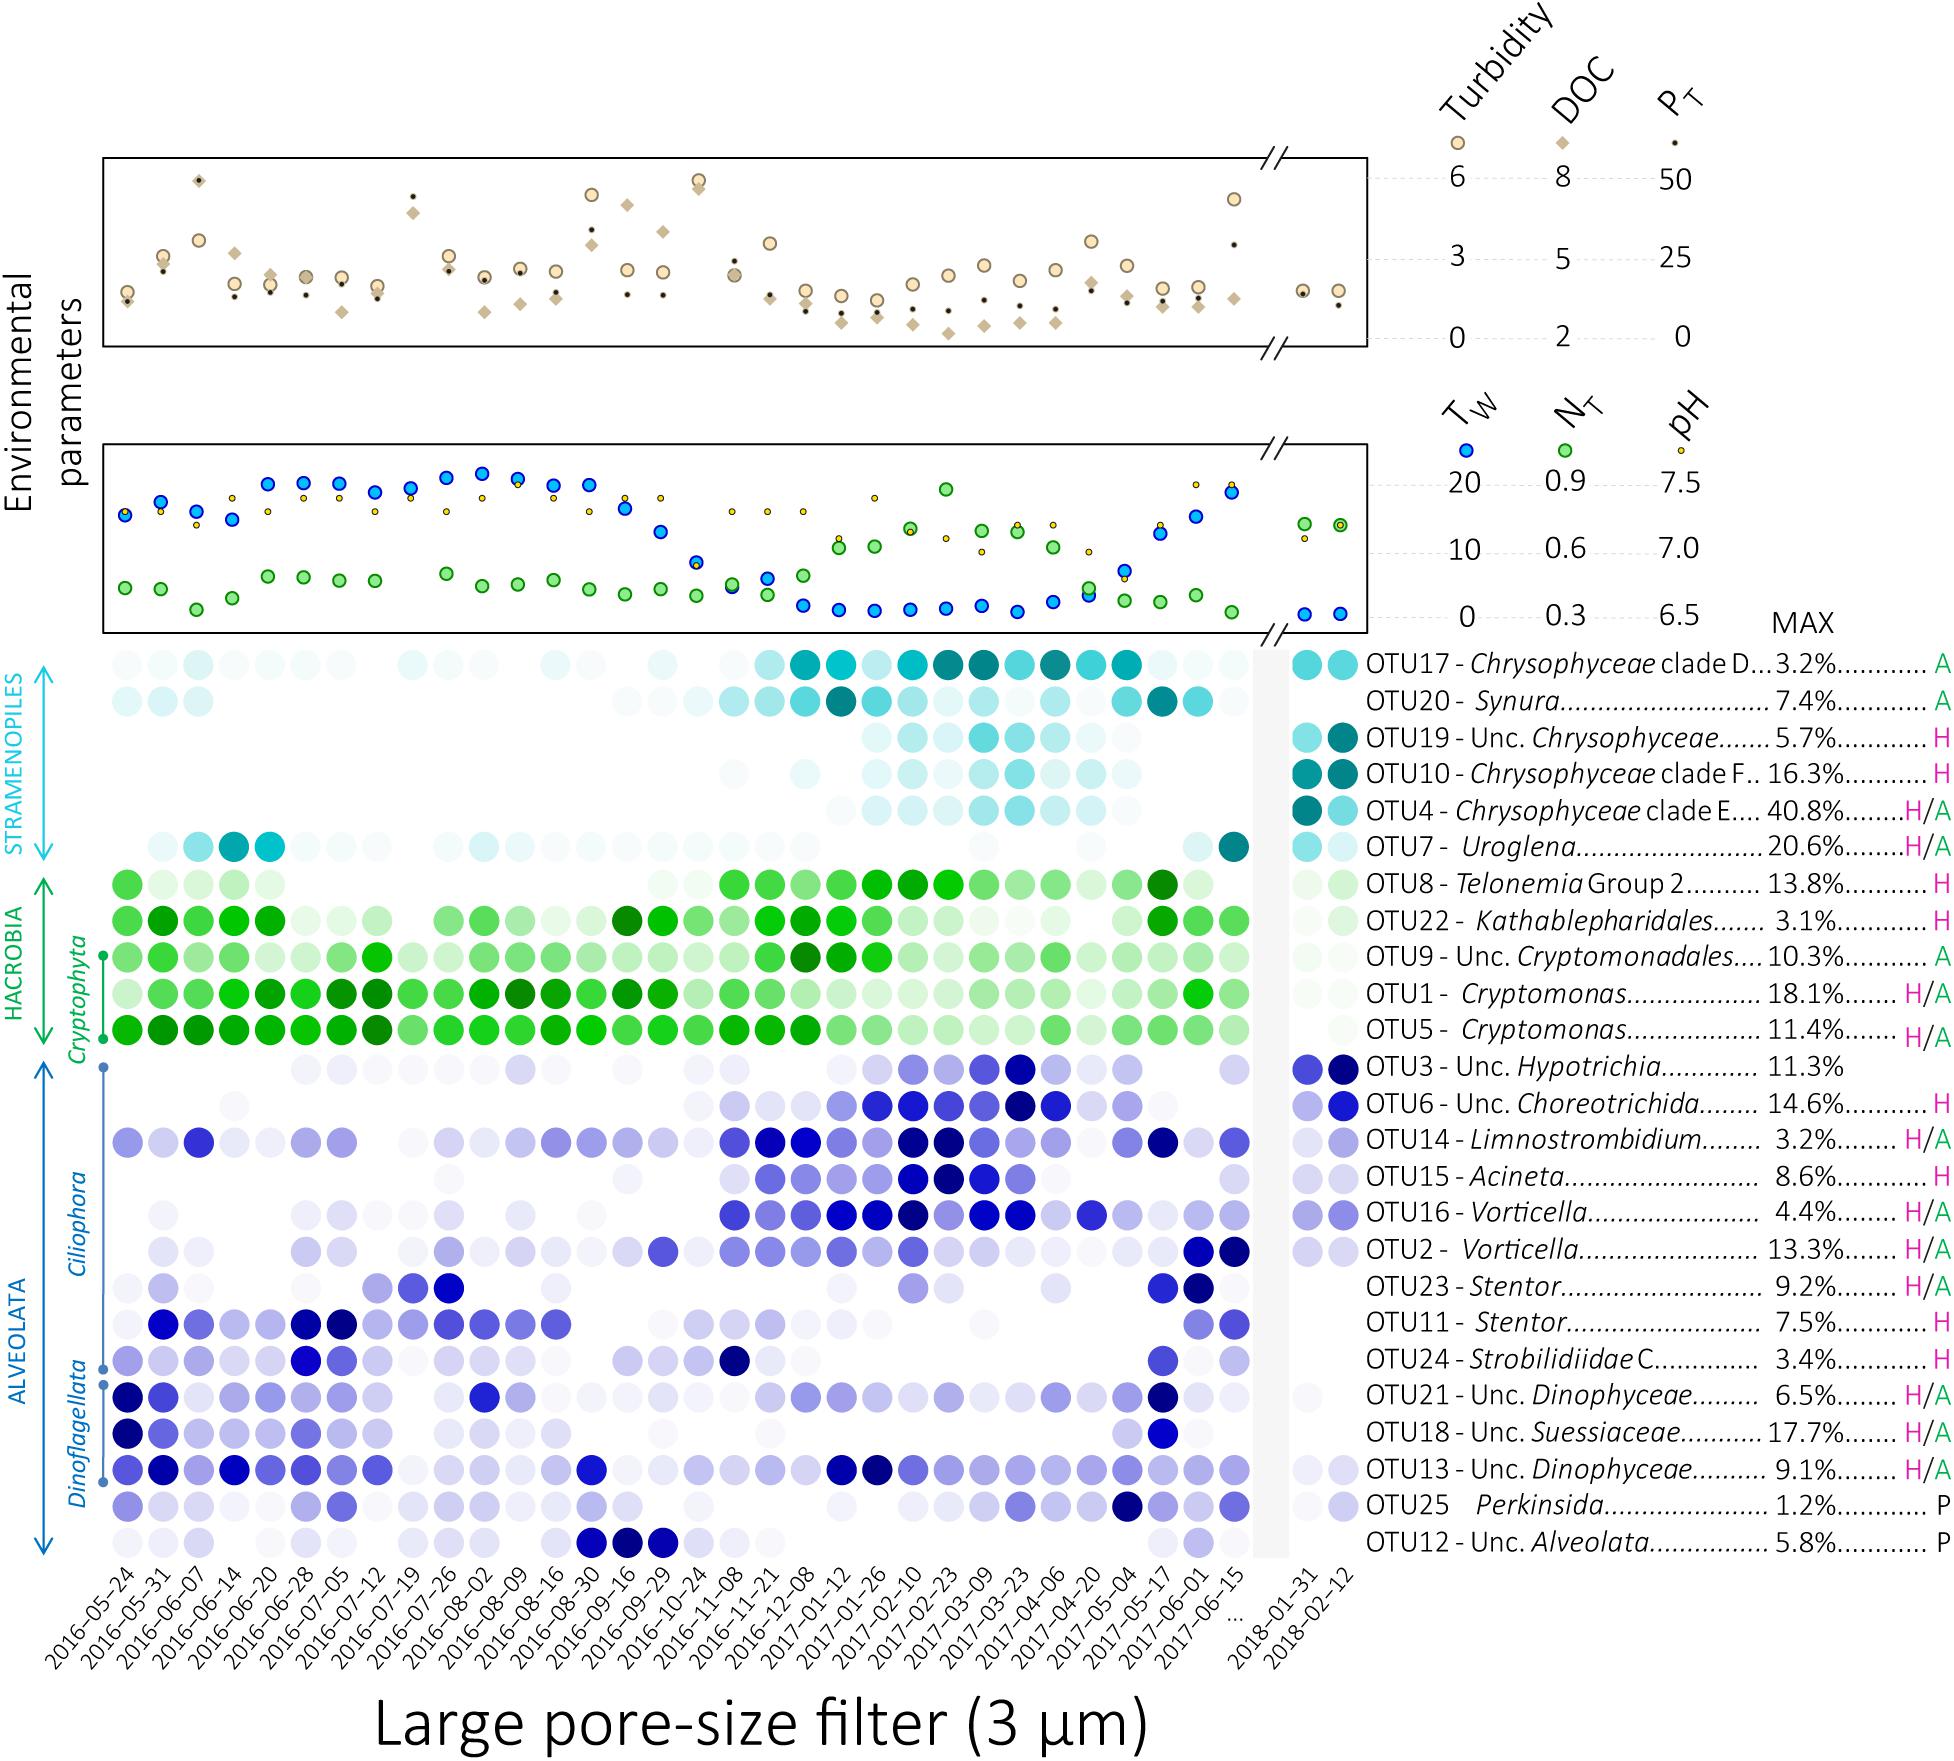
Figure 3. Heatmap display of the relative proportions of the 25 OTUs selected by SIMPER analyses for the large pore-size filters. The color intensity represents the relative proportion of each OTU where dark colors represent high relative proportions and light colors represent low relative proportions. The darkest colors for the highest relative proportions were defined separately for each OTU. Letters to the right of OTU names represent potential nutritional capabilities for each OTU: green “A” for potential phototrophy, purple “H” for potential heterotrophy, “H/A” for potential mixotrophy and black “P” for potential parasitism. Variations of the environmental and physico-chemical parameters highlighted using envfit analyses for NMDS ordination are represented at the top of the heatmap. Unc, Unclassified; PT, Total phosphorus, TW, Water temperature; NT, Total nitrogen.
Affiliations and Phylogenetic Placements of 25 Specific Protist OTUs
Based on SIMPER analyses, we identified 25 OTUs that explain most of the dissimilarity between seasons (39.4% of total number of sequences, cumulative contribution to the dissimilarity 38.6%). These OTUs, affiliated to Stramenopiles, Hacrobia, and Alveolata, were studied in detail (Figures 3, 4, Supplementary Figure S9, and Supplementary Table S2). Phylogenetic trees (Supplementary Figures S2–S6) were used to (i) confirm taxonomic affiliations obtained with the PR2 database, (ii) identify phylogenetically close sequences and their isolation source, and (iii) to infer potential nutritional strategies depending on their phylogenetic placements.
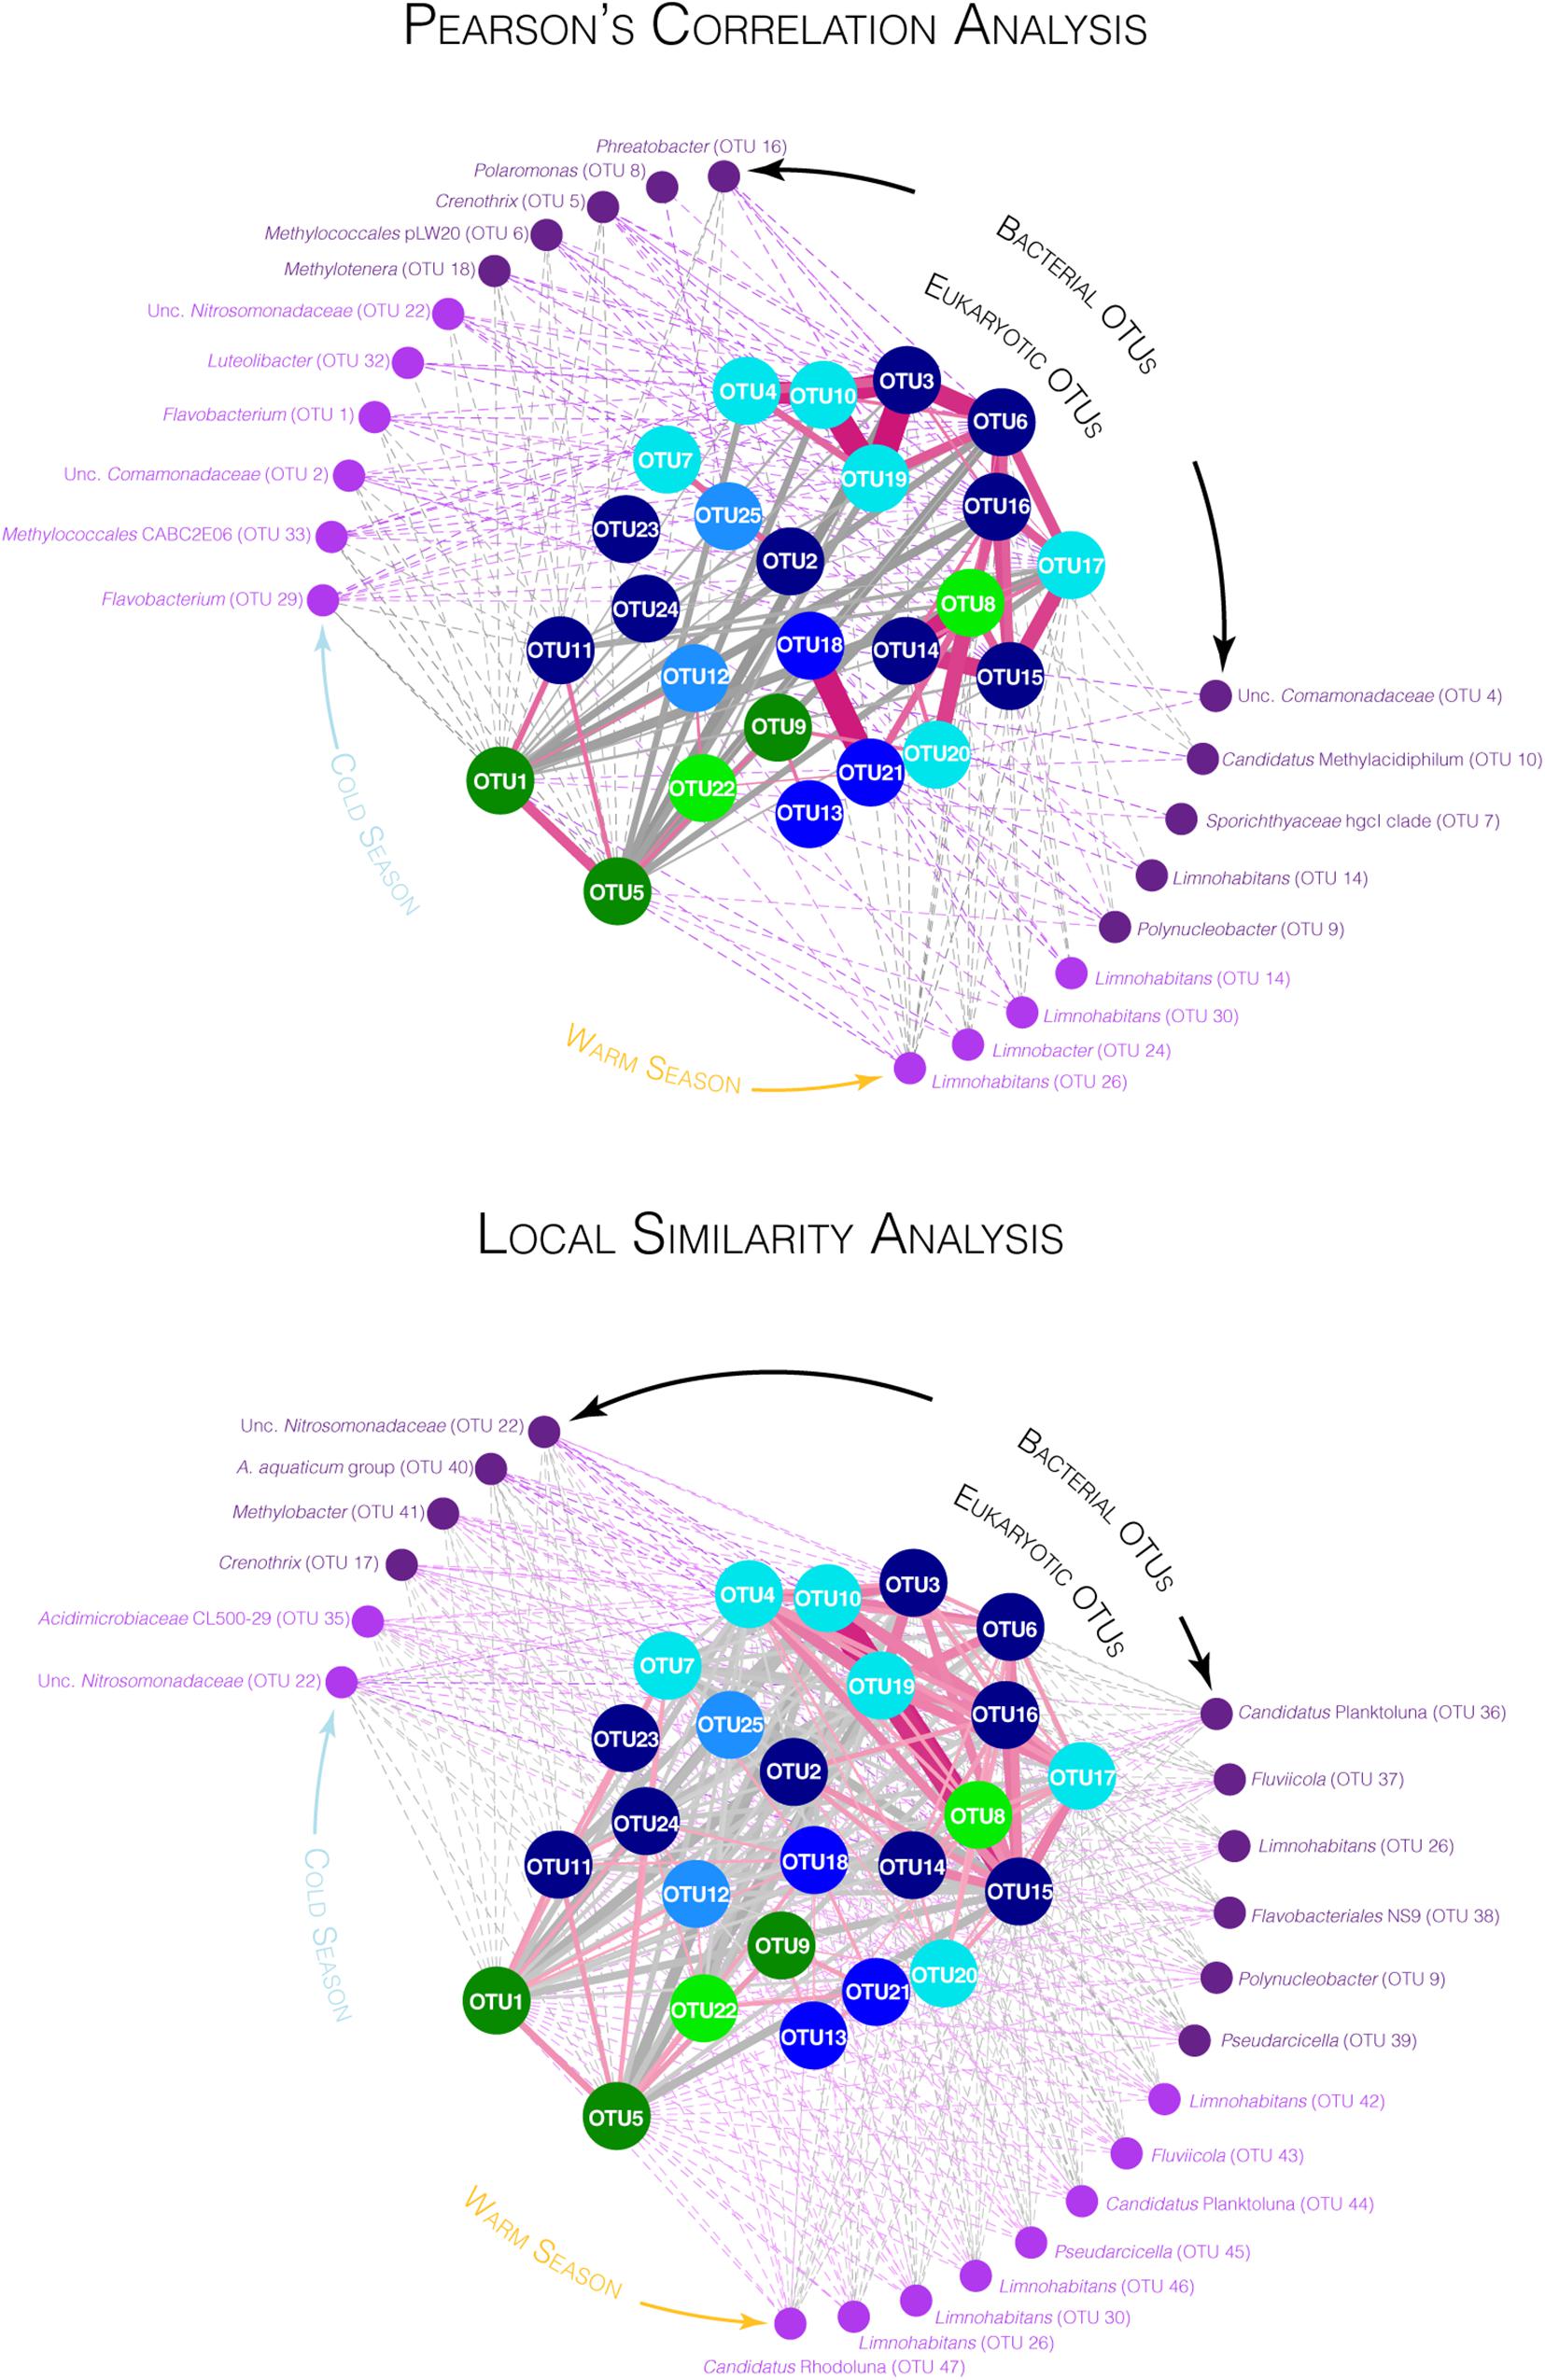
Figure 4. Co-varying networks for the 25 OTUs selected by SIMPER analyses for the large pore size filters with bacterial OTUs detected on both large and small fractions. Networks were constructed based on the significant Pearson’s correlation coefficients (PCC, top) and on the significant local similarity (LS) scores (bottom) between eukaryotic OTUs and between eukaryotic and bacterial OTUs (p-value < 0.05). Large nodes in the center of the networks represent eukaryotic OTUs (circle) with the same color code as in Figure 3. Small nodes at the periphery of the networks represent the top 10 bacterial OTUs detected on the large pore-size filters (dark purple) and the top 10 bacterial OTUs detected on the small pore-size filters (light purple) that shared the highest PCC (network on the top) or the highest LS scores (network on the bottom) with the 25 eukaryotic OTUs. Solid links (edges) represent correlation between eukaryotic OTUs and dashed links represent correlation between bacterial and eukaryotic OTUs. Pink links and gray links represent positive and negative correlations, respectively (darker and larger edges represent higher PCC or LS scores, detailed in Supplementary Table S3).
Six OTUs affiliated with Stramenopiles were selected (Supplementary Figure S2 and Supplementary Table S2). The OTUs 4, 7, 10, 17, and 19 were affiliated with Chrysophyceae. The OTU4 was close to the mixotrophic Ochromonas tuberculata (Bird and Kalff, 1986; Charvet et al., 2012; Stoecker and Lavrentyev, 2018) and the OTU7 was affiliated with the mixotroph Uroglena americana (Kimura and Ishida, 1985; Sandgren et al., 1995; Urabe et al., 1999) and formed a highly supported group with other sequences affiliated with Uroglena within the clade C of Chrysophyceae. The OTU10 was close to the colorless chrysomonads Paraphysomonas genus group (Caron et al., 1999; Scoble and Cavalier-Smith, 2014) and the OTU17 clustered with the Hydrurus-related algae (Klaveness and Lindstrøm, 2011; Remias et al., 2013) and other environmental clones isolated from high-mountain and arctic lakes in the Hydrurus-clade. Finally, the OTU19 formed a highly supported phylogenetic group with colorless Spumella-like flagellate JBC27 (Boenigk et al., 2005). Belonging to the Synurophyceae, the OTU20, affiliated with Synura petersenii, clustered with the highly supported group of the strict phototrophic Synura (Olefeld et al., 2018) (Supplementary Figure S2 and Supplementary Table S2).
Five OTUs affiliated with Hacrobia were selected by SIMPER analyses (Supplementary Figure S3 and Supplementary Table S2). Three OTUs were affiliated with Cryptophyceae (OTUs 1, 5, and 9), whereas one OTU was affiliated with Telonemia (OTU8) and another OTU with Kathablepharidales (OTU22). Two cryptophyte OTUs formed a highly supported group with the mixotrophic Cryptomonas (OTUs 1 and 5) (Tranvik et al., 1989; Choi et al., 2013). The third cryptophyte OTU, affiliated with unclassified Cryptomonadales, formed a highly supported phylogenetic group with potential phototrophic CRY2 lineage within the Cryptophyceae (OTU9) (Laza-Martínez et al., 2012). The OTU8 was affiliated with the heterotrophic predator lineage Telonemia (Klaveness et al., 2005; Bråte et al., 2010a) and the kathablepharid OTU22 formed a highly supported phylogenetic group with other uncultured freshwater eukaryotes within the kathablepharids, a group of predatory, heterotrophic biflagellates (Arndt et al., 2000) (Supplementary Figure S3 and Supplementary Table S2).
Fourteen OTUs affiliated with Alveolata were selected (Supplementary Figures S4–S6 and Supplementary Table S2). Nine OTUs were affiliated with Ciliophora (OTUs 2, 3, 6, 11, 14, 15, 16, 23, and 24), three were affiliated with Dinoflagellata (OTUs 13, 18, and 21), one was affiliated with Perkinsida (OTU25) and one OTU remained unclassified within the Alveolata (OTU12) according to the PR2 database. Among the Ciliophora, four OTUs were affiliated with Spirotrichea (OTUs 3, 6, 14, and 24). The OTU3 was affiliated with unclassified Hypotrichia and the OTU6 was affiliated with unclassified Choreotrichida [clustering with the highly supported group C of potential heterotrophs Strobilidiidae (Stoecker and Michaels, 1991)]. The OTU14, affiliated with Limnostrombidium within the Strombidiida lineage, might be able to switch from heterotrophy to phototrophy using ingested chloroplast (kleptoplasty (Stoecker and Silver, 1990; Dolan, 1992; Schoener and McManus, 2012). The last Spirotrichea OTU, the OTU24, grouped within the Strobilidiidae clade C composed of potentially heterotrophic lineages (Stoecker and Michaels, 1991) (Supplementary Figure S4 and Supplementary Table S2). Two ciliates OTUs were affiliated with Stentor: the OTUs 11 and 23, close to Stentor muelleri and Stentor cf. katashimai, which are known to contain no symbiotic green algae (Gong et al., 2007; Thamm et al., 2010) (Supplementary Table S2). Two other ciliates OTUs, the OTU2, and the OTU16, were affiliated with potentially mixotrophic Vorticella (feeding on bacteria but usually containing Chlorella) (Dolan, 1992; Jacquet et al., 2005) (Supplementary Table S2). The last ciliate OTU, the OTU15, was affiliated with the potential heterotrophic Acineta (Dovgal and Pesic, 2007; Gazulha and Utz, 2016) (Supplementary Table S2). Among the OTUs affiliated with Dinoflagellata, the OTU18 was affiliated with unclassified Suessiaceae close to Biecheleriopsis adriatica while the OTU13 and the OTU21 were phylogenetically closed and affiliated with unclassified Dinophyceae. These OTUs were potential mixotrophic dinoflagellates (Hansen et al., 2007; Moestrup et al., 2009) (Supplementary Figure S5 and Supplementary Table S2). The OTU25 was affiliated with Perkinsida within the PERK 12-17 clade among the parasitic lineage Perkinsea (Lepère et al., 2008; Bråte et al., 2010b; Chambouvet et al., 2014) (Supplementary Figure S6 and Supplementary Table S2). Finally, the unclassified Alveolata OTU12 (based on PR2 database affiliation) shared 97% sequence similarity with sequences amplified from the oligo-mesotrophic Lake Pavin and identified as perkinsid based on Chambouvet et al. (2014). This OTU was thus included in the phylogenetic tree of perkinsid that confirmed its place close to the perkinsid OTU25 within the PERK12-17 clade (Supplementary Figure S6 and Supplementary Table S2).
Temporal Variation of the 25 Selected Protist OTUs and Correlations With Biotic and Abiotic Factors
Temporal variations of the relative proportions of the 25 protist OTUs were analyzed in detail (Figure 3 and Supplementary Figure S9). In addition, highest covariations between the relative proportions of these 25 OTUs based on Pearson’s correlation and LS analyses were explored using networks (Figure 4, Supplementary Figure S12, and Supplementary Table S3). Correlations between relative proportions of eukaryotic and bacterial OTUs [details in Cruaud et al. (2019)] were also investigated and the highest correlations were represented on the same networks (Figure 4, Supplementary Figure S13, and Supplementary Table S3). Finally, correlations have been also searched between the 25 eukaryotic OTUs and environmental parameters (Supplementary Figure S14).
The eukaryotic OTUs were distributed in the networks according to a force-directed layout, clustering together the most covariable OTUs (Figure 4). The OTUs 3, 4, 6, 8, 10, 14, 15, 16, 17, 19, and 20 were mainly detected during the CS while the other OTUs were detected throughout the year or mainly during the WS. Both the Pearson and the LS analyses showed higher covariation patterns between OTUs detected during the CS than between other OTUs. A larger number of significant correlations were detected with the LS analyses than with the Pearson’s analyses (Figure 4) but some correlations detected with the Pearson analyses were also not identified with the LS analyses (Figure 4).
The Chrysophyceae OTU17 as well as the three Ciliophora OTUs 6, 15, and 16 were detected throughout the CS and showed similar pattern of variation (Figures 2–4, Supplementary Figure S9, and Supplementary Table S3). Covariations were detected between these eukaryotic OTUs and numerous bacterial OTUs detected during the CS such as Crenothrix, Methylotenera, unclassified Comamonadaceae, unclassified Nitrosomonadaceae, Candidatus Nitrotoga and Methylococcales pLW20 (Figure 4, Supplementary Figure S13, and Supplementary Table S3). These eukaryotic OTUs were positively correlated with environmental variables increasing during the winter season such as the snow cover and the nitrogen concentrations and were negatively correlated with environmental variables decreasing during the CS such as the air and the water temperatures (Figure 2 and Supplementary Figure S14). Also mainly detected during the CS, relative proportions of the Hypotrichia OTU3 and the three Chrysophyceae OTUs 4, 10, and 19 showed similar variations reaching maximal proportions in March in winter 2017 and larger proportions during winter 2018 (up to 40.8% of the reads for the OTU4, Figures 2–4, Supplementary Figures S9, S13, and Supplementary Table S3). Covariations were detected with bacterial OTUs detected during the CS such as Crenothrix, Methylococcales CABC2E06, Flavobacterium or Luteolibacter (Figure 4, Supplementary Figure S13, and Supplementary Table S3). Although coefficients were lower, the eukaryotic OTUs 3, 4, 10, and 19 were also correlated with environmental variables that characterize the CS (Figure 2 and Supplementary Figure S14). The Telonemia OTU8, the Ciliophora OTU14 and the Synura OTU20 also showed the highest proportions during the CS (Figures 2, 3 and Supplementary Figure S9). However, these OTUs showed a slightly different pattern, reaching maximal proportions at the beginning of the CS as well as at the first date of the WS (17 May 2017, Figures 3, 4 and Supplementary Figures S9, S12), sharing lower correlations with the bacterial OTUs detected during the CS (Figure 4, Supplementary Figure S13, and Supplementary Table S3). These three OTUs were slightly correlated with the environmental variables associated with the CS such as the decrease in temperatures and the increase in snow cover and nitrogen concentrations (Figure 2 and Supplementary Figure S14). These three patterns (throughout the CS, higher proportions detected during the winter 2018 and beginning of the CS as well as the first date of the WS) were clearer on network build using Pearson’s correlation analyses than using LS analyses where all eukaryotic OTUs detected during the CS were connected (Figure 4).
By contrast, covariations between the eukaryotic OTUs mainly detected during the WS were less obvious, each of them showing relatively different temporal patterns. Furthermore, only few correlations were detected with the environmental variables measured in this study (Supplementary Figure S14). Some of these eukaryotic OTUs (OTUs 1, 5, 11, 12, 18, and 21) were correlated with different bacterial OTUs mainly detected during the WS, such as Sporichthyaceae hgcI clade and Limnohabitans (Figure 4, Supplementary Figure S13, and Supplementary Table S3) The OTUs affiliated with Cryptophyceae and Katablepharidales (OTUs 1, 5, 9, and 22) were detected throughout the year but their relative proportions remained relatively low from February to May (Figures 2–4 and Supplementary Figure S9). The Cryptomonas OTUs 1 and 5 were highly correlated with environmental parameters associated with the WS such as the increase in temperature and the decrease in snow cover (Figure 2 and Supplementary Figure S14). The Uroglena OTU7 was the only OTU affiliated with Stramenopiles showing the highest relative proportions during the WS (Figures 2, 3 and Supplementary Figure S9) but was also detected in significant proportions on 31 January 2018 (up to 12.35% for the small pore-size filters, Figure 3 and Supplementary Figure S9). The distribution of the dinoflagellates OTUs 18 and 21 reached maximal relative proportions at the end of May (Figure 3 and Supplementary Figure S9). These OTUs were highly correlated according to Pearson’s correlation analyses, showing a global covariation along the entire time of our sampling period, while only a little correlation was found with the LS analyses, revealing different local dynamics (Figure 4 and Supplementary Table S3), that preclude real relationship between these OTUs. In addition with the bacterial OTUs noted above, these two OTUs were correlated with a bacterial OTU affiliated with Polynucleobacter (Figure 4, Supplementary Figure S13, and Supplementary Table S3). The third dinoflagellate OTU (OTU13) fluctuated throughout the year (Figure 3 and Supplementary Figure S9). The Ciliophora OTUs 2, 11, 23, and 24 showed higher relative proportions during the WS. Among them, the Stentor OTUs 11 and 23 reached maximal relative proportions at the beginning of the WS (May and June, Figure 3 and Supplementary Figure S9) and the OTU11 was correlated with the increase in air and water temperatures (Supplementary Figure S14). The OTU24 reached maximal relative proportions on 28 June 2016 and high relative proportions on 08 November 2016 as well (Figure 3 and Supplementary Figure S9). The Perkinsida OTU25 was detected intermittently throughout the year and mainly on the small pore-size filters with highest proportions on May 2017 (up to 12.6% on these filters, Figure 3, Supplementary Figure S9, and Supplementary Table S2). This OTU was highly correlated with a bacterial OTU affiliated with Polaromonas (Figure 4, Supplementary Figure S13, and Supplementary Table S3). This OTU was also correlated with the increase in river flow, the opening of the dam floodgates and the amount of rainfall 3 days before sampling (Supplementary Figure S14). Finally, the OTU12 was mainly detected on 3 sampling dates, in late summer 2016 (up to 19.8% for the small pore-size filters on 29 September, Figure 3, Supplementary Figure S9, and Supplementary Table S2) and was highly correlated with two bacterial OTUs mainly detected during the WS and affiliated with Sporichthyaceae hgcI clade and Candidatus Methylacidiphilum (Figure 4, Supplementary Figure S13, and Supplementary Table S3) and with the increase of the dissolved organic carbon concentration in the water (Supplementary Figure S14).
Discussion
Marked Seasonality of Overall Composition of Protist Communities
Using 18S rDNA sequencing, a high diversity of small eukaryotes was observed in the Saint-Charles River with members of all eukaryotic superphyla (Figure 1) and numerous rare OTUs. The eukaryotic microbial communities were dominated by Alveolata, Hacrobia, and Stramenopiles while Opisthokonta, Rhizaria, and Chlorophyta were detected in smaller proportions (Figure 1). If this result is consistent with many reports from freshwater ecosystems (Lefranc et al., 2005; Richards et al., 2005; Šlapeta et al., 2005; Triadó-Margarit and Casamayor, 2012; Taib et al., 2013; Simon et al., 2015), the large variation in 18S rRNA gene copy numbers among eukaryotic species and between growth phases [1 to highest estimates around 37,000 copies per cell in diatoms and 310,000 copies in ciliates (Prokopowich et al., 2003; Godhe et al., 2008; Gong et al., 2013)] might have led to overestimation of the relative abundance of some lineages compared to others, as previously mentioned (e.g., Mangot et al., 2009; Gong et al., 2013; Ren et al., 2018). We thus avoided as far as possible to compare relative proportions between the different lineages and focused on the dynamics of eukaryotic OTUs over months and seasons.
Eukaryotic communities showed a clear seasonal pattern with different communities between winter and summer (Figure 2 and Supplementary Figures S7, S8), as a probable consequence of the contrasted environmental conditions. This pattern was repeated during the 2nd year of sampling, suggesting an annual eukaryotic community cycle, which is consistent with previous investigations on lakes (Nolte et al., 2010; Bock et al., 2014), ponds and brooks (Simon et al., 2015). This seasonal pattern was correlated with summer and winter-associated contrasting parameters such as air and water temperatures, snow cover and nitrogen concentrations and has also been observed for the bacterial communities of the Saint-Charles River (Cruaud et al., 2019). This suggests that both bacterial and eukaryotic communities undergo deep modifications of their community composition, reflecting the dramatically different seasonal and environmental conditions of the region (Figure 2 and Supplementary Table S1) and confirming the structuring role of environmental selection in this ecosystem.
Ciliophora, Chrysophyceae, and Telonemia were detected in higher proportions during the CS, whereas Cryptophyta and Dinoflagellata were detected in higher proportions during the WS (Figure 2 and Supplementary Figure S11). Although DNA might not directly indicate activity or viability of the cells and the fact that 18S rDNA relative proportions could not be considered as abundances due to different copy numbers and primer efficiency, the successive increases and decreases in relative proportions of specific eukaryotic lineages during the CS (Supplementary Figure S10) suggest that, despite the ice-cover and the very low water temperature during this season (Figure 1 and Supplementary Table S1), at least a part of the eukaryotic microbial community could potentially be active and growing in the river and/or in the lake feeding the river. Furthermore, phylogenetic trees indicated that some 18S rRNA genes sequenced from winter samples clustered with sequences recovered from cold environments (ice, moutain lakes) (Klaveness and Lindstrøm, 2011; Charvet et al., 2012; Remias et al., 2013), supporting the viability of these lineages during the CS. This may reveal a potential better tolerance to cold conditions or different strategies for overwintering among these lineages. This change in microbial community composition was also observed for the bacterial community, with increasing proportion of potential methane and nitrogen cycling bacteria (e.g., bacterial OTUs 5, 6, 17, 18, 22, 33 and 41 in Figure 4) in winter, which was consistent with environmental conditions during this season. Together these results suggest that the winter season is probably not a dormant season for prokaryotic and eukaryotic microorganisms. However, we cannot exclude that a non-negligible part of the observed diversity may overwinter in a dormant or resting state (Sommer et al., 2012).
While Ciliophora are mainly considered as predators of bacteria (Lefranc et al., 2005; Richards and Bass, 2005) and Cryptophyta are assumed to be mainly photoautotrophic (Lepère et al., 2008; Grujcic et al., 2018), plastid-retention and true symbiosis with algal cell in Ciliophora as well as bacterivory in Cryptophyta have been also reported (Dolan, 1992; Stoecker et al., 2017; Grujcic et al., 2018; Stoecker and Lavrentyev, 2018), challenging the attribution of a consensus nutritional mode for these large groups. Therefore, we selected and analyzed in detail 25 predominant OTUs that fluctuated throughout the sampling period to investigate the freshwater microeukaryote ecology and the potential variations of nutritional mode throughout the annual cycle (Figure 3 and Supplementary Figure S3).
Life in a River Covered by Ice
The CS was characterized by a broadly constant low water temperature and ice- and snow-cover on the river and on the upstream lake (Figure 1 and Supplementary Table S1). These conditions are usually associated with limited atmospheric gas exchanges and reduced particulate inputs in the water (Catalan, 1992; Bertilsson et al., 2013; Hampton et al., 2017), as well as reduced macro- and mega-faunal predatory pressure, although zooplankton and fish predation may be high even in winter (Jeppesen et al., 2004; Sørensen et al., 2011; Sommer et al., 2012). Taxonomic comparison with known representatives of the selected OTUs that predominated during winter revealed that the potential for phototrophy and phagotrophy could occur in the river during the CS (Figure 3, Supplementary Figure S3, and Supplementary Table S2). Inhibition of photosynthesis at low temperatures has been previously reported (Murata, 1989; Anesi et al., 2016) but specific physiological adaptations have been proposed for lineages in cold ecosystems, such as the Hydrurus-clade that includes the OTU17 (Supplementary Figure S5 and Supplementary Table S2) (Klaveness and Lindstrøm, 2011; Remias et al., 2013), suggesting that eukaryotic primary productivity might be maintained under ice. During the CS, the bacterial communities also changed in the river (Cruaud et al., 2019), suggesting a modification of the potential prey availability. Eight predominant eukaryotic OTUs with heterotrophic or mixotrophic potential were positively correlated with various winter-associated bacterial lineages, such as Crenothrix, Candidatus Nitrotoga and Methylococcales pLW20 (Cruaud et al., 2019; Figure 4, Supplementary Figure S13, and Supplementary Table S3). While these correlations might indicate that the same or related environmental factors (e.g., temperature, nitrogen, Figure 2, Supplementary Figure S14, and Supplementary Table S1) drive bacterial and eukaryotic populations, it might also suggest potential variation in prey availability, supporting an influence of the bacterial community composition on heterotrophic eukaryotes and vice versa (Jezbera et al., 2005, 2006; Pernthaler, 2005; Massana et al., 2009; Šimek et al., 2013, 2018; Grujcic et al., 2018). Together these results suggest that winter conditions did not preclude the use of light for photosynthesis or the existence of a potential grazing pressure on bacterial communities and that important mechanisms could occur during this season as emphasized in the re-evaluation of the Plankton Group Ecology (PEG) model of seasonal succession of phytoplankton and zooplankton biomasses in lake ecosystems (Sommer et al., 2012). However, these conditions may select a different fraction of the eukaryotic community that is more adapted and competitive under winter conditions than lineages identified in summer, as previously reported (Brown et al., 2004; Gyllström et al., 2005).
Winter Comes Every Year but Each Winter Is Different
Although the overall community structure remained relatively similar during the two sampled winters (Figure 2 and Supplementary Figures S7, S8), a group of covarying OTUs that were mainly detected in March during the winter 2017 showed very high proportions during the winter 2018 (OTU3 within the Ciliophora and OTUs 4, 10, and 19 within the Stramenopiles, Figures 3, 4, and Supplementary Figure S9, and Supplementary Table S2), highlighting potential changes in environmental conditions between winters. The winter 2018 was characterized by a particularly important mid-winter thaw in January (maximal air temperature 9.3°C on 12 January 2018, Figure 1), that led to an unusual increase in river flow and a massive flooding of the watershed. Such events could potentially result in nutrient inputs from the watershed. Furthermore, below freezing temperatures in the following days coupled with the residence time of the water in the lake [32 days in average (APEL, 2015)] could have allowed the persistence of the disturbance effect over a long period of time. Thus the difference observed in eukaryotic microbial community composition between the two winters might be explained by this mid-winter weather perturbation. Interestingly, while only a limited part of the protist community was impacted, the eukaryotic microbial community composition was more altered than the bacterial communities (Cruaud et al., 2019), suggesting differences in the response time or sensitivity between the eukaryotic and the bacterial communities to environmental changes. Based on their taxonomic proximity with known species, heterotrophic and mixotrophic lifestyles were inferred for the eukaryotic OTUs detected in high proportions during the winter 2018. Therefore, they might have been triggered directly by nutrient inputs from the watershed, boosted by potential increase of light penetration in the water, or indirectly activated through the predation of specific organic matter degrading bacteria, such as Polynucleobacter that was also detected in unusually high proportions during the winter 2018 (affiliated as Polynucleobacter asymbioticus on Silva release 128 Cruaud et al., 2019). This Polynucleobacter lineage, that was mainly detected in strong proportion during the WS, is known to exploit photodegradation products of humic substances (Hahn et al., 2012) and to be consumed by a wide range of bacterivorous eukaryotes (Grujcic et al., 2018). However, the emergence of Polynucleobacter in the winter 2018 was not associated with a simultaneous growth of summer bacterivorous eukaryotes, suggesting that environmental conditions (e.g., cold temperature) apply a stronger selection on bacterivorous eukaryotic lineages than the availability of bacterial prey.
Complex Temporal Dynamics During the Ice-Free Period
The relative proportions of the OTUs detected during the WS were more fluctuant than during the CS and only few correlations were detected among them (Figure 4, and Supplementary Figure S12, and Supplementary Table S3), suggesting a more complex temporal dynamic of the eukaryotic microbial community during this season. This results might be directly due to larger variations in environmental conditions (e.g., frequent rainfall events and runoff, water temperature fluctuating from 8°C to 23°C, changes in the watershed input such as pollen, leaf fall or erosion, Figure 1 and Supplementary Table S1) that might provide a large variety of niche opportunities for eukaryotic microorganisms. The environmental conditions during the WS could also impact the potential bacterial prey community composition (Cruaud et al., 2019) and also change the predation by higher trophic levels (Sommer et al., 1986, 2012).
At the beginning of the WS, different OTUs, related to major identified groups (Ciliophora, Hacrobia, and Stramenopiles) were detected in higher proportions (OTUs 8, 14, 18, 20, 21, 22, 23, and 24 Figure 3 and Supplementary Figure S9). While the Telonemia OTU8, the Limnostrombidium OTU14, the Synura OTU20 and the Dinophyceae OTU21 were detected throughout the CS and the Suessiaceae OTU18, the Stentor OTU23 and the Strobilidiidae OTU24 were rather detected in very low proportions during this season (CS), all these OTUs were characterized by a sudden increase in relative proportions on 17 May 2017 (Figures 3, 4 and Supplementary Figure S9). This period could correspond to the spring bloom as described in the PEG model (Sommer et al., 1986, 2012). After the spring break up in mid-April, the Saint-Charles Lake, the main source of the Saint-Charles River, was totally ice-free in early May. At this period, water of the lake mix once the water temperature reach 4°C. The mixing of the lake, as well as the large water inputs produced by snow- and ice-melting in spring, likely bring fresh nutrients which could intermittently fuel the eukaryotic community and enrich it with additional species from snow, ice, deeper waters of the lake or soil leaching. Thus, toward the end of winter, increasing water temperature, light and nutrient availability could allow the growth of fast-growing protists that overwintered in an active or a resting stage with early termination of the diapause phase (Sommer et al., 1986, 2012), as potentially illustrated by the OTUs described above and supporting that the growing season does not start from zero after the winter season (Sommer et al., 2012). Moreover, some of these OTUs were also detected in higher proportions at the beginning of the CS (OTUs 8, 14, 20, and 24). This period correspond to the fall turnover in the Saint-Charles Lake (Wetzel, 2001; Boulé et al., 2010), leading to the redistribution throughout the water column of the nutrients isolated in the hypolymnion during the summer season and potentially modifying the microbial community composition through nutrients or bacteria intake (Cruaud et al., 2019). By contrast with the WS, the beginning of the CS is not characterized by an increase in light supply and in water temperature, suggesting that these lineages might rather respond to an increase in nutrient availability or another confounding factor rather than an increase in light supply, as suggested as main starter for the spring bloom in the PEG model (Sommer et al., 1986, 2012).
After this early summer stage, we observed an increase in relative proportions of different OTUs, such as the Cryptomonas OTUs 1 and 5 and the Stentor OTU11 (Figure 3 and Supplementary Figure S9). These OTUs were correlated with the increase in air and water temperatures (Supplementary Figure S14) and with the relative proportion of some bacterial lineages mainly detected during the WS, such as Limnohabitans, Limnobacter or Sporichthyaceae hgcI (Figure 4, Supplementary Figure S13, and Supplementary Table S3), which are known prey for bacterivorous eukaryotes (Šimek et al., 2013, 2018; Grujcic et al., 2018; Piwosz et al., 2018). These results suggest that these potentially mixotrophic or heterotrophic OTUs could be more competitive in the middle of summer and could be slower growing species than the OTUs detected in early summer as suggested in the PEG model (Sommer et al., 1986). In addition, other eukaryotic OTUs were detected more sporadically during the WS (Uroglena OTU7, Unc. Alveolata OTU12, and Stentor OTU23) or both during the warm and the CS (Unc. Dinophyceae OTU13) with few correlations with the main environmental parameters (Supplementary Figure S14). Punctual events, such as a transient increase in phosphorus (07 June 2016, 15 June 2017) or nitrogen concentrations (CS), could explain these kinds of temporal dynamics. Likewise, the OTU12 and the OTU25, affiliated with the parasitic lineage Perkinsidea (Lepère et al., 2008; Chambouvet et al., 2014) were also detected sporadically throughout the sampling period. Moreover, the Perkinsida OTU25 was strongly correlated with a bacterial OTU affiliated with Polaromonas (Figure 4, Supplementary Figure S13, and Supplementary Table S3), highlighting potential hosts for this Perkinsidae OTU. The detection of these parasitic lineages among the main protist lineages suggests an important role of parasitism in regulation of population dynamics in freshwater ecosystems, as previously suggested (Lefranc et al., 2005; Lepère et al., 2008; Sommer et al., 2012; Mangot et al., 2013).
Together, these results might indicate potential differences among protist lineages detected during the WS such as in generation times, resistance to grazing, susceptibility to infection by virulent parasites or sensitivity to nutrient and prey availability. According to the PEG model, the plankton community during the ice-free period follows successive stages starting from a phytoplankton spring bloom followed by the development of zooplankton in response to food availability. This growth of zooplankton leads to the decline of early summer lineages, which is known as the “clear water phase” (Sommer et al., 1986, 2012). Subsequently, food limitation and fish predation limit the zooplankton biomass allowing the increase of zooplankton preys (Sommer et al., 1986, 2012). Interestingly, the variations observed in our study in the protist community composition and diversity throughout the WS did not reveal clearly separated groups for these successive stages. Without any protist, zooplankton and other predators (e.g., fish) community quantifications, the stages of plankton biomass succession cannot be clearly distinguished in our dataset. However, our study suggests that beyond the total biomass changes, complex and numerous species replacements also occur in freshwater ecosystems during the WS.
Conclusion
Our study shows a pronounced seasonal clustering of eukaryotic microbial communities confirming the important role of environmental selection in freshwater ecosystems and the necessity of temporal series to comprehensively assess the biodiversity of these systems. Although all nutritional modes (autotrophy, heterotrophy, mixotrophy, and parasitism) were potentially identified throughout the year, complex patterns of distribution have been observed suggesting a large complexity of factors and interactions that could shape the temporal dynamics of the microbial eukaryotic community. While the modulation of grazing, photosynthesis and growth rates by water temperature could be an important variable controlling the annual dynamics of eukaryotic microbial populations, our results suggest that other factors such as the availability of specific bacterial and eukaryotic prey, variations in nutrients concentrations and the presence of various predators could also greatly influence the eukaryotic community composition warranting further investigations. Thus, understanding the underlying causes of eukaryotic microbial community temporal dynamics is highly complex and will require considerable efforts and an adequate way to understand this specific part of microbial ecology. However, such efforts are crucial considering the important impact of microbial eukaryotes on the global functioning of freshwater ecosystems.
Data Availability Statement
The datasets generated for this study can be found in NCBI, PRJNA486319, MK618733 – MK618757.
Author Contributions
PC, CD, AC, MR, and SC designed the study. PC and M-SF collected the samples. PC performed the laboratory work, sequencing data analyses, and statistical analyses. PC, AV, and SC analyzed and interpreted the results. PC and AV wrote the manuscript with revisions by SC, MR, CD, and AC.
Funding
This research project was supported by grants from the Natural Sciences and Engineering Research Council of Canada (NSERC), the Drinking Water Chair of Laval University (CREPUL), and Sentinel North. SC is a research scholar from the Fonds de Recherche du Québec en Santé.
Conflict of Interest
The authors declare that the research was conducted in the absence of any commercial or financial relationships that could be construed as a potential conflict of interest.
Acknowledgments
We thank the AD team, and especially Marianne Potvin, as well as all members of the Lab Charette for very helpful scientific discussions. We thank Alex Bernatchez and Morgane Mieli for sampling assistance. We would also like to thank the Ville de Québec and operators of the Loretteville Water Treatment Plant, with a special thanks to Louis Collin and François Proulx.
Supplementary Material
The Supplementary Material for this article can be found online at: https://www.frontiersin.org/articles/10.3389/fmicb.2019.02359/full#supplementary-material
Footnotes
References
Altschul, S. F., Gish, W., Miller, W., Myers, E. W., and Lipman, D. J. (1990). Basic local alignment search tool. J. Mol. Biol. 215, 403–410. doi: 10.1016/S0022-2836(05)80360-2
Andrews, S. (2012). FastQC: A Quality Control Application for High Throughput Sequence Data. Available at: https://www.bioinformatics.babraham.ac.uk/projects/fastqc/ (accessed October 07, 2019).
Anesi, A., Obertegger, U., Hansen, G., Sukenik, A., Flaim, G., and Guella, G. (2016). Comparative analysis of membrane lipids in psychrophilic and mesophilic freshwater dinoflagellates. Front. Plant Sci. 7:524. doi: 10.3389/fpls.2016.00524
APEL (2015). Suivi du lac Saint-Charles - Bilan des Campagnes 2011 à 2013. Québec: Association pour la protection de l’environnement du lac Saint-Charles et des Marais du Nord.
Arndt, H. (1993). Rotifers as predators on components of the microbial web (bacteria, heterotrophic flagellates, ciliates)—a review. Hydrobiologia 83, 231–246. doi: 10.1007/978-94-011-1606-0_31
Arndt, H., Dietrich, D., Auer, B., Cleven, E.-J., Gräfenhan, T., Weitere, M., et al. (2000). “Functional diversity of heterotrophic flagellates in aquatic ecosystems,” in The Flagellates, eds B. S. C. Leadbeater, and J. C. Green, (London: Taylor & Francis Ltd), 240–268.
Bertilsson, S., Burgin, A., Carey, C. C., Fey, S. B., Grossart, H.-P., Grubisic, L. M., et al. (2013). The under-ice microbiome of seasonally frozen lakes. Limnol. Oceanogr. 58, 1998–2012. doi: 10.4319/lo.2013.58.6.1998
Bird, D. F., and Kalff, J. (1986). Bacterial grazing by planktonic lake algae. Science 231, 493–495. doi: 10.1126/science.231.4737.493
Bock, C., Medinger, R., Jost, S., Psenner, R., and Boenigk, J. (2014). Seasonal variation of planktonic chrysophytes with special focus on Dinobryon. Fottea 14, 179–190. doi: 10.5507/fot.2014.014
Boenigk, J., Pfandl, K., Stadler, P., and Chatzinotas, A. (2005). High diversity of the ‘Spumella-like’flagellates: an investigation based on the SSU rRNA gene sequences of isolates from habitats located in six different geographic regions. Environ. Microbiol. 7, 685–697. doi: 10.1111/j.1462-2920.2005.00743.x
Boulé, V., Vallières, C., Laflamme, V., Bouchard-Valentine, M., Jobin, P., Sauvageau, C., et al. (2010). État de la Situation du Bassin Versant de la Prise d’eau de la Rivière St-Charles - Rapport Final. Basel: Roche.
Bråte, J., Klaveness, D., Rygh, T., Jakobsen, K. S., and Shalchian-Tabrizi, K. (2010a). Telonemia-specific environmental 18S rDNA PCR reveals unknown diversity and multiple marine-freshwater colonizations. BMC Microbiol. 10:168. doi: 10.1186/1471-2180-10-168
Bråte, J., Logares, R., Berney, C., Ree, D. K., Klaveness, D., Jakobsen, K. S., et al. (2010b). Freshwater Perkinsea and marine-freshwater colonizations revealed by pyrosequencing and phylogeny of environmental rDNA. ISME J. 4, 1144–1153. doi: 10.1038/ismej.2010.39
Bray, J. R., and Curtis, J. T. (1957). An ordination of the upland forest communities of Southern Wisconsin. Ecol. Monogr. 27, 325–349. doi: 10.2307/1942268
Brodeur, C., Lewis, F., Huet-Alegre, E., Ksouri, Y., Leclerc, M.-C., and Viens, D. (2009). Portrait du bassin de la rivière Saint-Charles. Conseil de bassin de la rivière Saint-Charles, 9, 217–340.
Brown, J. H., Gillooly, J. F., Allen, A. P., Savage, V. M., and West, G. B. (2004). Toward a metabolic theory of ecology. Ecology 85, 1771–1789. doi: 10.1890/03-9000
Caron, D. A., Lim, E. L., Dennett, M. R., Gast, R. J., Kosman, C., and DeLong, E. F. (1999). Molecular phylogenetic analysis of the heterotrophic chrysophyte genus Paraphysomonas (Chrysophyceae), and the design of rRNA-targeted oligonucleotide probes for two species. J. Phycol. 35, 824–837. doi: 10.1046/j.1529-8817.1999.3540824.x
Caron, D. A., Worden, A. Z., Countway, P. D., Demir, E., and Heidelberg, K. B. (2009). Protists are microbes too: a perspective. ISME J. 3, 4–12. doi: 10.1038/ismej.2008.101
Carr, A., Diener, C., Baliga, N. S., and Gibbons, S. M. (2019). Use and abuse of correlation analyses in microbial ecology. ISME J. 1:177. doi: 10.1038/s41396-019-0459-z
Carrias, J., Amblard, C., Quiblier-Lloberas, C., and Bourdier, G. (1998). Seasonal dynamics of free and attached heterotrophic nanoflagellates in an oligomesotrophic lake. Freshw. Biol. 39, 91–101. doi: 10.1046/j.1365-2427.1998.00263.x
Catalan, J. (1992). Evolution of dissolved and particulate matter during the ice-covered period in a deep, high-mountain lake. Can. J. Fish. Aquat. Sci. 49, 945–955. doi: 10.1139/f92-105
Chambouvet, A., Berney, C., Romac, S., Audic, S., Maguire, F., De Vargas, C., et al. (2014). Diverse molecular signatures for ribosomally ‘active’ Perkinsea in marine sediments. BMC Microbiol. 14:110. doi: 10.1186/1471-2180-14-110
Charvet, S., Vincent, W. F., and Lovejoy, C. (2012). Chrysophytes and other protists in High Arctic lakes: molecular gene surveys, pigment signatures and microscopy. Polar Biol. 35, 733–748. doi: 10.1007/s00300-011-1118-7
Choi, B., Son, M., Kim, J. I., and Shin, W. (2013). Taxonomy and phylogeny of the genus cryptomonas (Cryptophyceae, Cryptophyta) from Korea. Algae 28, 307–330. doi: 10.4490/algae.2013.28.4.307
Comeau, A. M., Li, W. K. W., Tremblay, J. -É, Carmack, E. C., and Lovejoy, C. (2011). Arctic ocean microbial community structure before and after the 2007 record sea ice minimum. PLoS One 6:e27492. doi: 10.1371/journal.pone.0027492
Cruaud, P., Rasplus, J.-Y., Rodriguez, L. J., and Cruaud, A. (2017a). High-throughput sequencing of multiple amplicons for barcoding and integrative taxonomy. Sci. Rep. 7:41948. doi: 10.1038/srep41948
Cruaud, P., Vigneron, A., Fradette, M.-S., Charette, S. J., Rodriguez, M. J., Dorea, C. C., et al. (2017b). Open the SterivexTM casing: an easy and effective way to improve DNA extraction yields. Limnol. Oceanogr. Methods 15, 1015–1020. doi: 10.1002/lom3.10221
Cruaud, P., Vigneron, A., Fradette, M.-S., Dorea, C. C., Culley, A. I., Rodriguez, M. J., et al. (2019). Annual bacterial community cycle in a seasonally ice-covered river reflects environmental and climatic conditions. Limnol. Oceanogr. doi: 10.1002/lno.11130
Csardi, G., and Nepusz, T. (2006). The igraph software package for complex network research. InterJ. Compl. Syst. 1695, 1–9.
Debroas, D., Domaizon, I., Humbert, J.-F., Jardillier, L., Lepère, C., Oudart, A., et al. (2017). Overview of freshwater microbial eukaryotes diversity: a first analysis of publicly available metabarcoding data. FEMS Microbiol. Ecol. 93. doi: 10.1093/femsec/fix023
Dolan, J. (1992). Mixotrophy in ciliates: a review of chlorella symbiosis and chloroplast retention. Mar. Microb. Food Webs 6, 115–132.
Dovgal, I. V., and Pesic, V. (2007). Acineta persiensis sp. n. (Ciliophora, Suctorea) — a new freshwater suctorian species from the water mites of the Genus Protzia (Acari, Hydrachnidia). BecmHuk 3ooлoгuu 41, 165–167.
Fernandes, N. M., da Silva Paiva, T., da Silva-Neto, I. D., Schlegel, M., and Schrago, C. G. (2016). Expanded phylogenetic analyses of the class heterotrichea (Ciliophora, Postciliodesmatophora) using five molecular markers and morphological data. Mol. Phylogenet. Evol. 95, 229–246. doi: 10.1016/j.ympev.2015.10.030
Galili, T. (2015). dendextend: an R package for visualizing, adjusting and comparing trees of hierarchical clustering. Bioinformatics 31, 3718–3720. doi: 10.1093/bioinformatics/btv428
Gazulha, F. B., and Utz, L. R. P. (2016). Occurrence of Suctorian Ciliates (Ciliophora, Suctoria) in a Polluted Creek in Southern Brazil. Available at: https://zoociencias.ufjf.emnuvens.com.br/zoociencias/article/view/2878 (accessed February 7, 2019).
Godhe, A., Asplund, M. E., Härnström, K., Saravanan, V., Tyagi, A., and Karunasagar, I. (2008). Quantification of diatom and dinoflagellate biomasses in coastal marine seawater samples by real-time PCR. Appl. Environ. Microbiol. 74, 7174–7182. doi: 10.1128/AEM.01298-08
Gong, J., Dong, J., Liu, X., and Massana, R. (2013). Extremely high copy numbers and polymorphisms of the rDNA operon estimated from single cell analysis of oligotrich and peritrich ciliates. Protist 164, 369–379. doi: 10.1016/j.protis.2012.11.006
Gong, Y.-C., Yu, Y.-H., Zhu, F.-Y., and Feng, W.-S. (2007). Molecular phylogeny of stentor (Ciliophora: Heterotrichea) based on small subunit ribosomal RNA sequences. J. Eukaryot. Microbiol. 54, 45–48. doi: 10.1111/j.1550-7408.2006.00147.x
Grossmann, L., Bock, C., Schweikert, M., and Boenigk, J. (2016). Small but manifold – hidden diversity in “Spumella-like Flagellates.”. J. Eukaryot. Microbiol. 63, 419–439. doi: 10.1111/jeu.12287
Grujcic, V., Nuy, J. K., Salcher, M. M., Shabarova, T., Kasalicky, V., Boenigk, J., et al. (2018). Cryptophyta as major bacterivores in freshwater summer plankton. ISME J. 12, 1668–1681. doi: 10.1038/s41396-018-0057-5
Guillou, L., Bachar, D., Audic, S., Bass, D., Berney, C., Bittner, L., et al. (2013). The protist ribosomal reference database (PR2): a catalog of unicellular eukaryote small sub-unit rRNA sequences with curated taxonomy. Nucleic Acids Res. 41, D597–D604. doi: 10.1093/nar/gks1160
Gyllström, M., Hansson, L.-A., Jeppesen, E., Criado, F. G., Gross, E., Irvine, K., et al. (2005). The role of climate in shaping zooplankton communities of shallow lakes. Limnol. Oceanogr. 50, 2008–2021. doi: 10.4319/lo.2005.50.6.2008
Hahn, M. W., Scheuerl, T., Jezberová, J., Koll, U., Jezbera, J., Šimek, K., et al. (2012). The passive yet successful way of planktonic life: genomic and experimental analysis of the ecology of a free-living Polynucleobacter population. PLoS One 7:e32772. doi: 10.1371/journal.pone.0032772
Hampton, S. E., Galloway, A. W. E., Powers, S. M., Ozersky, T., Woo, K. H., Batt, R. D., et al. (2017). Ecology under lake ice. Ecol. Lett. 20, 98–111. doi: 10.1111/ele.12699
Hansen, G., Daugbjerg, N., and Henriksen, P. (2007). Baldinia anauniensis gen. et sp. nov.: a ‘new’dinoflagellate from Lake Tovel, N. Italy. Phycologia 46, 86–108. doi: 10.2216/PH06-23.1
Hansen, P. J., Ojamäe, K., Berge, T., Trampe, E. C. L., Nielsen, L. T., Lips, I., et al. (2016). Photoregulation in a kleptochloroplastidic dinoflagellate, Dinophysis acuta. Front. Microbiol. 7:785. doi: 10.3389/fmicb.2016.00785
Haraguchi, L. (2018). Phytoplankton community dynamic: a driver for ciliate trophic strategies. Front. Mar. Sci. 5:272. doi: 10.3389/fmars.2018.00272
Jacquet, V., Lair, N., Hoffmann, L., and Cauchie, H.-M. (2005). Spatio-temporal patterns of protozoan communities in a meso-eutrophic reservoir (Esch-sur-Sûre, Luxembourg). Hydrobiologia 551, 49–60. doi: 10.1007/s10750-005-4449-y
Jeppesen, E., Jensen, J. P., Søndergaard, M., Fenger-Grøn, M., Bramm, M. E., Sandby, K., et al. (2004). Impact of fish predation on cladoceran body weight distribution and zooplankton grazing in lakes during winter. Freshw. Biol. 49, 432–447. doi: 10.1111/j.1365-2427.2004.01199.x
Jezbera, J., Horňák, K., and Šimek, K. (2005). Food selection by bacterivorous protists: insight from the analysis of the food vacuole content by means of fluorescence in situ hybridization. FEMS Microbiol. Ecol. 52, 351–363. doi: 10.1016/j.femsec.2004.12.001
Jezbera, J., Horòák, K., and Šimek, K. (2006). Prey selectivity of bacterivorous protists in different size fractions of reservoir water amended with nutrients. Environ. Microbiol. 8, 1330–1339. doi: 10.1111/j.1462-2920.2006.01026.x
Johnson, M. D. (2011). The acquisition of phototrophy: adaptive strategies of hosting endosymbionts and organelles. Photosynth. Res. 107, 117–132. doi: 10.1007/s11120-010-9546-8
Jones, A. C., Liao, T. V., Najar, F. Z., Roe, B. A., Hambright, K. D., and Caron, D. A. (2013). Seasonality and disturbance: annual pattern and response of the bacterial and microbial eukaryotic assemblages in a freshwater ecosystem. Environ. Microbiol. 15, 2557–2572. doi: 10.1111/1462-2920.12151
Kalff, J., and Knoechel, R. (1978). Phytoplankton and their dynamics in oligotrophic and eutrophic lakes. Annu. Rev. Ecol. Syst. 9, 475–495. doi: 10.1146/annurev.es.09.110178.002355
Kamjunke, N., Henrichs, T., and Gaedke, U. (2006). Phosphorus gain by bacterivory promotes the mixotrophic flagellate Dinobryon spp. during re-oligotrophication. J. Plankton Res. 29, 39–46. doi: 10.1093/plankt/fbl054
Katoh, K., and Frith, M. C. (2012). Adding unaligned sequences into an existing alignment using MAFFT and LAST. Bioinformatics 28, 3144–3146. doi: 10.1093/bioinformatics/bts578
Katoh, K., and Standley, D. M. (2013). MAFFT multiple sequence alignment software version 7: improvements in performance and usability. Mol. Biol. Evol. 30, 772–780. doi: 10.1093/molbev/mst010
Kimura, B., and Ishida, Y. (1985). Photophagotrophy in Uroglena americana, Chrysophyceae. Jpn. J. Limnol. Rikusuigaku Zasshi 46, 315–318. doi: 10.3739/rikusui.46.315
Klaveness, D., and Lindstrøm, E.-A. (2011). Hydrurus foetidus (Chromista, Chrysophyceae): a large freshwater chromophyte alga in laboratory culture. Phycol. Res. 59, 105–112. doi: 10.1111/j.1440-1835.2010.00606.x
Klaveness, D., Shalchian-Tabrizi, K., Thomsen, H. A., Eikrem, W., and Jakobsen, K. S. (2005). Telonema antarcticum sp. nov., a common marine phagotrophic flagellate. Int. J. Syst. Evol. Microbiol. 55, 2595–2604. doi: 10.1099/ijs.0.63652-0
Laval-Peuto, M., and Febvre, M. (1986). On plastid symbiosis in Tontonia appendiculariformis (Ciliophora, Oligotrichina). Biosystems 19, 137–158. doi: 10.1016/0303-2647(86)90026-2
Laza-Martínez, A., Arluzea, J., Miguel, I., and Orive, E. (2012). Morphological and molecular characterization of Teleaulax gracilis sp. nov. and T. minuta sp. nov.(Cryptophyceae). Phycologia 51, 649–661. doi: 10.2216/11-044.1
Lefranc, M., Thénot, A., Lepère, C., and Debroas, D. (2005). Genetic diversity of small eukaryotes in lakes differing by their trophic status. Appl. Environ. Microbiol. 71, 5935–5942. doi: 10.1128/AEM.71.10.5935-5942.2005
Lepère, C., Boucher, D., Jardillier, L., Domaizon, I., and Debroas, D. (2006). Succession and regulation factors of small eukaryote community composition in a lacustrine ecosystem (Lake Pavin). Appl. Environ. Microbiol. 72, 2971–2981. doi: 10.1128/AEM.72.4.2971-2981.2006
Lepère, C., Domaizon, I., and Debroas, D. (2008). Unexpected importance of potential parasites in the composition of the freshwater small-eukaryote community. Appl. Environ. Microbiol. 74, 2940–2949. doi: 10.1128/AEM.01156-07
Letunic, I., and Bork, P. (2016). Interactive tree of life (iTOL) v3: an online tool for the display and annotation of phylogenetic and other trees. Nucleic Acids Res. 44, W242–W245. doi: 10.1093/nar/gkw290
Lima-Mendez, G., Faust, K., Henry, N., Decelle, J., Colin, S., Carcillo, F., et al. (2015). Determinants of community structure in the global plankton interactome. Science 348:1262073. doi: 10.1126/science.1262073
Logares, R., Sunagawa, S., Salazar, G., Cornejo-Castillo, F. M., Ferrera, I., Sarmento, H., et al. (2014). Metagenomic 16S rDNA Illumina tags are a powerful alternative to amplicon sequencing to explore diversity and structure of microbial communities. Environ. Microbiol. 16, 2659–2671. doi: 10.1111/1462-2920.12250
Magoč, T., and Salzberg, S. L. (2011). FLASH: fast length adjustment of short reads to improve genome assemblies. Bioinformatics 27, 2957–2963. doi: 10.1093/bioinformatics/btr507
Mangot, J.-F., Domaizon, I., Taib, N., Marouni, N., Duffaud, E., Bronner, G., et al. (2013). Short-term dynamics of diversity patterns: evidence of continual reassembly within lacustrine small eukaryotes. Environ. Microbiol. 15, 1745–1758. doi: 10.1111/1462-2920.12065
Mangot, J.-F., Lepère, C., Bouvier, C., Debroas, D., and Domaizon, I. (2009). Community structure and dynamics of small eukaryotes targeted by new oligonucleotide probes: new insight into the lacustrine microbial food web. Appl. Environ. Microbiol. 75, 6373–6381. doi: 10.1128/AEM.00607-09
Marquardt, M., Vader, A., Stübner, E. I., Reigstad, M., and Gabrielsen, T. M. (2016). Strong seasonality of marine microbial eukaryotes in a High-Arctic Fjord (Isfjorden, in West Spitsbergen, Norway). Appl. Environ. Microbiol. 82, 1868–1880. doi: 10.1128/AEM.03208-15
Martin, M. (2011). Cutadapt removes adapter sequences from high-throughput sequencing reads. EMBnet J. 17, 10–12. doi: 10.14806/ej.17.1.200
Massana, R., Unrein, F., Rodríguez-Martínez, R., Forn, I., Lefort, T., Pinhassi, J., et al. (2009). Grazing rates and functional diversity of uncultured heterotrophic flagellates. ISME J. 3, 588–596. doi: 10.1038/ismej.2008.130
McManus, G. B., and Fuhrman, J. A. (1986). Photosynthetic pigments in the ciliate Laboea strobila from long Island Sound, USA. J. Plankt. Res. 8, 317–327. doi: 10.1093/plankt/8.2.317
McManus, G. B., Liu, W., Cole, R. A., Biemesderfer, D., and Mydosh, J. L. (2018). Strombidium rassoulzadegani: a model species for chloroplast retention in Oligotrich Ciliates. Front. Mar. Sci. 5:205. doi: 10.3389/fmars.2018.00205
Medlin, L. K., Metfies, K., Mehl, H., Wiltshire, K., and Valentin, K. (2006). Picoeukaryotic plankton diversity at the helgoland time series site as assessed by three molecular methods. Microb. Ecol. 52, 53–71. doi: 10.1007/s00248-005-0062-x
Miller, M. A., Pfeiffer, W., and Schwartz, T. (2010). Creating the CIPRES science gateway for inference of large phylogenetic trees. Gatew. Comput. Environ. Workshop GCE 2010, 1–8. doi: 10.1109/GCE.2010.5676129
Millette, N. C., Pierson, J. J., Aceves, A., and Stoecker, D. K. (2017). Mixotrophy in Heterocapsa rotundata: a mechanism for dominating the winter phytoplankton. Limnol. Oceanogr. 62, 836–845. doi: 10.1002/lno.10470
Minnhagen, S., Carvalho, W. F., Salomon, P. S., and Janson, S. (2008). Chloroplast DNA content in Dinophysis (Dinophyceae) from different cell cycle stages is consistent with kleptoplasty. Environ. Microbiol. 10, 2411–2417. doi: 10.1111/j.1462-2920.2008.01666.x
Moestrup, Ø, Lindberg, K., and Daugbjerg, N. (2009). Studies on woloszynskioid dinoflagellates V. Ultrastructure of Biecheleriopsis gen. nov., with description of Biecheleriopsis adriatica sp. nov. Phycol. Res. 57, 221–237. doi: 10.1111/j.1440-1835.2009.00541.x
Murata, N. (1989). Low-temperature effects on cyanobacterial membranes. J. Bioenerg. Biomembr. 21, 61–75. doi: 10.1007/BF00762212
Newbold, L. K., Oliver, A. E., Booth, T., Tiwari, B., DeSantis, T., Maguire, M., et al. (2012). The response of marine picoplankton to ocean acidification. Environ. Microbiol. 14, 2293–2307. doi: 10.1111/j.1462-2920.2012.02762.x
Nolte, V., Pandey, R. V., Jost, S., Medinger, R., Ottenwaelder, B., Boenigk, J., et al. (2010). Contrasting seasonal niche separation between rare and abundant taxa conceals the extent of protist diversity. Mol. Ecol. 19, 2908–2915. doi: 10.1111/j.1365-294X.2010.04669.x
Oksanen, J., Kindt, R., Legendre, P., O’Hara, B., Stevens, M. H. H., Oksanen, M. J., et al. (2007). The vegan package. Commun. Ecol. Pack. 10, 631–637.
Olefeld, J. L., Majda, S., Albach, D. C., Marks, S., and Boenigk, J. (2018). Genome size of chrysophytes varies with cell size and nutritional mode. Org. Divers. Evol. 18, 163–173. doi: 10.1007/s13127-018-0365-7
Pernthaler, J. (2005). Predation on prokaryotes in the water column and its ecological implications. Nat. Rev. Microbiol. 3, 537–546. doi: 10.1038/nrmicro1180
Piwosz, K., Kownacka, J., Ameryk, A., Zalewski, M., and Pernthaler, J. (2016). Phenology of cryptomonads and the CRY1 lineage in a coastal brackish lagoon (Vistula Lagoon, Baltic Sea). J. Phycol. 52, 626–637. doi: 10.1111/jpy.12424
Piwosz, K., Shabarova, T., Tomasch, J., Šimek, K., Kopejtka, K., Kahl, S., et al. (2018). Determining lineage-specific bacterial growth curves with a novel approach based on amplicon reads normalization using internal standard (ARNIS). ISME J. 12:2640. doi: 10.1038/s41396-018-0213-y
Premke, K., and Arndt, H. (2000). Predation on heterotrophic flagellates by protists: food selectivity determined using a live-staining technique. Arch. Für Hydrobiol. 150, 17–28. doi: 10.1127/archiv-hydrobiol/150/2000/17
Prokopowich, C. D., Gregory, T. R., and Crease, T. J. (2003). The correlation between rDNA copy number and genome size in eukaryotes. Genome 46, 48–50. doi: 10.1139/g02-103
Remias, D., Jost, S., Boenigk, J., Wastian, J., and Lütz, C. (2013). Hydrurus-related golden algae (C hrysophyceae) cause yellow snow in polar summer snowfields. Phycol. Res. 61, 277–285. doi: 10.1111/pre.12025
Ren, K., Xue, Y., Rønn, R., Liu, L., Chen, H., Rensing, C., et al. (2018). Dynamics and determinants of amoeba community, occurrence and abundance in subtropical reservoirs and rivers. Water Res. 146, 177–186. doi: 10.1016/j.watres.2018.09.011
Richards, T. A., and Bass, D. (2005). Molecular screening of free-living microbial eukaryotes: diversity and distribution using a meta-analysis. Curr. Opin. Microbiol. 8, 240–252. doi: 10.1016/j.mib.2005.04.010
Richards, T. A., Vepritskiy, A. A., Gouliamova, D. E., and Nierzwicki-Bauer, S. A. (2005). The molecular diversity of freshwater picoeukaryotes from an oligotrophic lake reveals diverse, distinctive and globally dispersed lineages. Environ. Microbiol. 7, 1413–1425. doi: 10.1111/j.1462-2920.2005.00828.x
Rognes, T., Flouri, T., Nichols, B., Quince, C., and Mahé, F. (2016). VSEARCH: a versatile open source tool for metagenomics. PeerJ 4:e2584. doi: 10.7717/peerj.2584
Roy, R. S., Price, D. C., Schliep, A., Cai, G., Korobeynikov, A., Yoon, H. S., et al. (2014). Single cell genome analysis of an uncultured heterotrophic stramenopile. Sci. Rep. 4:4780. doi: 10.1038/srep04780
Ruan, Q., Dutta, D., Schwalbach, M. S., Steele, J. A., Fuhrman, J. A., and Sun, F. (2006). Local similarity analysis reveals unique associations among marine bacterioplankton species and environmental factors. Bioinformatics 22, 2532–2538. doi: 10.1093/bioinformatics/btl417
Salcher, M. M., Neuenschwander, S. M., Posch, T., and Pernthaler, J. (2015). The ecology of pelagic freshwater methylotrophs assessed by a high-resolution monitoring and isolation campaign. ISME J. 9, 2442–2453. doi: 10.1038/ismej.2015.55
Samad, M. S., and Bertilsson, S. (2017). Seasonal variation in abundance and diversity of bacterial methanotrophs in five temperate lakes. Front. Microbiol. 8:142. doi: 10.3389/fmicb.2017.00142
Sandgren, C. D., Smol, J. P., and Kristiansen, J. (1995). Chrysophyte Algae: Ecology, Phylogeny and Development. Cambridge: Cambridge University Press.
Schloss, P. D., Westcott, S. L., Ryabin, T., Hall, J. R., Hartmann, M., Hollister, E. B., et al. (2009). Introducing mothur: open-source, platform-independent, community-supported software for describing and comparing microbial communities. Appl. Environ. Microbiol. 75, 7537–7541. doi: 10.1128/AEM.01541-9
Schoener, D. M., and McManus, G. B. (2012). Plastid retention, use, and replacement in a kleptoplastidic ciliate. Aquat. Microbiol. Ecol. 67, 177–187. doi: 10.3354/ame01601
Scoble, J. M., and Cavalier-Smith, T. (2014). Scale evolution in Paraphysomonadida (Chrysophyceae): sequence phylogeny and revised taxonomy of Paraphysomonas, new genus Clathromonas, and 25 new species. Eur. J. Protistol. 50, 551–592. doi: 10.1016/j.ejop.2014.08.001
Seeleuthner, Y., Mondy, S., Lombard, V., Carradec, Q., Pelletier, E., Wessner, M., et al. (2018). Single-cell genomics of multiple uncultured stramenopiles reveals underestimated functional diversity across oceans. Nat. Commun. 9, 1–10. doi: 10.1038/s41467-017-02235-3
Shalchian-Tabrizi, K., Bråte, J., Logares, R., Klaveness, D., Berney, C., and Jakobsen, K. S. (2008). Diversification of unicellular eukaryotes: cryptomonad colonizations of marine and fresh waters inferred from revised 18S rRNA phylogeny. Environ. Microbiol. 10, 2635–2644. doi: 10.1111/j.1462-2920.2008.01685.x
Sherr, E., and Sherr, B. (1988). Role of microbes in pelagic food webs: a revised concept. Limnol. Oceanogr. 33, 1225–1227. doi: 10.4319/lo.1988.33.5.1225
Šimek, K., Grujčić, V., Hahn, M. W., Horòák, K., Jezberová, J., Kasalický, V., et al. (2018). Bacterial prey food characteristics modulate community growth response of freshwater bacterivorous flagellates. Limnol. Oceanogr. 63, 484–502. doi: 10.1002/lno.10759
Šimek, K., Kasalický, V., Jezbera, J., Horňák, K., Nedoma, J., Hahn, M. W., et al. (2013). Differential freshwater flagellate community response to bacterial food quality with a focus on Limnohabitans bacteria. ISME J. 7:1519. doi: 10.1038/ismej.2013.57
Simon, M., López-García, P., Deschamps, P., Moreira, D., Restoux, G., Bertolino, P., et al. (2015). Marked seasonality and high spatial variability of protist communities in shallow freshwater systems. ISME J. 9, 1941–1953. doi: 10.1038/ismej.2015.6
Šlapeta, J., Moreira, D., and López-García, P. (2005). The extent of protist diversity: insights from molecular ecology of freshwater eukaryotes. Proc. R. Soc. Lond. B Biol. Sci. 272, 2073–2081. doi: 10.1098/rspb.2005.3195
Sommer, U., Adrian, R., De Senerpont Domis, L., Elser, J. J., Gaedke, U., Ibelings, B., et al. (2012). Beyond the plankton ecology group (PEG) model: mechanisms driving plankton succession. Annu. Rev. Ecol. Evol. Syst. 43, 429–448. doi: 10.1146/annurev-ecolsys-110411-160251
Sommer, U., Gliwicz, Z. M., Lampert, W., and Duncan, A. (1986). The PEG-model of seasonal succession of planktonic events in fresh waters. Arch. Hydrobiol. 106, 433–471.
Sørensen, T., Mulderij, G., Søndergaard, M., Lauridsen, T. L., Liboriussen, L., Brucet, S., et al. (2011). Winter ecology of shallow lakes: strongest effect of fish on water clarity at high nutrient levels. Hydrobiologia 664, 147–162. doi: 10.1007/s10750-010-0595-y
Stamatakis, A. (2014). RAxML version 8: a tool for phylogenetic analysis and post-analysis of large phylogenies. Bioinformatics 30, 1312–1313. doi: 10.1093/bioinformatics/btu033
Stoecker, D. K., Hansen, P. J., Caron, D. A., and Mitra, A. (2017). Mixotrophy in the marine plankton. Annu. Rev. Mar. Sci. 9, 311–335. doi: 10.1146/annurev-marine-010816-060617
Stoecker, D. K., and Lavrentyev, P. J. (2018). Mixotrophic plankton in the polar seas: a pan-arctic review. Front. Mar. Sci. 5:292. doi: 10.3389/fmars.2018.00292
Stoecker, D. K., and Michaels, A. E. (1991). Respiration, photosynthesis and carbon metabolism in planktonic ciliates. Mar. Biol. 108, 441–447. doi: 10.1007/BF01313654
Stoecker, D. K., and Silver, M. W. (1987). Chloroplast retention by marine planktonic ciliatesa. Ann. N. Y. Acad. Sci. 503, 562–565. doi: 10.1111/j.1749-6632.1987.tb40646.x
Stoecker, D. K., and Silver, M. W. (1990). Replacement and aging of chloroplasts in Strombidium capitatum (Ciliophora: Oligotrichida). Mar. Biol. 107, 491–502. doi: 10.1007/BF01313434
Taib, N., Mangot, J.-F., Domaizon, I., Bronner, G., and Debroas, D. (2013). Phylogenetic affiliation of SSU rRNA genes generated by massively parallel sequencing: new insights into the freshwater protist diversity. PLoS One 8:e58950. doi: 10.1371/journal.pone.0058950
Terrado, R., Pasulka, A. L., Lie, A. A.-Y., Orphan, V. J., Heidelberg, K. B., and Caron, D. A. (2017). Autotrophic and heterotrophic acquisition of carbon and nitrogen by a mixotrophic chrysophyte established through stable isotope analysis. ISME J. 11, 2022–2034. doi: 10.1038/ismej.2017.68
Thamm, M., Schmidt, S. L., and Bernhard, D. (2010). Insights into the phylogeny of the genus Stentor (Heterotrichea, Ciliophora) with special emphasis on the evolution of the macronucleus based on SSU rDNA data. Acta Protozool. 2010:149157.
Tranvik, L. J., Porter, K. G., and Sieburth, J. M. (1989). Occurrence of bacterivory in cryptomonas, a common freshwater phytoplankter. Oecologia 78, 473–476. doi: 10.1007/BF00378736
Triadó-Margarit, X., and Casamayor, E. O. (2012). Genetic diversity of planktonic eukaryotes in high mountain lakes (Central Pyrenees, Spain). Environ. Microbiol. 14, 2445–2456. doi: 10.1111/j.1462-2920.2012.02797.x
Urabe, J., Gurung, T. B., and Yoshida, T. (1999). Effects of phosphorus supply on phagotrophy by the mixotrophic alga Uroglena americana (Chrysophyceae). Aquat. Microb. Ecol. 18, 77–83. doi: 10.3354/ame018077
Vigneron, A., Cruaud, P., Mohit, V., Martineau, M.-J., Culley, A. I., Lovejoy, C., et al. (2018). Multiple strategies for light-harvesting, photoprotection, and carbon flow in high latitude microbial mats. Front. Microbiol. 9:2881. doi: 10.3389/fmicb.2018.02881
Vigneron, A., Lovejoy, C., Cruaud, P., Kalenitchenko, D., Culley, A., and Vincent, W. F. (2019). Contrasting winter versus summer microbial communities and metabolic functions in a Permafrost Thaw Lake. Front. Microbiol. 10:1656. doi: 10.3389/fmicb.2019.01656
Warnes, G. R., Bolker, B., Bonebakker, L., Gentleman, R., Liaw, W. H. A., Lumley, T., et al. (2015). gplots: Various R Programming Tools for Plotting Data. R package version 2.17.0.
Wei, T., Simko, V., Levy, M., Xie, Y., Jin, Y., and Zemla, J. (2017). Package ‘corrplot.’. Statistician 56, 316–324.
Wetzel, R. G. (2001). Limnology: Lake and River Ecosystems. Houston, TX: Gulf professional publishing.
Wickham, H. (2015). Stringr: Simple, Consistent Wrappers for Common String Operations. R Package Version 1.
Wilken, S., Huisman, J., Naus-Wiezer, S., and Donk, E. V. (2013). Mixotrophic organisms become more heterotrophic with rising temperature. Ecol. Lett. 16, 225–233. doi: 10.1111/ele.12033
Worden, A. Z., Follows, M. J., Giovannoni, S. J., Wilken, S., Zimmerman, A. E., and Keeling, P. J. (2015). Rethinking the marine carbon cycle: factoring in the multifarious lifestyles of microbes. Science 347:1257594. doi: 10.1126/science.1257594
Xia, L. C., Steele, J. A., Cram, J. A., Cardon, Z. G., Simmons, S. L., Vallino, J. J., et al. (2011). Extended local similarity analysis (eLSA) of microbial community and other time series data with replicates. BMC Syst. Biol. 5:S15. doi: 10.1186/1752-0509-5-S2-S15
Xia, Y., Wang, Y., Wang, Y., Chin, F. Y. L., and Zhang, T. (2016). Cellular adhesiveness and cellulolytic capacity in Anaerolineae revealed by omics-based genome interpretation. Biotechnol. Biofuels 9:111. doi: 10.1186/s13068-016-0524-z
Zhao, B., Chen, M., Sun, Y., Yang, J., and Chen, F. (2011). Genetic diversity of picoeukaryotes in eight lakes differing in trophic status. Can. J. Microbiol. 57, 115–126. doi: 10.1139/W10-107
Keywords: microbial eukaryotes, protists, freshwater, river, seasonal cycles, winter, bacterial communities
Citation: Cruaud P, Vigneron A, Fradette M-S, Dorea CC, Culley AI, Rodriguez MJ and Charette SJ (2019) Annual Protist Community Dynamics in a Freshwater Ecosystem Undergoing Contrasted Climatic Conditions: The Saint-Charles River (Canada). Front. Microbiol. 10:2359. doi: 10.3389/fmicb.2019.02359
Received: 09 April 2019; Accepted: 27 September 2019;
Published: 16 October 2019.
Edited by:
Haihan Zhang, Xi’an University of Architecture and Technology, ChinaReviewed by:
Jean-François Mangot, Spanish National Research Council (CSIC), SpainThorsten Stoeck, University of Kaiserslautern, Germany
Copyright © 2019 Cruaud, Vigneron, Fradette, Dorea, Culley, Rodriguez and Charette. This is an open-access article distributed under the terms of the Creative Commons Attribution License (CC BY). The use, distribution or reproduction in other forums is permitted, provided the original author(s) and the copyright owner(s) are credited and that the original publication in this journal is cited, in accordance with accepted academic practice. No use, distribution or reproduction is permitted which does not comply with these terms.
*Correspondence: Perrine Cruaud, perrine.cruaud@gmail.com