 Saskia-Camille Flament-Simon1
 Marion Duprilot2,3
 Noémie Mayer2
 Vanesa García1
 María Pilar Alonso4
 Jorge Blanco1
 Marie-Hélène Nicolas-Chanoine2,3*
- 1Laboratorio de Referencia de Escherichia coli, Departamento de Microbioloxía e Parasitoloxía, Facultade de Veterinaria, Universidade de Santiago de Compostela, Lugo, Spain
- 2Service de Microbiologie, Hôpital Beaujon, AP-HP, Clichy, France
- 3IAME, UMR 1137, INSERM, Université Paris Diderot, Paris, France
- 4Unidade de Microbioloxía, Hospital Universitario Lucus Augusti, Lugo, Spain
Background: Escherichia coli biofilm formation has mostly been assessed in specific pathogenic E. coli groups. Here, we assessed the early biofilm formation (EBF), i.e., adhesion stage, using the BioFilm Ring Test® on 394 E. coli clinical isolates (EC) [196 consecutively isolated (CEC) in 2016 and 198 ESBL-producing E. coli (ESBLEC) isolated in 2015]. Then, biofilm-forming ability was contrasted with phylogroups, clonotypes (fumC-fimH), and sequence types (STs), all being used to define clones, virulence factors (VF), and FimB.
Result: According to both biofilm production levels at 2, 3, and 5 h, and EBF kinetics over 5 h, CEC and ESBLEC isolates segregated into three EBF groups: strong (G1), moderate (G2), and weak (G3) producers. At 2 h, strong producers were more frequent among CEC (n = 28; 14.3%) than among ESBLEC (n = 8; 4%) (P = 0.0004). As CEC and ESBLEC isolates showed similar individual EBF kinetics in each group, a comparison of isolate features between each group was applied to gathered CEC and ESBLEC isolates after 2 h of incubation, 2 h being the most representative time point of the CEC and ESBLEC isolate segregation into the three groups. Phylogroup B2 displayed by 51.3% of the 394 isolates was more frequent in G1 (77.8%) than in G3 (47.6%) (P = 0.0006). The 394 isolates displayed 153 clones, of which 31 included at least three isolates. B2-CH14-2-ST127, B2-CH40-22-ST131, B2-CH52-5/14-ST141, and E-CH100-96-ST362 clones were associated with G1 (P < 0.03) and accounted for 41.7% of G1 isolates. B2-CH40-30-ST131 clone was associated with G3 (P < 0.0001) and accounted for 25.5% of G3 isolates. VF mean was higher among G1 than among G3 isolates (P < 0.001). FimB-P2 variant was associated with G1 (P = 0.0011) and FimB-P1 variant was associated with G3 (P = 0.0023). Clone, some VF, and FimB were associated with EBF, with clonal lineage being able to explain 72% of the variability of EBF.
Conclusion: Among our 394 isolates, <10% are able to quickly and persistently produce high biofilm levels over 5 h. These isolates belong to a few clones previously described in various studies as dominant gut colonizers in mammalians and birds and comprised the B2-CH40-22-ST131 clone, i.e., the ancestor of the globally disseminated B2-CH40-30-ST131 clone that is the dominant clone among the weak biofilm producers.
Introduction
Since the first definition of biofilms provided by Costerton et al. (1978) 30 years ago, it is well established that the majority of bacteria found in nature exists attached to surfaces within the structured biofilm ecosystem (Costerton et al., 1978; Hall-Stoodley et al., 2004). Bacterial biofilms are known for their resistance to antibiotics, disinfectants, and components of the innate and adaptative inflammatory defense system of the body (Høiby et al., 2011). Accordingly, biofilm-growing bacteria cause chronic infections, persisting inflammation, tissue damage, and foreign body infections (Høiby et al., 2011). Thus, it was shown that persistence of staphylococcal infections related to foreign bodies is due to biofilm formation (Sabaté Brescó et al., 2017). Likewise, chronic Pseudomonas aeruginosa lung infections in cystic fibrosis patients are caused by biofilm-growing mucoid isolates (Høiby et al., 2010).
Concerning Escherichia coli, which can exist as a harmless commensal in the mammalian digestive tract and as a pathogen causing significant morbidity and mortality worldwide, its ability to form biofilm has been extensively studied from non-pathogenic E. coli K12 strains (Beloin et al., 2008). With regard to pathogenic E. coli, biofilm involvement in pathogenesis has been well defined in diarrheagenic E. coli, notably enteroaggregative E. coli (Sheikh et al., 2001; Sherlock et al., 2004; Schiebel et al., 2017) and in adherent-invasive E. coli that have been implicated in the origin and perpetuation of Crohn’s disease (Martinez-Medina et al., 2009b). Production of biofilm by extraintestinal pathogenic E. coli (ExPEC) was mostly assessed in uropathogenic E. coli (Watts et al., 2010; Ponnusamy et al., 2012; Agarwal et al., 2013; Tapiainen et al., 2014). All these studies highlighted various biofilm formation phenotypes among uropathogenic E. coli including isolates obtained from patients with an indwelling catheter. Assessment of biofilm formation focusing on the pandemic extended-spectrum β-lactamase (ESBL)-producing and multidrug-resistant ST131 E. coli clone (Nicolas-Chanoine et al., 2014) showed highly contrasting results: very low levels (Novais et al., 2012) and moderate levels (Hussain et al., 2014) of biofilm formation. Sarkar et al. (2016) studying ST131 isolates expressing or non-expressing type 1 fimbriae showed that biofilm growth depended on type 1 fimbriae expression and assay conditions. We recently showed different phenotypes among ST131 isolates according to their fimH allele encoding adhesins of type 1 fimbriae, namely, significant higher levels of early biofilm production by isolates of ST131 H22 subclone than those of ST131 H30 subclone (Nicolas-Chanoine et al., 2017).
In the present study, we assessed biofilm formation in 394 clinical isolates obtained from different sources in two geographically distant hospitals and during the same time periods. We focused on the early biofilm formation (EBF), i.e., at adhesion stage, because this stage is the key stage in the colonization process of abiotic and biotic surfaces, body biotic surfaces being the epithelia of the various organs for the ExPEC isolates and mucus layers in gut, i.e., the E. coli natural habitat, for all E. coli populations (Ellermann and Sartot, 2018). For this, we used the BioFilm Ring Test®, a microbead immobilization assay adapted from Chavant et al.’s (2007) method that was shown to have a good concordance with the crystal violet method (Di Domenico et al., 2016) and offers a reproducible and quantifiable measure of the first step of biofilm formation. Expecting, as previously described, different biofilm formation phenotypes among our isolates, the main goal of this study was to molecularly characterize the isolates that enabled us to show that some traits are associated with the different phenotypes.
Materials and Methods
Bacteria
Two collections of E. coli clinical isolates were studied. The first collection consisted of 196 non-duplicate (one isolate per patient) E. coli consecutively isolated (CEC) in 2016 from two hospitals (Lugo hospital in Spain, n = 100, and Beaujon hospital in France, n = 96). This collection that comprised 13 ESBL-producing isolates came from different sources: 146 from urine, 22 from blood, 5 from bile, 3 from ascitic fluid, 6 from abscesses, and 14 from various other sources. As ESBL production is currently one of the most important worldwide threatening mechanisms of antibiotic resistance in E. coli clinical isolates, we studied a second collection consisting of 198 non-duplicate ESBL-producing E. coli (ESBLEC) isolates obtained from the same two hospitals in 2015 (Lugo hospital, n = 99, and Beaujon hospital, n = 99). This collection comprised 147 isolates from urine, 26 from blood, 7 from bile, 4 from ascitic fluid, 2 from abscesses, and 12 from various other sources. ESBL production detected by the double disk synergy test (Jarlier et al., 1988) performed in the two hospitals had been confirmed by specific ESBL PCR and sequencing as previously described (Leflon-Guibout et al., 2008; Mora et al., 2018).
Determination of Early Biofilm Formation
The kinetics of EBF was assessed using the BioFilm Ring Test® (BioFilm Control, Saint-Beauzire, France) according to the manufacturer’s recommendations. Briefly, each isolate was twice sub-cultured on brain heart infusion (BHI) agar (Benton Dickinson, Le Pont-de-Claix, France) at 37°C for 24 h. Three colonies of the second subculture on BHI agar were suspended in BHI broth (Biofilm Control). Suspension was standardized to an optical density at 600 nm of 1.00 ± 0.05 (Ultrospec10: Biochrom, Cambridge, United Kingdom) and then diluted at 1:250 in BHI broth to obtain a final concentration of approximately 106 UFC/ml. The bacterial suspension was supplemented (1% vol/vol) with magnetic microbeads (TONER 4, Biofilm Control) and 200 μl of the mix was deposited in two wells of three polystyrene 96-well microtiter plates that were incubated for 2, 3, and 5 h, respectively. At the end of each incubation time, 100 μl of liquid contrast solution (LIC001, Biofilm Control) was added on the top of each well and the microplate was put on a magnetic block for 1 min. After magnet contact, free beads were attracted toward the center of each well, forming a brown spot, while beads embedded in biofilms were blocked and remained undetectable. Each microplate was scanned using a BioFilm Control plate reader. The intensity of the spot was analyzed using the BioFilm Ring Test®-software version 3.0.3 and expressed as a biofilm formation index (BFI) with values ranging from 20 (non-formation of biofilm) to 0 (high formation of biofilm) that is inversely proportional to attached bacteria that block the beads. BFI values ≤ 5 mean that the isolates are strong biofilm producers; BFI values between 6 and 14, moderate producers; BFI values between 15 and 19, weak producers; non-producers display a BFI value of 20. Each isolate was tested in three independent experiments and the average of the six measures was used as the final BFI value. For each experiment, isolates S250 and 39 previously described with the method carried out in the present study as strong and negative producers of biofilm, respectively, were used as controls (Nicolas-Chanoine et al., 2017). We also included BHI broth without bacteria as negative control.
Molecular Characterization of Isolates
As previously described, phylogroups (Clermont et al., 2013), sequence types (STs) according to the MLST scheme of Achtman1, fumC (C), and fimH (H) clonotypes (Weissman et al., 2012), and virulence factors (VF) (Mora et al., 2018) were determined in all 394 E. coli isolates. Clones were characterized by using the association of phylogroup, clonotype, and ST. Among the 394 isolates, 127 (approximately one-third of the 394 isolates) were randomly selected by using the RAND function (Microsoft Excel) system for the fimB gene analysis. The fimB gene was amplified with specific primers (FimB F: 5′-AGCATGGCGTTTGTATGG-3′; FimB R: 5′-CCCTGGTATCTCAACTATCTCT-3′) and sequenced as previously described (Nicolas-Chanoine et al., 2017). When the fimB gene was disrupted, the detection of the previously described IS3-like in H30 R isolates (Totsika et al., 2011; Nicolas-Chanoine et al., 2017) was performed by PCR using specific primers designed in this study (FimBw F: 5′-AGCATGGCGTTTGTATGG-3′; IS R: 5′-CTGAATGTGATGTGCCGATG-3′). Phylogenetic tree of FimB variants was constructed by the UPGMA method of MEGA 6.
Statistical Analysis
Analysis of variance (ANOVA) test was performed to compare the mean number of virulence genes and the association of variables with biofilm formation phenotypes. Dichotomous variables were described using enumeration and percentage, and compared using two-tailed Fisher’s exact test. P-values < 0.05 were considered statistically significant. Correlation between quantitative variables was assessed by Pearson correlation coefficient, and the assessment of repeatability was via the Bland and Altman (1986) statistical method. All analyses were carried out by XLSTAT statistical software2.
Nucleotide Sequence Accession Numbers
The 34 fimB gene sequences have been registered in GenBank database under the following accession numbers: MK301552 to MK301585.
Results
Kinetics of Early Biofilm Formation
To assess the repeatability of the duplicate determination of biofilm formation performed on each of the 394 isolates at each time, we calculated Pearson’s correlation coefficient and Bland and Altman (1986) analysis between the BFI obtained for each determination. Pearson’s correlation coefficient was high and constant over time: 0.96 at 2 h, 0.96 at 3 h, and 0.95 at 5 h (Supplementary Figure S1A), and the Bland and Altman (1986) analysis showed that only 3.4% of values at 2 h, 5.5% at 3 h, and 6.8% at 5 h exceed the established standard deviation (Supplementary Figure S1B).
Biofilm formation index values obtained at each time point (2, 3, and 5 h) showed a distribution of both CEC and ESBLEC isolates in the three levels of biofilm production (strong, moderate, and weak production) defined according to the BFI value ranges. After 2 h of incubation, strong producers (BFI: 0–5) and moderate producers (BFI: 6–14) were more frequent among CEC isolates than ESBLEC isolates (P = 0.004 and P = 0.0189, respectively), whereas weak and non-producers (BFI: 15–20) were more frequent among ESBLEC isolates than among CEC isolates (P < 0.0001) (Table 1). After 3 h of incubation, such significant differences were still observed between CEC and ESBLEC isolates for the strong and weak producers but not for the moderate producers. After 5 h of incubation, no significant difference was observed between CEC and ESBLEC for the three types of producers.
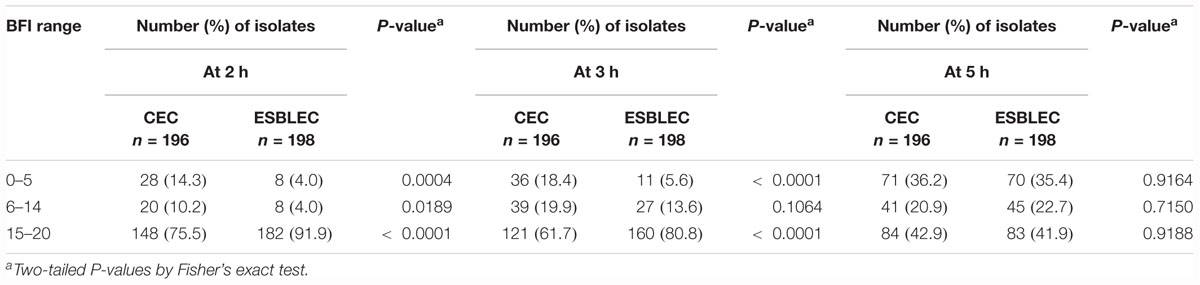
Table 1. Distribution of CEC and ESLEC isolates according to the biofilm index (BFI) values after 2, 3, and 5 h of incubation.
The study of individual BFI trajectories of the isolates of the three 2-h groups over time showed that both CEC and ESBLEC isolates displayed three distinct EBF kinetics. As indicated in Figures 1A,A’, most of the 28 CEC (27 non-ESBL producers) and the 8 ESBLEC strong biofilm producers at 2 h (average BFI: 1 for the two collections) remained strong producers after 3 h (average BFI: 1 and 2, respectively) and 5 h (average BFI: 4 and 3, respectively) of incubation. Accordingly, these isolates were classified into group 1 (G1) corresponding to quickly and persistently strong biofilm producers. As indicated in Figures 1B,B’, the 20 CEC and 8 ESBLEC moderate producers at 2 h, with average BFI values of 11 and 13, respectively, displayed a wider variability of BFI values at 3 and 5 h than the strong producers. However, their average BFI at 3 h (7 and 11, respectively) and at 5 h (10 and 6, respectively) led us to classify them as mostly moderate producers over the study period [group 2 (G2)]. As indicated in Figures 1C,C’, the 148 CEC and 182 ESBLEC weak producers at 2 h (average BFI: 18 for CEC and ESBLEC) also displayed a wide variability of BFI values at 3 and 5 h with a notable part of isolates becoming strong producers at 5 h. However, the average BFI values were 17 for CEC and 18 for ESBLSE isolates at 3 h, and 12 for CEC and ESBLEC isolates at 5 h. Accordingly, we classified these isolates into group G3 corresponding to weak biofilm producers. We compared the individual BFI trajectories of all CEC isolates and CEC isolates over time without the 13 ESBL-producing isolates identified in this collection and found no significant difference (data not shown).
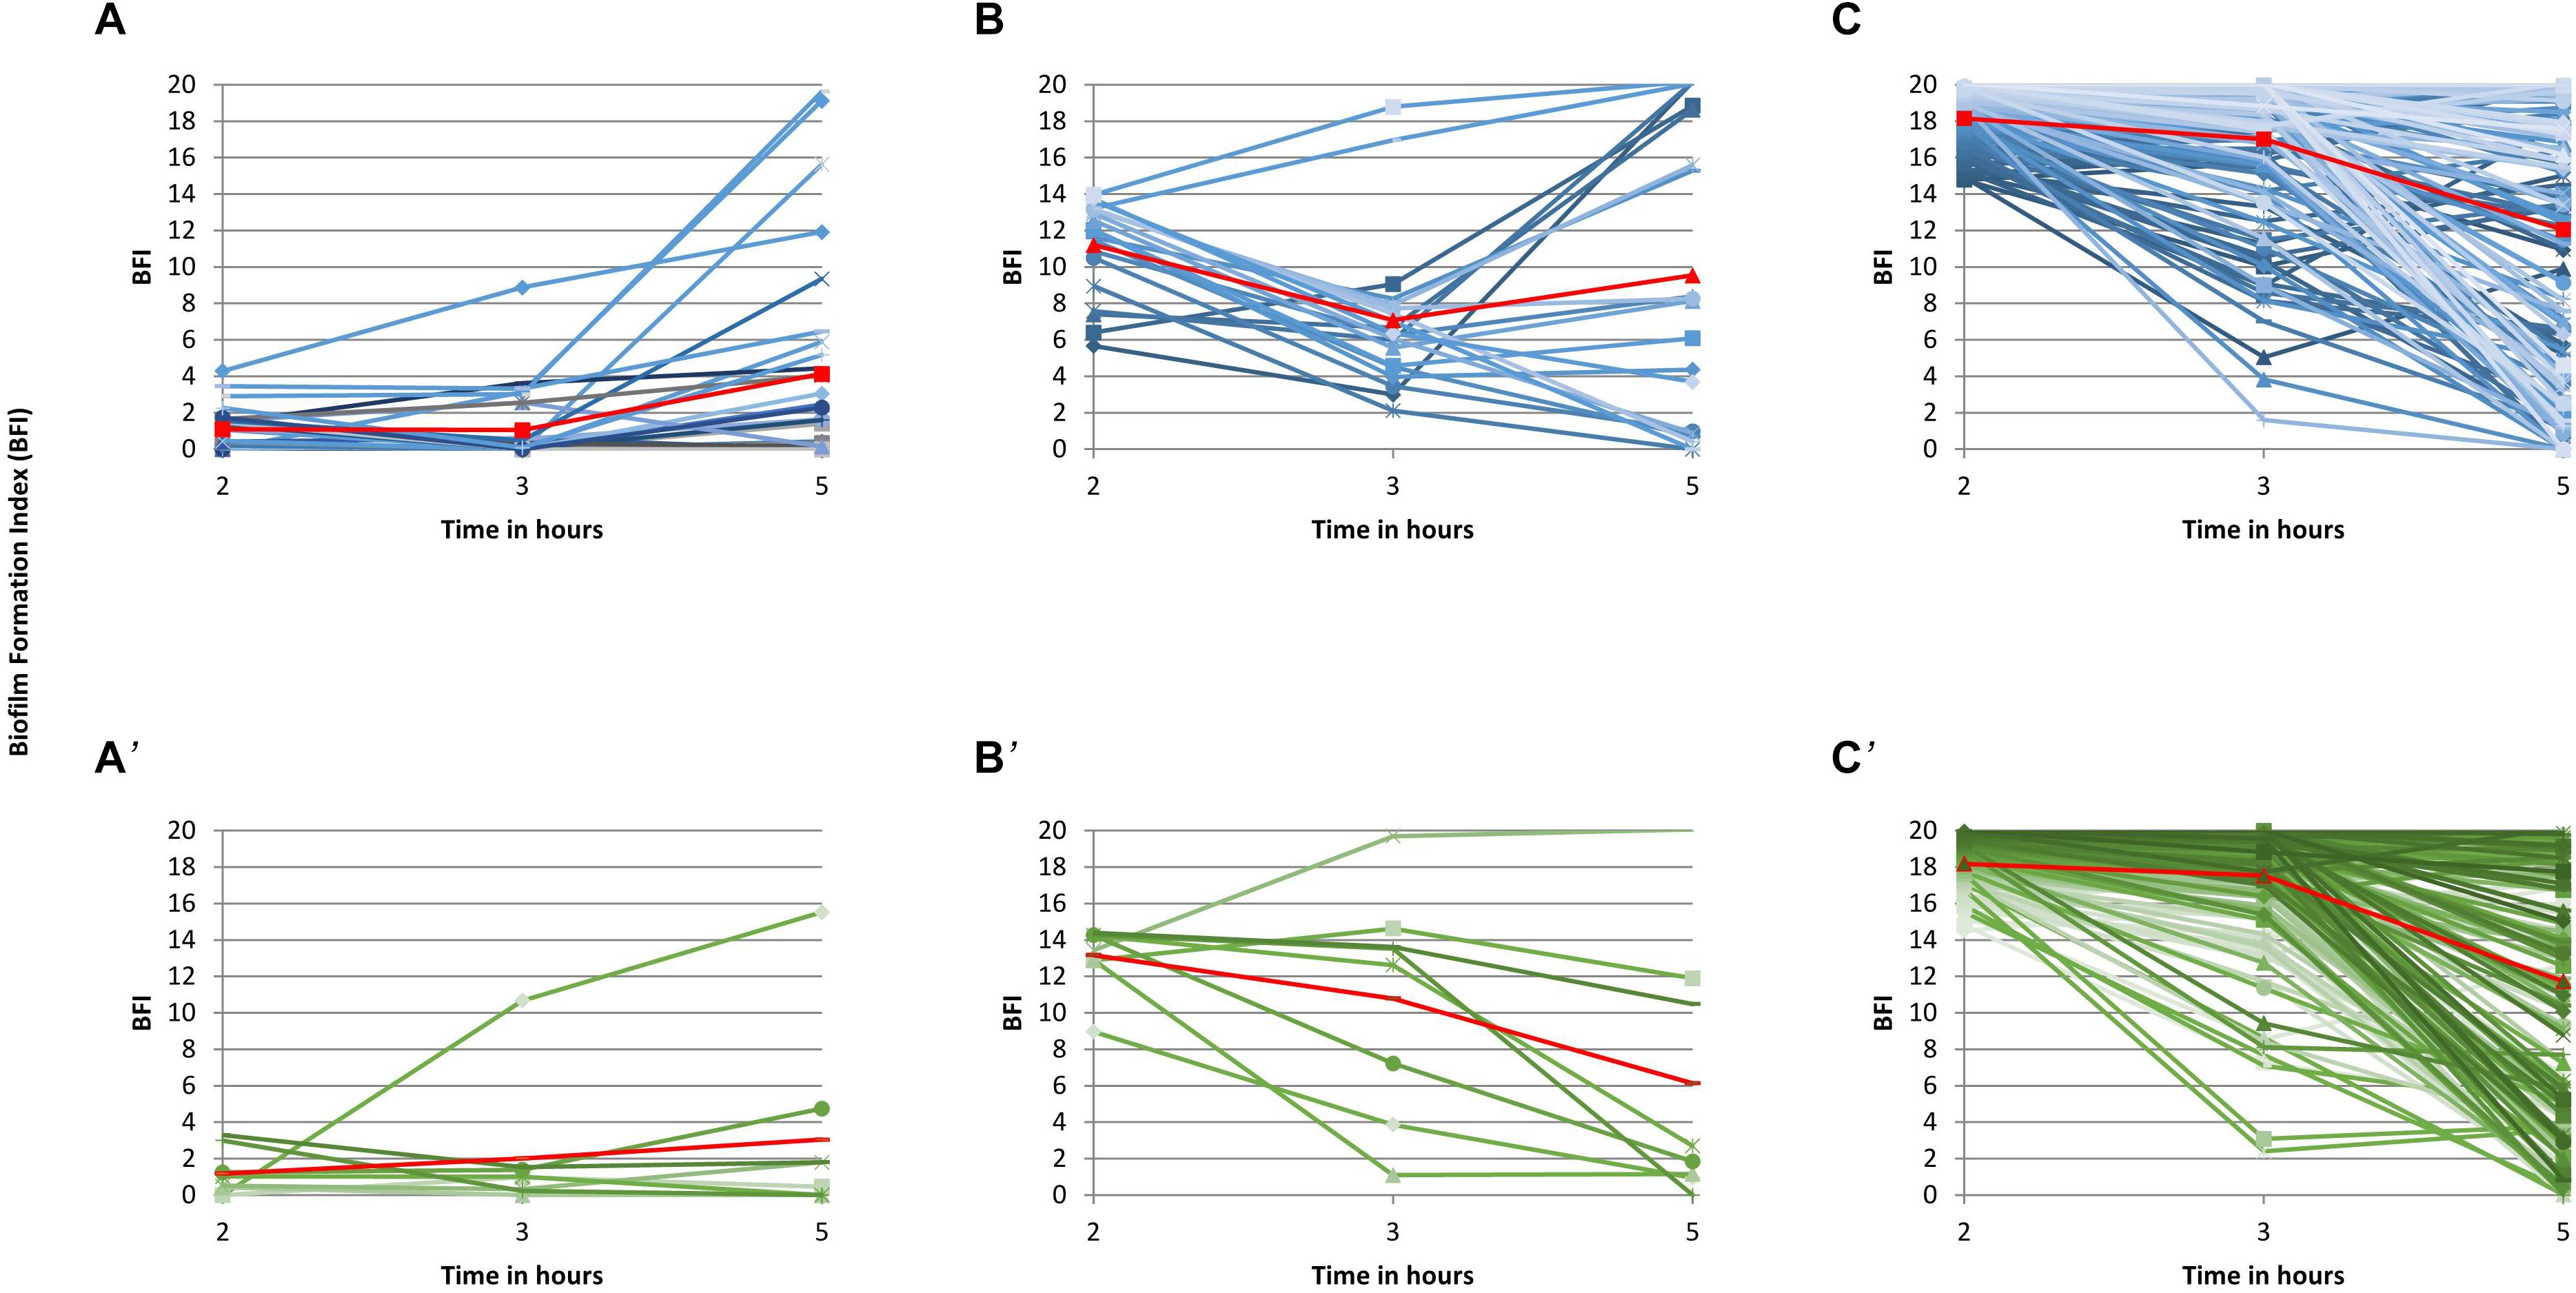
Figure 1. Individual biofilm formation trajectories over time for the 394 isolates. Individual biofilm formation index (BFI) and average BFI values at each time point (2, 3, and 5 h) are represented as blue lines and a red connected line, respectively, for CEC isolates (A–C) and as green lines and a red connected line, respectively, for ESBLEC isolates (A’–C’). (A,A’) present the biofilm kinetics of the strong biofilm producers at 2 h (BFI≤5), (B,B’), the biofilm kinetics of the moderate producers at 2 h (BFI>5–≤14), and (C,C’), the biofilm kinetics of the weak (BFI>14 and <20) and the non-producers (BFI = 20) at 2 h.
Figure 1 shows that time point 2 h was the most representative time point of the division of our E. coli population into three groups. Accordingly, the comparisons between G1, G2, and G3 isolates will be made at time point 2 h in the rest of the study. Furthermore, the similarity of the individual biofilm formation kinetics of the CEC and ESBLEC isolates within each group led us to characterize altogether the CEC and ESBLEC isolates of each group in the rest of the study.
Characterization of Phylogroups, Sequence Types, and Clones
Phylogroups
Most of the 394 isolates (51.3%) were assigned to phylogroup B2. The remaining isolates were distributed into phylogroups A (15.0%), B1 (9.6%), C (9.6%), E (5.1%), F (5.1%), and D (4.3%). Isolates belonging to phylogroup B2 were predominant among G1, G2, and G3 isolates (Figure 2). The seven phylogroups (A, B1, B2, C, D, E, and F) were detected among G3 isolates, four (A, B1, B2, and D) among G2 isolates, and four (B1, B2, E, and F) among G1 isolates (Figure 2). Isolates belonging to phylogroup B2 were more frequent among G1 isolates (77.8%) than among G3 isolates (47.6%) (P = 0.0006) (Supplementary Table S1). By contrast, isolates belonging to phylogroups A and C were significantly more frequent among G3 isolates than among G1 isolates (A: 16.1% vs. 0%, P = 0.0098; C: 11.5% vs. 0%, P = 0.0419) (Supplementary Table S1).
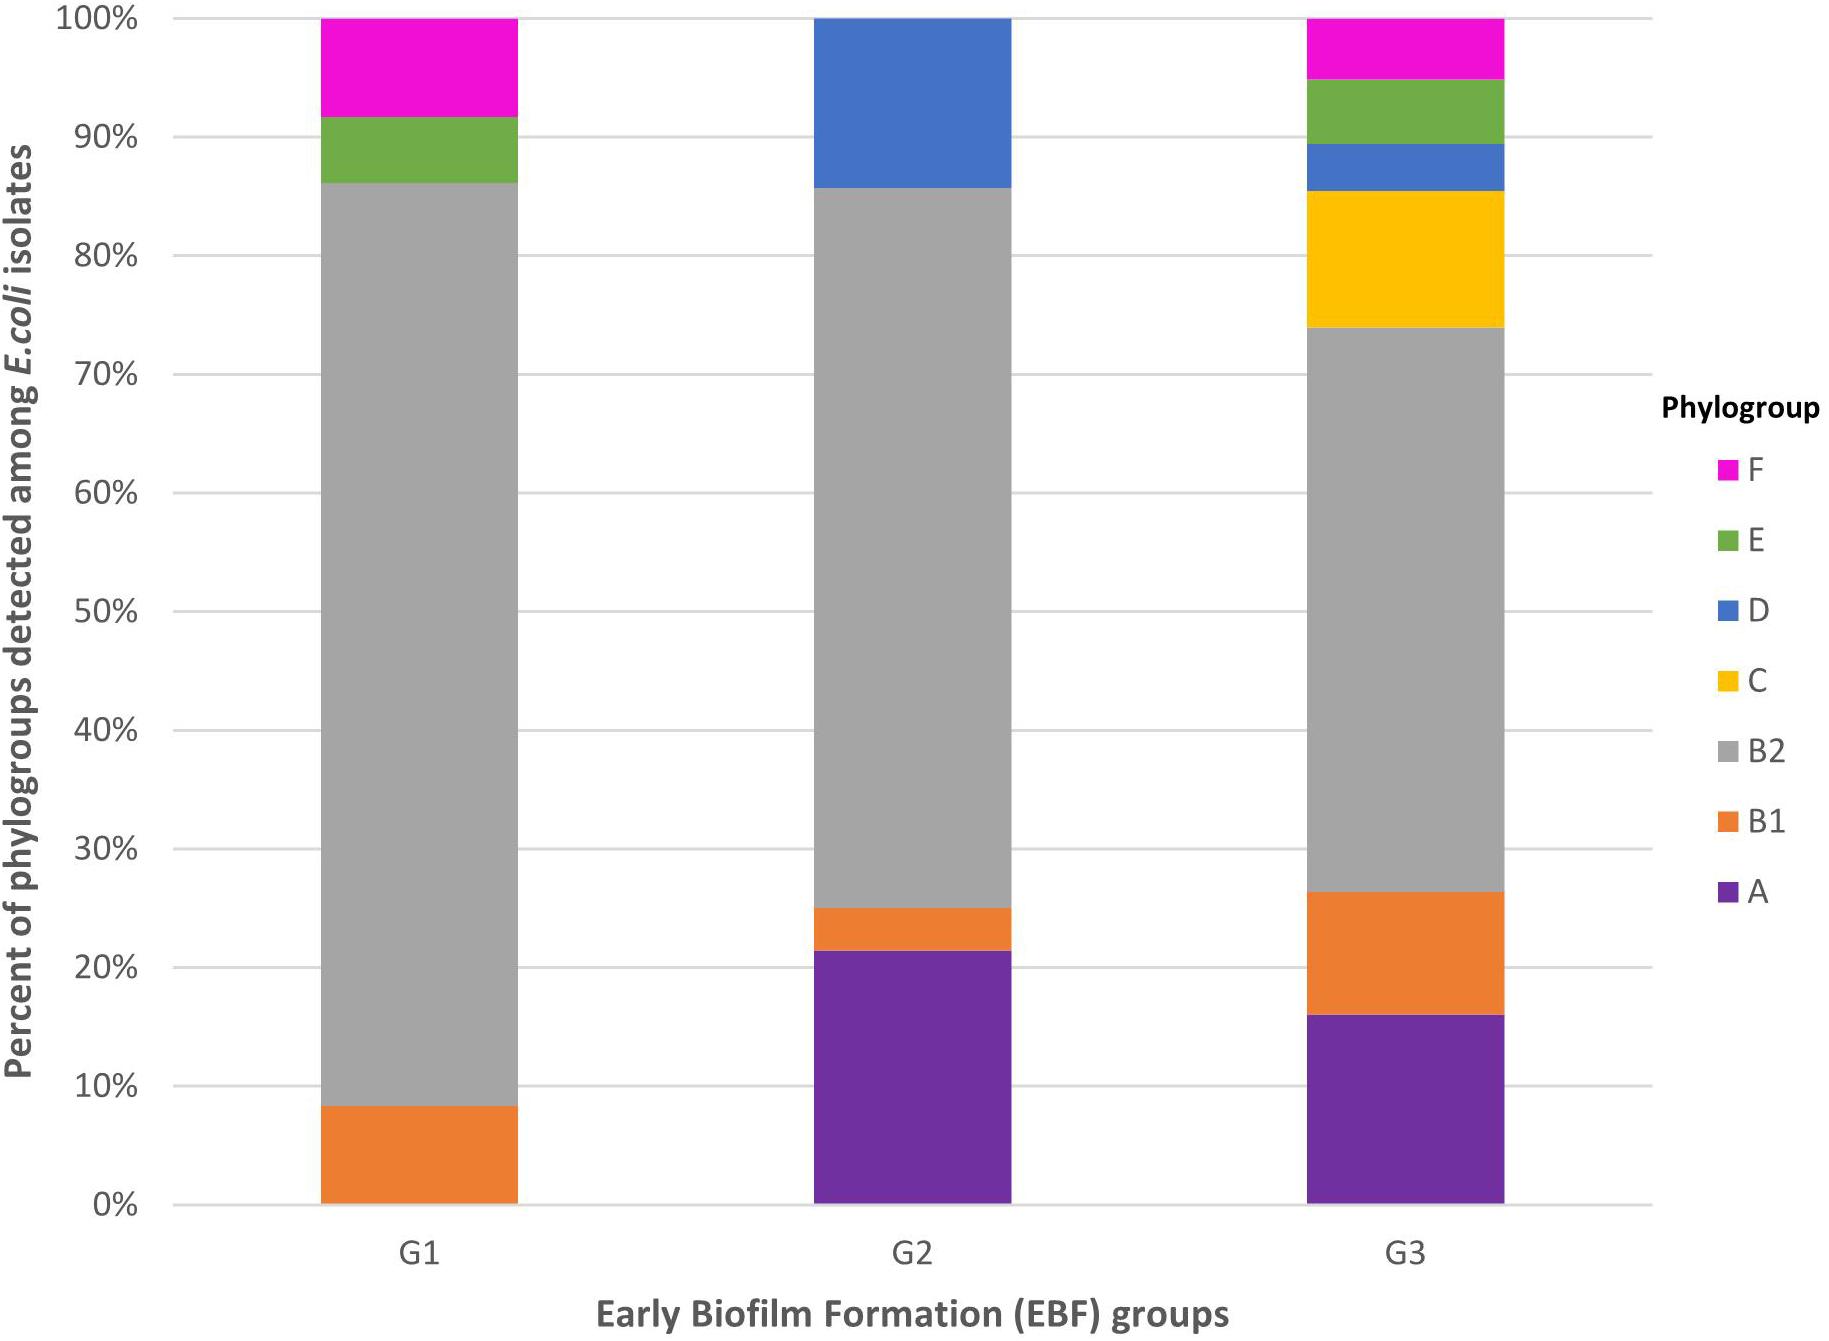
Figure 2. Distribution of phylogroups A, B1, B2, C, D, E, and F among G1, G2, and G3 isolates. G1: strong producers, G2: moderate producers, and G3: weak producers. Isolates belonging to phylogroup B2 were more frequent among G1 isolates (77.8%) than among G3 isolates (47.6%) (P = 0.0006). By contrast, isolates belonging to phylogroups A and C were significantly more frequent among G3 isolates than among G1 isolates (A: 16.1 vs. 0%, P = 0.0098; C: 11.5 vs. 0%, P = 0.0419).
Sequence Types
The 394 E. coli isolates displayed 99 STs. The most frequent STs accounting for more than half (52.0%) of the isolates were ST131 (26.4%), ST73 (5.6%), ST10 (4.3%), ST88 (4.3%), ST141 (4.1%), ST69 (3.8%), and ST95 (3.6%). The distribution of the seven most frequent STs among G1, G2, and G3 isolates is presented in Figure 3. These seven STs were displayed by G3 isolates whereas five were displayed by G2 isolates (absence of ST88 and ST95) and only three (ST131, ST141, and ST73) were displayed by G1 isolates. Among the three STs shared by the three groups, ST131 was significantly more frequent among G3 isolates than among G1 isolates (29.4% vs. 11.1%, P = 0.0289). By contrast, ST141 was more frequent among G1 isolates than among G3 (25.0% vs. 1.5%, P < 0.0001) (Supplementary Table S2).
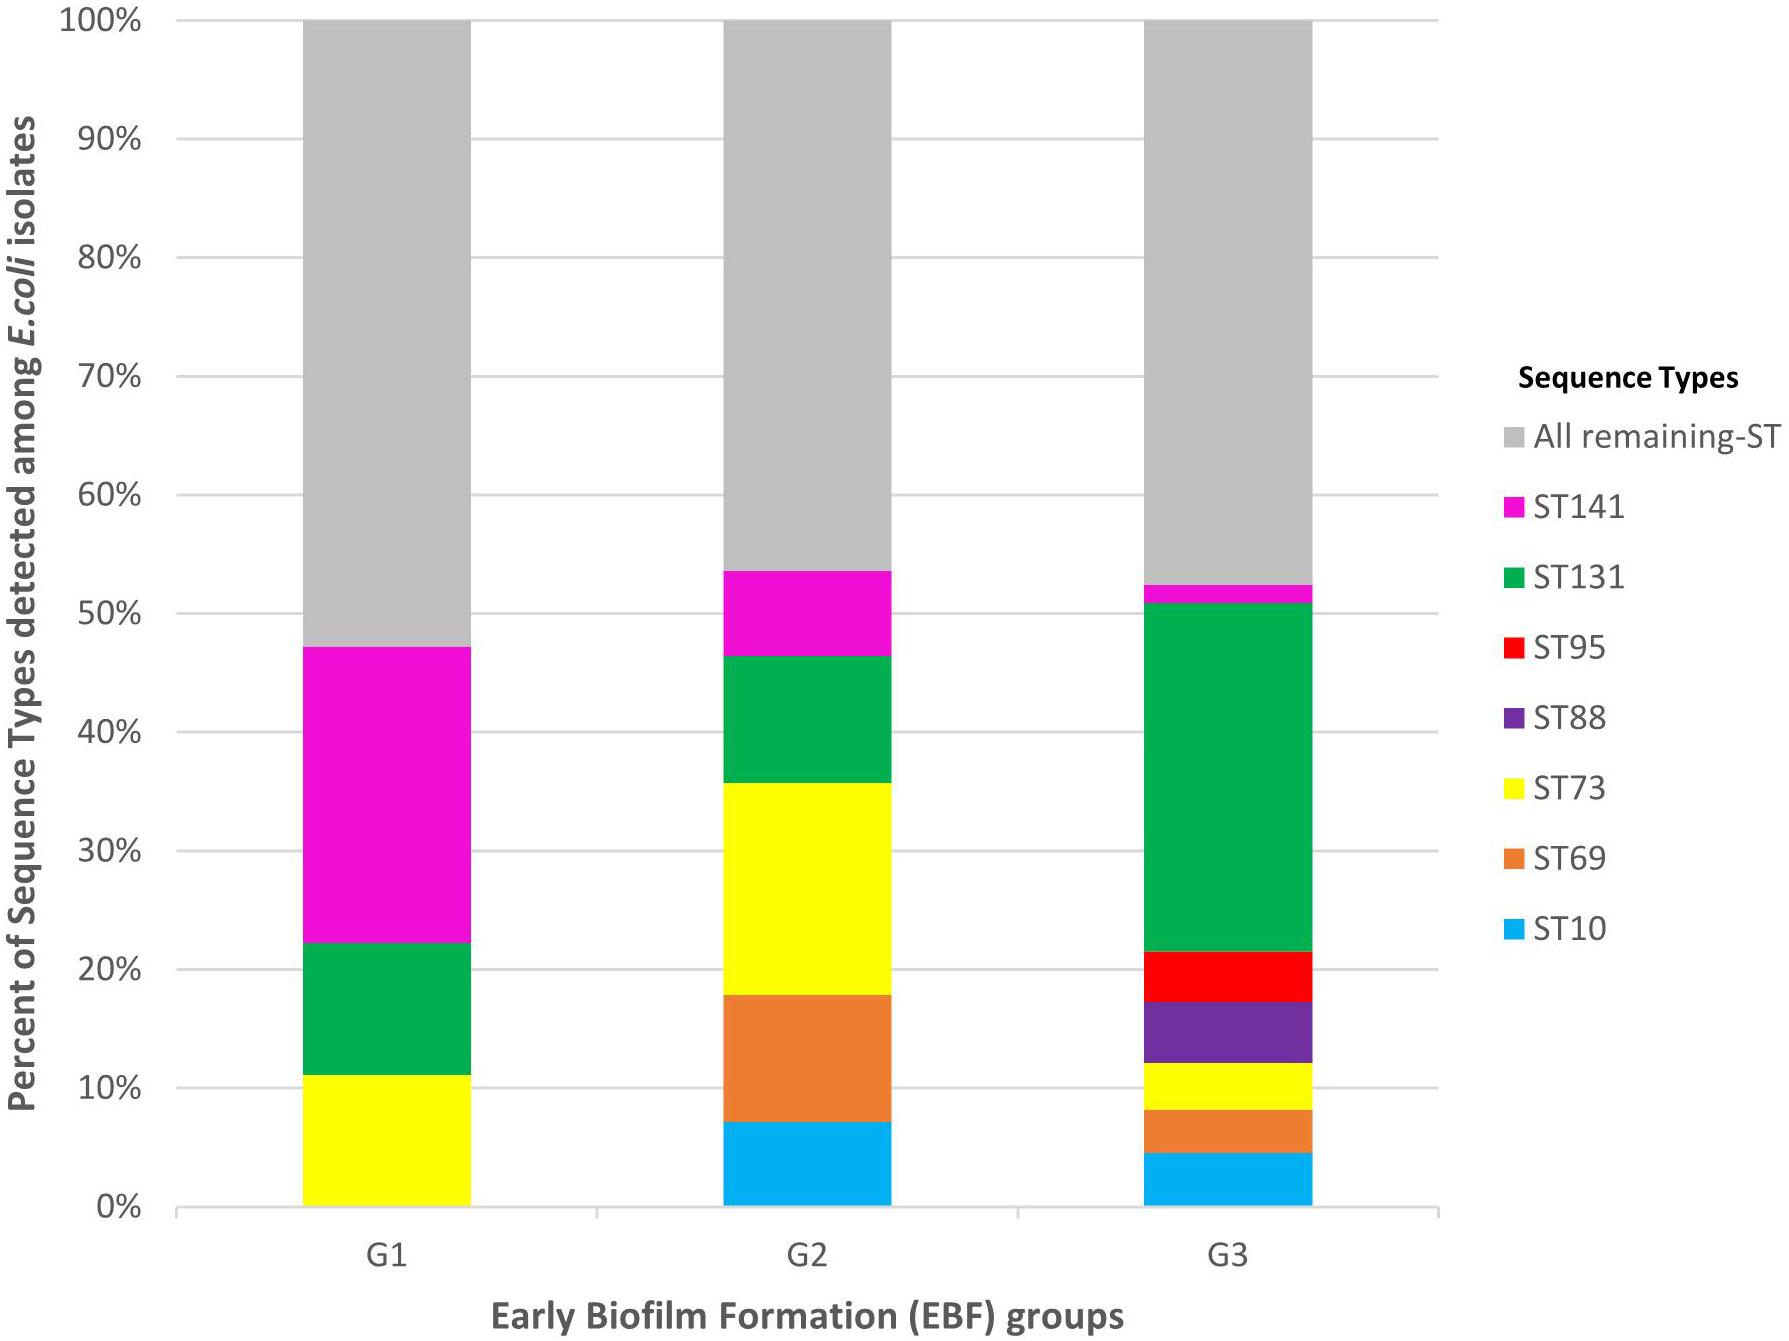
Figure 3. Distribution of the most frequent sequence types (STs) among G1, G2, and G3 isolates. G1: strong producers, G2: moderate producers, and G3: weak producers. ST141 was more frequent among G1 isolates than among G3 (25.0 vs. 1.5%, P < 0.0001). By contrast, ST131 was significantly more frequent among G3 isolates than among G1 isolates (29.4 vs. 11.1%, P = 0.0289).
Clones
A total of 153 clones were identified among the 394 isolates, with 31 of them including at least 3 isolates (Figure 4 and Supplementary Table S3) and 6 including at least 10 isolates: B2-CH40-30-ST131 (87 isolates), D-CH35-27-ST69 (14 isolates), B2-CH52-5-ST141 (13 isolates), C-CH4-39-ST88 (11 isolates), A-CH11-54-ST10 (10 isolates), and B2-CH40-41 ST131 (10 isolates). The 36 G1 isolates belonged to 26 clones (Supplementary Table S4). These 26 clones were also found in 25% of the G2 isolates (P < 0.0001) and in only 5.2% of the G3 isolates (P < 0.0001) (Supplementary Table S4).
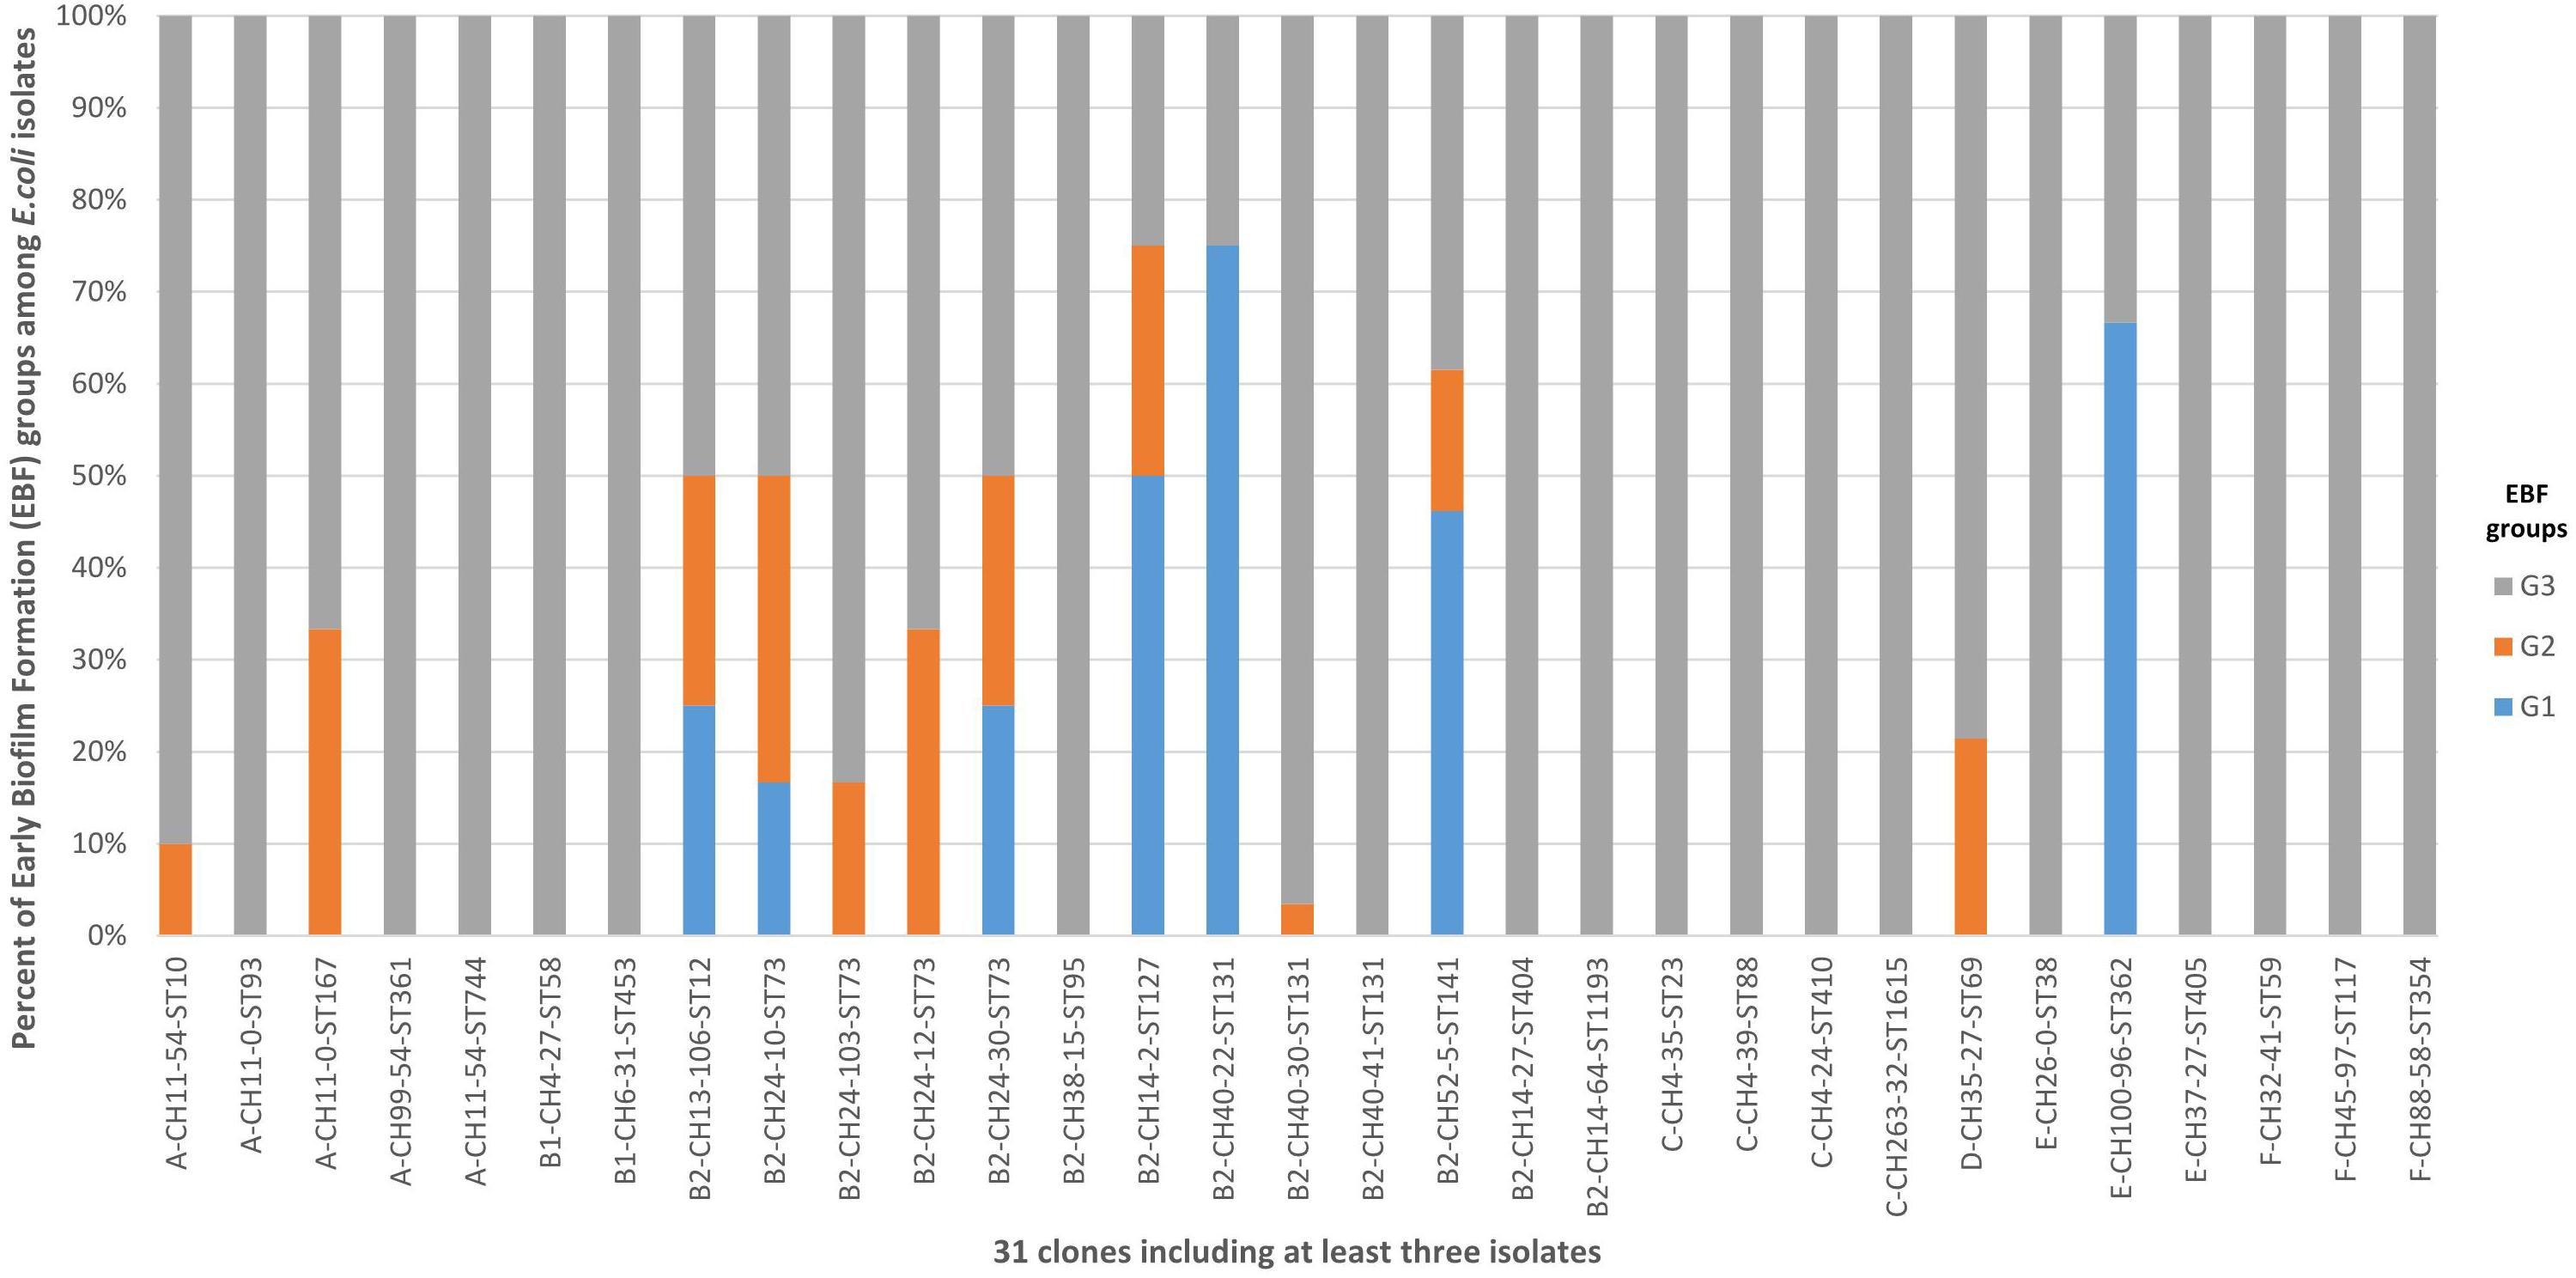
Figure 4. Distribution of the 31 clones including at least three isolates among G1, G2, and G3. G1: strong producers, G2: moderate producers, and G3: weak producers. Five clones (B2-CH14-2-ST127, B2-CH40-22-ST131, B2-CH52-5-ST14, B2-CH52-14-ST141, and E-CH100-96-ST362) were associated with G1 and accounted for 41.7% of G1 isolates, 10.7% of G2 isolates (P = 0.0105), and 2.4% of G3 isolates (P < 0.0001). Only the B2-CH40-30-ST131 clone was associated with G3, accounting for 25.5% of G3 isolates, 10.7% of G2 isolates (P = 0.1068), and 0% of G1 isolates (P < 0.0001).
Five clones (B2-CH14-2-ST127, B2-CH40-22-ST131, B2-CH52-5-ST14, B2-CH52-14-ST141, and E-CH100-96-ST362) were associated with G1 and accounted for 41.7% of G1 isolates, 10.7% of G2 isolates (P = 0.0105), and 2.4% of G3 isolates (P < 0.0001) (Supplementary Table S3). Only the B2-CH40-30-ST131 clone was associated with G3, accounting for 25.5% of G3 isolates, 10.7% of G2 isolates (P = 0.1068), and 0% of G1 isolates (P < 0.0001) (Supplementary Table S3).
Comparison of the Virulence Factor (VF)-Encoding Genes Among G1, G2, and G3 Isolates
As indicated in Table 2, some VF-encoding genes were mostly observed among G1. These genes consisted of genes encoding adhesins (papAH, papC, papEF, sfa/focDE, and yfcV), genes encoding toxins (cnf1, hlyA, and vat), genes encoding two variants of group II capsule (kpsM II-K5 and neuC-K1), and miscellaneous genes (ibeA, malX, and ups). Inversely, the sat and traT genes were mostly observed among G3 isolates. Concerning the genes encoding proteins involved in iron uptake, those encoding ferric aerobactin receptors (iucD and iutA) were significantly more frequent among G3 isolates than among G1 isolates, whereas it was the contrary for the iroN and chuA genes. Mean of VF-encoding genes was significantly higher among G1 isolates than among G3 isolates (13.8 vs. 10.4, P < 0.001).
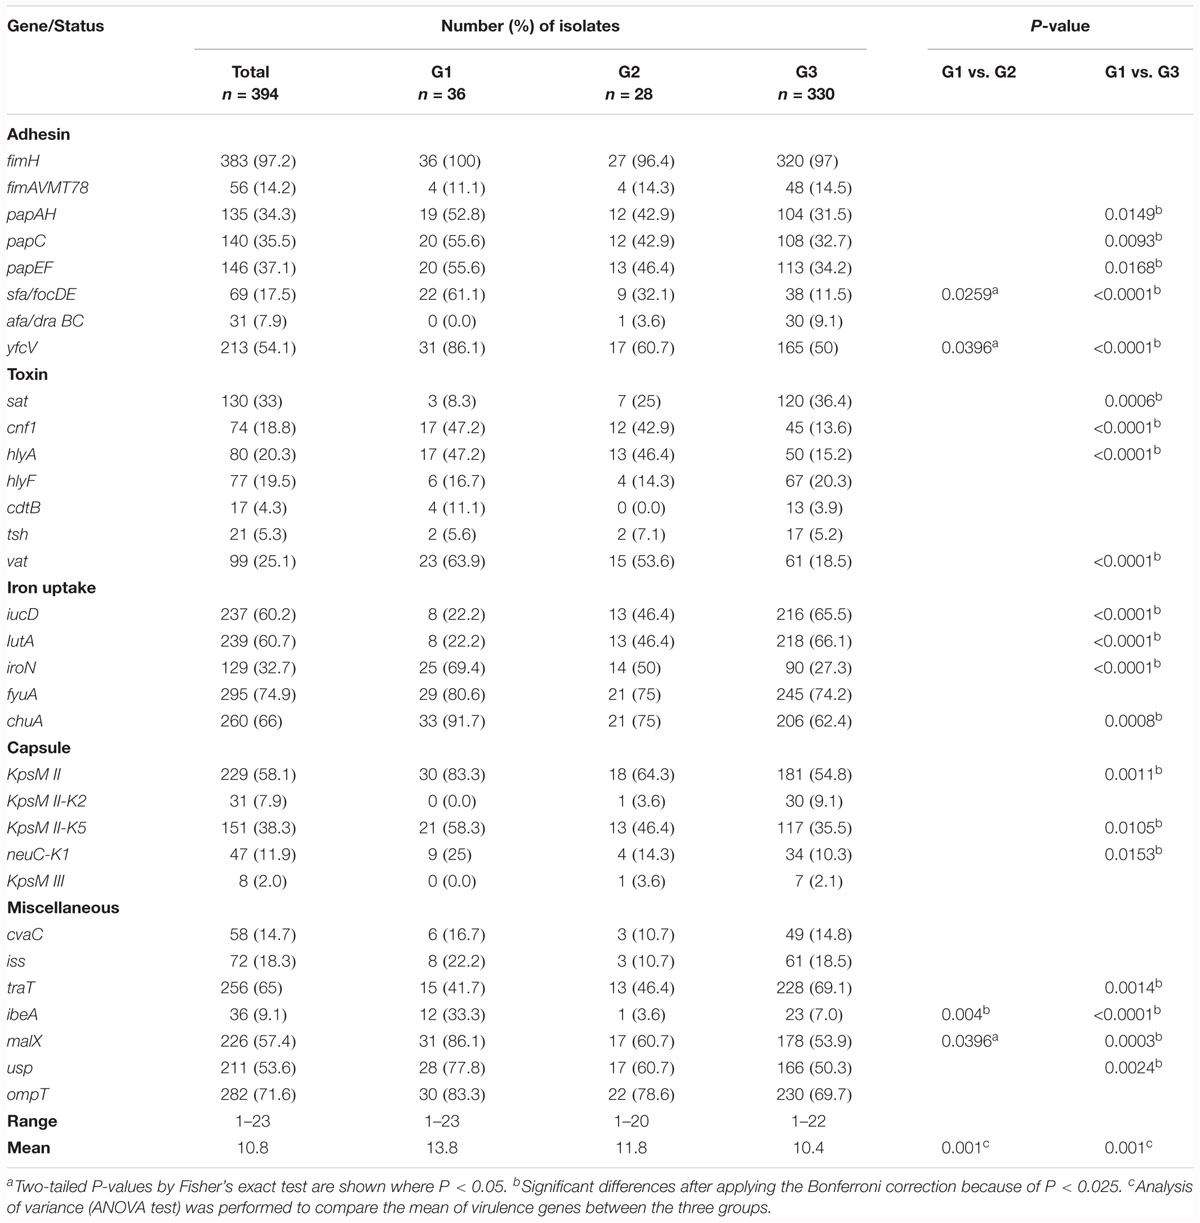
Table 2. Virulence factor-encoding genes displayed by G1, G2, and G3 isolates.
fimB Alleles
Given that the ST131 clone with a fimH30 allele was the dominant clone among our E. coli population and that previous results had shown (i) an IS3-like-linked defective fimB gene encoding a co-factor of the regulation of the type 1 fimbriae synthesis in this clone (Totsika et al., 2011) and (ii) the key role played by type 1 fimbriae in promoting biofilm formation in this clone (Sarkar et al., 2016), we analyzed the fimB gene in 127 isolates randomly selected among the 394 isolates. PCR experiments showed no fimB amplicon in 10 (7.9%) isolates (Supplementary Table S5) belonging to the following clones: A-CH11-0-ST93 (n = 2), A-CH11-0-ST167 (n = 1), A-CH99-54-ST361 (n = 1), A-CH7-53-ST540 (n = 1), A-CH7-54-ST540 (n = 1), A-CH4-0-ST1284 (n = 1), B1-CH4-0-ST155 (n = 1), B2-CH38-92-ST421 (n = 1), and E-CH26-0-ST38 (n = 1). An expected amplicon was detected in 89 (70.1%) isolates and an amplicon with a higher size was detected in 28 (22.0%) isolates (Supplementary Table S5). Sequencing experiments showed the insertion of IS3-like in the fimB gene in these 28 (22%) isolates comprising 25 of the 26 selected CH40-30 ST131 isolates and the three selected CH24-30 ST73 isolates. Overall, an intact fimB gene was significantly more frequent among G1 isolates than among G3 isolates (P = 0.03) (Supplementary Table S5).
Through fimB gene sequencing of the 89 isolates with an expected fimB amplicon, 34 fimB alleles were detected (Supplementary Table S6), of which 11 new variants compared with those currently registered in the GenBank database. These 34 alleles encoded 10 FimB proteins (P1 to P10) (Supplementary Table S6). Phylogenetic tree built with these 10 proteins (Supplementary Figure S2) revealed two large clusters. One of these clusters included the 14 alleles encoding FimB P1 and the other one included the eight alleles encoding FimB P2. FimB P2 and the closely related FimB P3 (Supplementary Figure S2) were associated with G1 and accounted for 69.2% of G1 isolates vs. 10.6% of G3 isolates (P < 0.0001). Inversely, FimB P1 was associated with G3, accounting for 69.7% of G3 isolates vs. 23.1% of G1 isolates (P = 0.0023) (Figure 5 and Supplementary Table S7).
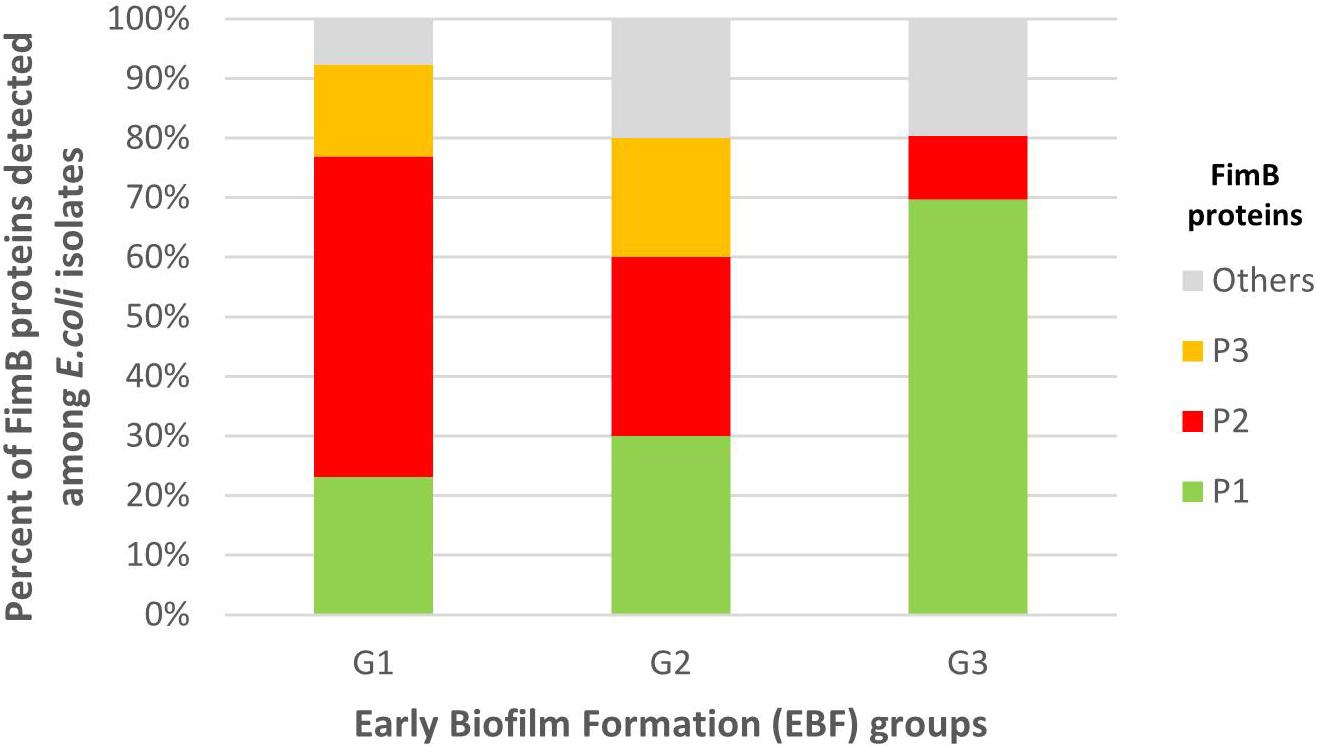
Figure 5. Distribution of the FimB protein (P) variants among G1, G2, and G3 isolates. G1: strong producers, G2: moderate producers, and G3: weak producers. FimB P2 and the closely related FimB P3 were associated with G1 and accounted for 69.2% of G1 isolates vs. 10.6% of G3 isolates (P < 0.0001). Inversely, FimB P1 was associated with G3 accounting for 69.7% of G3 isolates vs. 23.1% of G1 isolates (P = 0.0023).
Correlation Between Biofilm Production and Bacterial Characteristics
The one-way ANOVA test using the individual BFI of 394 isolates showed that clonal lineage explained 72% of the EBF variability and FimB, 28%. Among the VF-encoding genes significantly associated with biofilm production, the sfa/focDE, cnf1, hlyA, vat, and iroN genes were those explaining from 8 to 16% of the variability of early biofilm production. Isolate source was not associated with the EBF.
Discussion
Our study that assessed the early biofilm production, i.e., adhesion stage of 394 E. coli clinical isolates obtained from different sources, at the same time periods, in two distant hospitals (Spanish and French hospitals), is in accordance with previous studies with regard to the wide spectrum of biofilm formation within ExPEC (Ponnusamy et al., 2012; Agarwal et al., 2013; Mostafavi et al., 2018). Using the BioFilm Ring Test® like us, Olivares et al. (2016) found that P. aeruginosa causing infection in cystic fibrosis patients segregated into three groups (strong, moderate, and weak producers) at the early stage of biofilm formation. Accordingly, difference in ability to quickly adhere seems to exist within isolates of different bacterial species. The biofilm production displayed by our ESBLEC collection is also in accordance with that displayed by the ESBLEC collection recently published by Surgers et al. (2018), i.e., predominance of weak biofilm producers among ESBLEC.
The novelty provided by our study consisted of the molecular characterization of the 394 isolates with regard to phylogroups, clonal lineages, VF-encoding genes, and FimB, a co-factor of the regulation of the synthesis of type 1 fimbriae that are critical adhesins for E. coli biofilm formation (Beloin et al., 2008). Thus, we showed that among the characteristics significantly associated with EBF, clonal lineage was the most suitable characteristics to explain the variability of EBF. Association between clonal lineage and EBF phenotype has recently been shown among bone and joint infection Staphylococcus aureus isolates analyzed by using the BioFilm Ring Test® (Tasse et al., 2018).
Among the limited number (<10%) of our E. coli that quickly and persistently produced early biofilm at high levels (G1 isolates), five clones (B2-CH14-2-ST127, CH52-5, and CH52-14 sub-lineages of B2-ST141, B2-CH40-22-ST131, and E-CH100-96-ST362) accounted for 41.7% of the 36 G1 isolates. Notable features have previously been provided by different studies for these clones. The B2-ST127 clone, which is one of the dominant clones among uropathogenic isolates (Yamaji et al., 2018), was shown to be shared by humans, dogs, and cats (Johnson et al., 2008) and to be a dominant gut colonizer of humans (Ulleryd et al., 2015) and fruit bats (Nowak et al., 2017). The B2-ST141 clone was characterized by Clermont et al. (2017) as a commensal clone, i.e., digestive tract resident with low level of human invasiveness, through a study assessing the pathogenesis of bacteriaemic E. coli by matching large collections of bacteriaemic (Lefort et al., 2011) and commensal isolates (Massot et al., 2016). Other studies showed that this clone accounted for the gut dominant E. coli population of some healthy subjects (Leflon-Guibout et al., 2008; Nicolas-Chanoine et al., 2013) and was one of the dominant clones in the digestive tract of Antarctic pinnipeds (Mora et al., 2018). The B2-CH40-22 ST131 clone was shown to have similar features to the B2-CH52-5 ST141 clone with regard to healthy subjects (Nicolas-Chanoine et al., 2017) and Antarctic pinnipeds (Mora et al., 2018). It was also found in poultry digestive tract and retail chicken meat and was shown to be a foodborne uropathogen (Liu et al., 2018). Concerning the E-CH100-96 ST362 clone, our study is, to our knowledge, the first one reporting the presence of this clone in humans. Indeed, it was identified so far in chicken (Cortes et al., 2010) and as an agent causing bovine mastitis (Freitag et al., 2017). Accordingly, most of these clones appear to be both ExPEC and intestinal dominant colonizers in some mammals and birds.
We found that some VF genes, including papC, sfa/focDE, cnf1, hlyA, and ibeA, were mostly identified in G1 isolates, i.e., strong biofilm producers. All these VFs had already been shown to be associated with E. coli strong biofilm producers (Naves et al., 2008), and two of them, sfa/focDE and ibeA, had been shown to be characteristic traits of adherent/invasive E. coli (AIEC) that are strong biofilm producers (Martinez-Medina et al., 2009b). The implication of AIEC in Crohn’s disease (Darfeuille-Michaud et al., 2004) was notably based on their high biofilm production. Indeed, in an inflamed intestinal environment, their biofilm-related mucosal attachment could allow them to penetrate the inner mucus layer and adhere to the epithelial surface, thus enabling more direct stimulation of epithelial and immune cells (Glasser et al., 2001; Ellermann and Sartot, 2018). It is interesting to note here that Martinez-Medina et al. (2009a) found two ST131 isolates carrying the ibeA gene in the AIEC collection that they compared with ExPEC isolates. This finding suggests that it would be of interest to investigate all the AIEC phenotypic and genotypic features in our strong biofilm producers (Camprubí-Font et al., 2019).
The present study in which a wide collection of E. coli isolates was analyzed confirms the results that we previously obtained with few isolates about the difference in early biofilm production between B2-CH40-22 ST131 and B2-CH40-30-ST131 clones, i.e., strong and weak production, respectively (Nicolas-Chanoine et al., 2017). Knowing that the B2-CH40-22 ST131 clone is the ancestor of the globally disseminated B2-CH40-30-ST131 clone (Ben Zakour et al., 2016), the loss of the ability to strongly produce biofilm at the early step of biofilm formation by the B2-CH40-30-ST131 clone could appear as an evolutionary adaptative trait in ST131 lineage.
In conclusion, this study highlights that the ability to quickly and persistently produce biofilm at high levels is a property displayed by a limited number of clones, some of which have been found in previous studies as dominant colonizers in some mammals and birds.
Ethics Statement
Ethics approval was not required according to national and institutional guidelines.
Author Contributions
S-CF-S carried out biofilm assay and strain molecular characterizations, collected and analyzed the all data, and participated in manuscript writing. MD and NM collected and phenotypically characterized the French clinical isolates, and participated in both biofilm assay and strain molecular characterizations. VG participated in strain molecular characterizations. MA participated in isolation and characterization of the Spanish clinical isolates. JB supervised the strain molecular analyses, data collection, and statistical analyses, and participated in manuscript writing. M-HN-C designed the research, supervised the overall project, and wrote the manuscript. All authors provided critical input and approved the manuscript submission.
Funding
This study was supported by grants received by the Spanish team from (i) projects PI16/01477 from Plan Estatal de I+D+I 2013–2016, Instituto de Salud Carlos III, Subdirección General de Evaluación y Fomento de la Investigación, Ministerio de Economía y Competitividad (MINECO, Spain); (ii) Fondo Europeo de Desarrollo Regional (FEDER); and (iii) ED431C 2017/57 (Grupos de referencia competitiva) from the Consellería de Cultura, Educación e Ordenación Universitaria and Consellería de Economía, Emprego e Industria (Xunta de Galicia) and FEDER. It was also supported by a grant received by the French team from Project JPI-EC-AMR 2016, with l’Agence Nationale de la Recherche (France) as sponsor (No. ANR-16-JPEC-0002-04).
Conflict of Interest Statement
The authors declare that the research was conducted in the absence of any commercial or financial relationships that could be construed as a potential conflict of interest.
Acknowledgments
S-CF-S thanks the Secretaría General de Universidades, Spanish Ministerio de Educación, Cultura y Deporte, Gobierno de España for providing her with a grant from the FPU program (FPU15/02644). VG thanks the Consellería de Cultura, Educación e Ordenación Universitaria and Consellería de Economía, Emprego e Industria (Xunta de Galicia) for providing her with a grant from ED481B 2018/018; axuda á etapa de formación posdoutoral nas universidades do SUG. The authors also thank Delphine Bachelet for assistance in statistic interpretation.
Supplementary Material
The Supplementary Material for this article can be found online at: https://www.frontiersin.org/articles/10.3389/fmicb.2019.01183/full#supplementary-material
Footnotes
References
Agarwal, J., Mishra, B., Srivastava, S., and Srivastava, R. (2013). Genotypic characteristics and biofilm formation among Escherichia coli isolates from Indian women with acute cystitis. Trans. R. Soc. Trop. Med. Hyg. 107, 183–187. doi: 10.1093/trstmh/trs090
Beloin, C., Roux, A., and Ghigo, J. M. (2008). Escherichia coli biofilms. Curr. Top. Microbiol. Immunol. 322, 249–289. doi: 10.1007/978-3-540-75418-3_12
Ben Zakour, N. L., Alsheikh-Hussain, A. S., Ashcroft, M. M., Khanh Nhu, N. T., Roberts, L. W., Stanton-Cook, M., et al. (2016). Sequential acquisition of virulence and fluoroquinolone resistance has shaped the evolution of Escherichia coli ST131. mBio 7:e347-16. doi: 10.1128/mBio.00347-16
Bland, J. M., and Altman, D. G. (1986). Statistical methods for assessing agreement between two methods of clinical measurement. Lancet 1, 307–310. doi: 10.1016/s0140-6736(86)90837-8
Camprubí-Font, C., Ewers, C., Lopez-Siles, M., and Martinez-Medina, M. (2019). Genetic and phenotypic features to screen for putative adherent-invasive. Escherichia coli. Front. Microbiol. 10:108. doi: 10.3389/fmicb.2019.00108
Chavant, P., Gaillard-Martinie, B., Talon, R., Hebraud, M., and Bernardi, T. (2007). A new device for rapid evaluation of biofilm formation potential by bacteria. J. Microbiol. Methods 68, 605–612. doi: 10.1016/j.mimet.2006.11.010
Clermont, O., Christenson, J. K., Denamur, E., and Gordon, D. M. (2013). The Clermont Escherichia coli phylo-typing method revisited: Improvement of specificity and detection of new phylo-groups. Environ. Microbiol. Rep. 5, 58–65. doi: 10.1111/1758-2229.12019
Clermont, O., Couffignal, C., Blanco, J., Mentré, F., Picard, B., Denamur, E., et al. (2017). Two levels of specialization bacteriaemic Escherichia coli strains revealed by their comparison with commensal strains. Epidemiol. Infect. 145, 872–882. doi: 10.1017/S0950268816003010
Cortes, P., Blanc, V., Mora, A., Dahbi, G., Blanco, J. E., Blanco, M., et al. (2010). Isolation and characterization of potentially pathogenic antimicrobial-resistant Escherichia coli strains from chicken and pig farms in Spain. Appl. Environ. Microbiol. 76, 2799–2805. doi: 10.1128/AEM.02421-09
Costerton, J. W., Geesey, G. G., and Cheng, K. J. (1978). How bacteria stick. Sci. Am. 238, 86–95. doi: 10.1038/scientificamerican0178-86
Darfeuille-Michaud, A., Boudeau, J., Bulois, P., Neut, C., Glasser, A.-L., Barnich, N., et al. (2004). High prevalence of adherent-invasive Escherichia coli associated with ileal mucosa in Crohn’s disease. Gastroenterology 127, 412–421. doi: 10.1053/j.gastro.2004.04.061
Di Domenico, E. G., Toma, L., Provot, C., Ascenzioni, F., Sperduti, I., Prignano, G., et al. (2016). Development of an in vitro assay, based on the biofilm ring test, for rapid profiling of biofilm-growing bacteria. Front. Microbiol. 7:1429. doi: 10.3389/fmicb.2016.01429
Ellermann, M., and Sartot, R. B. (2018). Intestinal bacterial biofilms modulate mucosal immune responses. J. Immunol. Sci. 2, 13–18. doi: 10.29245/2578-3009/2018/2.1122
Freitag, C., Michael, G. B., Kadlec, K., Hassel, M., and Schwarz, S. (2017). Detection of plasmid-borne extended-spectrum β-lactamase (ESBL) genes in Escherichia coli isolates from bovine mastitis. Vet. Microbiol. 200, 151–156. doi: 10.1016/j.vetmic.2016.08.010
Glasser, A. L., Boudeau, J., Barnich, N., Perruchot, M. H., Colombel, J. F., and Darfeuille-Michaud, A. (2001). Adherent invasive Escherichia coli strains from patients with Crohn’s disease survive and replicate within macrophages without inducing host cell death. Infect. Immun. 69, 5529–5537. doi: 10.1128/iai.69.9.5529-5537.2001
Hall-Stoodley, L., Costerton, J. W., and Stoodley, P. (2004). Bacterial biofilms: from the natural environment to infectious diseases. Nat. Rev. Microbiol. 2, 95–108. doi: 10.1038/nrmicro821
Høiby, N., Ciofu, O., and Bjarnsholt, T. (2010). Pseudomonas aeruginosa biofilms in cystic fibrosis. Future Microbiol. 5, 1663–1674. doi: 10.2217/fmb.10.125
Høiby, N., Ciofu, O., Johansen, H. K., Song, Z., Moser, C., Jensen, P. Ø, et al. (2011). The clinical impact of bacterial biofilms. Int. J. Oral Sci. 3, 55–65. doi: 10.4248/IJOS11026
Hussain, A., Ranjan, A., Nandanwar, N., Babbar, A., Jadhav, S., and Ahmed, N. (2014). Genotypic and phenotypic profiles of Escherichia coli isolates belonging to clinical sequence type 131 (ST131), clinical non-ST131, and fecal non-ST131 lineages from India. Antimicrob. Agents Chemother. 58, 7240–7249. doi: 10.1128/AAC.03320-14
Jarlier, V., Nicolas, M. H., Fournier, G., and Philippon, A. (1988). Extended broad-spectrum β-lactamases conferring transferable resistance to newer β-lactam agents in Enterobacteriaceae: hospital prevalence and susceptibility patterns. Rev. Infect. Dis. 10, 867–878. doi: 10.1093/clinids/10.4.867
Johnson, J. R., Johnston, B., Clabots, C. R., Kuskowski, M. A., Roberts, E., and DebRoy, C. (2008). Virulence genotypes and phylogenetic background of Escherichia coli serogroup O6 isolates from humans, dogs, and cats. J. Clin. Microbiol. 46, 417–422. doi: 10.1128/JCM.00674-07
Leflon-Guibout, V., Blanco, J., Amaqdouf, K., Mora, A., Guize, L., and Nicolas-Chanoine, M. H. (2008). Absence of CTX-M enzymes but high prevalence of clones, including clone ST131, among fecal Escherichia coli isolates from healthy subjects living in the area of Paris. France J. Clin. Microbiol. 46, 3900–3905. doi: 10.1128/JCM.00734-08
Lefort, A., Panhard, X., Clermont, O., Woerther, P. L., Branger, C., Mentre, F., et al. (2011). Host factors and portal of entry overcome bacterial determinants to predict the severity of Escherichia coli bacteremia. J. Clin. Microbiol. 49, 777–783. doi: 10.1128/JCM.01902-10
Liu, C. M., Stegger, M., Aziz, M., Johnson, T. J., Waits, K., Nordstrom, L., et al. (2018). Escherichia coli ST131-H22 as a foodborne uropathogen. mBio 9:e470-18. doi: 10.1128/mBio.00470-18
Martinez-Medina, M., Mora, A., Blanco, M., Lopez, C., Alonso, M. P., Bonacorsi, S., et al. (2009a). Similarity and divergence among adherent-invasive Escherichia coli and extraintestinal pathogenic E. coli strains. J. Clin. Microbiol. 47, 3968–3979. doi: 10.1128/JCM.01484-09
Martinez-Medina, M., Naves, P., Blanco, J., Aldeguer, X., Blanco, J. E., Blanco, M., et al. (2009b). Biofilm formation as a novel phenotypic feature of adherent-invasive Escherichia coli (AIEC). BMC Microbiol. 9:202. doi: 10.1186/1471-2180-9-202
Massot, M., Daubié, A.-S., Jauréguy, F., Couffignal, C., Dahbi, G., Mora, A., et al. (2016). Phylogenetic, virulence and antibiotic resistance characteristics of commensal strain populations of Escherichia coli from community subjects in the Paris area in 2010 and evolution over 30 years. Microbiology 162, 642–650. doi: 10.1099/mic.0.000242
Mora, A., Garcia-Pena, F. J., Alonso, M. P., Pedraza-Diaz, S., Ortega-Mora, L. M., Garcia-Parraga, D., et al. (2018). Impact of human-associated clonal groups in antartic pinnepeds: presence of ST73, ST95, ST141 and ST131. Sci. Rep. 8:4678. doi: 10.1038/s41598-018-22943-0
Mostafavi, S. K. S., Najar-Peerayeh, S., Mobarez, A. M., and Parizi, M. K. (2018). Detection of virulence factors, phylogroups, serogroups and biofilm formation among CTX-M-1 positive Escherichia coli isolated from patients with pyelonephritis. Biomed. Res. 29, 1543–1549.
Naves, P., del Prado, G., Huelves, L., Gracia, M., Ruiz, V., Blanco, J., et al. (2008). Correlation between virulence factors and in vitro biofilm formation by Escherichia coli strains. Microb. Pathog. 45, 86–91. doi: 10.1016/j.micpath.2008.03.003
Nicolas-Chanoine, M.-H., Bertrand, X., and Madec, J.-Y. (2014). Escherichia coli ST131, an intriguing clonal group. Clin. Microbiol. Rev. 27, 543–574. doi: 10.1128/CMR.00125-13
Nicolas-Chanoine, M.-H., Gruson, C., Bialek-Davenet, S., Bertrand, X., Thomas-Jean, F., Bert, F., et al. (2013). 10-Fold increase (2006–11) in the rate of healthy subjects with extended-spectrum β-lactamase-producing Escherichia coli faecal carriage in a Parisian check-up centre. J. Antimicrob. Chemother. 68, 562–568. doi: 10.1093/jac/dks429
Nicolas-Chanoine, M.-H., Petitjean, M., Mora, A., Mayer, N., Lavigne, J.-P., Boulet, O., et al. (2017). The ST131 Escherichia coli H22 subclone from human intestinal microbiota: comparison of genomic and phenotypic traits with those of the globally successful H30 subclone. BMC Microbiol. 17:71. doi: 10.1186/s12866-017-0984-8
Novais, A., Pires, J., Ferreira, H., Costa, L., Montenegro, C., Vuotto, C., et al. (2012). Characterization of globally spread Escherichia coli ST131 isolates (1991 to 2010). Antimicrob. Agents Chemother. 56, 3973–3976. doi: 10.1128/AAC.00475-12
Nowak, K., Fahr, J., Weber, N., Lübke-Becker, A., Semmler, T., Weiss, S., et al. (2017). Highly diverse and antimicrobial susceptible Escherichia coli display a naïve bacterial population in fruit bats from the republic of congo. PLoS One 12:e0178146. doi: 10.1371/journal.pone.0178146
Olivares, E., Badel-Berchoux, S., Provot, C., Jaulhac, B., Prévost, G., Bernardi, T., et al. (2016). The biofilm ring test: a rapid method for routine analysis of Pseudomonas aeruginosa biofilm formation kinetics. J. Clin. Microbiol. 54, 657–661. doi: 10.1128/JCM.02938-15
Ponnusamy, P., Natarajan, V., and Sevanan, M. (2012). In vitro biofilm formation by uropathogenic Escherichia coli and their antimicrobial susceptibility pattern. Asian Pac. J. Trop. Med. 5, 210–213. doi: 10.1016/S1995-7645(12)60026-1
Sabaté Brescó, M., Harris, L. G., Thompson, K., Stanic, B., Morgenstern, M., O’Mahony, L., et al. (2017). Pathogenic mechanisms and host interactions in Staphylococcus epidermidis device-related infection. Front. Microbiol. 8:1401. doi: 10.3389/fmicb.2017.01401
Sarkar, S., Vagenas, D., Schembri, M. A., and Totsika, M. (2016). Biofilm formation by multidrug resistant Escherichia coli ST131 is dependent on type 1 fimbriae and assay conditions. Pathog. Dis. 74:ftw013. doi: 10.1093/femspd/ftw013
Schiebel, J., Böhm, A., Nitschke, J., Burdukiewicz, M., Weinreich, J., Ali, A., et al. (2017). Genotypic and phenotypic characteristics associated with biofilm formation by human clinical Escherichia coli isolates of different pathotypes. Appl. Environ. Microbiol. 83:e1660-17. doi: 10.1128/AEM.01660-17
Sheikh, J., Hicks, S., Dall’Agnol, M., Phillips, A. D., and Nataro, J. P. (2001). Roles for fis and yafk in biofilm formation by enteroaggregative Escherichia coli. Mol. Microbiol. 41, 983–997. doi: 10.1046/j.1365-2958.2001.02512.x
Sherlock, O., Schembri, M. A., Reisner, A., and Klemm, P. (2004). Novel roles for the AIDA adhesin from diarrheagenic Escherichia coli: cell aggregation and biofilm formation. J. Bacteriol. 186, 8058–8065. doi: 10.1128/JB.186.23.8058-8065.2004
Surgers, L., Boyd, A., Girard, P.-M., Arlet, G., and Decré, D. (2018). Biofilm formation by ESBL-producing strains of Escherichia coli and Klebsiella pneumoniae. Int. J. Med. Microbiol. 309, 13–18. doi: 10.1016/j.ijmm.2018.10.008
Tapiainen, T., Hanni, A.-M., Salo, J., Ikäheimo, I., and Uhari, M. (2014). Escherichia coli biofilm formation and recurrences of urinary tract infections in children. Eur. J. Clin. Microbiol. Infect. Dis. Off. Publ. Eur. Soc. Clin. Microbiol. 33, 111–115. doi: 10.1007/s10096-013-1935-4
Tasse, J., Trouillet-Assant, S., Josse, J., Martins-Simões, P., Valour, F., Langlois-Jacques, C., et al. (2018). Association between biofilm formation phenotype and clonal lineage in Staphylococcus aureus strains from bone and joint infections. PLoS One 13:e0200064. doi: 10.1371/journal.pone.0200064
Totsika, M., Beatson, S. A., Sarkar, S., Phan, M. D., Petty, N. K., Bachmann, N., et al. (2011). Insights into a multidrug resistant Escherichia coli pathogen of the globally disseminated ST131 lineage: Genome analysis and virulence mechanisms. PLoS One 6:e26578. doi: 10.1371/journal.pone.0026578
Ulleryd, P., Sandberg, T., Scheutz, F., Clabots, C., Johnston, B. D., Thuras, P., et al. (2015). Colonization with Escherichia coli strains among female sex partners of men with febrile urinary tract infection. J. Clin. Microbiol. 53, 1947–1950. doi: 10.1128/JCM.00579-15
Watts, R. E., Hancock, V., Ong, C.-L. Y., Vejborg, R. M., Mabbett, A. N., Totsika, M., et al. (2010). Escherichia coli isolates causing asymptomatic bacteriuria in catheterized and noncatheterized individuals possess similar virulence properties. J. Clin. Microbiol. 48, 2449–2458. doi: 10.1128/JCM.01611-09
Weissman, S. J., Johnson, J. R., Tchesnokova, V., Billig, M., Dykhuizen, D., Riddell, K., et al. (2012). High-resolution two-locus clonal typing of extraintestinal pathogenic Escherichia coli. Appl. Environ. Microbiol. 78, 1353–1360. doi: 10.1128/AEM.06663-11
Keywords: E. coli, early biofilm formation, phenotypes, virulence factors, clones, ST131, ST127, ST141
Citation: Flament-Simon S-C, Duprilot M, Mayer N, García V, Alonso MP, Blanco J and Nicolas-Chanoine M-H (2019) Association Between Kinetics of Early Biofilm Formation and Clonal Lineage in Escherichia coli. Front. Microbiol. 10:1183. doi: 10.3389/fmicb.2019.01183
Received: 06 February 2019; Accepted: 09 May 2019;
Published: 31 May 2019.
Edited by:
Giovanna Batoni, University of Pisa, ItalyReviewed by:
David Šmajs, Masaryk University, CzechiaMinh Duy Phan, The University of Queensland, Australia
Copyright © 2019 Flament-Simon, Duprilot, Mayer, García, Alonso, Blanco and Nicolas-Chanoine. This is an open-access article distributed under the terms of the Creative Commons Attribution License (CC BY). The use, distribution or reproduction in other forums is permitted, provided the original author(s) and the copyright owner(s) are credited and that the original publication in this journal is cited, in accordance with accepted academic practice. No use, distribution or reproduction is permitted which does not comply with these terms.
*Correspondence: Marie-Hélène Nicolas-Chanoine, marie-helene.nicolas-chanoine@inserm.fr