Automated measurement and grading of knee cartilage thickness: a deep learning-based approach
 JiangRong Guo1
  Pengfei Yan2
  Yong Qin1
  MeiNa Liu3
  Yingkai Ma1 JiangQi Li2 Ren Wang1 Hao Luo2* Songcen Lv1*
- 1Department of Orthopedics and Sports Medicine, The Second Affiliated Hospital of Harbin Medical University, Harbin, Heilongjiang, China
- 2Department of Control Science and Engineering, Harbin Institute of Technology, Harbin, Heilongjiang, China
- 3Department of Biostatistics, School of Public Health, Harbin Medical University, Harbin, Heilongjiang, China
Background: Knee cartilage is the most crucial structure in the knee, and the reduction of cartilage thickness is a significant factor in the occurrence and development of osteoarthritis. Measuring cartilage thickness allows for a more accurate assessment of cartilage wear, but this process is relatively time-consuming. Our objectives encompass using various DL methods to segment knee cartilage from MRIs taken with different equipment and parameters, building a DL-based model for measuring and grading knee cartilage, and establishing a standardized database of knee cartilage thickness.
Methods: In this retrospective study, we selected a mixed knee MRI dataset consisting of 700 cases from four datasets with varying cartilage thickness. We employed four convolutional neural networks—UNet, UNet++, ResUNet, and TransUNet—to train and segment the mixed dataset, leveraging an extensive array of labeled data for effective supervised learning. Subsequently, we measured and graded the thickness of knee cartilage in 12 regions. Finally, a standard knee cartilage thickness dataset was established using 291 cases with ages ranging from 20 to 45 years and a Kellgren–Lawrence grading of 0.
Results: The validation results of network segmentation showed that TransUNet performed the best in the mixed dataset, with an overall dice similarity coefficient of 0.813 and an Intersection over Union of 0.692. The model’s mean absolute percentage error for automatic measurement and grading after segmentation was 0.831. The experiment also yielded standard knee cartilage thickness, with an average thickness of 1.98 mm for the femoral cartilage and 2.14 mm for the tibial cartilage.
Conclusion: By selecting the best knee cartilage segmentation network, we built a model with a stronger generalization ability to automatically segment, measure, and grade cartilage thickness. This model can assist surgeons in more accurately and efficiently diagnosing changes in patients’ cartilage thickness.
1 Introduction
Knee osteoarthritis (KOA) is a common disease ranked 11th among 291 diseases in terms of causing disability across 187 countries worldwide (1). Despite 130 years of global research, the causes and pathogenesis of KOA are still not fully understood (2). KOA is a chronic disease characterized by gradual loss of cartilage, and knee cartilage declines at a faster rate with age (3). In the advanced stages of KOA, there is damage to the knee subchondral bone, degeneration of the femoral condyles and tibial plateau, and the development of osteophytes (4). For this stage, the only medical treatment available is pain management or total knee arthroplasty (5).
In general, changes in the shape of the bones around the joints usually appear 5–10 years before X-rays can capture the disease, and magnetic resonance imaging (MRI) can show abnormalities much earlier (6). Therefore, using the MRI to detect the problem and intervene in the early stages of KOA when cartilage shows insignificant wear and tear can slow down the progression of KOA (7). Measurement of knee cartilage thickness can be used to determine cartilage wear more accurately, but this is time-consuming and requires accurate measurement by an experienced imaging physician or orthopedic surgeon, which is difficult to achieve at present.
With the rapid development of artificial intelligence, deep learning (DL) has been widely used in the medical field (8), including computer-aided diagnosis, patient prognosis evaluation, and patient treatment decision-making. Convolutional neural network (CNN) (9), a key technology in DL and a sub-field of artificial intelligence, is highly effective in image recognition (10). Automatic recognition and segmentation of images through CNN have been applied to medicine, including the use of MRI images to recognize the knee meniscus and anterior cruciate ligament (11, 12). Many scholars have also studied the segmentation of knee joint cartilage in CNN (13–15), which is also the direction of our study.
In this research, our objectives are: (1) to use various DL methods to segment knee cartilage from MRIs taken with different equipment and parameters, (2) to build a DL-based model for measuring and grading knee cartilage, and (3) to establish a standardized database of knee cartilage thickness. Through this model, we hope to assist surgeons in efficiently and accurately measuring the thickness of knee cartilage and understanding changes in patients’ cartilage conditions.
2 Materials and methods
2.1 Study population
This research has been reviewed and approved by the Ethics Committee of the Second Affiliated Hospital of Harbin Medical University (Ethics Review Approval Number: KY2021-178). A total of four datasets, comprising 991 cases of MRI data, were utilized in the study.
The first dataset was retrospectively selected from a database of patients in the Second Affiliated Hospital of Harbin Medical University (hereinafter referred to as the hospital) from 2013 to 2023, totaling 516 cases. This dataset includes 225 cases for model establishment and 291 cases for building a standardized knee cartilage thickness dataset. The second dataset included 200 MRI cases obtained from the publicly available Osteoarthritis Initiative Study Protocol (OAI) dataset (16). The third dataset included 175 knee MRI cases obtained from the publicly available fastMRI dataset, and the data used in this part were obtained from the NYU fastMRI Initiative database (17). The fourth dataset consisted of 100 MRI cases obtained from SKI10 (18). All selected MRI images were in the sagittal plane, encompassing both normal-thickness cartilage and knee cartilage with altered thickness. These images were collected across multiple devices and sequences. Table 1 displays the information about the data in detail.
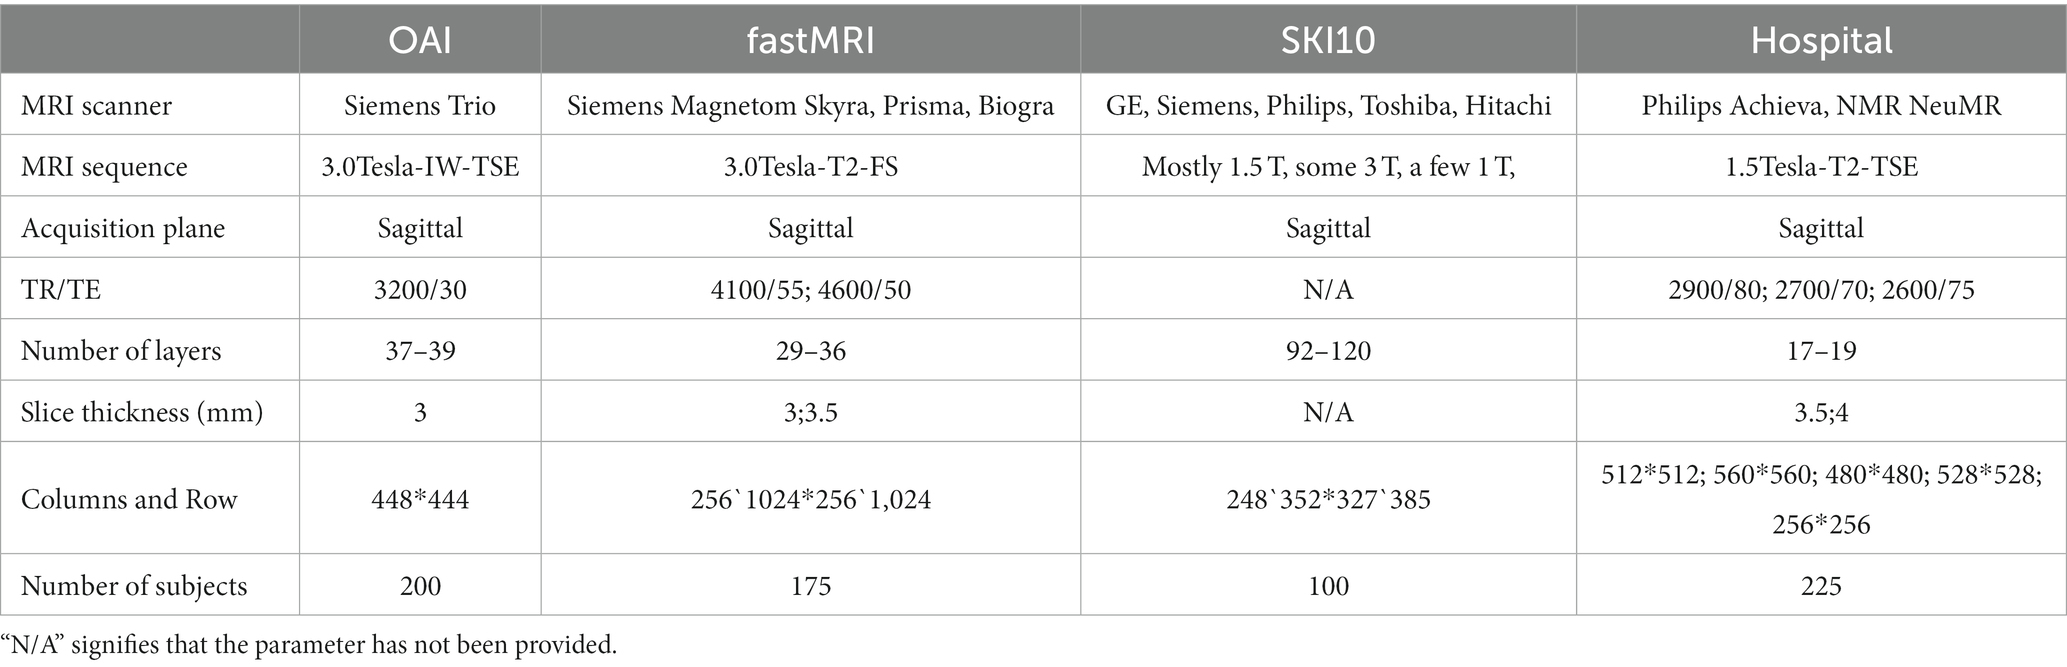
Table 1. Detailed information about the basic characteristics of the data.
2.2 Data labeling
For the hospital data, OAI data, and fastMRI data, annotations were labeled by two orthopedic graduate students under the supervision of experienced orthopedic surgeons (Yong Qin, 10 years of orthopedic experience; and Songcen Lv, 30 years of orthopedic experience). The annotations were performed manually in 3Dslicer (version 5.2.2). Special attention was given to the accuracy of the adjacent bones and muscle edges during the annotation process. The annotated data consisted of clear and complete cartilage images at the anterior one-fourth and posterior one-fourth positions of the sagittal plane MRI for each knee, which are crucial for assessing cartilage health.
The cartilage thickness annotation was consistently measured as the distance from the cartilage surface to the tidemark (19). The SKI10 database was segmented interactively by experts at Biomet, Inc., who segmented the femur, femoral cartilage, tibia, and tibial cartilage (18). We retained only the cartilage portions.
The final results included two labels: femoral cartilage (RGB = 255, 0, 0) and tibial cartilage (RGB = 0, 0, 255). These labels were generated in a 3D slicer, and the output images included the original knee joint MRI and the label images (Figure 1), shown in the first and second rows.
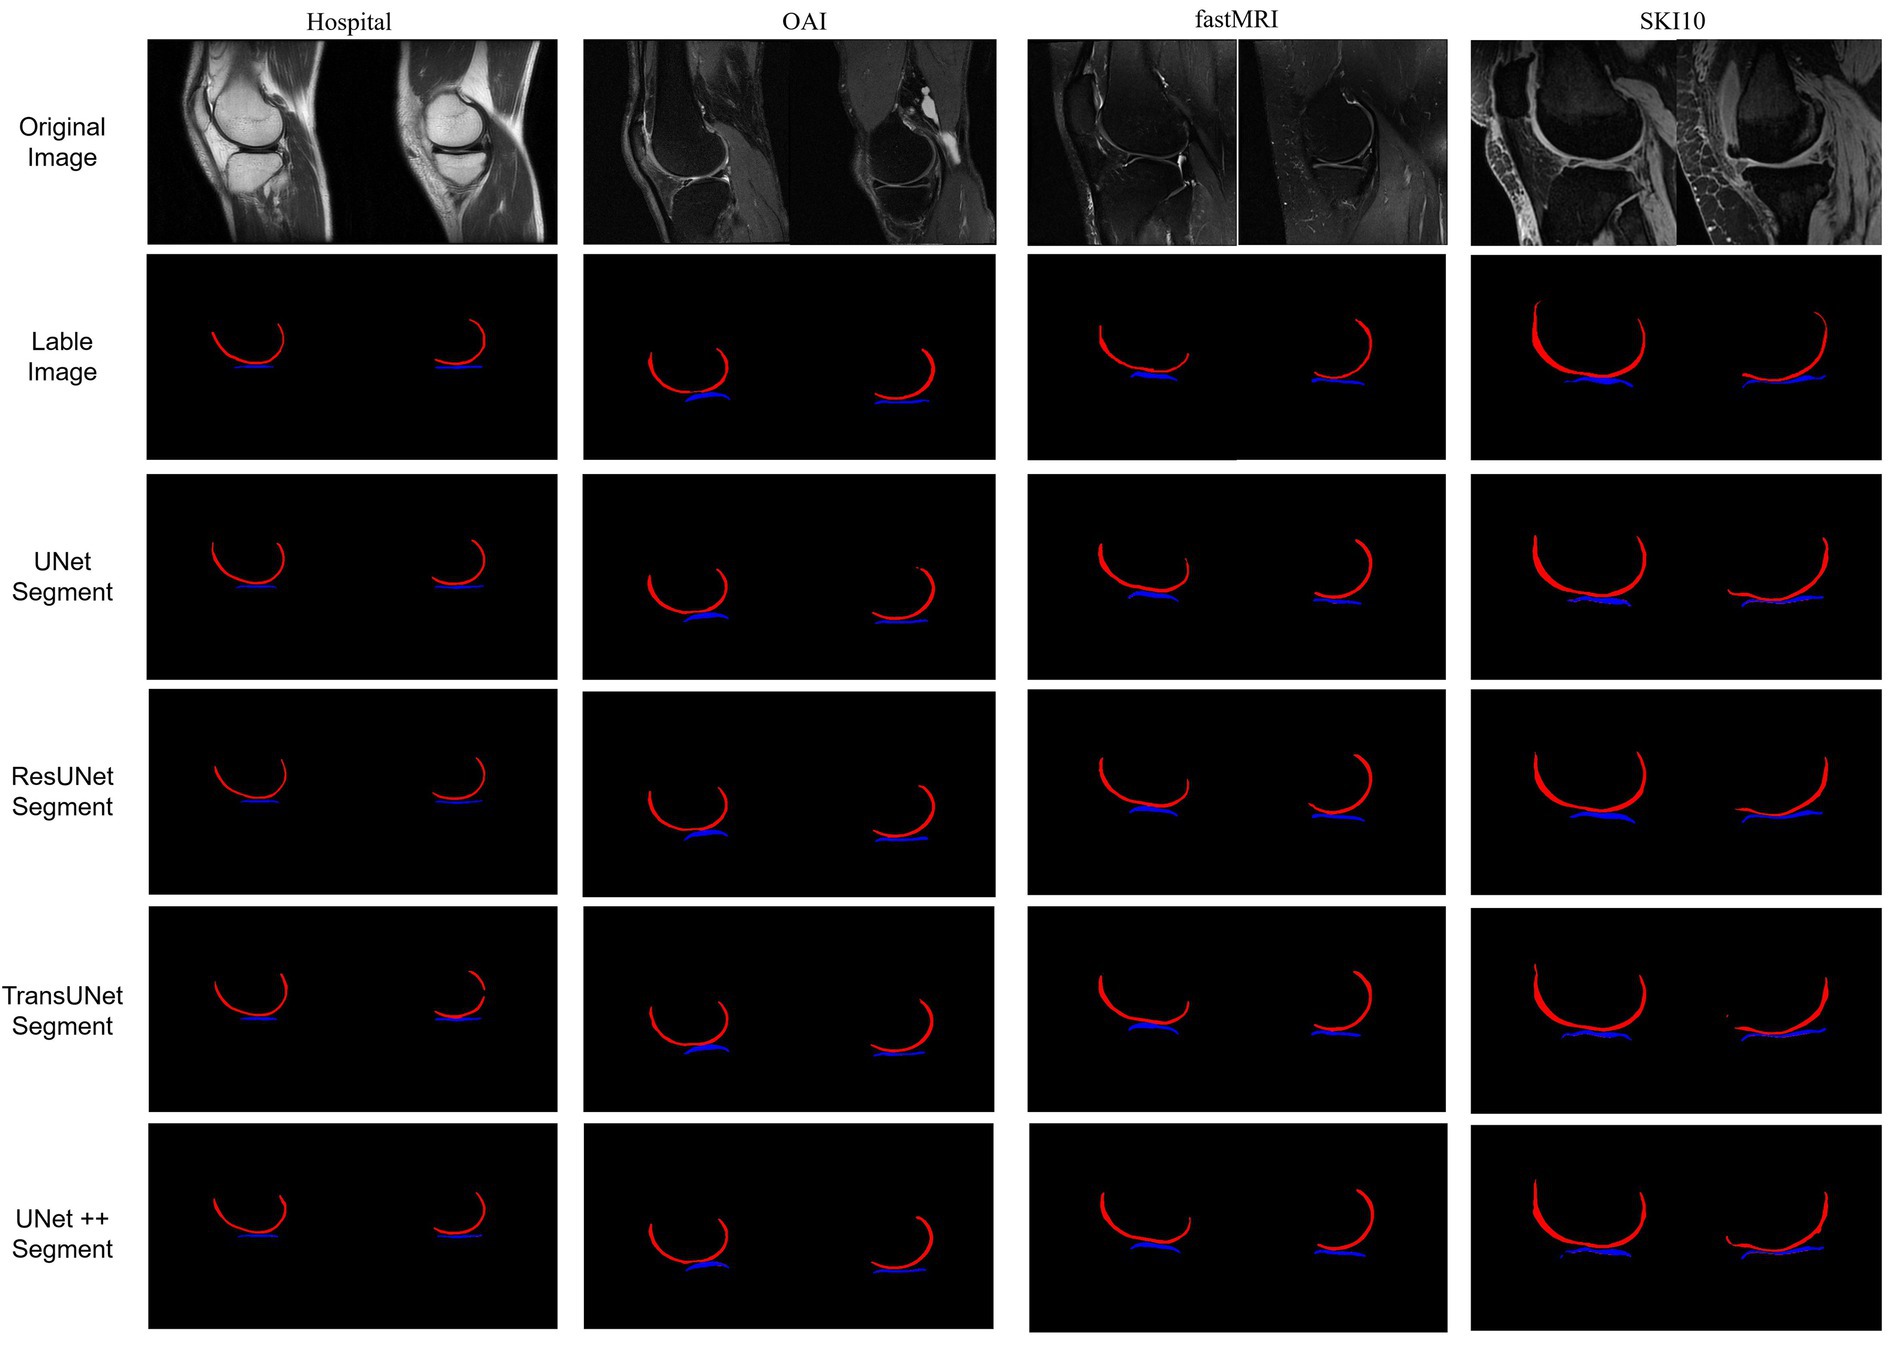
Figure 1. The first set represents hospital data; the second set represents OAI data; the third set represents fastMRI data; and the fourth set represents SKI10 data, which was pre-labeled. For each set, the first row displays the original MRI images of the knee joint’s medial and lateral sides. The second row shows the labeled cartilage images. The third to sixth rows depict the post-prediction images.
2.3 Cartilage classification
Based on the classification of cartilage regions in the Whole-Organ Magnetic Resonance Imaging Score (WORMS) (20), the knee joint MRI was artificially divided into 12 regions (Figure 2): the femur region (F) and tibia region (T), the medial region (A), and the lateral region (L). Each region was further divided into three parts: anterior (A), middle (M), and posterior (C). Specifically, it includes: (1) the anterior medial femoral area (FMA); central medial femoral area (FMC); and posterior medial femoral area (FMP); (2) the anterior lateral femoral area (FLA); central lateral femoral area (FLC); and posterior lateral femoral area (FLP); (3) the anterior medial tibial area (TMA); central medial tibial area (TMC); and posterior medial tibial area (TMP); and (4) the anterior medial tibial area (TLA); central medial tibial area (TLC); and posterior medial tibial area (TLP).
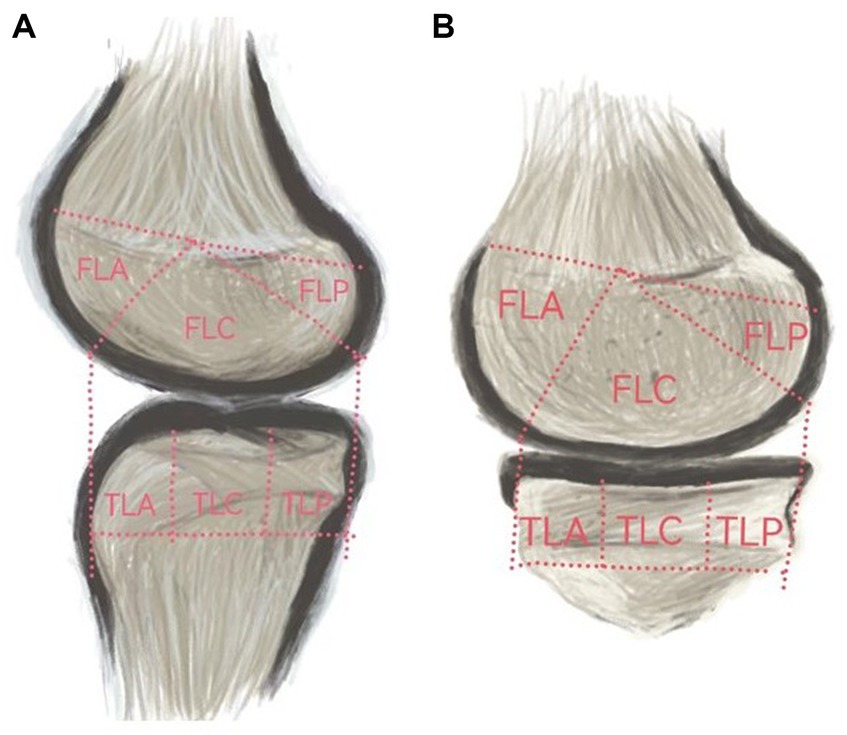
Figure 2. (A) represents the medial cartilage region, while (B) represents the lateral cartilage region.
2.4 Deep learning methods
We conducted a comparison of four deep learning segmentation models: UNet (21), UNet++ (22), ResUNet (23), and TransUNet (24). This study involved 700 samples, comprising a total of 2,800 images for network training, with the training results displayed in Figure 1, shown in the third to sixth rows. Before training, all images were resized to a uniform size (480×480 pixels) and normalized. The dataset was divided into a training set, a test set, and a validation set, in the ratio of 6:2:2. The aforementioned algorithms were implemented under the PyTorch (CUDA 11.8) framework, and computations were performed on a tower server composed of 4 NVIDIA 12GB GPUs.
UNet: The most widely used CNN in medical image processing. Its structure is U-shaped and includes symmetrical encoders and decoders. After inputting MRI images, the encoder extracts cartilage features through convolution layers and pooling operations, reducing the image size from 480*480 to 30*30. Subsequently, using Concat to connect multiple tensors, the model generates predictive results through layer-by-layer upsampling and per-pixel classification.
UNET++: Builds upon UNet by introducing dense skip connections and multi-scale feature fusion. It captures features from different levels, integrating them through feature stacking, thereby enhancing the extraction of knee joint cartilage features.
ResUNet: Based on UNet, it introduces residual connections (similar to ResNet), allowing the image to be passed not only to the next layer but also directly to deeper layers through skip connections, effectively reducing the problem of gradient vanishing during training.
TransUNet: This is a segmentation network based on the transformer model, using a hybrid architecture of CNN-Transformer-UNet. Initially, it employs the feature encoding part of CNN to extract features while reducing the image size from 480*480 to 30*30, followed by extracting global contextual information using the self-attention mechanism of the transformer. Finally, the UNet decoder upsamples the encoded features, which are combined with different resolution CNN features extracted from the encoder path, achieving precise localization (Figure 3, Part A).
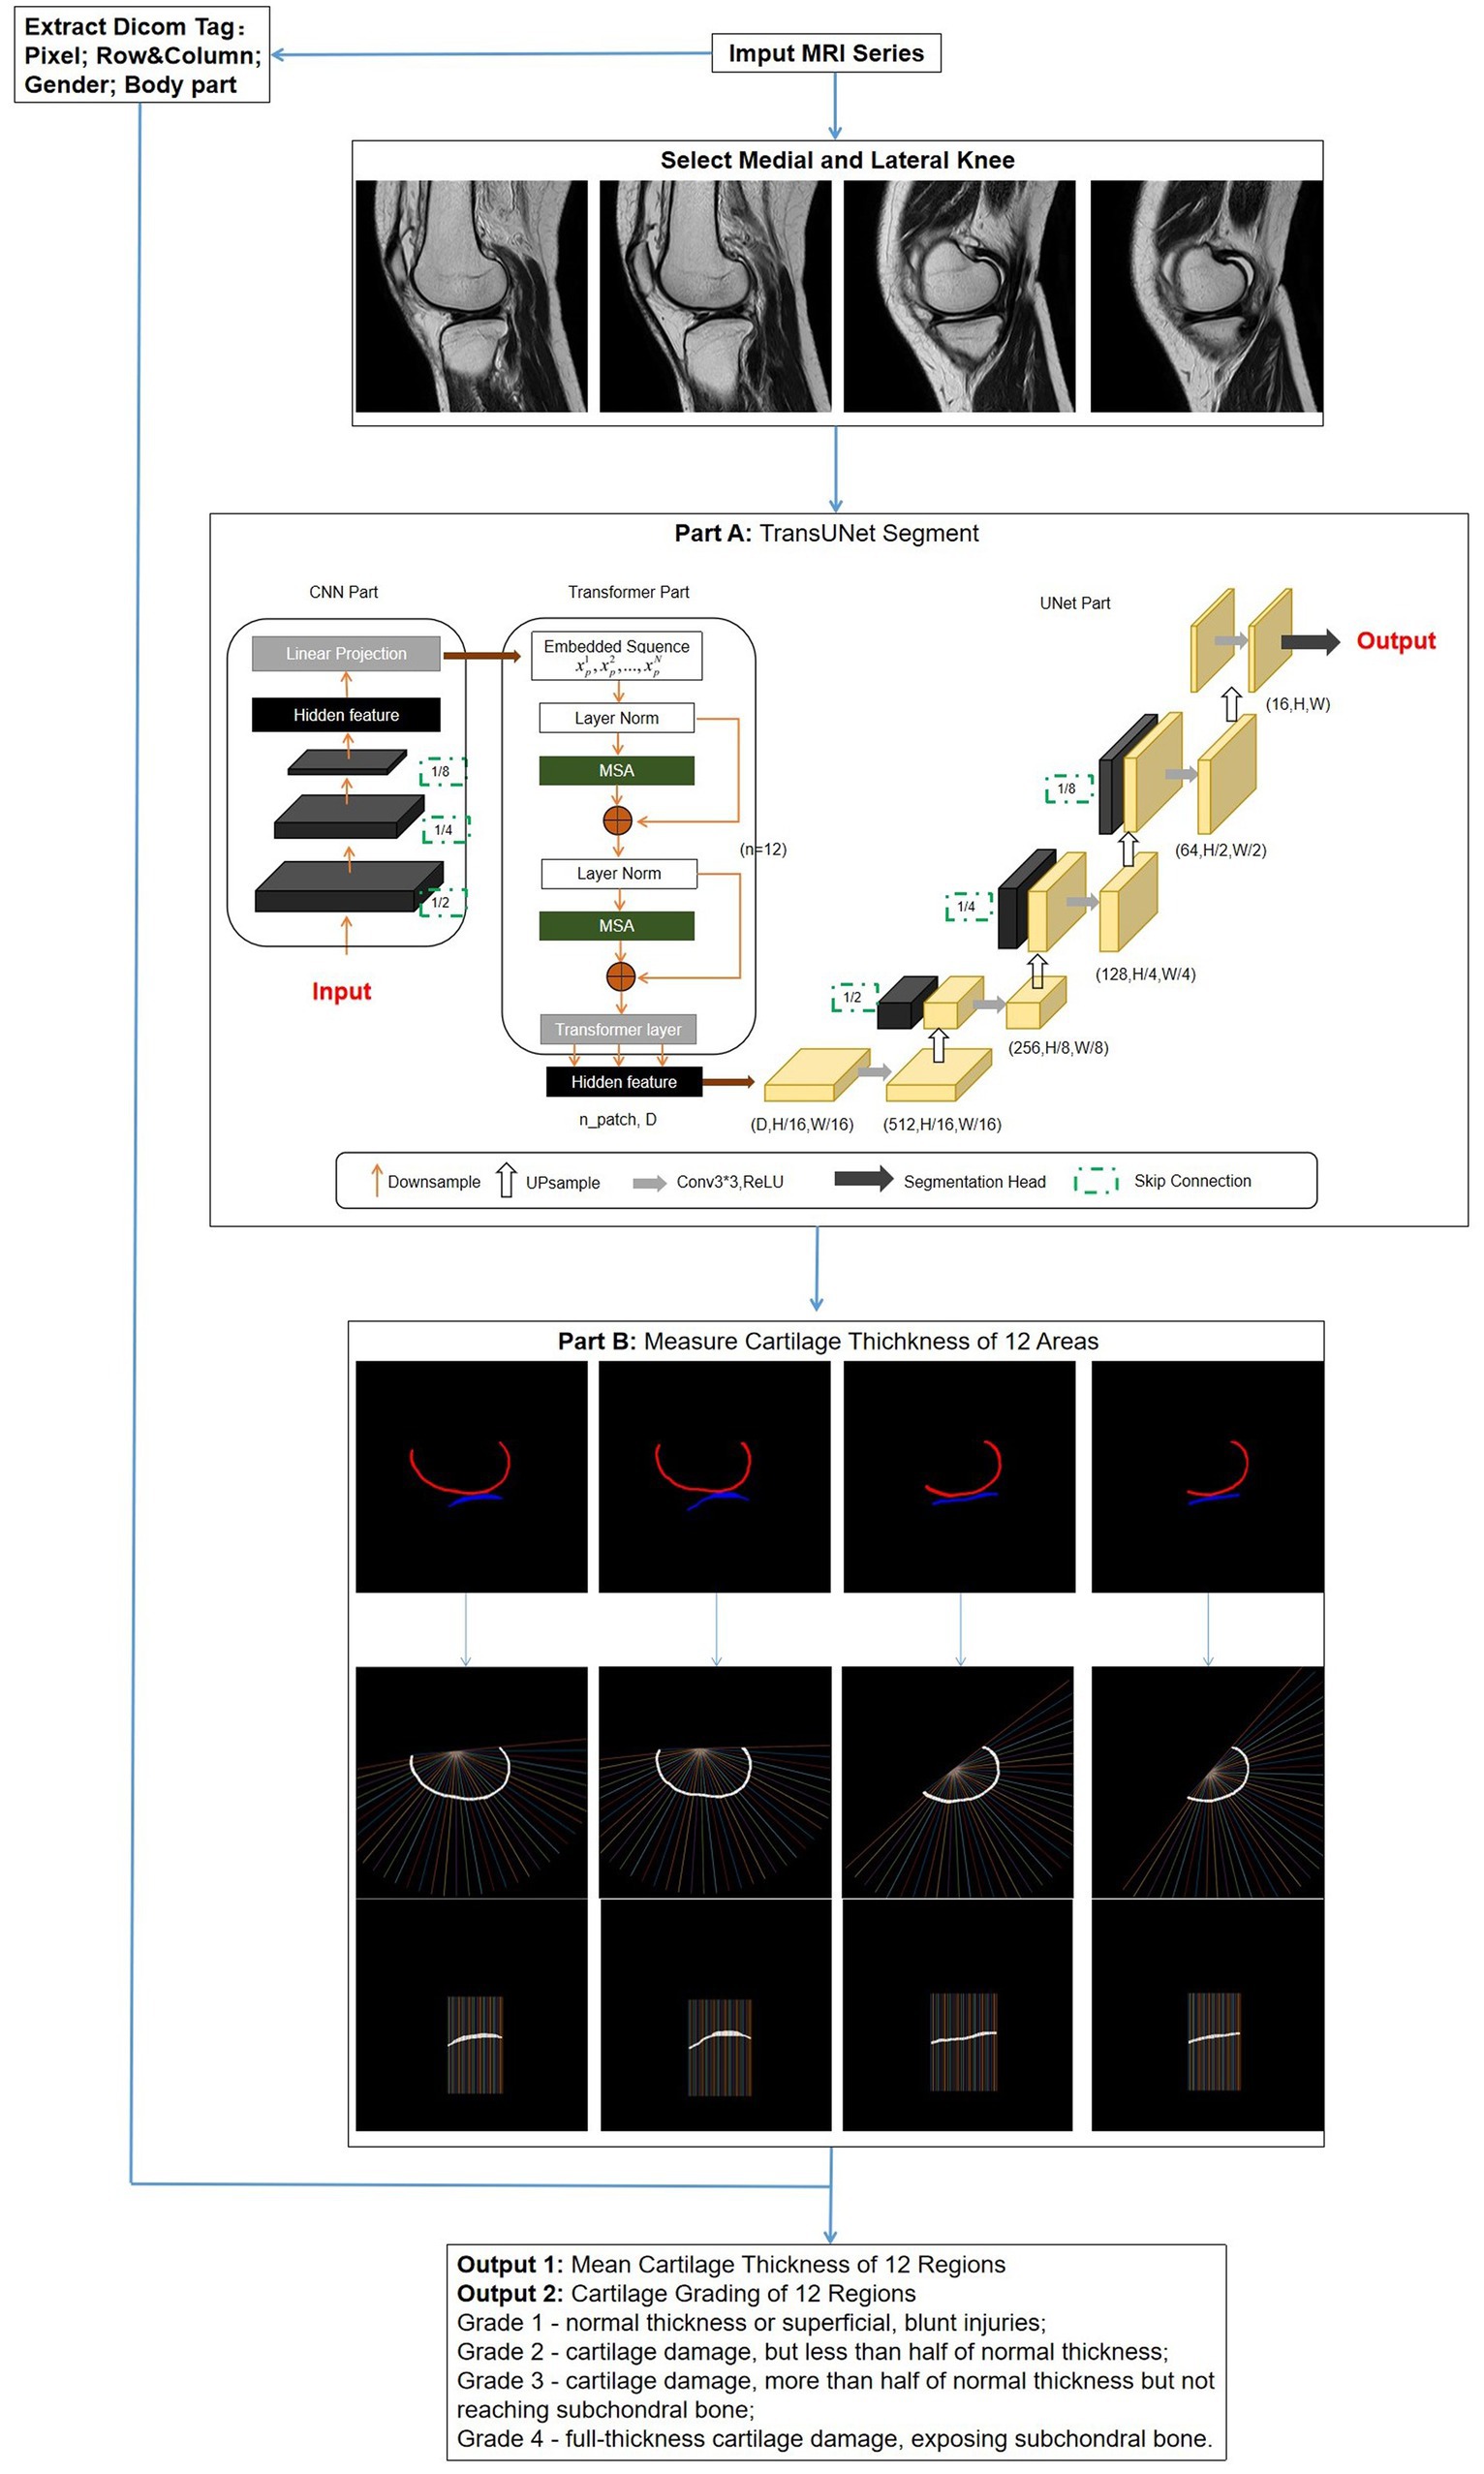
Figure 3. Overall flowchart of the research model. After the images are selected, a network is used to segment the regions of cartilage. Subsequently, the segmentation results are automatically measured for thickness and graded. Simultaneously, DICOM tag information is extracted for obtaining standard knee joint cartilage thickness. Part A: The structure of TransUNet, which achieved the best results of all network models; Part B: measurement method of cartilage thickness; vertical lines 1–12 intersecting with cartilage represent FMA and FLA; lines 13–24 represent FMC and FLC; and lines 25–36 represent FMP and FLP.
To train the network, the gradient descent method was used (25), with a batch size of 16, a weight decay of 1e-4, and a learning rate drop factor of 0.1. The initial learning rate was 2e-4. After every 100 training sessions, the learning rate = initial learning rate * drop factor until convergence. We used cross-validation method to explore the optimal epochs, with epochs selected from 50, 75, 100, 125, 150, 175, 200, specific epochs for each type of network are shown in Figure 4.
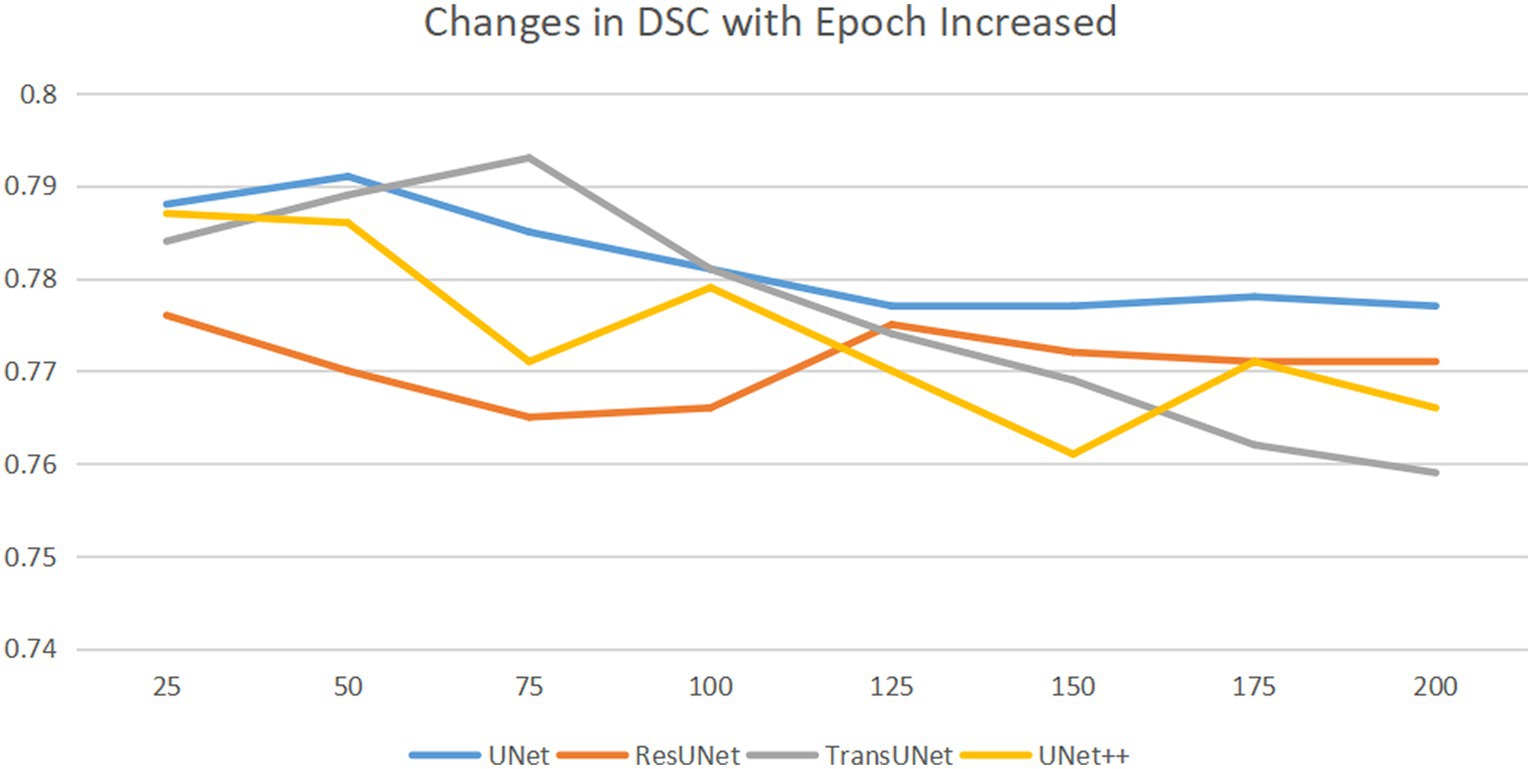
Figure 4. Horizontal axis is epoch, and the vertical axis is DSC. DSC changes as the epoch increases. As the epochs increase, the optimal DSC occurs at different epochs for different networks. We saved the network weights corresponding to the best DSC.
2.5 Cartilage thickness measurement
Thickness measurement is implemented in MATLAB (R2022a). First, the post-segmentation data are processed to remove small independent pixels. Then, the cartilage range was determined by identifying the pixel points corresponding to different colors of femoral and tibial cartilage. The thickness calculation was an improvement on traditional methods (26), expanding the detection area for increased accuracy. For the femoral side, the midpoint of the line connecting the endpoints on both sides was taken as the origin; from this point, 36 vertical lines intersecting the cartilage were drawn at 5° intervals. Similarly, the tibial cartilage was divided into 36 vertical lines by taking the sides as endpoints (Figure 3, Part B).
The number of pixel points obtained from the intersections was calculated based on the Digital Imaging and Communications in Medicine (DICOM) tag information of the original MRI, including row and column, as well as the actual distance represented by each pixel (pixel spacing). This calculation provided the cartilage thickness at each point. The average thickness for each region was computed separately for lines 1–12, 13–24, and 25–36.
The thickness measurement results were classified into four levels according to Recht grading (27) and ICRS grading (28): Grade 1 – normal thickness or superficial, blunt injuries; Grade 2 – cartilage damage, but less than half of normal thickness; Grade 3 – cartilage damage, more than half of normal thickness but not reaching subchondral bone; Grade 4 – full-thickness cartilage damage, exposing subchondral bone. By extracting gender and body part information (left or right knee) from the DICOM tags and using the corresponding standard cartilage thickness, the model determines the grading. Ultimately, this model provides surgeons with displays of the cartilage thickness and grading for each region of the knee joint (Figure 3).
2.6 Selection of normal knee cartilage
From a pool of 7,094 cases spanning 2013–2022, we screened 291 knee joint MRI cases defined as having normal cartilage thickness. These cases were considered the standard for knee cartilage thickness in the northeastern region of China. Standard knee cartilage thickness was defined as individuals aged 20–45 with X-ray Kellgren–Lawrence gradings of 0 or 1. All these MRI images were sourced from the hospital dataset. Some individuals may be entirely normal, while others may have accompanying conditions such as meniscal injuries or bone abnormalities; however, their cartilage remains intact. We defined standard cartilage thickness as aged 20–45, as cartilage below 20 years of age is in constant growth and change, and cartilage thickness tends to wear to varying degrees with increasing age beyond 45 (29). The specific screening results are presented in Figure 5.
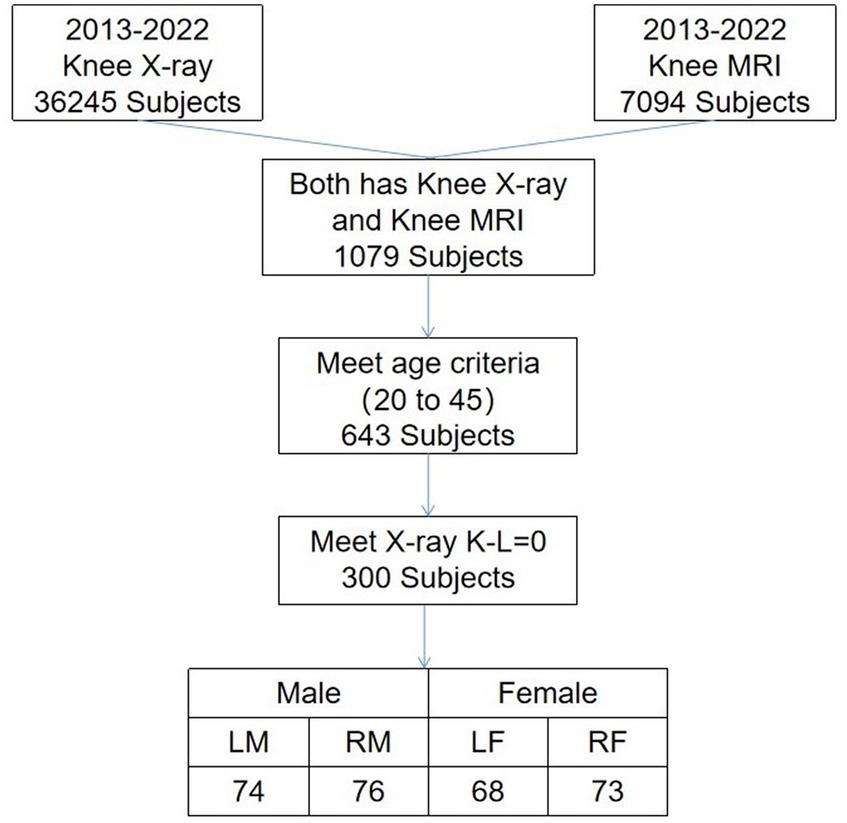
Figure 5. Selection criteria and the number of stranded cartilages. Man’s left knee (LM), man’s right knee (RM), woman’s left knee (LW), and woman’s right knee (RW).
2.7 Statistical analysis
In this study, the collected data were statistically analyzed using MATLAB. The accuracy of cartilage segmentation was evaluated using the dice similarity coefficient (DSC) and Intersection over Union (IoU). Both DSC and IoU values ranged from 0 to 1, with higher values indicating better segmentation performance. The accuracy of cartilage thickness measurement was assessed using the mean absolute percentage error (MAPE). A MAPE of 0% indicates a perfect model, while a MAPE greater than 100% suggests a poor-quality model. The grading accuracy of the model was validated using the metric ‘Accuracy’. The standard cartilage thickness results inferred were presented as mean ± standard deviation (¯x ± s) for measurements following a normal or near-normal distribution.
3 Results
3.1 Segmentation results in different CNNs
We employed four CNN models for segmentation training on the mixed dataset. The results indicate that the TransUNet model achieved the best segmentation performance, with a DSC of 0.823 for segmenting femoral cartilage, 0.803 for segmenting tibial cartilage, 0.813 for overall DSC, and 0.692 for overall IoU. Other network models’ performances were less impressive than TransUNet’s, particularly in tibial cartilage segmentation, with DSCs ranging from 0.776 to 0.788. The specific segmentation results for each network are shown in Table 2 and Figure 6, Part A.
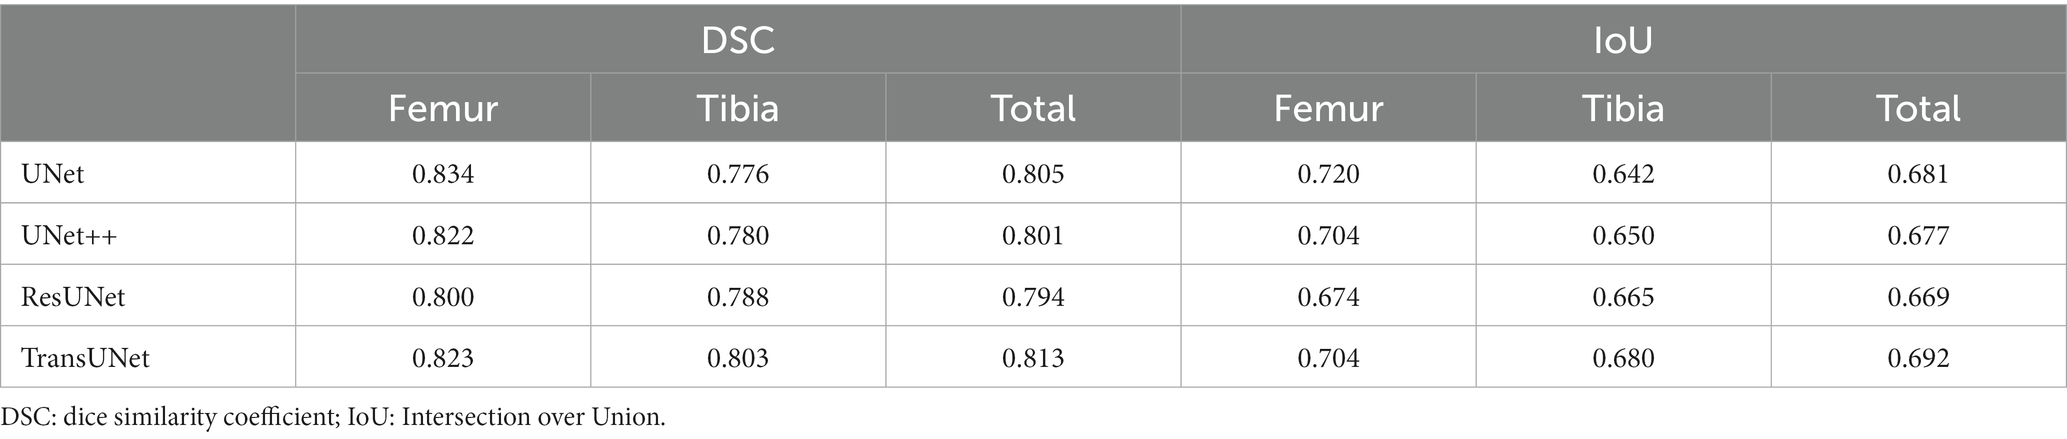
Table 2. Result in different CNNs.
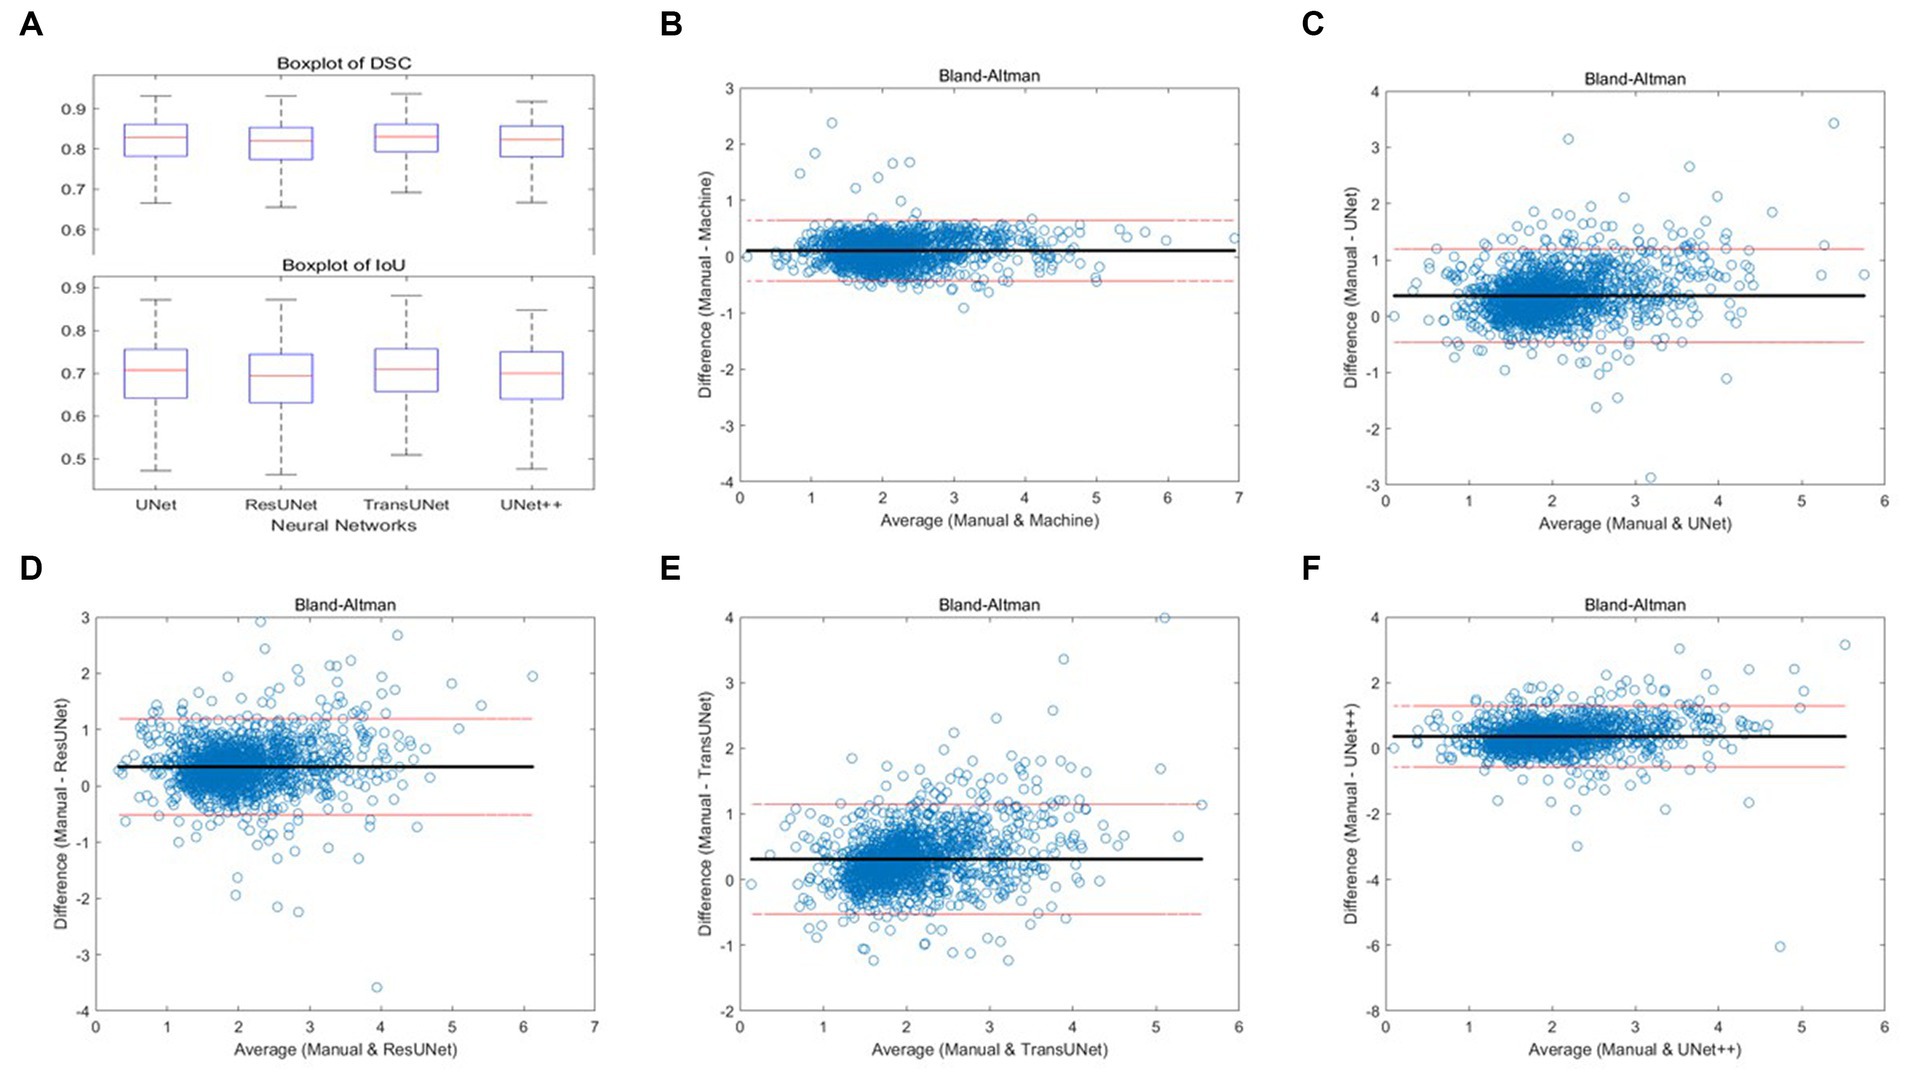
Figure 6. (A) Boxplots of total DSC and IoU for four different networks; (B–F) Bland–Altman consistency analysis of cartilage thickness measurement results under different methods.
3.2 Validation of automatic cartilage thickness measurement accuracy
Two orthopedic graduate students manually measured and graded the cartilage thickness in 12 regions of 135 knee MRI samples from the test set under the supervision of experienced orthopedic surgeons and compared the results with the results from the automatic thickness measurement and grading model, showing the overall MAPE of the thickness measurement was 10.10% and the grading accuracy was 89.99%. Compared with the results of automatic measurement after different networks’ segmentation, the overall MAPE of thickness measurement ranged from 17.47 to 20.34%, and the grading accuracy ranged from 75.79 to 83.08%, with TransUNet showing the best performance. The specific segmentation results are shown in Table 3 and Figure 6, Part B–F.
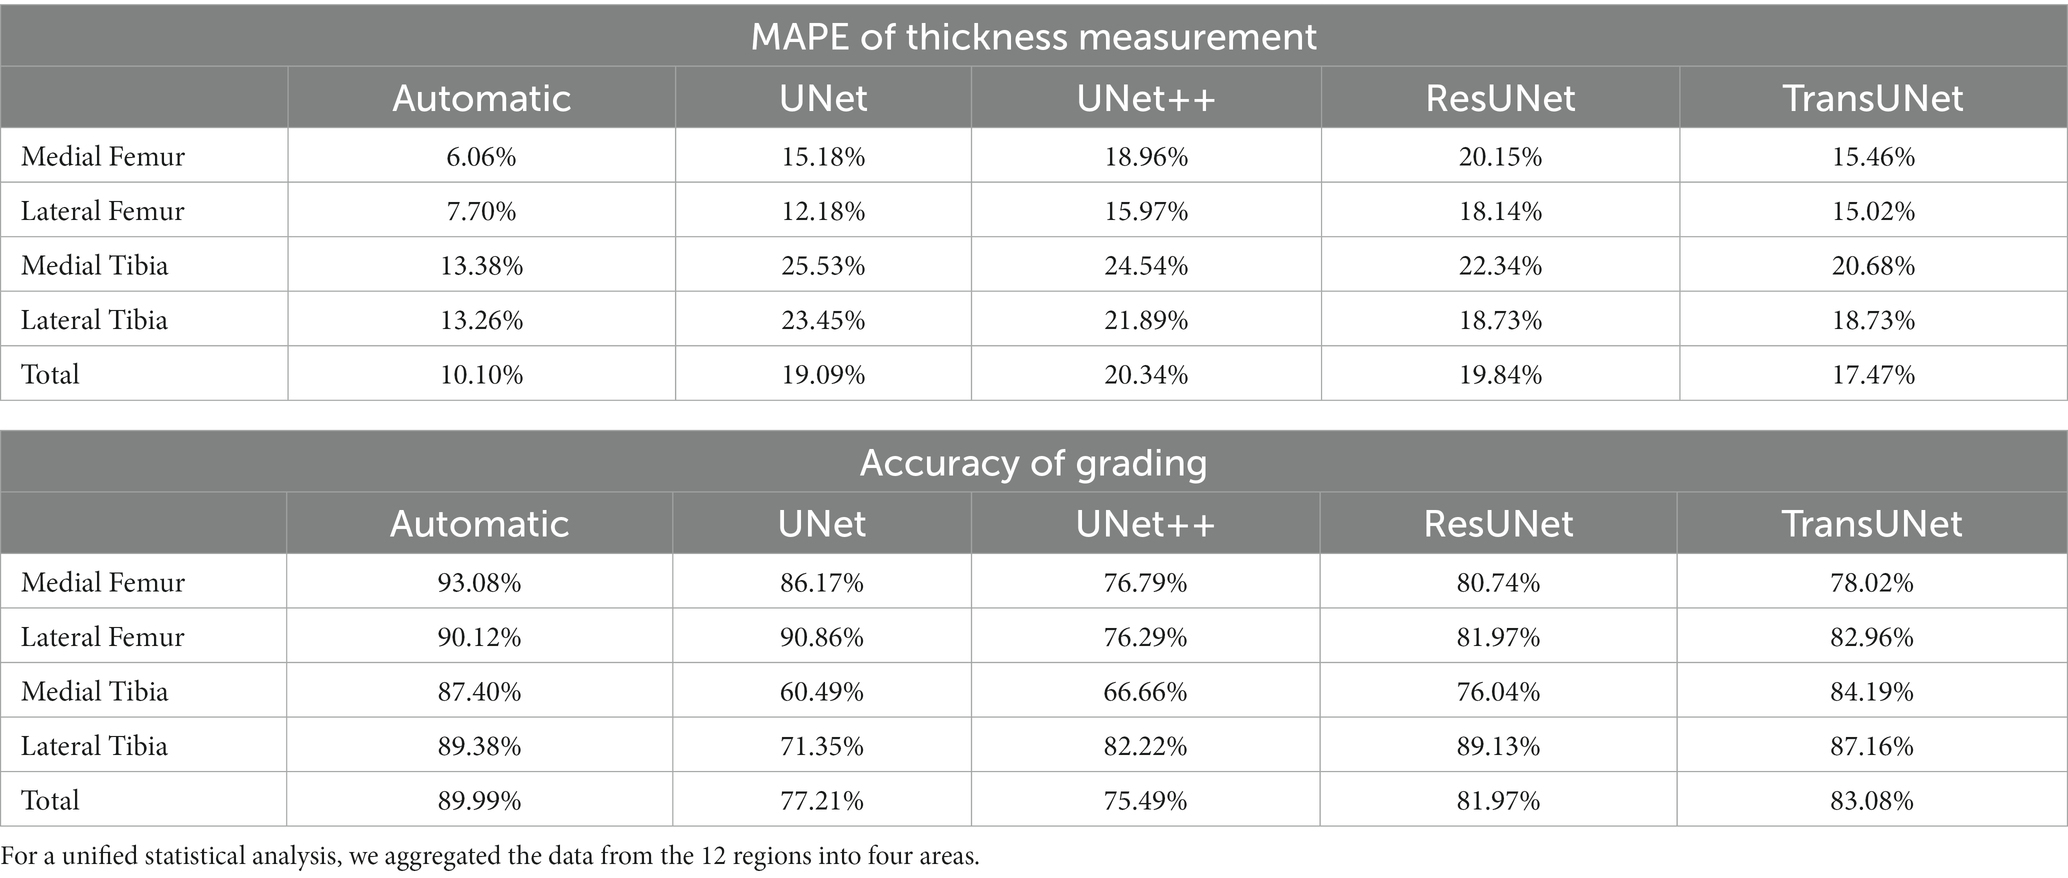
Table 3. MAPE between manual measurements and grading and automatic measurements and grading, as well as between manual measurements and grading and measurements and grading from different networks segmentation, p < 0.05.
3.3 Normal knee cartilage thickness
The results of the cartilage thickness analysis of 291 normal knee cartilage thicknesses are shown in Table 4. The results showed that the cartilage thickness of normal knee joints ranged from 1.79 ± 0.26 mm to 3.13 ± 0.54 mm. In general, the average thickness of femoral cartilage is 1.98 mm, and the average thickness of tibial soft tissue is 2.14 mm. The distribution of the cartilage thickness was uneven, with the medial femur being thicker than the lateral femur, the tibia cartilage thickness being greater than that of the femur, and the thickness being greatest in the central medial aspect of the tibia. Judging by gender and considering both right and left knees, the cartilage thickness was generally greater in men than in women,” and the cartilage thickness of the right knee was generally greater than the left knee.
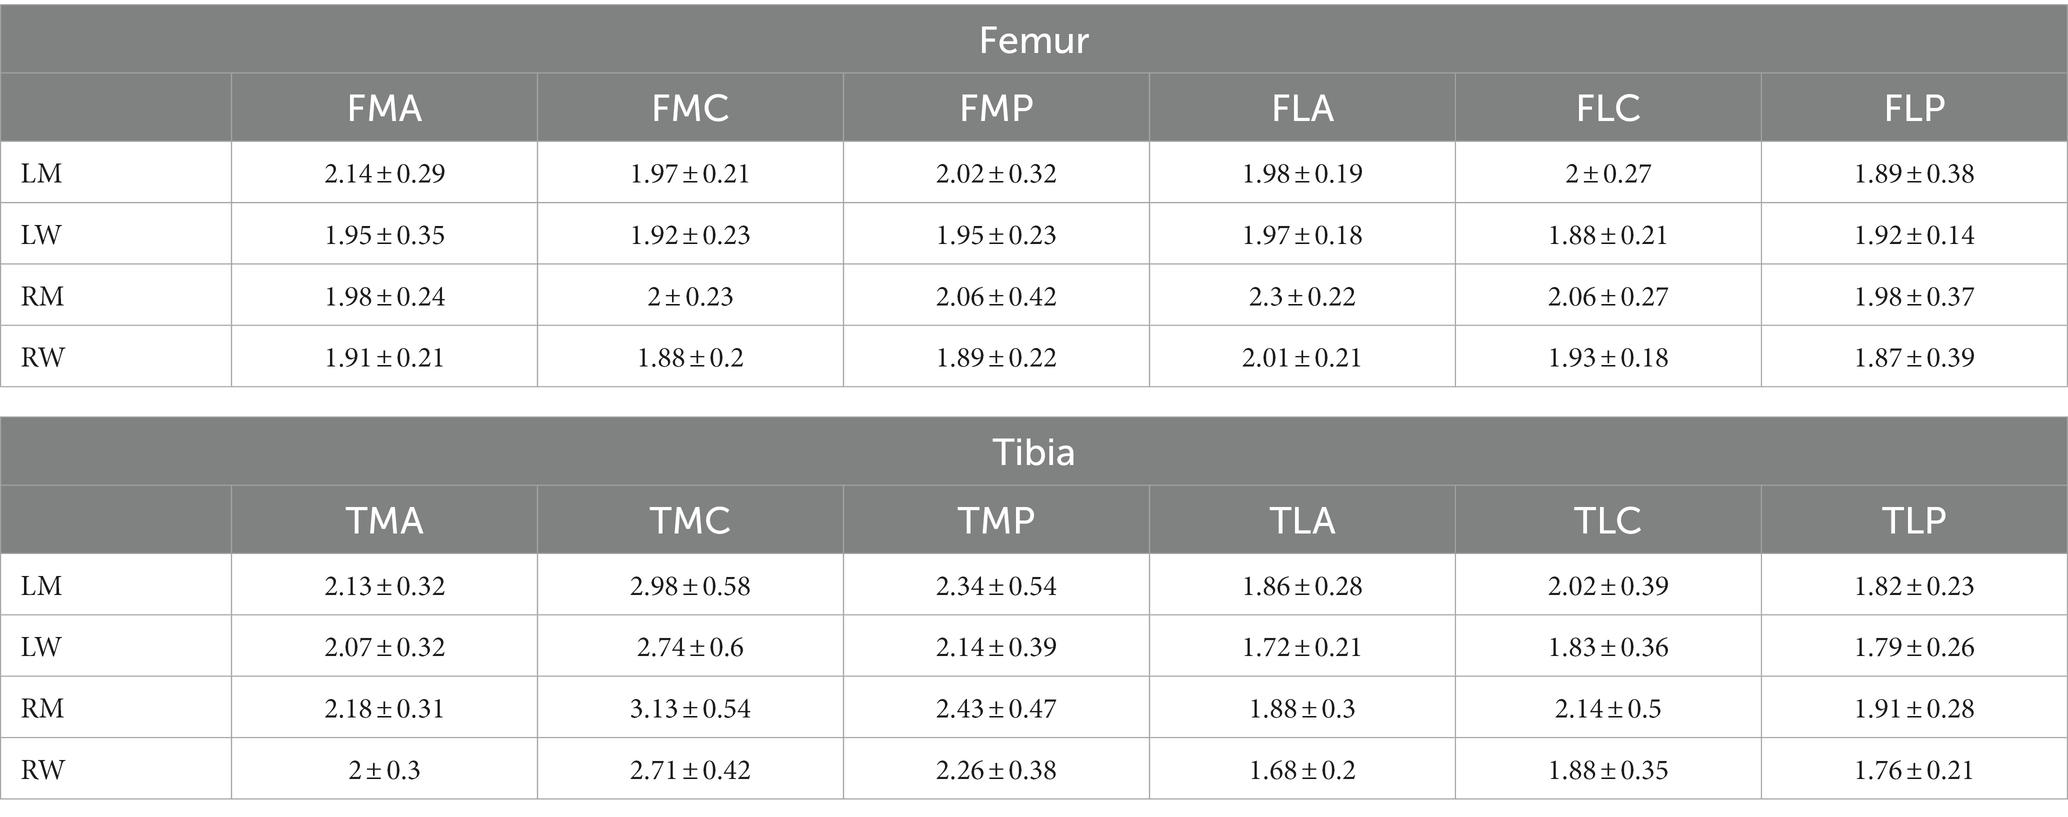
Table 4. Standard thickness of cartilage (x ± s), in mm.
4 Discussion
In this study, we utilized various CNNs to train, segment, measure, and grade the knee cartilage thickness in 12 regions of a mixed knee cartilage dataset. We developed a measurement and grading model under DL that is applicable to different sequences. Currently, assessing changes in knee cartilage thickness requires a significant amount of effort and time through a manual MRI examination. With limited time for diagnosis and treatment, surgeons may struggle to focus on each patient’s cartilage thickness, making early detection of mild knee joint cartilage wear challenging. This study primarily focuses on the efficient and accurate measurement of cartilage thickness, aiming to assist surgeons in understanding changes in patients’ cartilage.
In previous studies, scholars such as Norman (29) utilized the OAI dataset for segmentation in UNet, achieving a DSC of 0.770 to 0.878. Additionally, another study (30) employed SegNet for segmentation in a mixed dataset combining SKI10 and personal data, obtaining a volumetric overlap error (VOE, the opposite of DSC) coefficient of 0.289, higher than the UNet’s 0.351. Currently, many researchers (30–32) prefer using individual datasets for segmentation, yielding DSC coefficients typically ranging between 0.74 and 0.87. Therefore, uncertainties exist regarding the reliability of these models when applied to MRI scans from different devices or sequences. We attempted to use the independent hospital dataset for training under UNet and obtained results of femur DSC of 0.86, tibia DSC of 0.79, and overall DSC of 0.82. However, when the network trained using the hospital dataset was applied to the OAI or fastMRI datasets, the DSC was only 0.47 to 0.53, which suggests that models trained on individual datasets exhibit subpar performance when inferring on MRI scans acquired with other devices and sequences. To enhance the effectiveness and robustness of the thickness measurement model, we opted for training on a mixed dataset. While a mixed dataset may influence the recognition accuracy and decrease precision to some extent, the model still demonstrates favorable performance across different MRI devices and sequences.
We employed four different network models for knee cartilage segmentation. UNet is the most widely used DL model in knee joint segmentation currently; however, other networks, traditionally applied to the segmentation of organs such as the lungs, heart, stomach, and brain (33–36), are now being explored in this area. This study is the first to apply these network models to knee cartilage segmentation, with results indicating that some networks outperform UNet in terms of segmentation accuracy. The results demonstrate that the best-performing network currently is TransUNet. Compared to other networks, TransUNet more effectively captures long-distance dependencies and global contextual information within images, accurately recognizes and differentiates varying degrees of cartilage damage, and shows superior capabilities in processing edge pixel details.
Measuring cartilage thickness manually is a time-consuming task. Shepherd and Seedhom (37) first measured 11 cadavers in 1999, revealing an average cartilage thickness of 2.15 mm on the surface of the femur, 2.01 mm in the tibial plateau covered by the meniscus, and 2.59 mm in the uncovered region of the tibia. Cohen et al. (38) proved that cartilage thickness measured via MRI is basically the same as direct measurements, with an average femoral cartilage thickness of 2.08 mm and an average tibial cartilage thickness of 2.32 mm. Our results also show a similar trend, with an average cartilage thickness of 1.99 mm in women and 2.13 mm in men.
In recent years, some researchers have already utilized DL methods to measure cartilage. Shah (31) first employed UNet for the segmentation and measurement of normal knee cartilage thickness, demonstrating that DL can effectively measure thickness on MRI. Si (32) also utilized UNet for segmentation, measuring cartilage thickness through a dot-product approach. Liu (30) and other researchers used the Eulerian PDE (39) approach in V-Net for measurement. In contrast, our approach involves pixel-level recognition and calculation, building a model capable of measuring the thickness of cartilage automatically after segmentation and validating its reliability. In order to make the results more applicable to clinical practice, we graded the measurement results to help surgeons effectively assess changes in cartilage thickness in patients and provide valuable reference for subsequent treatment decisions.
There are some limitations to this study. First, the lack of comparison with other scholars’ cartilage thickness measurement methods limits our ability to conclusively ascertain the distinct advantages or enhancements that our method offers over existing methods. Second, as our normal knee cartilage thickness data only represents the average thickness level in Northeast China, it may not be representative of other regions in China or other countries and races. Additionally, our cartilage thickness standards are limited to gender and body part; we have not considered other patient factors such as height, age, and BMI. It is unknown whether these factors are related to standard cartilage thickness; therefore, it is necessary to continue to collect data and establish a more complete standard knee cartilage thickness dataset. Finally, our scoring system is a retrospective study and provides a universally applicable thickness measurement score primarily for assessing early cartilage damage. It serves as an auxiliary tool for surgeons and may require individual judgments in certain special cases.
5 Conclusion
In conclusion, we selected the best knee cartilage segmentation network and built a model of automatic knee cartilage segmentation, measurement, and grading. Through this model, the effectiveness and robustness of processing images obtained under different MRI devices and parameters have been enhanced. It can help surgeons more accurately and efficiently diagnose changes in cartilage thickness in patients. At the same time, we have defined the standard cartilage thickness in northeast China. We hope that after further research and the collection of large amounts of data, we can build a global dataset of standard knee cartilage thickness to help more patients and surgeons.
Data availability statement
The raw data supporting the conclusions of this article will be made available by the authors, without undue reservation.
Ethics statement
Written informed consent was obtained from the individual(s) for the publication of any potentially identifiable images or data included in this article.
Author contributions
JG: Writing – original draft, Writing – review & editing. PY: Methodology, Writing – review & editing. YQ: Resources, Supervision, Writing – original draft. ML: Writing – review & editing, Supervision, Funding acquisition. YM: Writing – original draft. JL: Methodology, Software, Writing – review & editing. RW: Data curation, Formal analysis, Writing – review & editing. HL: Funding acquisition, Supervision, Writing – review & editing. SL: Funding acquisition, Supervision, Writing – review & editing.
Funding
The author(s) declare financial support was received for the research, authorship, and/or publication of this article. This study was supported by the National Orthopaedic and Exercise Rehabilitation Clinical Medical Research Center, China: 2021-NCRC-CXJJ-ZH-11 and the dual professor cooperation program from the Second Affiliated Hospital of Harbin Medical University. The name of the project is “Diagnosis of knee osteoarthritis based on deep learning measurement of cartilage thickness”.
Conflict of interest
The authors declare that the research was conducted in the absence of any commercial or financial relationships that could be construed as a potential conflict of interest.
Publisher’s note
All claims expressed in this article are solely those of the authors and do not necessarily represent those of their affiliated organizations, or those of the publisher, the editors and the reviewers. Any product that may be evaluated in this article, or claim that may be made by its manufacturer, is not guaranteed or endorsed by the publisher.
References
1. Cross, M, Smith, E, Hoy, D, Nolte, S, Ackerman, I, Fransen, M, et al. The global burden of hip and knee osteoarthritis: estimates from the global burden of disease 2010 study. Ann Rheum Dis. (2014) 73:1323–30. doi: 10.1136/annrheumdis-2013-204763
2. Dobson, GP, Letson, HL, Grant, A, McEwen, P, Hazratwala, K, et al. Defining the osteoarthritis patient: back to the future. Osteoarthr Cartil. (2018) 26:1003–7. doi: 10.1016/j.joca.2018.04.018
3. Ding, C, Cicuttini, F, Blizzard, L, Scott, F, and Jones, G. A longitudinal study of the effect of sex and age on rate of change in knee cartilage volume in adults. Rheumatology. (2006) 46:273–9. doi: 10.1093/rheumatology/kel243
4. Donell, S. Subchondral bone remodelling in osteoarthritis. EFORT Open Rev. (2019) 4:221–9. doi: 10.1302/2058-5241.4.180102
5. Liu, L, Ishijima, M, Kaneko, H, Sadatsuki, R, Hada, S, Kinoshita, M, et al. The MRI-detected osteophyte score is a predictor for undergoing joint replacement in patients with end-stage knee osteoarthritis. Mod Rheumatol. (2017) 27:332–8. doi: 10.1080/14397595.2016.1206509
6. Felson, DT, and Hodgson, R. Identifying and treating preclinical and early osteoarthritis[J]. Rheum Dis Clin. (2014) 40:699–10. doi: 10.1016/j.rdc.2014.07.012
7. Brown, GA. AAOS clinical practice guideline: treatment of osteoarthritis of the knee: evidence-based guideline, 2nd edition. J Am Acad Orthop Surg. (2013) 21:577–9. doi: 10.5435/JAAOS-21-09-577
8. Helm, JM, Swiergosz, AM, Haeberle, HS, Karnuta, JM, Schaffer, JL, Krebs, VE, et al. Machine learning and artificial intelligence: definitions, applications, and future directions[J]. Curr Rev Musculoskelet Med. (2020) 13:69–76. doi: 10.1007/s12178-020-09600-8
9. Alzubaidi, L, Zhang, J, Humaidi, AJ, Al-Dujaili, A, Duan, Y, al-Shamma, O, et al. Review of deep learning: concepts, CNN architectures, challenges, applications, future directions. J Big Data. (2021) 8:53–74. doi: 10.1186/s40537-021-00444-8
10. Esteva, A, Robicquet, A, Ramsundar, B, Kuleshov, V, DePristo, M, Chou, K, et al. A guide to deep learning in healthcare. Nat Med. (2019) 25:24–9. doi: 10.1038/s41591-018-0316-z
11. Roblot, V, Giret, Y, Bou Antoun, M, Morillot, C, Chassin, X, Cotten, A, et al. Artificial intelligence to diagnose meniscus tears on MRI. Diagn Interv Imaging. (2019) 100:243–9. doi: 10.1016/j.diii.2019.02.007
12. Minamoto, Y, Akagi, R, Maki, S, Shiko, Y, Tozawa, R, Kimura, S, et al. Automated detection of anterior cruciate ligament tears using a deep convolutional neural network. BMC Musculoskelet Disord. (2022) 23:1–7. doi: 10.1186/s12891-022-05524-1
13. Tang, X, Guo, D, Liu, A, Wu, D, Liu, J, Xu, N, et al. Fully automatic knee joint segmentation and quantitative analysis for osteoarthritis from magnetic resonance (MR) images using a deep learning model. Med Sci Monit Int Med J Exp Clin Res. (2022) 28:e936733–1. doi: 10.12659/MSM.936733
14. Yeoh, PSQ, Lai, KW, Goh, SL, Hasikin, K, Hum, YC, Tee, YK, et al. Emergence of deep learning in knee osteoarthritis diagnosis. Comput Intell Neurosci. (2021) 2021:1–20. doi: 10.1155/2021/4931437
15. Liu, F, Zhou, Z, Samsonov, A, Blankenbaker, D, Larison, W, Kanarek, A, et al. Deep learning approach for evaluating knee MR images: achieving high diagnostic performance for cartilage lesion detection. Radiology. (2018) 289:160–9. doi: 10.1148/radiol.2018172986
16. Lester, G. Clinical research in OA--the NIH osteoarthritis initiative. J Musculosk Neuro Interact. (2008) 8:313–4.
17. Knoll, F, Zbontar, J, Sriram, A, Muckley, MJ, Bruno, M, Defazio, A, et al. fastMRI: a publicly available raw k-space and DICOM dataset of knee images for accelerated MR image reconstruction using machine learning. Radiol Artif Intell. (2020) 2:e190007. doi: 10.1148/ryai.2020190007
18. Heimann, T, Morrison, B, Styner, MA, Niethammer, M, and Warfield, S (2010). Segmentation of Knee Images: A Grand Challenge. 3d segmentation in the clinic a grand challenge miccai workshop.
19. Lyons, TJ, Stoddart, RW, McClure, SF, and McClure, J. The tidemark of the chondro-osseous junction of the normal human knee joint. J Mol Histol. (2005) 36:207–15. doi: 10.1007/s10735-005-3283-x
20. Peterfy, CG, Guermazi, A, Zaim, S, Tirman, PFJ, Miaux, Y, White, D, et al. Whole-organ magnetic resonance imaging score (WORMS) of the knee in osteoarthritis[J]. Osteoarthr Cartil. (2004) 12:177–90. doi: 10.1016/j.joca.2003.11.003
21. Ronneberger, O, Fischer, P, and Brox, T. U-net: Convolutional networks for biomedical image segmentation 6M. New York: Springer International Publishing (2015).
22. Zongwei, Z, Rahman, SM, Tajbakhs, N, and Jianming, L. UNet++: A nested U-net architecture for medical image segmentation. Deep learning in medical image analysis and multimodal learning for clinical decision support. In 4th International Workshop, DLMIA 2018, and 8th International Workshop, ML-CDS 2018, held in conjunction with MICCAI 2018, Granada, Spain (2018). 3–11.
23. Xiao, X, Lian, S, Luo, Z, and Li, S. Weighted res-UNet for high-quality retina vessel segmentation. 9th International Conference on Information Technology in Medicine and Education (ITME), Hangzhou China (2018).s
24. Yiheng, Z, Yiheng, Z, Zhongliang, L, Zhongliang, L, and Nan, N. TranSegNet: Hybrid CNN-vision transformers encoder for retina segmentation of optical coherence tomography. Life. (2023) 13:976. doi: 10.3390/life13040976
25. Feghali, J, Jimenez, AE, Schilling, AT, and Azad, TD. Overview of algorithms for natural language processing and time series analyses. Acta Neurochirurgica. (2022) 134:221–42. doi: 10.1007/978-3-030-85292-4_26
26. Wang, Z, and Liang, L. Research on quantitative measurement method of articular cartilage thickness change based on MR image[J]. J Infect Public Health. (2020) 13:1993–6. doi: 10.1016/j.jiph.2019.08.020
27. Recht, MP, Kramer, J, Marcelis, S, Pathria, MN, and Trudell, D. Abnormalities of articular cartilage in the knee: analysis of available MR techniques. Radiology. (1993) 187:473–8. doi: 10.1148/radiology.187.2.8475293
28. Roos, EM, Engelhart, L, Ranstam, J, Anderson, AF, Irrgang, JJ, Marx, RG, et al. ICRS recommendation document: patient-reported outcome instruments for use in patients with articular cartilage defects[J]. Cartilage. (2011) 2:122–36. doi: 10.1177/1947603510391084
29. Norman, B, Pedoia, V, and Majumdar, S. Use of 2D U-net convolutional neural networks for automated cartilage and Meniscus segmentation of knee MR imaging data to determine Relaxometry and morphometry. Radiology. (2018) 288:177–85. doi: 10.1148/radiol.2018172322
30. Liu, F, Zhou, Z, Jang, H, Samsonov, A, and Zhao, G. Deep convolutional neural network and 3D deformable approach for tissue segmentation in musculoskeletal magnetic resonance imaging. Magn Reson Med. (2017) 79:2379–91. doi: 10.1002/mrm.26841
31. Shah, RF, Martinez, AM, Pedoia, V, Majumdar, S, Vail, TP, and Bini, SA. Variation in the thickness of knee cartilage. The use of a novel machine learning algorithm for cartilage segmentation of magnetic resonance images. J Arthroplast. (2019) 34:2210–5. doi: 10.1016/j.arth.2019.07.022
32. Si, L, Xuan, K, Zhong, J, Huo, J, and Xing, Y. Knee cartilage thickness differs alongside ages: a 3-T magnetic resonance research upon 2,481 subjects via deep learning. Front Med. (2021) 7:600049. doi: 10.3389/fmed.2020.600049
33. Wang, H, Zhu, H, and Ding, L. Accurate classification of lung nodules on CT images using the TransUnet. Front Public Health. (2022) 10:798. doi: 10.3389/fpubh.2022.1060798
34. Li, Z, Xin, ZDJ, and Weina, Z. Nn-TransUNet: an automatic deep learning pipeline for heart MRI segmentation. Life. (2022) 12:1570. doi: 10.3390/life12101570
35. Rao, BS, Aparna, M, Harikiran, J, and Reddy, TS. An effective Alzheimer's disease segmentation and classification using deep ResUnet and Efficientnet. J Biomol Struct Dyn. (2023) 20:1–12. doi: 10.1080/07391102.2023.2294381
36. Wang, J, and Liu, X. Medical image recognition and segmentation of pathological slices of gastric cancer based on Deeplab v3+ neural network. Comput Methods Prog Biomed. (2021) 207:106210. doi: 10.1016/j.cmpb.2021.106210
37. Shepherd, DE, and Seedhom, BB. Thickness of human articular cartilage in joints of the lower limb. Ann Rheum Dis. (1999) 58:27–34. doi: 10.1136/ard.58.1.27
38. Cohen, ZA, McCarthy, DM, Kwak, SD, Legr, P, and Fogarasi, F. Knee cartilage topography, thickness, and contact areas from MRI: in vitro calibration and in vivo measurements. Osteoarthr Cartil. (1999) 7:95–09. doi: 10.1053/joca.1998.0165
Keywords: knee, cartilage thickness, osteoarthritis, deep learning, convolutional neural network
Citation: Guo J, Yan P, Qin Y, Liu M, Ma Y, Li J, Wang R, Luo H and Lv S (2024) Automated measurement and grading of knee cartilage thickness: a deep learning-based approach. Front. Med. 11:1337993. doi: 10.3389/fmed.2024.1337993
Edited by:
Cong-Qiu Chu, Oregon Health and Science University, United StatesReviewed by:
Jan Kubicek, VSB-Technical University of Ostrava, CzechiaMohamed Mortada, Zagazig University, Egypt
Copyright © 2024 Guo, Yan, Qin, Liu, Ma, Li, Wang, Luo and Lv. This is an open-access article distributed under the terms of the Creative Commons Attribution License (CC BY). The use, distribution or reproduction in other forums is permitted, provided the original author(s) and the copyright owner(s) are credited and that the original publication in this journal is cited, in accordance with accepted academic practice. No use, distribution or reproduction is permitted which does not comply with these terms.
*Correspondence: Hao Luo, hao.luo@hit.edu.cn; Songcen Lv, lvsongcen2020@126.com