Potential biomarkers uncovered by bioinformatics analysis in sotorasib resistant-pancreatic ductal adenocarcinoma
 Prasanna Srinivasan Ramalingam1
  Annadurai Priyadharshini2
  Isaac Arnold Emerson2
  Sivakumar Arumugam1*
- 1Protein Engineering Lab, School of Biosciences and Technology, Vellore Institute of Technology, Vellore, India
- 2Bioinformatics Programming Laboratory, Department of Biotechnology, School of Biosciences and Technology, Vellore Institute of Technology, Vellore, Tamil Nadu, India
Background: Mutant KRAS-induced tumorigenesis is prevalent in lung, colon, and pancreatic ductal adenocarcinomas. For the past 3 decades, KRAS mutants seem undruggable due to their high-affinity GTP-binding pocket and smooth surface. Structure-based drug design helped in the design and development of first-in-class KRAS G12C inhibitor sotorasib (AMG 510) which was then approved by the FDA. Recent reports state that AMG 510 is becoming resistant in non-small-cell lung cancer (NSCLC), pancreatic ductal adenocarcinoma (PDAC), and lung adenocarcinoma patients, and the crucial drivers involved in this resistance mechanism are unknown.
Methods: In recent years, RNA-sequencing (RNA-seq) data analysis has become a functional tool for profiling gene expression. The present study was designed to find the crucial biomarkers involved in the sotorasib (AMG 510) resistance in KRAS G12C-mutant MIA-PaCa2 cell pancreatic ductal adenocarcinoma cells. Initially, the GSE dataset was retrieved from NCBI GEO, pre-processed, and then subjected to differentially expressed gene (DEG) analysis using the limma package. Then the identified DEGs were subjected to protein–protein interaction (PPI) using the STRING database, followed by cluster analysis and hub gene analysis, which resulted in the identification of probable markers.
Results: Furthermore, the enrichment and survival analysis revealed that the small unit ribosomal protein (RP) RPS3 is the crucial biomarker of the AMG 510 resistance in KRAS G12C-mutant MIA-PaCa2 cell pancreatic ductal adenocarcinoma cells.
Conclusion: Finally, we conclude that RPS3 is a crucial biomarker in sotorasib resistance which evades apoptosis by MDM2/4 interaction. We also suggest that the combinatorial treatment of sotorasib and RNA polymerase I machinery inhibitors could be a possible strategy to overcome resistance and should be studied in in vitro and in vivo settings in near future.
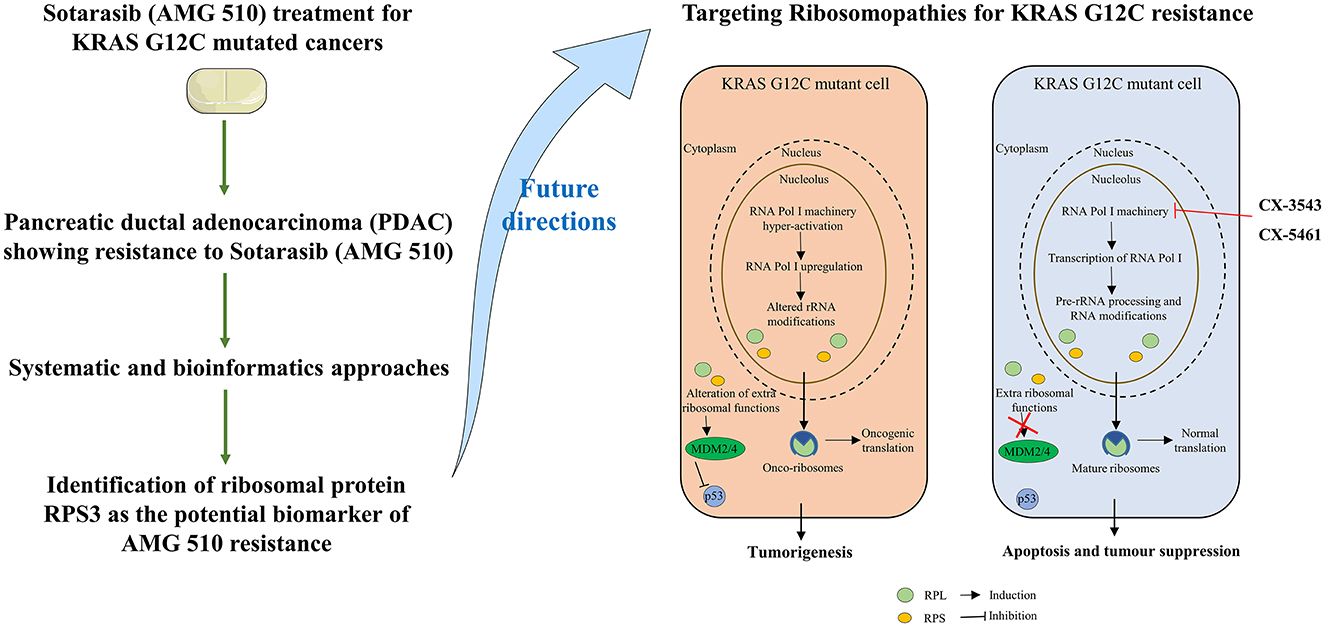
Graphical Abstract. Study outcomes and proposed future directions to combat sotorasib resistance in KRAS G12C mutant cells.
1. Introduction
Mutant RAS-harboring cancers are predominant in many cancers including pancreatic, breast, colon, and lung, which corresponds to nearly 30% of all cancers (1, 2). Unlike NRAS and HRAS isoforms of RAS, the KRAS isoform has high mutation frequencies at mutational hotspots G12 (89%), G13 (9%), and Q61 (1%) residues (3–5). Overall, the G12th residue is the most mutated position of KRAS with G12D as the most prevalent mutation with 36%, followed by the G12V and G12C mutations with 23 and 14%, respectively (6). KRAS is a small GTPase that acts as a molecular switch by GTP-bound (active form) and GDP-bound (inactive form) states and triggers the downstream signal transduction pathways (7, 8). The GDP to GTP conversion is mediated by the guanine nucleotide exchange factors (GEFs), and the GTP to GDP hydrolysis is mediated by GTPase-activating proteins (GAPs) (9, 10). The mutant KRAS maintains the GTP-bound active state and overcomes the GTPase activity and initiates nearly 80 different downstream effector signaling pathways including MAPK and PI3K-mTOR signaling which further activates JUN and MYC transcription factors and promotes the cancer cell survival and proliferation (11–15).
Several strategies have been carried out to inhibit the mutant KRAS signaling such as targeting the upstream effectors (EGFR inhibitors, FGFR1 inhibitors, and IGF1R inhibitors); targeting the inhibitors of KRAS regulators (SOS1 inhibitors and SHP2 inhibitors); direct targeting of KRAS (KRAS on state and off-state inhibitors); downstream effector inhibitors (PI3K inhibitors, mTOR inhibitors, and MEK inhibitors); and cell cycle arrest (CDK4/6 inhibitors) (16–19). Moreover, targeting the other mediators and effectors in the MAPK pathway result in the signaling crosstalk such as MEK-PI3K, RAF-AKT, RAS-SKF, RAS-YAP, and SHP2-dependent MAPK reactivation and SHP2-independent PI3K reactivation (20–22). All the strategies have shown significant outcomes, but the complete inhibition of KRAS was promising in the direct targeting strategy. In general, the intracellular levels of GTP are in micromolar (μM) ranges, and its binds with picomolar (pM) affinity to the GTP-binding pocket of the KRAS, which challenges it as undruggable to the medicinal chemistry and drug discovery researchers to design and develop a potent KRAS mutant small molecule inhibitors (23–25). Finally, the undruggable became druggable by the successful discovery and FDA approval of KRAS G12C inhibitor sotorasib (AMG 510) for the treatment of non-small-cell lung cancer (NSCLC) and other solid tumors (26–28). The sotorasib specifically targets the cryptic pocket of the KRAS G12C (H95/Y96/Q99) and forms the covalent bond with the reactive cysteine at the 12th position, which also limits its ability to target other KRAS mutants such as G12D and G12V that lacks reactive cysteine (29). Recently, in December 2022, FDA granted the accelerated approval for adagrasib (MRTX849) for the treatment of KRAS G12C-mutated NSCLC (30).
Accumulating pieces of evidence report that sotorasib is becoming resistant among NSCLC, pancreatic ductal adenocarcinoma, and colorectal adenocarcinoma patients bearing KRAS G12C mutation and even resulting in hepatotoxicity (31, 32). The understanding of this resistance mechanism is challenging due to the intracellular heterogeneity and variability of KRAS G12C-mutated cancer cells (33). Hence, to identify the crucial biomarkers involved in the sotorasib resistance, we have retrieved the RNA-seq data from the NCBI GEO database of AMG 510 treated (resistant) and untreated in KRAS G12C-mutant MIA-PaCa2 pancreatic ductal adenocarcinoma cells. The differentially expressed genes (DEGs) were identified by the linear model, and then, the DEGs were subjected to protein–protein interaction (PPI), cluster analysis, and hub gene analysis. In addition to this, the resulting probable biomarkers were also subjected to gene ontology (GO), pathway enrichment, and survival analyses to find the crucial biomarker in the sotorasib resistance.
2. Materials and methods
2.1. Data collection and pre-processing
The RNA-seq dataset retrieved for this study was accessed through NCBI Gene Expression Omnibus (GEO) database (http://www.ncbi.nlm.nih.gov/geo/). The keywords used for filtering the dataset include “KRAS mutated Pancreatic cancer” and “Homo sapiens” (organism). The datasets were screened, and “GSE178479” was retrieved for this study in which the sotorasib (AMG 510) resistance in the KRAS G12C-mutant MIA-PaCa2 pancreatic ductal adenocarcinoma cells was reported (34). The sequencing platform and the platform ID of the sample were “Illumina HiSeq 4000” and “GPL20301,” respectively. The number of samples used in this study was two, which includes RNA-seq profiles of AMG 510 treated (rep1 and rep2) and AMG 510 untreated (rep1 and rep2) MIA-PaCa2 cells. The present study was carried out to predict the crucial biomarkers involved in the AMG 510 resistance in pancreatic ductal adenocarcinoma cells.
The count matrix of the samples was prepared based on the matrix file information provided in the GEO database (35). The lowly expressed genes were filtered based on their counts using the counts per million (CPM) function in the edgeR package with the threshold of 0.5. Box plots were used to check the distribution of the read counts on the log2 scale (36). The CPM function provided the log2 counts per million which are then corrected for different library sizes. The CPM function also adds a small offset to avoid taking a log of zero. The trimmed mean of M-value (TMM) normalization was performed to eliminate composition biases between the libraries (37). This generates a set of normalization factors, where the product of these factors and the library sizes define the effective library size. The calcNormFactors function calculated the normalization factors between libraries.
2.2. Differential gene expression analysis
The limma package (38, 39) with the voom function was used, which transforms the read counts into logCPMs while taking account of the mean–variance relationship in the given data (40, 41). After vooming, we applied a linear model to the voom transformed data to test for differentially expressed genes (DEGs) using standard limma commands.
The voom transformed data have been used in limma to test for differential gene expression. The linear model fit was designed for each gene using the lmFit function in limma which estimates the groups and gene-wise variances. The contrast between the groups was then analyzed based on the makeContrasts function. Then the contrasts matrix was fitted to the object to get the statistics and estimated parameters. Here, we called the contrasts.fit function in limma. Furthermore, we called the eBayes function to perform the empirical Bayes shrinkage on the variances and estimated the logFC of 0.05 and their associated p-values. Finally, to increase the significance and reduce the false discovery rates, we used the TREAT function to predict specific genes (42–44).
2.3. Network analysis
The differentially expressed genes (DEGs) filtered through the TREAT function were then subjected to the STRING database (https://string-db.org/) to predict the protein–protein interactions (PPIs) with a confidence level of 0.004 and higher, and the first shell of 10 interactions was used as a filter (45). The MCODE and CytoHubba were used to analyze the probable marker genes among the DEGs (46).
2.4. Enrichment and survival analysis
The hub genes resulting from the network analysis were then subjected to gene ontology using the enrichGO function in the clusterProfiler package (47). The enriched biological process (BP), cellular components (CC), and molecular functions (MF) were analyzed using the enrichGO function. The KEGG pathway analysis was also carried out using the enrichKEGG function to analyze the enriched terms.
The Kaplan–Meier (KM) survival analysis was carried out based on the Spearman correlation using the Kaplan–Meier plotter online tool employing the median patient splitting mode (48, 49). Hazard is the defined slope for the survival curve which measures the incidence of death, and the hazard ratio (HR) compares the two treatment groups. If HR is 2.0, then the rate of death in one treatment group is twice the other group (50). A statistical hypothesis test was calculated based on a log-rank test. The schematic representation of the workflow of the study is shown in Figure 1.
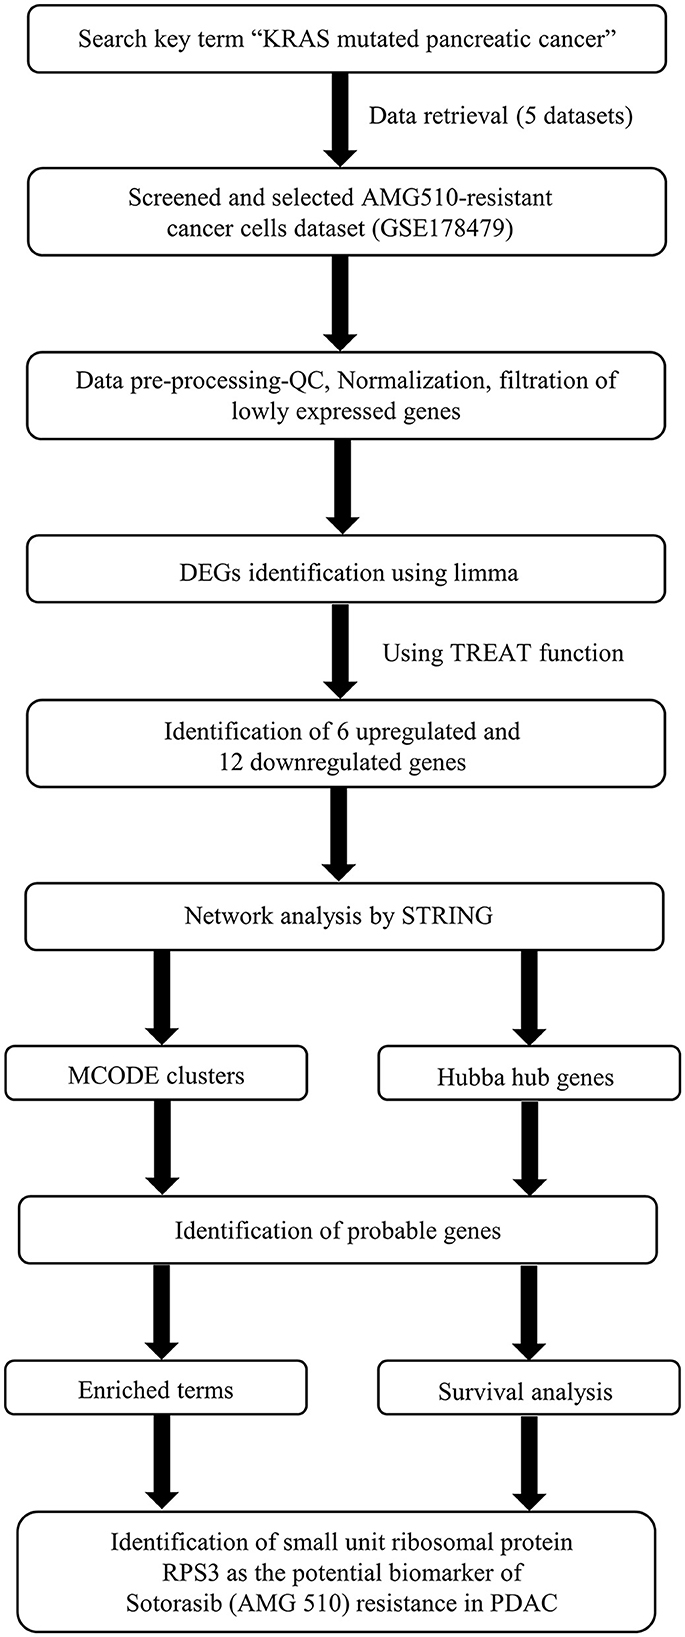
Figure 1. Schematic representation of the workflow of the study.
3. Results
3.1. Identification of differently expressed genes
Through limma analysis, we have tested the difference between the sotorasib (AMG 510) treated and untreated samples to analyze the genes responsible for the AMG 510 resistance in the treated group. The voom transformation of adjusting the library size with the normalization factors was analyzed through a mean–variance trend. The comparative boxplot analysis of unnormalized logCPM with the voom transformed logCPM is shown in Figure 2 which represents the precision of normalization. The CPM plot of count data after filtering the lowly expressed genes is provided in Supplementary Figure 1. The mean–variance relationship helps to analyze whether the low counts are filtered adequately and variation in the data by estimating the relationship of the log counts, which generates a precision weight for each observation and enters these into the limma empirical Bayes analysis. The voom mean–variance trend curve is shown in Supplementary Figure 2.
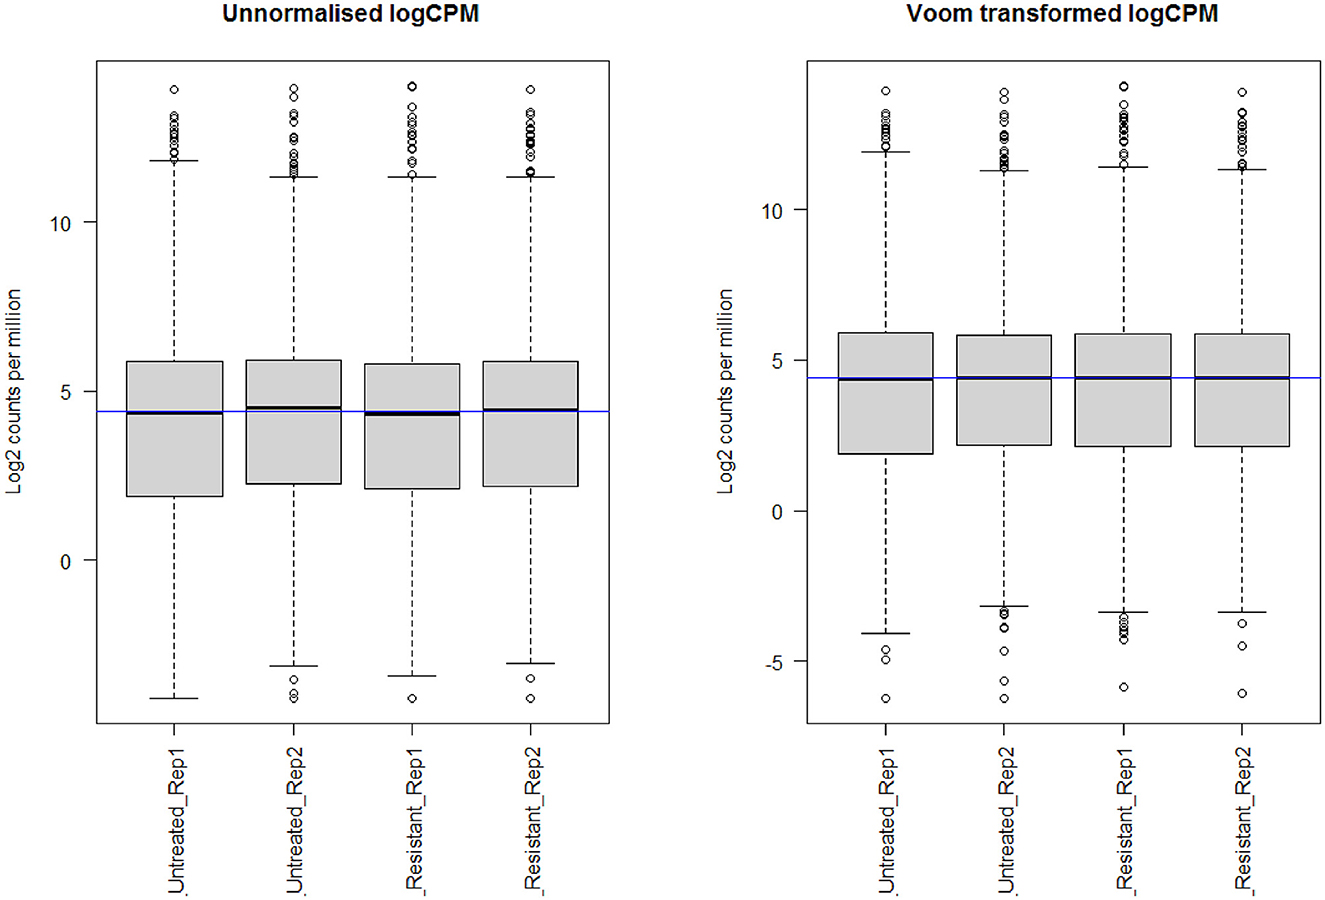
Figure 2. Boxplot analysis of unnormalized logCPM with the voom transformed logCPM.
The empirical Bayes function was used to analyze the DEGs with the linear model fit. The linear model fit resulted in the identification of upregulated and downregulated genes from the DEGs. In this study, it resulted in the differentially expressed genes among the AMG 510 treated (resistant) and untreated groups, which are repressed through the MA plot as shown in Figure 3 and the volcano plot as shown in Figure 4. Initially, the raw RNA-seq data were retrieved, pre-processed, and the differentially expressed genes (DEGs) were predicted using a cutoff on the log fold change threshold of 0.5. The p-value threshold of 0.05 resulted in the identification of 330 upregulated genes and 499 downregulatory genes as shown in Figure 4, and the complete list of DEGs is provided in Supplementary Table 1. To reduce false discovery rates, we further applied TREAT (t-tests relative to a threshold) function in the limma package, which resulted in the identification of six upregulated DEGs and 12 downregulated DEGs.
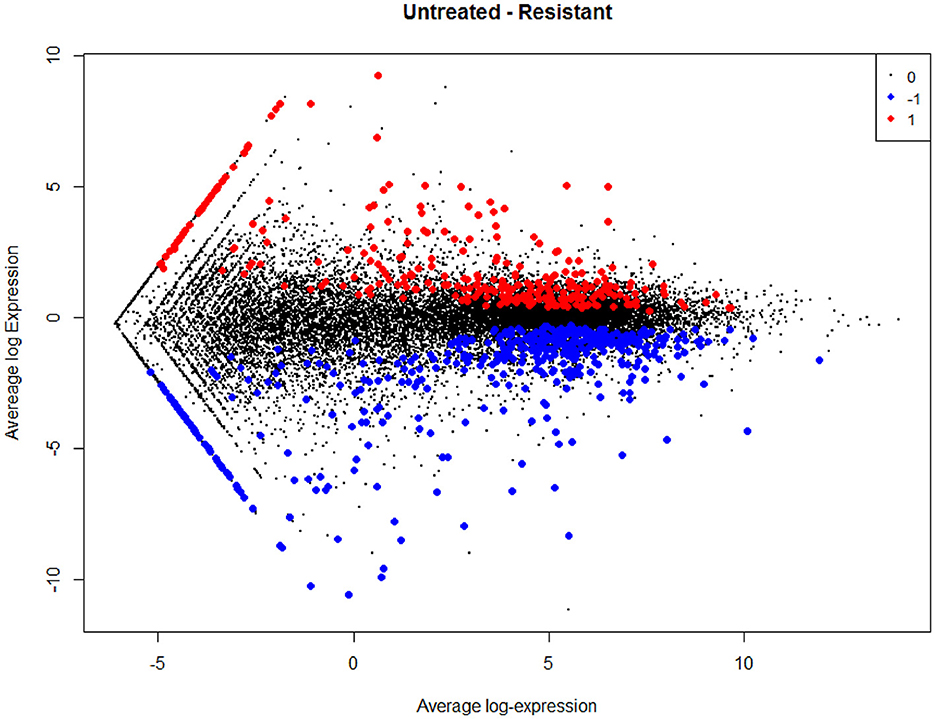
Figure 3. MA plot used to represent log fold change vs. mean expression between the two groups (AMG 510 treated and untreated). A scatter plot depicts the normalized mean expression on the x-axis and base-2 log fold change on the y-axis. The red dots represent the upregulated genes, the blue dots represent the downregulated genes, and the black dots represent the non-significant genes.
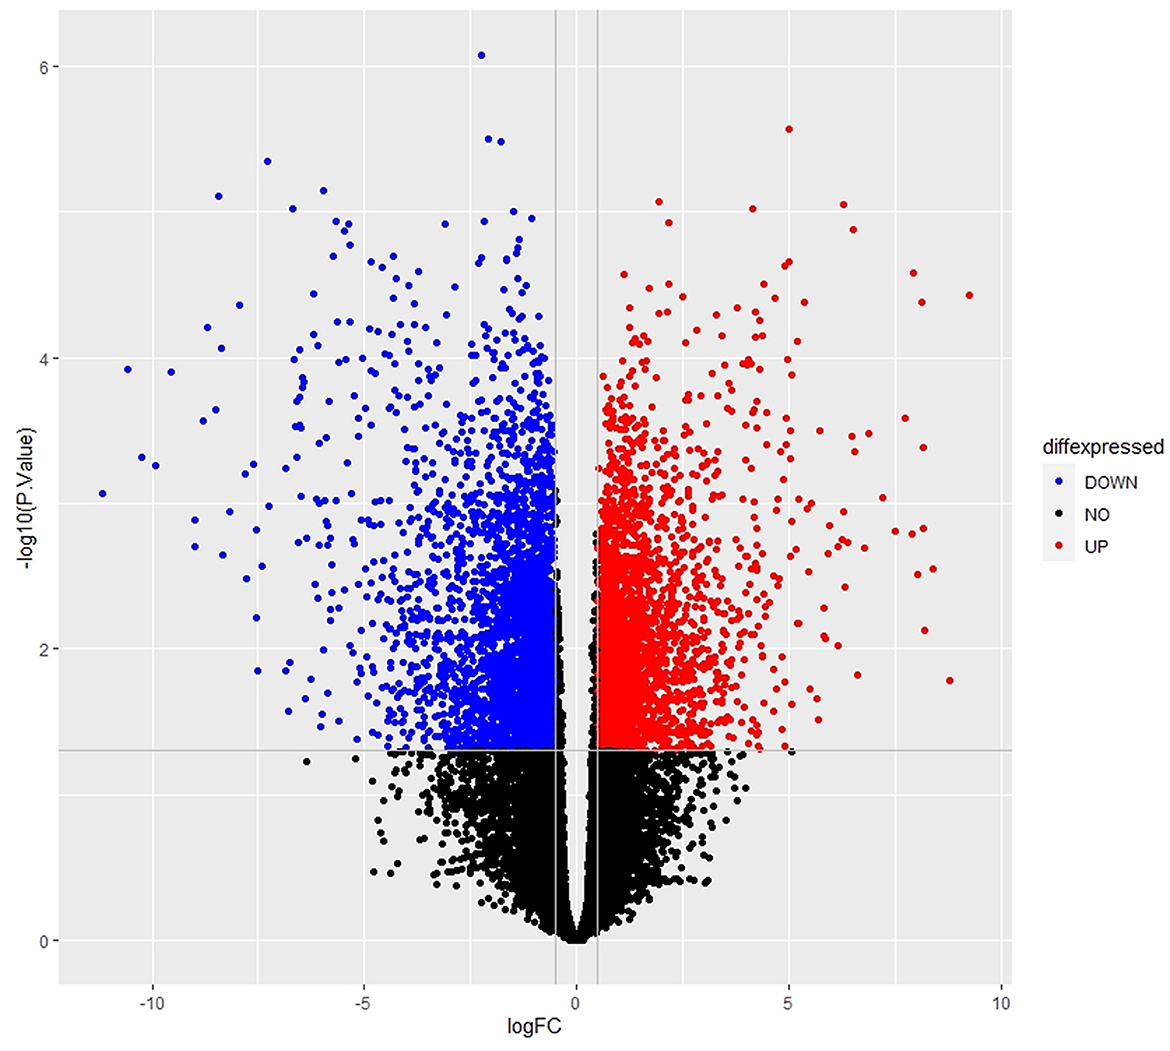
Figure 4. Volcano plot of the DEGs depicts the logFC on the x-axis and –log10 (p-value) on the y-axis. The red dots represent the upregulated genes, the blue dots represent the downregulated genes, and the black dots represent the non-significant genes.
3.2. Network analysis
The interaction network was visualized using Cytoscape using molecular complex detection (MCODE) to find the significant clusters between each node representing a gene while edges represent the interaction of the molecules. The default parameters were set including the degree cutoff of 2, node score cutoff of ≥0.2, K-score of ≥2, and max depth from seed of 100. Finally, the MCODE resulted in six clusters with the highest nodal score of 22 as shown in Figure 5.
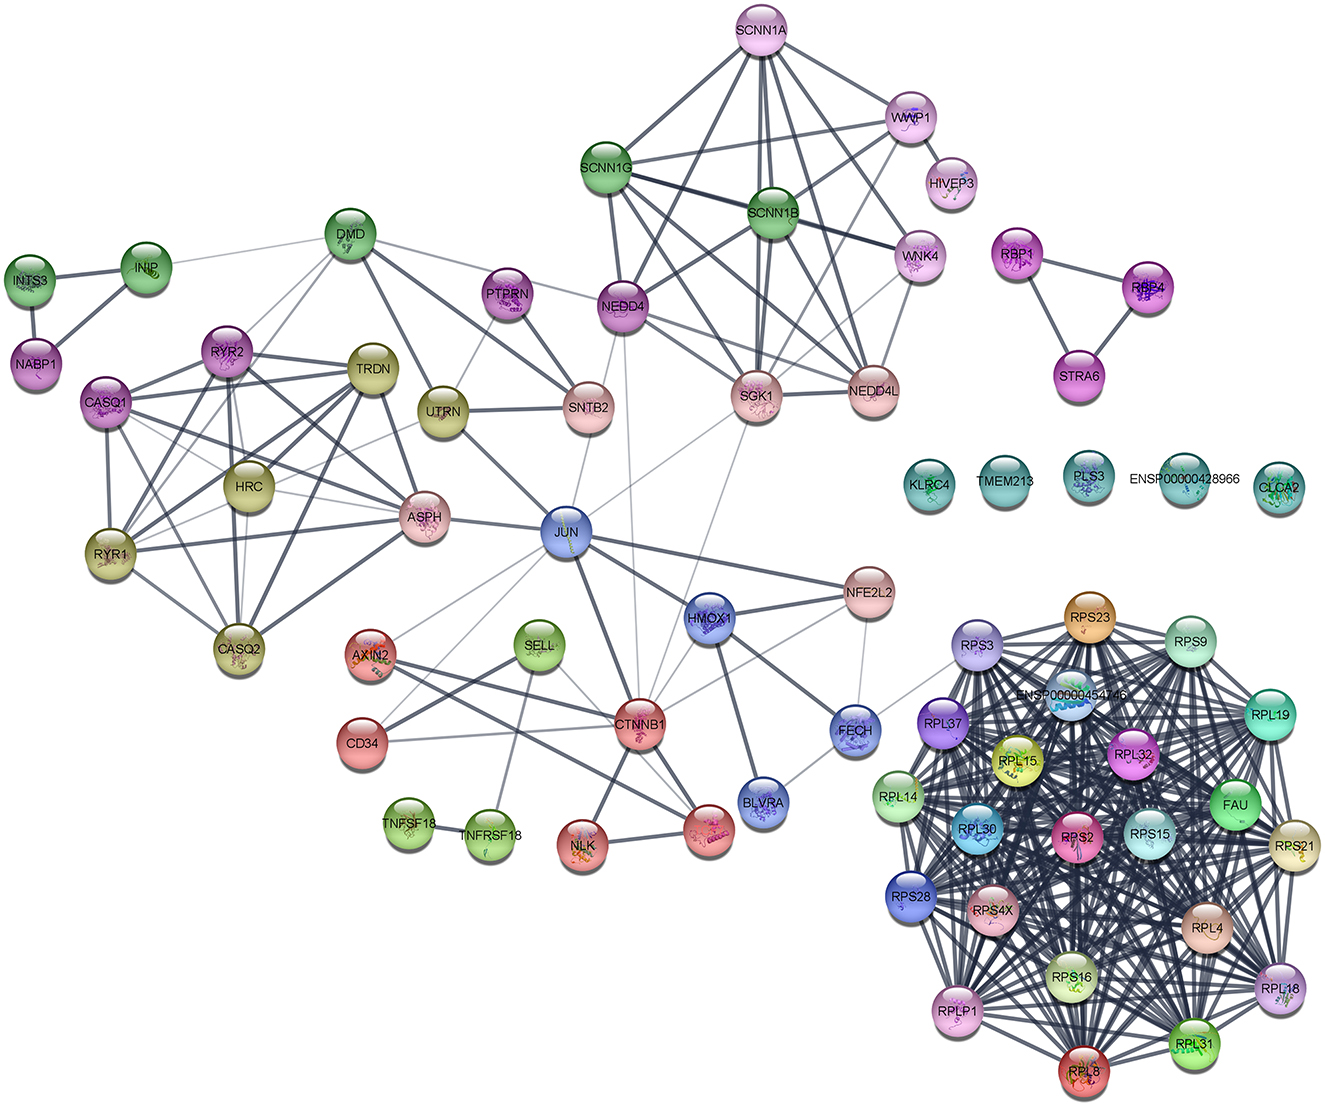
Figure 5. Protein–protein interaction (PPI) network of DEGs obtained from the STRING database.
The probable marker genes have been identified based on the highly connected nodes using CytoHubba in Cytoscape. It uses 12 scoring methods to identify the markers, namely, betweenness, bottleneck, closeness, clustering coefficient (CC), degree, the density of maximum neighborhood component (DMNC), eccentricity (EcC), edge percolated component (EPC), maximal clique centrality (MCC), maximum neighborhood component (MNC), radiality, and stress. The top 10 genes from each scoring method were isolated. Genes that are common in more than five scoring methods and also have an impact on MCODE were considered hub genes.
3.3. Enrichment analysis
The enrichment analysis was performed with the GO terms: biological process (BP), cellular components (CC), and molecular functions (MF). The biological process includes cytoplasmic translation, ribosomal small subunit assembly, ribosome assembly, ribosomal small subunit biogenesis, non-membrane-bounded organelle assembly, negative regulation of protein ubiquitination, and negative regulation of protein modification by small protein conjugation or removal. Cellular components include cytosolic ribosome, ribosomal subunit, ribosome, cytosolic small ribosomal subunit, cytosolic large ribosomal subunit, small ribosomal subunit, large ribosomal subunit, focal adhesion, cell–substrate junction, polysome, polysomal ribosome, rough endoplasmic reticulum, cytoplasmic side of endoplasmic reticulum membrane, rough endoplasmic reticulum membrane, and euchromatin. Molecular functions are structural constituents of the ribosome and rRNA binding. The enriched GO terms of biological process (BP), cellular components (CC), and molecular functions (MF) are shown in Figure 6 and Table 1. Then the KEGG pathway analysis was also carried out, and the enriched term was observed as “hsa03010:Ribosome.”
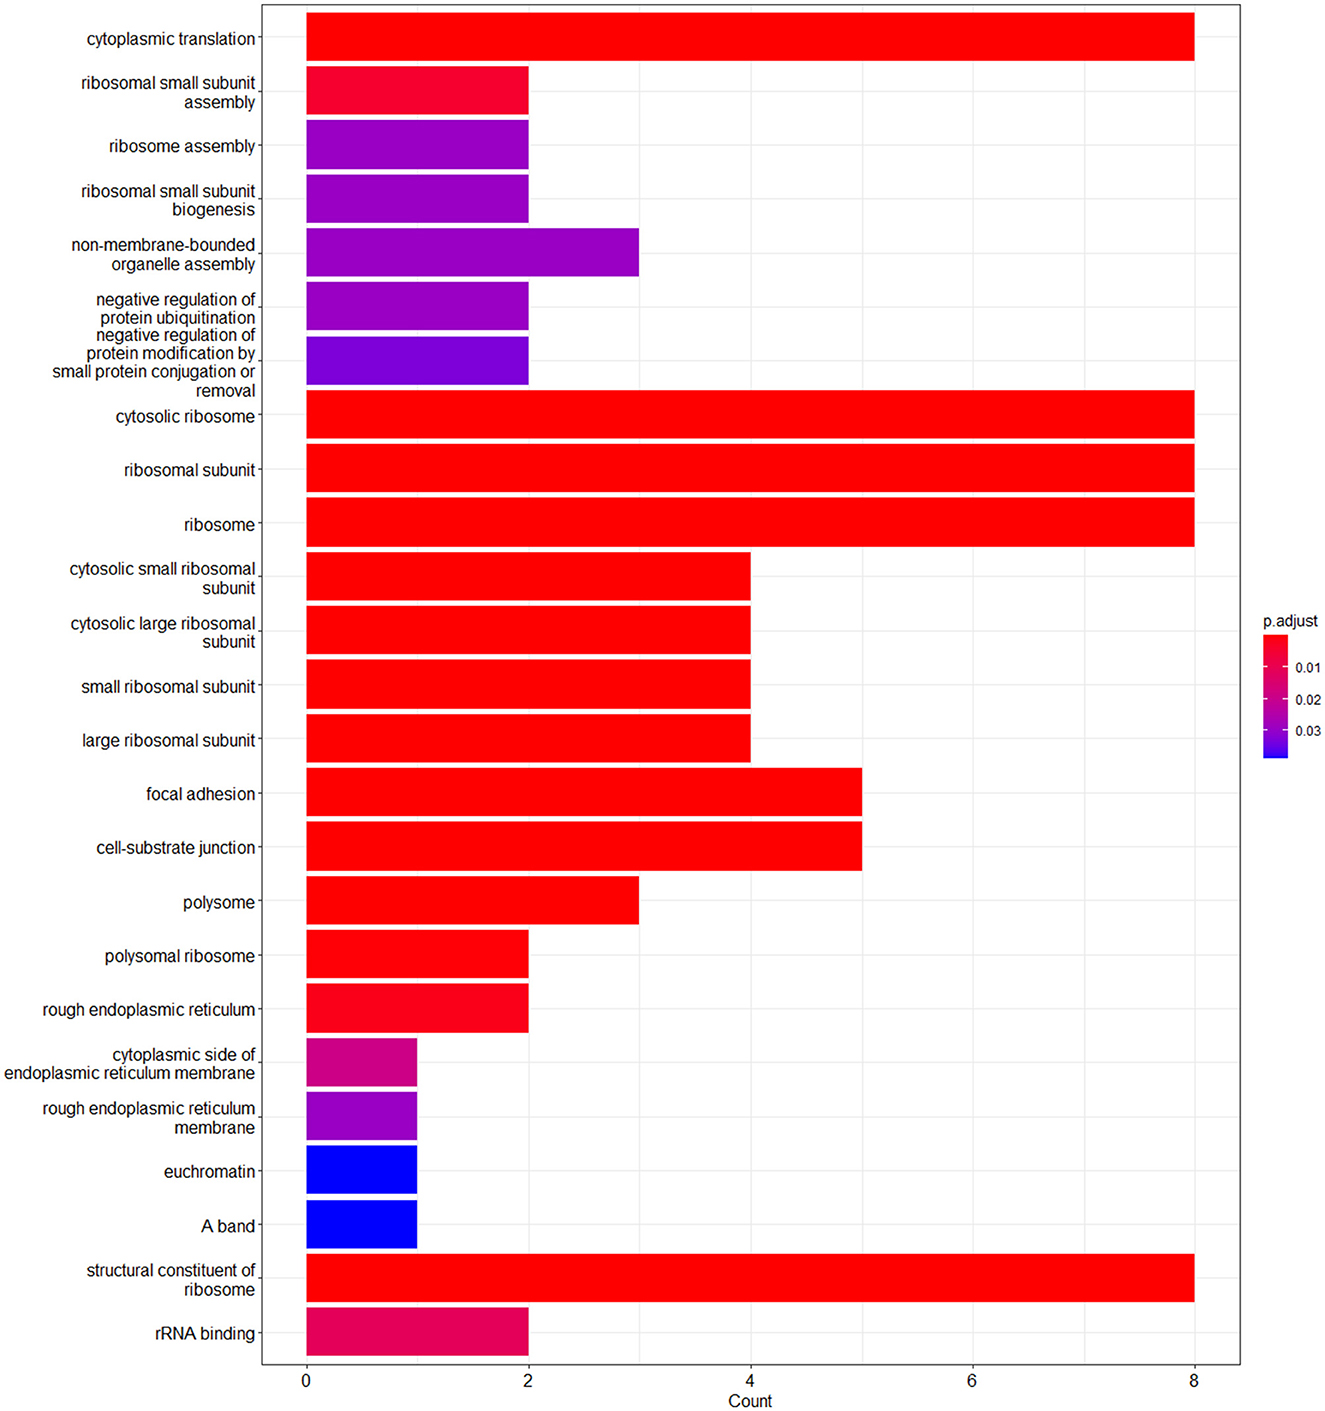
Figure 6. Bar plot of the enriched GO terms analyzed using enrichGO function using cluster profiler.
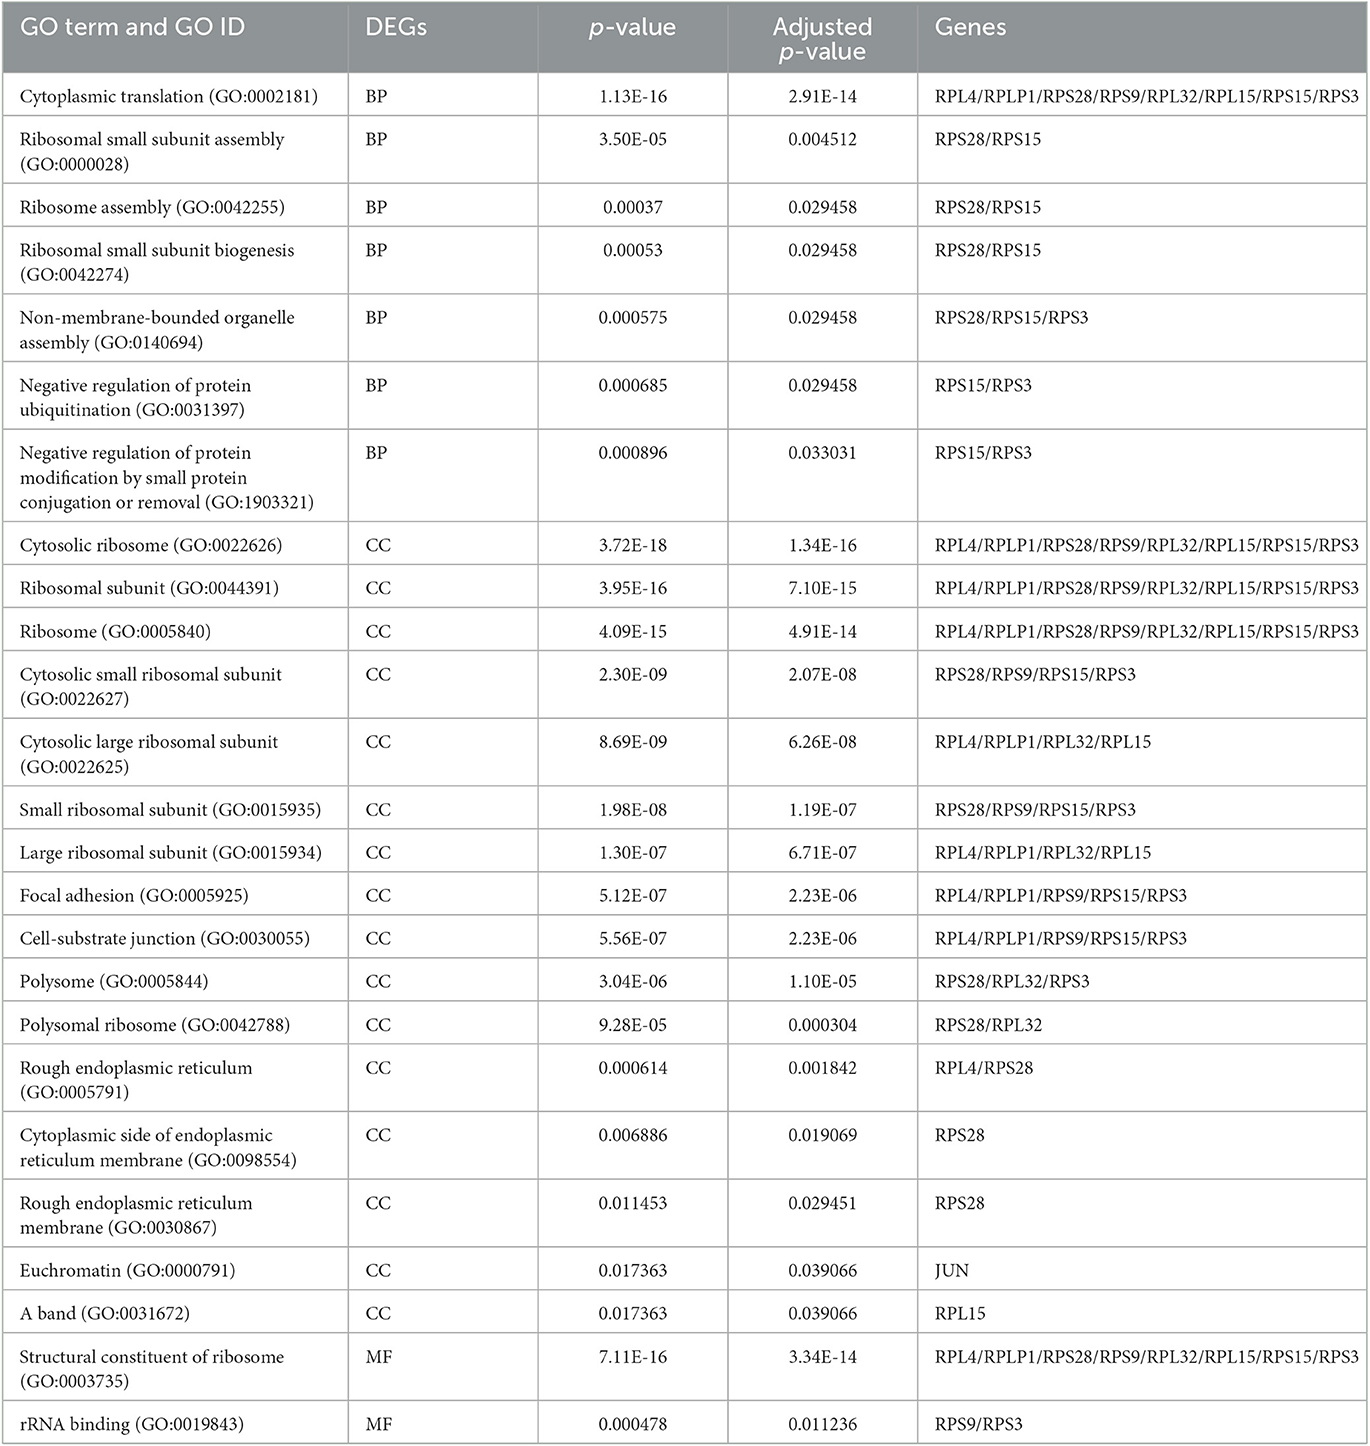
Table 1. Gene ontology analysis of the enriched terms.
3.4. Survival analysis
The Kaplan–Meier (KM) survival analysis plot was created based on Spearman's correlation, using the hazard ratio (HR) and log-rank test of the genes. In general, HR > 1 represents that the low-expression group has a higher chance of survival than the high-expression group, and HR < 1 represents that high-expression groups have a higher chance of survival than the low-expression group. The survival analysis of probable genes showed that the low expression of RPL4, RPL32, RPLP1, and RPS3 would have a higher probability for survival, and the high expression of RPS28, RPS15, RPS9, RPL15, and JUN would have a higher probability for survival. Based on the log-rank test, the significance level was set to 0.05, and if the calculated p-value is >0.05, the null hypothesis is retained. Based on these criteria, the ribosomal protein RPS3 was identified as a probable biomarker that showed high survival rates and p < 0.05 as shown in Figure 7. In addition, the HR of RPS3 is almost near two which indicates that it has twice the rate of death when compared to the others. The KM survival plots of RPL15, RPS15, RPS28, RPL4, RPL32, RPLP1, RPS9, and JUN are shown in Supplementary Figure 3.
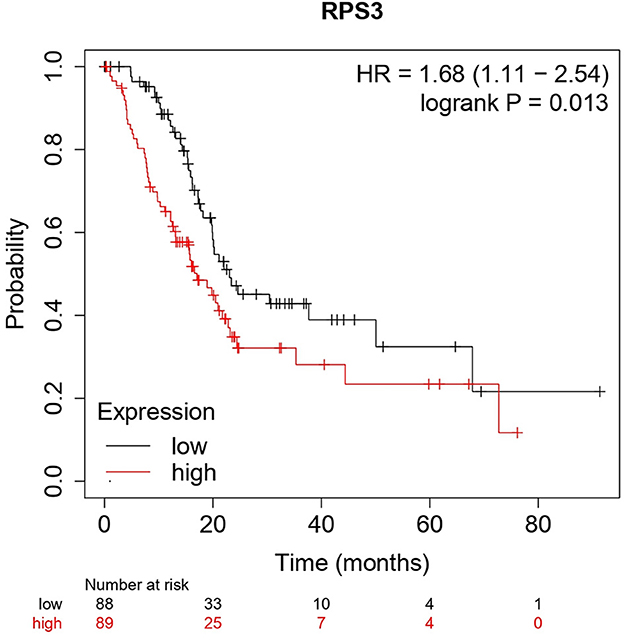
Figure 7. The Kaplan–Meier plot for survival analysis of key biomarkers RPS3. The x-axis represents the time in months, while the y-axis represents the probability of survival. The red and black colors represent the high expression and low expression of the biomarkers, respectively.
4. Discussion
KRAS mutations are prevalent in many cancers including pancreatic, breast, colon, and lung with mutational hotspots at G12 (89%), G13 (9%), and Q61 (1%) residues (1, 2). The G12D, G12C, and G12V are frequent mutations with 36, 23, and 14% expressions, respectively (6). Of note, the KRAS G12C mutation is relatively high in lung adenocarcinoma than in pancreatic adenocarcinoma patients. The direct inhibition of the mutant KRAS is very prominent over other strategies but challenges the small molecule inhibitor development due to their high-affinity GTP-binding pocket and smooth surface (16, 51). Structure-based drug design guided the development and FDA approval of first-in-class potential KRAS G12C inhibitor sotorasib (AMG 510) that has changed the scenario in which the mutant KRAS became undruggable (26). Recently, in December 2022, FDA granted the accelerated approval for Adagrasib (MRTX849) for the treatment of KRAS G12C-mutated NSCLC (30). In addition to this, several pharma industries have initiated to design and develop novel KRAS mutant inhibitors (mutant specific/pan-KRAS). Several KRAS G12C (GDP-bound off state) inhibitors, such as sotorasib (AMG 510), adagrasib (MRTX849), GDC-6036, JNJ-74699157, D-1553, JDQ443, LY3537982, LY3499446, ARS1620, and KRAS G12C (GDP-bound off state) inhibitors such as RMC-6291, RMC-6236, and RM-018, and Pan KRAS Switch I/II inhibitors such as BI-2852, are being studied in preclinical and clinical studies (18, 52–55). Recent pieces of evidence report the resistance to AMG 510 among KRAS G12C-mutant cancer patients (31, 33). Moreover, Adagrasib (MRTX849) and ARS1620 were reported to have acquired resistance in KRAS G12C-mutant cells (33, 56). Amplification of the mesenchymal epithelial transition factor receptor (MET); activating mutations of downstream effectors, such as BRAF, and dual specificity mitogen-activated protein kinase kinase 1 (MEK1); oncogenic fusion with fibroblast growth factor receptor 3 (FGFR3) and CCDC6-RET; and loss-of-function mutations of phosphatase and tensin homolog (PTEN) and neurofibromin 1 (NF1) were reported to be the key elements involved in the resistance mechanisms to KRAS mutant inhibitors in lung adenocarcinoma and colorectal adenocarcinoma (56, 57). Unlike the abovementioned resistance mechanisms, our results revealed a significant correlation between the sotorasib resistance in KRAS G12C-mutant cells and ribosomopathies.
Recently Chan et al. (34) reported an interesting study on the identification of sotorasib (AMG 510) resistance in the KRAS G12C-mutant MIA-PaCa2 pancreatic ductal adenocarcinoma cells when treated with increasing dosage (0.1–5 μM) for 60 days and found that MIA-PaCa2 showed resistance at 5 μM treatment of AMG 510 (34). This interested us to identify the crucial biomarkers involved in the AMG 510 resistance in the KRAS G12C-mutant MIA-PaCa2 pancreatic ductal adenocarcinoma cells. In addition to MIA-PaCa2 cells, they have also tested the AMG 510 resistance in SW1463 human Caucasian rectum adenocarcinoma, LU99 lung giant cell carcinoma, and LU65 lung carcinoma cell lines which have KRAS G12C mutations.
The main aim of the present study was to identify the key biomarker genes involved in the AMG 510 resistance. Initially, the raw RNA-seq data were retrieved, pre-processed, and the differentially expressed genes (DEGs) were predicted which resulted in the identification of 330 upregulated genes and 499 downregulatory genes as shown in Figure 4 and Supplementary Table 1. The t-tests relative to a threshold (TREAT) function reduced the false discovery rates of DEGs (42), which further resulted in the identification of six upregulated and 12 downregulated genes. These filtered DEGs were studied for the protein–protein interaction network using STRING which resulted in four MCODE clusters, and the MCODE cluster 1 showed the highest nodal density among the other clusters as shown in Figure 5. In addition, cluster analysis and hub gene analysis were carried out which resulted in probable biomarkers as shown in Figure 6, and the enriched GO terms of biological process (BP), cellular components (CC), and molecular functions (MF) are shown in Table 1. In general, HR > 1 represents that the low-expression group has a high chance of survival than the high-expression group, and HR < 1 represents that the high-expression group has a high chance of survival than the low-expression group (58). Finally, the survival analysis based on the hazard ratio and log-rank test resulted in the identification of RPS3 as the probable biomarker with high survival rates and p < 0.05 as shown in Figure 7. Based on the log-rank test, the significance level was set to 0.05, and if the calculated p-value is >0.05, the null hypothesis is retained. Moreover, the HR of RPS3 is nearly 2 which indicates that it has twice the rate of death when compared to the others. The KM survival plots of RPL15, RPS15, RPS28, RPL4, RPL32, RPLP1, RPS9, and JUN are shown in Supplementary Figure 3. In addition, the GO of all the 330 upregulated genes and 499 downregulatory genes shown in Supplementary Table 1 reveals that the myc transcriptional targets, such as E2F transcription factor 6 (ENSG00000169016), are upregulated and the CDK10 (ENSG00000185324) is downregulated. Generally, the E2F6 regulates the gene expression of proteins involved in cell proliferation and the CDK10 acts as a tumor suppressor. Furthermore, the CDC25B (ENSG00000101224) expression has a p53-dependent tumor suppressive effect, which is downregulated. The anti-apoptotic BCL-6 (ENSG00000113916) is downregulated. The abovementioned targets are also involved in the RAS signaling pathway. These data suggest that the resistance could be a result of RNA pol I machinery hyperactivation and apoptosis evasion. The present study revealed that the small unit ribosomal protein RPS3 is known to be only expressed in the AMG 510 resistant MIA-PaCa2 cells and identified as a significant biomarker involved in the resistance of AMG 510. These novel identifications resulted from the emergence and accumulation of RNA-Seq data of drug-resistant cancer cells.
Ribosome biogenesis starts from the nucleolus and ends in the cytoplasm with the formation of the mature ribosome from rRNA and ribosomal proteins (59). In normal cells, the RNA pol I initiates the Pol I transcription followed by the pre-rRNA processing and modification and then assembled with ribosomal proteins (RPs) to form mature 60s and 40s subunits and ultimately takes part in protein synthesis. Unlike normal cells, the RNA pol I is hyperactivated leading to the altered rRNA modifications and altered RPs extraribosomal functions, thus forming the onco-ribosomes and translating the oncogenic mRNAs and ultimately ending with ribosomopathies (59). Some large subunit ribosomal proteins, such as RPL5, RPL9, RPL10, RPL11, RPL15, RPL21, RPL22, RPL23A, RPL27, RPL31 RPL34, RPL35, RPL36, and large subunit ribosomal proteins, such as RPS7, RPS15, RPS15A, RPS17, RPS19, RPS20, RPS24, RPS27, and RPSA, are reported to have significant roles in the progression of various types of cancers including lung, colon, breast, and pancreatic cancers (60–62). Generally, the ribosomal proteins (RPs) directly/indirectly interact with the Mdm2/Mdm4 E3 ubiquitin-protein ligases, which in turn regulate the degradation of p53 tumor suppressor protein resulting in the tumor progression (62, 63). An interesting study reports that the WD repeat-containing protein 74 (WDR74) alters the RPL5 levels and promotes metastasis by degrading p53 via the RPS15-Mdm2 axis in lung carcinoma (64). The ribosomal proteins were upregulated in KRAS mutant Panc-1 cells, and their inhibition results in cell cycle arrest, apoptosis induction, and antiproliferation (65, 66).
RPS3 knockdown in Caco-2 colon cancer cells showed decreased cancer progression and increased apoptosis via p53 upregulation and reduced activity of lactate dehydrogenase (LDH) (67). RPS3 was also reported to induce apoptosis by disrupting its interaction with E2F1 and also upregulates the expression of pro-survival genes in NSCLC (68). On this note, the mutations in the ribosomal proteins are also highly involved in tumorigenesis. The RPs were reported to interact with MDM2/4 and inhibit p53, and overexpression was observed as a result of the hyperactivation of RNA polymerase I machinery. The inhibition of RNA polymerase I machinery by inhibitors, such as CX-3543 and CX-5461, promotes p-53-dependent apoptosis in several cancers (69, 70). The clinical trials of RNA polymerase I machinery by inhibitors CX-5461 (NCT02719977) and CX-3543 (NCT00955786) resulted in the identification of safety, tolerable dosage, and effective dosage regimes and also resulted in less toxicity in patients (71). The potential of individual RNA polymerase I machinery inhibitors was studied, and combination strategies have to be studied in near future from the successful interventions from preclinical studies. Chan et al. (34) reported that the sotorasib resistance was offered by the PAK/PI3K pathway in KRAS G12C-mutant MIA-PaCa2 cells, and our bioinformatics analysis showed that RPS3 was the crucial biomarker. Recent reports show that RPS3 mediates the PI3K-Akt signaling axis in cancer cells, which correlates with our findings from the study (72, 73).
From the above understandings, we observe and conclude that the small unit ribosomal protein RPS3 is the crucial biomarker of the AMG 510 resistance in KRAS G12C-mutant MIA-PaCa2 cell pancreatic ductal adenocarcinoma cells. The study outcomes and the possible future directions to combat the Sotorasib resistance in KRAS G12C mutant cells were shown in the Graphical Abstract. Co-targeting of ribosomal proteins along with the target-specific inhibitors (here KRAS G12C-mutant inhibitor) will pave way for the development of precision treatment, such as using CRISPR-Cas and T-cell immunotherapy, in cancer.
5. Conclusion
The current study was performed to evaluate the crucial biomarkers involved in the KRAS G12C inhibitor, sotorasib (AMG 510). From the analysis, we finally conclude that the ribosomal protein RPS3 is the crucial biomarker involved in the AMG 510 resistance in the KRAS G12C-mutant MIA-PaCa2 cell pancreatic ductal adenocarcinoma cells. From the study results and previous literature, we also report that resistance could result from the degradation of p53 via the RPs-MDM2/MDM4-p53 axis. Thus, the combinatorial treatment strategy of (i) KRAS G12C-mutant inhibitors and (ii) RNA polymerase I machinery inhibitors, such as CX-3543 and CX-5461, could be a possible strategy to tackle resistance and has to be studied in in vitro and in vivo settings, which promotes the increased therapeutic treatment of KRAS G12C-mutated cancers in the era of precision medicine.
Data availability statement
Publicly available datasets were analyzed in this study. This data can be found here: GSE178479.
Author contributions
PSR conceptualized and designed the study. PSR and AP retrieved the data, carried out all the analyses, and wrote the manuscript. All the results were validated and the manuscript was corrected by IE and SA. All authors proofread the manuscript. All authors contributed to the article and approved the submitted version.
Funding
The authors thank Vellore Institute of Technology, Vellore for providing ‘VIT SEED Grant-RGEMS Fund (SG20220095)' for carrying out this research work.
Acknowledgments
The authors would like to thank Vellore Institute of Technology (VIT), Vellore, India, for providing the necessary facilities to carry out this study.
Conflict of interest
The authors declare that the research was conducted in the absence of any commercial or financial relationships that could be construed as a potential conflict of interest.
Publisher's note
All claims expressed in this article are solely those of the authors and do not necessarily represent those of their affiliated organizations, or those of the publisher, the editors and the reviewers. Any product that may be evaluated in this article, or claim that may be made by its manufacturer, is not guaranteed or endorsed by the publisher.
Supplementary material
The Supplementary Material for this article can be found online at: https://www.frontiersin.org/articles/10.3389/fmed.2023.1107128/full#supplementary-material
Supplementary Figure 1. CPM plot of count data after filtering the poorly expressed genes.
Supplementary Figure 2. Voom mean–variance trend curve. It depicts that the lowly expressed genes are filtered properly. t. Counts nearly 0 (plot x-axis value −1) have low standard deviations. This rises immediately for low counts and then gradually decreases.
Supplementary Figure 3. Kaplan–Meier plot for survival analysis of RPL4 (A), RPL32 (B), RPLP1 (C), RPS9 (D), JUN (E), RPL15 (F), RPS15 (G), and RPS28 (H). The x-axis represents the time in months, while the y-axis represents the probability of survival. The red and black colors represent the high expression and low expression of the biomarkers, respectively.
References
1. Prior IA, Lewis PD, Mattos C. A comprehensive survey of Ras mutations in cancer. Cancer Res. (2012) 72:2457–67. doi: 10.1158/0008-5472.CAN-11-2612
2. Fernández-Medarde A, Santos E. Ras in cancer and developmental diseases. Genes Cancer. (2011) 2:344–58. doi: 10.1177/1947601911411084
3. Malumbres M, Barbacid M, RAS. oncogenes: the first 30 years. Nat Rev Cancer. (2003) 3:459–65. doi: 10.1038/nrc1097
4. Harvey JJ. An unidentified virus which causes the rapid production of tumours in mice. Nature. (1964) 204:1104–5. doi: 10.1038/2041104b0
5. Kirsten WH, Schauf V, McCoy J. Properties of a murine sarcoma virus. Bibl Haematol. (1970) 36:246–9. doi: 10.1159/000391714
6. Hobbs GA, Der CJ, Rossman KL. RASisoforms and mutations in cancer at a glance. J Cell Sci. (2016) 129:1287–92. doi: 10.1242/jcs.182873
7. Yin G, Kistler S, George SD, Kuhlmann N, Garvey L, Huynh M, et al. GTPase K104Q mutant retains downstream signaling by offsetting defects in regulation. J Biol Chem. (2017) 292:4446–56. doi: 10.1074/jbc.M116.762435
8. Colicelli J. Human RAS superfamily proteins and related GTPases. Sci STKE. (2004) 2004:RE13. doi: 10.1126/stke.2502004re13
9. Yorimitsu T, Sato K, Takeuchi M. Molecular mechanisms of Sar/Arf GTPases in vesicular trafficking in yeast and plants. Front Plant Sci. (2014) 5:411. doi: 10.3389/fpls.2014.00411
10. Cherfils J, Zeghouf M. Regulation of small GTPases by GEFs, GAPs, and GDIs. Physiol Rev. (2013) 93:269–309. doi: 10.1152/physrev.00003.2012
11. Takács T, Kudlik G, Kurilla A, Szeder B, Buday L, Vas V. The effects of mutant Ras proteins on the cell signalome. Cancer Metastasis Rev. (2020) 39:1051–65. doi: 10.1007/s10555-020-09912-8
12. Han CW, Jeong MS, Jang SB. Understand KRAS and the quest for anti-cancer drugs. Cells. (2021) 10:cells10040842. doi: 10.3390/cells10040842
13. Healy FM, Prior IA, MacEwan DJ. The importance of Ras in drug resistance in cancer. Br J Pharmacol. (2022) 179:2844–67. doi: 10.1111/bph.15420
14. Merz V, Gaule M, Zecchetto C, Cavaliere A, Casalino S, Pesoni C, et al. Targeting KRAS: the elephant in the room of epithelial cancers. Front Oncol. (2021) 11:638360. doi: 10.3389/fonc.2021.638360
15. Ferreira A, Pereira F, Reis C, Oliveira MJ, Sousa MJ, Preto A. Crucial role of oncogenic KRAS mutations in apoptosis and autophagy regulation: therapeutic implications. Cells. (2022) 11:cells11142183. doi: 10.3390/cells11142183
16. Désage A-L, Léonce C, Swalduz A, Ortiz-Cuaran S. Targeting KRAS mutant in non-small cell lung cancer: novel insights into therapeutic strategies. Front Oncol. (2022) 12:796832. doi: 10.3389/fonc.2022.796832
17. Huang L, Guo Z, Wang F, Fu L. KRAS mutation: from undruggable to druggable in cancer. Signal Transduct Target Ther. (2021) 6:386. doi: 10.1038/s41392-021-00780-4
18. Lindsay CR, Garassino MC, Nadal E, Öhrling K, Scheffler M, Mazières J. On target: rational approaches to KRAS inhibition for treatment of non-small cell lung carcinoma. Lung Cancer. (2021) 160:152–65. doi: 10.1016/j.lungcan.2021.07.005
19. Zhu C, Guan X, Zhang X, Luan X, Song Z, Cheng X, et al. Targeting KRAS mutant cancers: from druggable therapy to drug resistance. Mol Cancer. (2022) 21:159. doi: 10.1186/s12943-022-01629-2
20. Rozengurt E, Eibl G. Crosstalk between KRAS, SRC and YAP signaling in pancreatic cancer: interactions leading to aggressive disease and drug resistance. Cancers. (2021) 13:5126. doi: 10.3390/cancers13205126
21. Adachi Y, Kimura R, Hirade K, Ebi H. Escaping KRAS: gaining autonomy and resistance to KRAS inhibition in KRAS mutant cancers. Cancers. (2021) 13:cancers13205081. doi: 10.3390/cancers13205081
22. Sun C, Hobor S, Bertotti A, Zecchin D, Huang S, Galimi F, et al. Intrinsic resistance to MEK inhibition in KRAS mutant lung and colon cancer through transcriptional induction of ERBB3. Cell Rep. (2014) 7:86–93. doi: 10.1016/j.celrep.2014.02.045
23. Nagasaka M, Li Y, Sukari A, Ou S-HI, Al-Hallak MN, Azmi AS, et al. G12C game of thrones, which direct KRAS inhibitor will claim the iron throne? Cancer Treat Rev. (2020) 84:101974. doi: 10.1016/j.ctrv.2020.101974
24. Mustachio LM, Chelariu-Raicu A, Szekvolgyi L, Roszik J. Targeting KRAS in cancer: promising therapeutic strategies. Cancers. (2021) 13:1204. doi: 10.3390/cancers13061204
25. Conroy M, Cowzer D, Kolch W, Duffy AG. Emerging RAS-directed therapies for cancer. Cancer Drug Resist. (2021) 4:543–58. doi: 10.20517/cdr.2021.07
26. Skoulidis F, Li BT, Dy GK, Price TJ, Falchook GS, Wolf J, et al. Sotorasib for lung cancers with KRAS pG12C mutation. N Engl J Med. (2021) 384:2371–81. doi: 10.1056/NEJMoa2103695
27. Hyun S, Shin D. Small-molecule inhibitors and degraders targeting KRAS-driven cancers. Int J Mol Sci. (2021) 22:12142. doi: 10.3390/ijms222212142
28. Strickler JH, Satake H, George TJ, Yaeger R, Hollebecque A, Garrido-Laguna I, et al. Sotorasib in KRAS pG12C-mutated advanced pancreatic cancer. N Engl J Med. (2023) 388:33–43. doi: 10.1056/NEJMoa2208470
29. Lanman BA, Allen JR, Allen JG, Amegadzie AK, Ashton KS, Booker SK, et al. Discovery of a covalent inhibitor of KRAS(G12C) (AMG 510) for the treatment of solid tumors. J Med Chem. (2020) 63:52–65. doi: 10.1021/acs.jmedchem.9b01180
30. Jänne PA, Riely GJ, Gadgeel SM, Heist RS, Ou S-HI, Pacheco JM, et al. Adagrasib in non-small-cell lung cancer harboring a KRAS(G12C) mutation. N Engl J Med. (2022) 387:120–31. doi: 10.1056/NEJMoa2204619
31. Tsai YS, Woodcock MG, Azam SH, Thorne LB, Kanchi KL, Parker JS, et al. Rapid idiosyncratic mechanisms of clinical resistance to KRAS G12C inhibition. J Clin Invest. (2022) 132:e155523. doi: 10.1172/JCI155523
32. Begum P, Goldin RD, Possamai LA, Popat S. Severe immune checkpoint inhibitor hepatitis in KRAS G12C-mutant NSCLC potentially triggered by sotorasib: case report. JTO Clin Res Rep. (2021) 2:100213. doi: 10.1016/j.jtocrr.2021.100213
33. Liu J, Kang R, Tang D. The KRAS-G12C inhibitor: activity and resistance. Cancer Gene Ther. (2022) 29:875–8. doi: 10.1038/s41417-021-00383-9
34. Chan C-H, Chiou L-W, Lee T-Y, Liu Y-R, Hsieh T-H, Yang C-Y, et al. and PI3K pathway activation confers resistance to KRAS(G12C) inhibitor sotorasib. Br J Cancer. (2023) 128:148–59. doi: 10.1038/s41416-022-02032-w
35. Liao Y, Smyth GK, Shi W. featureCounts: an efficient general purpose program for assigning sequence reads to genomic features. Bioinformatics. (2014) 30:923–30. doi: 10.1093/bioinformatics/btt656
36. Robinson MD, McCarthy DJ, Smyth GK. edgeR: a Bioconductor package for differential expression analysis of digital gene expression data. Bioinformatics. (2010) 26:139–40. doi: 10.1093/bioinformatics/btp616
37. Robinson MD, Oshlack A. A scaling normalization method for differential expression analysis of RNA-seq data. Genome Biol. (2010) 11:R25. doi: 10.1186/gb-2010-11-3-r25
38. Lun ATL, Chen Y, Smyth GK. It's DE-licious: a recipe for differential expression analyses of RNA-seq experiments using quasi-likelihood methods in edgeR. Methods Mol Biol. (2016) 1418:391–416. doi: 10.1007/978-1-4939-3578-9_19
39. Ritchie ME, Phipson B, Wu D, Hu Y, Law CW, Shi W, et al. limma powers differential expression analyses for RNA-sequencing and microarray studies. Nucleic Acids Res. (2015) 43:e47. doi: 10.1093/nar/gkv007
40. Law CW, Chen Y, Shi W, Smyth GK. voom: Precision weights unlock linear model analysis tools for RNA-seq read counts. Genome Biol. (2014) 15:R29. doi: 10.1186/gb-2014-15-2-r29
41. Law CW, Alhamdoosh M, Su S, Dong X, Tian L, Smyth GK, Ritchie ME. RNA-seq analysis is easy as 1-2-3 with limma, Glimma and edgeR. F1000Research. (2016) 5. doi: 10.12688/f1000research.9005.1
42. McCarthy DJ, Smyth GK. Testing significance relative to a fold-change threshold is a TREAT. Bioinformatics. (2009) 25:765–71. doi: 10.1093/bioinformatics/btp053
43. Tumminello M, Bertolazzi G, Sottile G, Sciaraffa N, Arancio W, Coronnello C, et al. Multivariate statistical test for differential expression analysis. Sci Rep. (2022) 12:8265. doi: 10.1038/s41598-022-12246-w
44. Vaes E, Khan M, Mombaerts P. Statistical analysis of differential gene expression relative to a fold change threshold on NanoString data of mouse odorant receptor genes. BMC Bioinformat. (2014) 15:39. doi: 10.1186/1471-2105-15-39
45. Szklarczyk D, Gable AL, Nastou KC, Lyon D, Kirsch R, Pyysalo S, et al. The STRING database in 2021: customizable protein-protein networks, and functional characterization of user-uploaded gene/measurement sets. Nucleic Acids Res. (2021) 49:D605–12. doi: 10.1093/nar/gkaa1074
46. Shannon P, Markiel A, Ozier O, Baliga NS, Wang JT, Ramage D, et al. Cytoscape: a software environment for integrated models of biomolecular interaction networks. Genome Res. (2003) 13:2498–504. doi: 10.1101/gr.1239303
47. Wu T, Hu E, Xu S, Chen M, Guo P, Dai Z, et al. clusterProfiler 40: A universal enrichment tool for interpreting omics data. Innovation. (2021) 2:100141. doi: 10.1016/j.xinn.2021.100141
48. Nagy Á, Munkácsy G, Gyorffy B. Pancancer survival analysis of cancer hallmark genes. Sci Rep. (2021) 11:6047. doi: 10.1038/s41598-021-84787-5
49. Yu L, Kim HT, Kasar S, Benien P, Du W, Hoang K, et al. Survival of Del17p CLL depends on genomic complexity and somatic mutation. Clin cancer Res. (2017) 23:735–45. doi: 10.1158/1078-0432.CCR-16-0594
50. Lánczky A, Gyorffy B. Web-based survival analysis tool tailored for medical research (KMplot): development and implementation. J Med Internet Res. (2021) 23:e27633. doi: 10.2196/27633
51. Vasta JD, Peacock DM, Zheng Q, Walker JA, Zhang Z, Zimprich CA, et al. KRAS is vulnerable to reversible switch-II pocket engagement in cells. Nat Chem Biol. (2022) 18:596–604. doi: 10.1038/s41589-022-00985-w
52. Parikh K, Banna G, Liu S V, Friedlaender A, Desai A, Subbiah V, et al. Drugging KRAS: current perspectives and state-of-art review. J Hematol Oncol. (2022) 15:152. doi: 10.1186/s13045-022-01375-4
53. Indini A, Rijavec E, Ghidini M, Cortellini A, Grossi F. Targeting KRAS in solid tumors: current challenges and future opportunities of novel KRAS inhibitors. Pharmaceutics. (2021) 13:653. doi: 10.3390/pharmaceutics13050653
54. Yang A, Li M, Fang M. The research progress of direct KRAS G12C mutation inhibitors. Pathol Oncol Res. (2021) 27:631095. doi: 10.3389/pore.2021.631095
55. Kwan AK, Piazza GA, Keeton AB, Leite CA. The path to the clinic: a comprehensive review on direct KRAS(G12C) inhibitors. J Exp Clin Cancer Res. (2022) 41:27. doi: 10.1186/s13046-021-02225-w
56. Tanaka N, Lin JJ Li C, Ryan MB, Zhang J, Kiedrowski LA, Michel AG, et al. Clinical acquired resistance to KRAS(G12C) inhibition through a novel KRAS switch-II pocket mutation and polyclonal alterations converging on RAS-MAPK reactivation. Cancer Discov. (2021) 11:1913–22. doi: 10.1158/2159-8290.CD-21-0365
57. Awad MM, Liu S, Rybkin II, Arbour KC, Dilly J, Zhu VW, et al. Acquired resistance to KRAS(G12C) inhibition in cancer. N Engl J Med. (2021) 384:2382–93. doi: 10.1056/NEJMoa2105281
58. Maharjan M, Tanvir RB, Chowdhury K, Duan W, Mondal AM. Computational identification of biomarker genes for lung cancer considering treatment and non-treatment studies. BMC Bioinformat. (2020) 21:218. doi: 10.1186/s12859-020-3524-8
59. Elhamamsy AR, Metge BJ, Alsheikh HA, Shevde LA, Samant RS. Ribosome biogenesis: a central player in cancer metastasis and therapeutic resistance. Cancer Res. (2022) 82:2344–53. doi: 10.1158/0008-5472.CAN-21-4087
60. Kang J, Brajanovski N, Chan KT, Xuan J, Pearson RB, Sanij E. Ribosomal proteins and human diseases: molecular mechanisms and targeted therapy. Signal Transduct Target Ther. (2021) 6:323. doi: 10.1038/s41392-021-00728-8
61. Yan T-T, Fu X-L, Li J, Bian Y-N, Liu DJ, Hua R, et al. Downregulation of RPL15 may predict poor survival and associate with tumor progression in pancreatic ductal adenocarcinoma. Oncotarget. (2015) 6:37028–42. doi: 10.18632/oncotarget.5939
62. Daftuar L, Zhu Y, Jacq X, Prives C. Ribosomal proteins RPL37, RPS15 and RPS20 regulate the Mdm2-p53-MdmX network. PLoS ONE. (2013) 8:e68667. doi: 10.1371/journal.pone.0068667
63. Yadavilli S, Mayo LD, Higgins M, Lain S, Hegde V, Deutsch WA. Ribosomal protein S3: a multi-functional protein that interacts with both p53 and MDM2 through its KH domain. DNA Repair. (2009) 8:1215–24. doi: 10.1016/j.dnarep.2009.07.003
64. Li Y, Zhou Y, Li B, Chen F, Shen W, Lu Y, et al. WDR74 modulates melanoma tumorigenesis and metastasis through the RPL5-MDM2-p53 pathway. Oncogene. (2020) 39:2741–55. doi: 10.1038/s41388-020-1179-6
65. Li C, Ge M, Yin Y, Luo M, Chen D. Silencing expression of ribosomal protein L26 and L29 by RNA interfering inhibits proliferation of human pancreatic cancer PANC-1 cells. Mol Cell Biochem. (2012) 370:127–39. doi: 10.1007/s11010-012-1404-x
66. El Khoury W, Nasr Z. Deregulation of ribosomal proteins in human cancers. Biosci Rep. (2021) 41. doi: 10.1042/BSR20211577
67. Alam E, Maaliki L, Nasr Z. Ribosomal protein S3 selectively affects colon cancer growth by modulating the levels of p53 and lactate dehydrogenase. Mol Biol Rep. (2020) 47:6083–90. doi: 10.1007/s11033-020-05683-1
68. Yang HJ, Youn H, Seong KM, Jin Y-W, Kim J, Youn B. Phosphorylation of ribosomal protein S3 and antiapoptotic TRAF2 protein mediates radioresistance in non-small cell lung cancer cells. J Biol Chem. (2013) 288:2965–75. doi: 10.1074/jbc.M112.385989
69. Yao Y-X, Xu B-H, Zhang Y. CX-3543 promotes cell apoptosis through downregulation of CCAT1 in colon cancer cells. Biomed Res Int. (2018) 2018:9701957. doi: 10.1155/2018/9701957
70. Makhale A, Nanayakkara D, Raninga P, Khanna KK, Kalimutho M. CX-5461 enhances the efficacy of APR-246 via induction of DNA damage and replication stress in triple-negative breast cancer. Int J Mol Sci. (2021) 22:5782. doi: 10.3390/ijms22115782
71. Hilton J, Gelmon K, Bedard PL, Tu D, Xu H, Tinker A V, et al. Results of the phase I CCTG IND.231 trial of CX-5461 in patients with advanced solid tumors enriched for DNA-repair deficiencies. Nat Commun. (2022) 13:3607. doi: 10.1038/s41467-022-31199-2
72. Sun M-Y, Xu B, Wu Q-X, Chen W-L, Cai S, Zhang H, et al. Cisplatin-Resistant gastric cancer cells promote the chemoresistance of cisplatin-sensitive cells via the exosomal RPS3-mediated PI3K-Akt-Cofilin-1 signaling axis. Front cell Dev Biol. (2021) 9:618899. doi: 10.3389/fcell.2021.618899
Keywords: sotorasib, KRAS G12C inhibitor, resistance, pancreatic ductal adenocarcinoma, ribosomal proteins, precision medicine
Citation: Ramalingam PS, Priyadharshini A, Emerson IA and Arumugam S (2023) Potential biomarkers uncovered by bioinformatics analysis in sotorasib resistant-pancreatic ductal adenocarcinoma. Front. Med. 10:1107128. doi: 10.3389/fmed.2023.1107128
Received: 24 November 2022; Accepted: 11 April 2023;
Published: 15 June 2023.
Edited by:
D. Thirumal Kumar, Meenakshi Academy of Higher Education and Research, IndiaReviewed by:
Jin Wu, University at Buffalo, United StatesRonald Lubet, National Cancer Institute (NIH), United States
Copyright © 2023 Ramalingam, Priyadharshini, Emerson and Arumugam. This is an open-access article distributed under the terms of the Creative Commons Attribution License (CC BY). The use, distribution or reproduction in other forums is permitted, provided the original author(s) and the copyright owner(s) are credited and that the original publication in this journal is cited, in accordance with accepted academic practice. No use, distribution or reproduction is permitted which does not comply with these terms.
*Correspondence: Sivakumar Arumugam, siva_kumar.a@vit.ac.in