Short 2-[18F]Fluoro-2-Deoxy-D-Glucose PET Dynamic Acquisition Protocol to Evaluate the Influx Rate Constant by Regional Patlak Graphical Analysis in Patients With Non-Small-Cell Lung Cancer
 Luca Indovina1
  Valentina Scolozzi2*
  Amedeo Capotosti1
  Stelvio Sestini3
  Silvia Taralli2
  Davide Cusumano1
  Romina Grazia Giancipoli2
  Gabriele Ciasca1,4
  Giuseppe Cardillo5 Maria Lucia Calcagni2,6
- 1Fondazione Policlinico Universitario A. Gemelli IRCCS, Rome, Italy
- 2Unità Operativa Complessa (UOC) di Medicina Nucleare, Dipartimento di Diagnostica per Immagini, Radioterapia Oncologica ed Ematologia, Fondazione Policlinico Universitario A. Gemelli IRCCS, Rome, Italy
- 3Nuclear Medicine Unit, NOP S. Stefano, Prato, Italy
- 4Università Cattolica del Sacro Cuore, Rome, Italy
- 5Unit of Thoracic Surgery, San Camillo Forlanini Hospital, Rome, Italy
- 6Dipartimento Universitario di Scienze Radiologiche ed Ematologiche, Università Cattolica del Sacro Cuore, Rome, Italy
Purpose: To test a short 2-[18F]Fluoro-2-deoxy-D-glucose (2-[18F]FDG) PET dynamic acquisition protocol to calculate Ki using regional Patlak graphical analysis in patients with non-small-cell lung cancer (NSCLC).
Methods: 24 patients with NSCLC who underwent standard dynamic 2-[18F]FDG acquisitions (60 min) were randomly divided into two groups. In group 1 (n = 10), a population-based image-derived input function (pIDIF) was built using a monoexponential trend (10–60 min), and a leave-one-out cross-validation (LOOCV) method was performed to validate the pIDIF model. In group 2 (n = 14), Ki was obtained by standard regional Patlak plot analysis using IDIF (0–60 min) and tissue response (10–60 min) curves from the volume of interests (VOIs) placed on descending thoracic aorta and tumor tissue, respectively. Moreover, with our method, the Patlak analysis was performed to obtain Ki,s using IDIFFitted curve obtained from PET counts (0–10 min) followed by monoexponential coefficients of pIDIF (10–60 min) and tissue response curve obtained from PET counts at 10 min and between 40 and 60 min, simulating two short dynamic acquisitions. Both IDIF and IDIFFitted curves were modeled to assume the value of 2-[18F]FDG plasma activity measured in the venous blood sampling performed at 45 min in each patient. Spearman's rank correlation, coefficient of determination, and Passing–Bablok regression were used for the comparison between Ki and Ki,s. Finally, Ki,s was obtained with our method in a separate group of patients (group 3, n = 8) that perform two short dynamic acquisitions.
Results: Population-based image-derived input function (10–60 min) was modeled with a monoexponential curve with the following fitted parameters obtained in group 1: a = 9.684, b = 16.410, and c = 0.068 min−1. The LOOCV error was 0.4%. In patients of group 2, the mean values of Ki and Ki,s were 0.0442 ± 0.0302 and 0.33 ± 0.0298, respectively (R2 = 0.9970). The Passing–Bablok regression for comparison between Ki and Ki,s showed a slope of 0.992 (95% CI: 0.94–1.06) and intercept value of −0.0003 (95% CI: −0.0033–0.0011).
Conclusions: Despite several practical limitations, like the need to position the patient twice and to perform two CT scans, our method contemplates two short 2-[18F]FDG dynamic acquisitions, a population-based input function model, and a late venous blood sample to obtain robust and personalized input function and tissue response curves and to provide reliable regional Ki estimation.
Introduction
The 2-[18F]Fluoro-2-deoxy-D-glucose (2-[18F]FDG) Positron Emission Tomography/Computed Tomography (PET/CT) is a well-established imaging modality for staging, restaging, and monitoring treatment response in patients with malignancy (1–3). Absolute quantification of 2-[18F]FDG concentration, related to the local metabolic rate of glucose consumption measured with full kinetic analysis of time-activity curves, has proven to better characterize the tumor cell behavior and to correlate with histopathological data and prognosis (4–6). Nevertheless, some key points of full kinetic analysis, mainly the long dynamic acquisition and arterial blood sampling, limit the use of such an approach in a clinical setting. For these reasons, less-invasive approaches, including measurements of semiquantitative parameters such as the most common standard uptake value (SUV), are extensively used routinely (7–9). However, it has shown that the accuracy of SUV depends on several factors, including the standardization of technical parameters (e.g., acquisition protocol, glucose blood level, scan time window, recovery coefficient, partial volume effect, region-of-interest definition, and different PET scanners), which can affect the reliability of uptake values (10–13).
The Patlak graphical analysis is a valid alternative to full kinetic analysis for radioligands with irreversible kinetics as 2-[18F] FDG since the activity of the phosphatases is considered negligible (14). The Patlak analysis provides the value of the influx rate constant Ki [min−1] related to the metabolic rate of glucose in tissue. The Ki parameter is calculated from the slope of a straight line that correlates the integral radioligand activity in the blood pool with radioligand activity in the tissue (15). For this purpose, a long PET dynamic acquisition lasting at least 60 min is considered mandatory to calculate the time-activity curves of 2-[18F]FDG in the blood (input function) and tissue (tissue response). Several efforts have been made to simplify the input function estimation with less- or non-invasive methods, such as the arterialized venous blood sampling (16), the image-derived input function (IDIF) estimation (17–20), the population input function modeling (21–24), the image segmentation methods (25, 26), and to overcome difficulties related to the long-lasting dynamic acquisition (27–30).
To reduce the dynamic 2-[18F]FDG PET acquisition time (28–30), the aim of this study was to test a short dynamic protocol to obtain the input function and the tissue response curves to calculate Ki using the Patlak analysis and to compare it with Ki obtained using the standard long dynamic acquisition protocol in patients with non-small cell lung cancer (NSCLC).
Materials and Methods
Patients
24 patients (15 male patients, mean age 69 ± 11 years) with histologically proven NSCLC, referred for staging to PET/CT center of Fondazione Policlinico Universitario A. Gemelli IRCCS in Rome by the local Thoracic Surgery Unit of San Camillo Forlanini Hospital, were enrolled. All patients (n = 24) underwent standard long (0–60 min) dynamic PET acquisition over the thorax followed by a total body scan. Patients were randomly divided into two groups: group 1 (n = 10; six male patients, mean age 70 ± 12 years) was used to extrapolate and validate the population-based image-derived input function (pIDIF); group 2 (n = 14; nine male patients, mean age 69 ± 10 years) was used to compare Ki obtained with our method (simulating two short dynamic acquisition and using the pIDIF validated in group 1) with Ki obtained using the standard long dynamic acquisition. Finally, a separate third group of patients (n = 8; seven male patients, mean age 71 ± 11 years) with histologically proven NSCLC were enrolled to test the feasibility of our method in clinical practice. All patients (n = 8) underwent two separate short dynamic PET acquisitions over the thorax followed by a total body scan. The local institution's ethics committee (Comitato Etico Lazio 1) approved this retrospective study, waiving written informed consent for participation.
2-[18F]FDG PET/CT: Acquisition and Reconstruction Parameters
All patients were fasted for at least 6 h and in normoglycemic (glucose level <150 mg/dl) conditions before PET acquisition. PET/CT studies were performed using a full-ring CT and PET-integrated tomograph (3D Biograph mCT, Siemens Healthineers, Chicago, Illinois). Patients were placed in a supine position with the thorax in the field of view and the arms placed over the head. The acquisition protocol started with a CT scout including the thoracic aorta and lungs. A low-dose CT was performed (90 mA, 120 kV) for the attenuation correction of emission data and morphological information with a field of view of 21 cm. The transaxial CT matrix size was 512 × 512 (1 × 1 × 3 mm).
Standard Long Dynamic Acquisition
Patients of groups 1 and 2 were intravenously injected with 134–507 MBq of 2-[18F]FDG, using an infusion pump (model RADInject; Tema Sinergie, Faenza, RA, Italy); 10 ml of 2-[18F]FDG was administered at a rate of 4.32 ml/s followed by a 10-ml saline flush. After 2-[18F]FDG injection, a thorax dynamic list-mode acquisition lasting 60 min was started with the following framing: 24 frames of 5 s each, 12 frames of 15 s each, and 11 frames of 5 min each. A venous blood sampling was performed at 45 min post-injection. Dynamic PET data were corrected for random events, dead time, and attenuation. PET data were reconstructed with the ordered subset expectation maximization (OSEM) algorithm, including time-of-flight and UltraHD recovery with 21 subsets and two iterations. The transaxial PET matrix size was 256 × 256 (3.18m × 3.18 × 3 mm).
Two Short Dynamic Acquisitions
Patients of group 3 were intravenously injected with 205–320 MBq of 2-[18F]FDG using the same infusion pump and protocol of groups 1 and 2. After 2-[18F]FDG injection, early thorax dynamic list-mode acquisition lasting 10 min was started with the following framing: 24 frames of 5 s each, 12 frames of 15 s each, and one frame of 5 min each; late thorax dynamic list-mode acquisition lasting 20 min was started at 40 min post-injection with the following framing: four frames of 5 min each. Two low-dose CTs were performed for each acquisition to assess an accurate attenuation correction of the two PET images. Patients left the examination PET/CT room in the period between early and late PET/CT examinations. A venous blood sampling was performed at 45-min post-injection. The same algorithm and reconstruction parameters of the standard long dynamic acquisition were used.
Input Function
In each patient of group 1 (n = 10), the standard input function was obtained drawing a volume of interest (VOI) on the descending thoracic aorta during the summed first nine frames of dynamic acquisition (45 s) and superimposing it on all subsequent frames of dynamic acquisition (0–60 min) (31). For each patient, the venous blood sampling performed at 45 min after injection was centrifuged for 5 min (Rotofix 32A; Hettich Italia S.r.l., Milano, Italy) to separate the plasma from the cellular components. The 2-[18F]FDG activity in 1 ml of plasma was measured in a gamma counter (Wallac Wizard 1480−3″; PerkinElmer, Waltham, Massachusetts) cross-calibrated with the tomograph. The IDIF curve was modeled to assume the value of 2-[18F]FDG activity measured in the plasma (32); in particular, a scale factor equal to the ratio between the plasma activity measured in 1 ml of plasma, and the activity measured in the IDIF at 45 min was used to impose the IDIF activity value at 45 min equal to the plasma activity measured in the blood sample, considering the plasma activity as the gold standard value and avoiding any problem regarding spillover effect or partial volume effect in the VOI signal.
To extrapolate and validate the input function used in our method, it was reconstructed taking into account only data from 0 to 10 min of the standard long dynamic acquisition, simulating an early short dynamic acquisition (pIDIF). In particular, for each patient of group 1 (n = 10), the early phase of the input function was built taking into account the first 10 min of the patient's input function curve of the standard long dynamic acquisition. The remaining part was reconstructed with a monoexponential function (23, 33) since all input function curves obtained from standard dynamic protocol showed a trend that can be well represented by a monoexponential function (1):
where a, b, and c coefficient values were obtained as mean values of monoexponential fit of each 10 IDIF, measured from 10 to 60 min in patients of group 1.
Then, a specific patient input function was built imposing the pIDIF 2-[18F]FDG activity value at 45 min equal to the plasma activity in each patient measured at 45 min from the venous sample (IDIFFitted).
Lastly, the LOOCV method was performed to validate the method of pIDIF reconstruction.
Ki Estimation Using the Standard Dynamic Protocol
The Ki parameter was estimated using the following formula (2):
where Ki, is the influx rate constant, CT(t) is the mean value for the radioligand concentration in tissue during the time (tissue response), T is the time of dynamic acquisition, VD is the distribution volume, Cp(t) is the radioligand concentration in plasma during the time (i.e., the IDIF), and the integral symbol represents the area under the curve of the IDIF. Since both CT and Cp are obtained from the VOI in tumor tissue and in descending thoracic aorta, respectively, the proposed analysis is based on regional and not voxel-based Patlak parametric imaging method.
For each patient of group 2 (n = 14), Ki was estimated with the Patlak analysis using the IDIF (0–60 min) and the tissue response (10–60 min) curves. The IDIF was obtained as described in the previous paragraph. The tissue response curve was obtained by drawing VOI on the tumor in the last frame of the dynamic acquisition and superimposing it on all previous frames (10–60 min). VOIs for the input function and tissue response were automatically placed over three consecutive slices to include the five hottest pixels within the VOI (34, 35).
Ki Estimation Simulating the Short Dynamic Protocol (Ki,s)
For each patient of group 2 (n = 14), Ki was estimated using data from 0 to10 min and from 40 to 60 min of the long standard acquisition to obtain the IDIFFitted and the tissue response curves simulating two short dynamic acquisitions.
In particular, for each patient, the early phase of the input function was built taking into account the first 10 min of the patient's input function curve of the standard dynamic protocol. The remaining part was reconstructed with the previous reported monoexponential function (1) using the a, b, and c coefficients of pIDIF obtained and validated in patients of group 1, then modeled to assume at 45 min the value of 2-[18F]FDG activity in the plasma measured at 45 min from the venous sample (IDIFFitted), as previously described.
For each patient, the tissue response curve was reconstructed taking into account data measured at 10 min and those measured between 40 and 60 min of the patient's tissue response curve of the standard protocol.
Finally, the influx rate constant (Ki,s) was estimated with the Patlak analysis according to the well-known formula (2) using the IDIFFitted and the tissue response curves as described.
Ki Estimation Using the Short Dynamic Protocol (Ki,s)
For each patient of group 3 (n = 8), Ki was estimated using two short dynamic acquisitions performed to obtain the IDIFFitted and the tissue response curves.
In particular, the IDIFFitted was built drawing a VOI on the descending thoracic aorta during the summed first nine frames of early dynamic acquisition (45 s) and superimposing it on all subsequent frames of the early dynamic acquisition (0–10 min); the remaining part (10–60 min) was reconstructed using the a, b, and c coefficients values of pIDIF obtained and validated in patients of group 1, then modeled to assume at 45 min the value of 2-[18F]FDG activity in the plasma measured at 45 min from the venous sample (IDIFFitted), as previously described.
The tissue response curve was obtained drawing a VOI on the tumor in the last frame of the late dynamic acquisition and superimposing it on all previous frames (40–60 min); another VOI was drawn on the tumor in the last frame of the early dynamic examinations (10 min). VOIs for input function and tissue response were automatically placed over three consecutive slices to include the five hottest pixels within the VOI (34, 35). Being a VOI-based analysis method and therefore limited to specific regions (not voxel-wise), the co-registration between early and late PET images was not necessary.
Finally, the influx rate constant (Ki,s) was estimated using the Patlak analysis according to the well-known formula (2) using the IDIFFitted and the tissue response curves as described.
Standardized Uptake Value
Standard uptake value was calculated as following formula (3):
where CT(T) is the value of radioligand concentration at T equal to 55-min post-injection measured using a VOI drawn on tumor tissue (tissue response) in the last frame, A0 is the injected activity, and bw is the bodyweight of the patient (36).
Statistical Analysis
R (analytical software) was used for calculations. The mean square percentage error (MSEP) between standard IDIF (0–60 min) and IDIFfitted was calculated, and LOOCVerror was computed to perform the leave-one-out cross-validation. The concordance between Ki and Ki,s was evaluated using the Passing–Bablok regression. The Spearman's rank correlation coefficient (ρ) and coefficient of determination (R2) were used to assess the correlation between Ki estimated using standard dynamic protocol and Ki,s estimated with short dynamic protocol, and between Ki,s and SUV.
Results
In 24 patients with NSCLC who performed the standard long dynamic protocol (groups 1 and 2), the input function curves showed a monoexponential trend from 10 min after 2-[18F]FDG injection up to the end of acquisition (60 min), as reported in a representative patient (Figure 1).
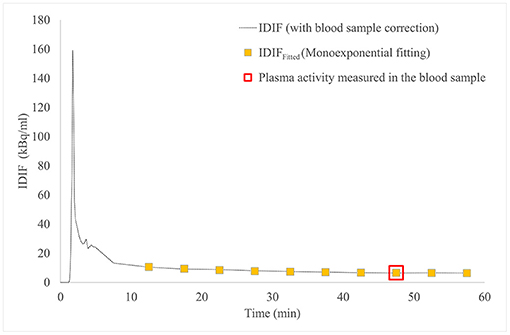
Figure 1. IDIF curve (dashed line) and IDIFFitted curve (yellow square boxes), both modeled to pass through the 2-[18F]FDG activity in plasma measured in the venous blood sample at 45 min post-injection (red square box), in patient #4. 2-[18F]FDG, 2-[18F]Fluoro-2-deoxy-D-glucose; IDIF, image-derived input function.
The mean values of a, b, and c coefficients obtained from monoexponential fittings of 10 input function curves (group 1) were 9.684, 16.410, and 0.068 min−1, respectively.
Figure 1 shows IDIF obtained with standard long dynamic protocol and IDIFFitted obtained with short dynamic protocol and reconstructed with monoexponential fit in a representative patient (#4): both curves were imposed to pass through the measured 2-[18F]FDG activity in plasma at 45 min.
The LOOCVerror between standard IDIF (0–60 min) and IDIFfitted was 0.4%.
Table 1 reports demographic data and PET parameters values (Ki, Ki,s, SUV) for all patients of group 2 (n = 14).
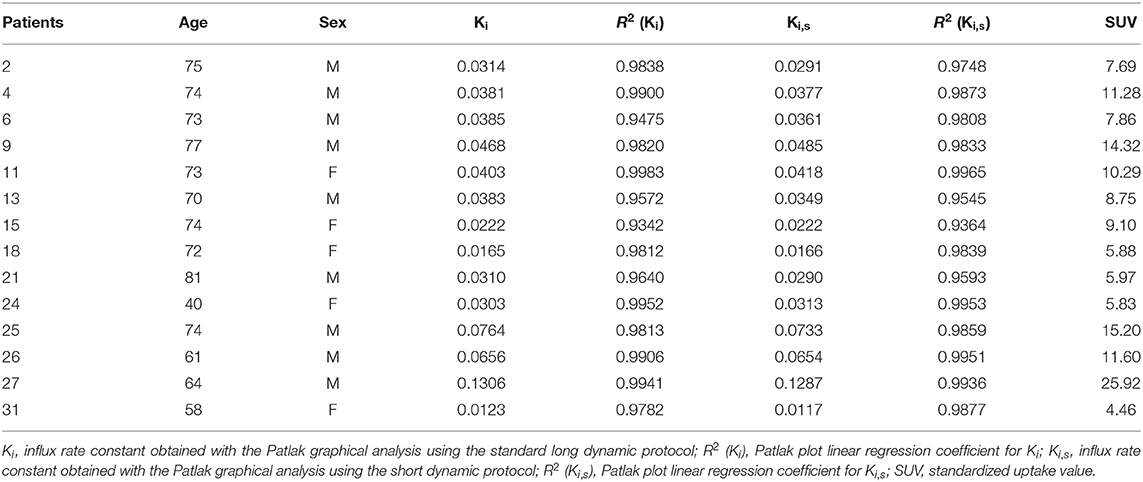
Table 1. Demographic data and PET parameters values in patients of group 2 (n = 14).
The mean values (±SD) of Ki obtained with standard long dynamic protocol and Ki,s obtained simulating the short dynamic protocol for patients of group 2 (n = 14) were 0.0442 min−1 (±0.0302) and 0.0433 min−1 (±0.0298), respectively. The correlation coefficient and coefficient of determination between the two parameters were ρ = 0.974 and R2 = 0.9970, respectively.
Figure 2 reports for all patients of group 2 (n = 14) the Passing–Bablok regression for the comparison between Ki and Ki,s: the comparison between the two methods showed a slope value of 0.992 (95% CI: 0.94–1.06) and intercept value of −0.0003 (95% CI: −0.0033 to 0.0011).
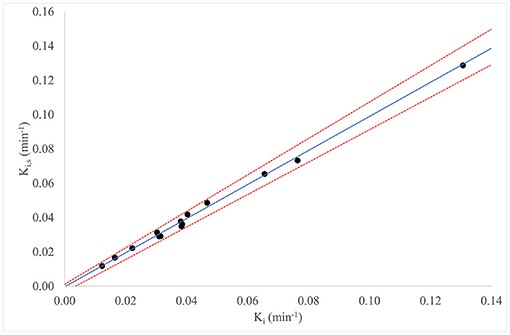
Figure 2. Passing–Bablok regression for comparison of Ki and Ki,s, for all patients in group 2 (n = 14).
Table 2 reports demographic data and PET parameters values (Ki,s, SUV) for all patients in group 3 (n = 8).
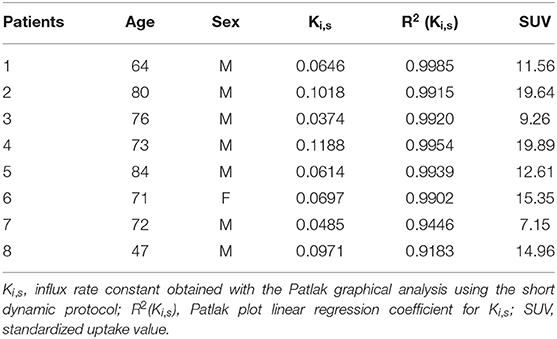
Table 2. Demographic data and PET parameters values in patients of group 3 (n = 8).
In patients of group 2 (n = 14, standard long dynamic acquisition) and those of group 3 (n = 8, two short dynamic acquisitions), the overall mean value (±SD) of SUV of the primary tumor was 11.57 (±5.37). The correlation coefficient and coefficient of determination between SUV and Ki,s values were ρ = 0.923; R2 = 0.8746 (n = 22), respectively, as reported in Figure 3.
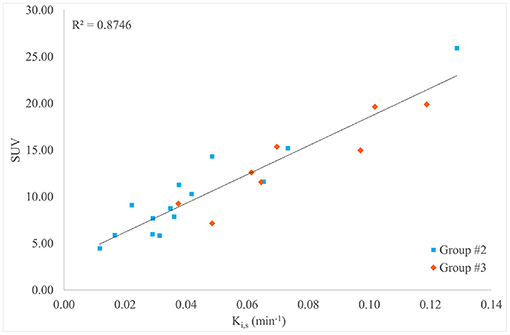
Figure 3. Scatter plot, linear regression, and R2 value for the comparison between Ki,s and standard uptake value (SUV) for all patients in groups 2 and 3 (n = 22).
Figure 4 shows 2-[18F]FDG uptake at 2 min (Figure 4A), 30 min (Figure 4B), and 60 min (Figure 4C) in the thoracic aorta and primary tumor after tracer injection in a representative patient (#4).
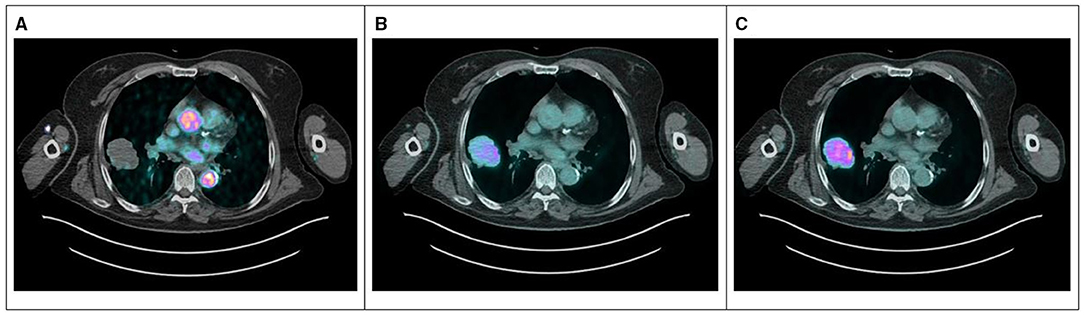
Figure 4. PET/CT images at 2 min (A), 30 min (B), and 60 min (C) after 2-[18F]FDG injection for a representative patient (#4) showing the blood pool in the early phase and the increasing uptake in the lesion during the time. 2-[18F]FDG, 2-[18F]Fluoro-2-deoxy-D-glucose.
Discussion
The Patlak graphical analysis has been used in dynamic PET to estimate the influx rate constant (Ki) of tracers with irreversible uptake including 2-[18F]FDG (14, 15, 37). Among several quantification methods, the Patlak analysis is a reliable and robust approach providing an accurate measure of Ki that is less affected by technical parameters and by tissue heterogeneity (38, 39).
Nevertheless, the kinetics of 2-[18F]FDG requires a long dynamic PET acquisition lasting at least 60 min with consequent discomfort for the patient, limiting its use in clinical routine (40). To overcome such limitations, in this study a shorter dynamic acquisition protocol has been proposed to estimate Ki by Patlak analysis in patients with NSCLC. The input function and the tissue response curves were reconstructed taking into account data (0–10 min and 40–60 min) from standard long dynamic acquisition, simulating two short dynamic PET acquisitions.
Regarding input function, it is well known that its accurate determination is a key point for kinetic modeling. The Patlak analysis requires the knowledge of the full course of input function time–activity curve, from the tracer injection to the end of dynamic acquisition of 60 min (41). In our method, the first part of each input function curve was built using data obtained from injection up to 10 min of the standard long dynamic acquisition, simulating a short early dynamic acquisition. The remaining part was reconstructed with monoexponential fitting using the mean value of a, b, and c coefficients obtained from standard input function values of a separate group of patients. Indeed, we observed that all curves of the standard long dynamic acquisition showed a monoexponential trend from the 10-min post-injection to the end. Finally, each input function curve so obtained was modeled to assume the value of 2-[18F]FDG activity measured in the venous blood sample at 45 min post-injection. Indeed, at late times, an equilibrium between 2-[18F]FDG concentration in arterial and venous blood is reached (35, 42). Moreover, the radioligand activity measured in blood better represents the “real” 2-[18F]FDG concentration compared to that measured using only VOI. The reliability of this method is supported by the very low LOOCVerror value between standard IDIF and IDIFfitted. Therefore, a short dynamic acquisition plus a late venous blood sample can be sufficient to construct a robust input function that can be considered “personalized” since it uses data that are, largely, patients own data (counts in first 10 min of dynamic acquisition and counts in a venous blood sample) plus reconstructed data (monoexponential fitting). Therefore, we underline that the input function curve has to be as accurate as possible taking also into account the physio- and pathological characteristics of each patient representing the “true” tracer bioavailability. Regarding the tissue response, it was built using data obtained from 40 to 60 min of the standard long dynamic acquisition, simulating a late-short dynamic acquisition, plus counts of the last frame (10 min) of the simulated early-short dynamic acquisition, useful to well estimate the slope of Patlak plot.
Finally, the reliability of Ki,s values calculated using the input function and tissue response curves obtained with the short protocol is supported by the high correlation with Ki obtained with the standard long dynamic acquisition. This finding suggests the feasibility of the short protocol in clinical practice, requiring only two short dynamic PET acquisitions (0–10 min and 40–60 min) instead of the longer standard one (60 min), plus a late venous blood sampling. In addition, such a method that contemplates two dynamic acquisitions (one including a large vessel for input function; the other including the neoplastic lesion for tissue response) can be applied to evaluate the influx rate constant (and other quantitative parameters) of neoplastic lesion located in everybody site. Recently, Wu et al. (43) investigated the feasibility of generating Ki for 2-[18F]FDG PET from dual-time-point imaging data (5 min per scan) by using a population-based input function. Differently from our study, they did not extrapolate Ki from a linear regression but the angular coefficient of a straight line passing through two points. Moreover, the scaling factor for the population-based curve was determined on the summation of the input function values at the middle time points of the early and the late scans.
Regarding semiquantitative PET parameters, SUV showed a good (even if not excellent) correlation with Ki,s obtained both in patients in whom the two short dynamic acquisitions were simulated and in patients in whom two short dynamic acquisitions were performed. This result confirms that semiquantitative parameters, even if less accurate, well represent the glucose metabolism only if all technical and procedural aspects in patient preparation and scan acquisition are strictly respected. Indeed, especially when several PET/CT examinations are repeated over time for the evaluation of response to oncological treatment (44–46), the difficulty in strictly respecting all technical aspects can make the semiquantitative parameters unreliable. Moreover, it is important to remind that the accuracy of semiquantitative parameters may be affected by non-controlled aspects such as the oncological therapies that can modify the tracer bioavailability (especially the news antiangiogenic drugs), the cancer cells biological characteristics (tracer uptake), and other unknown biologic and patients factors (47, 48). Furthermore, we have to take into account that semiquantitative parameters, such as SUV, perform relatively poorly when the tumor-to-background ratio is low as in liver lesions, in small and less 2-[18F]FDG avid tumors (49) or post-treatment evaluation when the uptake in tumors may be suppressed after therapy (19). Therefore, the use of kinetic parameters seems preferable to semiquantitative ones, not only for therapy monitoring (50–52) but also for evaluating glucose metabolism of tumor regions with relatively high background activity (19). Moreover, it was recently showed that oncologic whole-body (WB) Patlak Ki imaging may improve lesion detectability reducing false-positive rates when complementing SUV (53). This potential improvement in specificity may support the use of kinetic parameters in other clinical settings, such as for differential diagnosis between pulmonary tumors and inflammatory lesions, and between progression and pseudoprogression during immunotherapy.
Regarding practical aspects of our method, to come in and out of the PET scanner twice to perform two separate acquisitions did not determine a discomfort for patients of group 3 who performed the short dynamic protocol. Indeed, the short lasting of PET acquisitions (compared to the long standard one) seems preferable for patients who have to maintain the correct position with the arms over the head on the scanner for a shorter time. In addition, the method does not require a rigid repositioning of the patient on the PET scanner, since a co-registration of early and late dynamic images was not needed. However, this could be a limitation if a voxel-wise Patlak analysis method would be explored; in that case, a similar approach may not be feasible due to the need for co-registration between early and late dynamic PET frames. Finally, this procedure that requires two separate short acquisitions, between which the patient leaves the scanner free for other patients PET acquisition, may result in several practical limitations, increasing the complexity in the scheduling of the daily clinical workflow, the time involvement of the staff in repositioning the patient on the scanner table, and the risk of propagating delay or cancellations of one exam on the following ones. Moreover, we have to take into account that the need for two low-dose CT scans for accurate attenuation correction of the two dynamic PET acquisitions introduces additional radiation exposure for the patient and increases the time involvement for patients and staff, reducing the time between the early and late acquisitions in which the scanner is available for another exam. However, this proposed method cannot replace the standard-of-care WB PET acquisitions, but it can allow quantifying Ki in few selected cases (maximum three per day for clinical or research aims), even in PET centers that do not have advanced technologies, scheduling them at the beginning of the end of the daily workflow, reducing the impact on daily clinical activities as much as possible. However, we have to take into account that there are currently commercially available products that provide fully automated WB parametric PET images. Their diffusion in the next future will allow acquiring dynamic WB PET studies with the arms in the down position, improving the comfort of patients and limiting the possibility of motion-induced artifacts in the PET images, with minimal control and time involvement requirements for the staff.
Beyond the practical aspects, the main limitations of this study are the relatively small sample size, the absence of arterial blood samples as the reference standard (being invasive and not feasible in clinical practice) to validate the input function time–activity curve, and the application of the short protocol only in patients with NSCLC. Moreover, the application of a single-scale factor to impose the IDIF activity value at 45 min equal to the plasma activity measured in the blood sample could be a potential limitation due to the different partial volume effects during time scan; in the early phase, the activity in the vessel is very high causing spill-out of activity outside the vessel wall boundaries and lead to a possible underestimation of the IDIF peak. On the contrary, in the late phase, the activity inside the vessel is expected to be very small, whereas the activity from the surrounding tissue is relatively larger, thus causing a possible overestimation of the IDIF value. In addition, the use of two short dynamic acquisitions could not be adequate to apply the generalized Patlak methods developed and employed in Ki quantification when considering a mild degree of reversibility of 2-[18F]FDG kinetics, since these methods require multiple measurements at both early and late time points (23, 54–56). Nevertheless, the robustness of the performance of our method in the Ki evaluation using two short acquisitions (compared to the standard one) supports its use, aware that with the simplicity of our method, a good estimate of the value of the constant influx rate was obtained. Finally, the use of 4D reconstruction algorithms (30, 57–59), recently available in some PET scanners, but not applied in our PET scans, would mitigate statistical noise levels, improving image quality and Ki estimation.
Conclusion
In conclusion, our proposed method may provide a reliable quantification of regional estimates of influx rate constant for tissues not expressing 2-[18F]FDG uptake reversibility. Two short dynamic PET acquisitions obtained at an early and late time point post-injection plus a population-based input function model scaled according to a late venous blood sample may be enough to obtain a robust and personalized temporal integral of the input function, which is necessary to estimate the net influx rate constant by regional Patlak analysis. This short dynamic protocol of two scan sessions at 0–10 min and 40–60 min post-injection may have some potential advantages when compared with the standard dynamic WB long 60-min acquisition protocols; it can reduce the total time spent inside the scanner for each patient, but not its total exam time involvement. The scan time reduction could therefore mitigate their discomfort for some patients if exiting and entering the scanner twice per exam is not an issue; however, this reduction in acquisition time comes at the cost of additional radiation exposure for the patient with a second low-dose WB CT scan. Despite several practical limitations, such as the increase in CT radiation dose from the need for a second low-dose WB CT exam, the complexity of scheduling daily exams with interleaved sessions between different patients and the risk of propagating time delays and other problems from one exam session to the exams of other patients in the same day, the proposed dynamic PET/CT scan protocol can theoretically allow performing more dynamic PET acquisitions daily; furthermore, similarly to other WB dynamic PET scan protocols, it allows to obtain regional estimates of highly quantitative parameters in tumor regions located in distant organs scanned at different bed positions. Moreover, data analysis is not more time-consuming and does not require additional expertise compared to other dynamic WB PET/CT protocols. From the clinical point of view, the use of dynamic WB PET acquisitions assumes more significance in oncological patients in whom the quantification is more relevant than semiquantification, especially in treatment monitoring and prognostic assessment. Our proposed method, along with other recent dynamic WB PET/CT studies (28, 29, 43, 58), aims to facilitate the clinical adoption of dynamic PET and regional parametric analysis by shortening the total PET scan times often required in these protocols.
Data Availability Statement
The raw data supporting the conclusions of this article will be made available by the authors, without undue reservation.
Ethics Statement
The studies involving human participants were reviewed and approved by Comitato Etico Lazio 1. The ethics committee waived the requirement of written informed consent for participation.
Author Contributions
MC and LI contributed to the conception and design of the study. VS, ST, RG, and GCa were involved in the acquisition of PET/CT and clinical data. LI and AC performed data analysis. LI, VS, AC, SS, DC, GCi, and MC were involved in data interpretation. LI, VS, AC, and SS drafted the manuscript. MC critically revised the manuscript for important intellectual content. All authors revised the final manuscript and gave their final approval for the manuscript submission.
Conflict of Interest
The authors declare that the research was conducted in the absence of any commercial or financial relationships that could be construed as a potential conflict of interest.
Publisher's Note
All claims expressed in this article are solely those of the authors and do not necessarily represent those of their affiliated organizations, or those of the publisher, the editors and the reviewers. Any product that may be evaluated in this article, or claim that may be made by its manufacturer, is not guaranteed or endorsed by the publisher.
References
1. Boellaard R, Delgado-Bolton R, Oyen WJ, Giammarile F, Tatsch K, Eschner W, et al. FDG PET/CT: EANM procedure guidelines for tumour imaging: version 20. Eur J Nucl Med Mol Imaging. (2015) 42:328–54. doi: 10.1007/s00259-014-2961-x
2. Gambhir SS. Molecular imaging of cancer with positron emission tomography. Nat Rev Cancer. (2002) 2:683–93. doi: 10.1038/nrc882
3. Czernin J, Allen-Auerbach M, Schelbert HR. Improvements in cancer staging with PET/CT: literature-based evidence as of september 2006. J Nucl Med. (2007) 48:78S−88.
4. Nishiyama Y, Yamamoto Y, Monden T, Sasakawa Y, Kawai N, Satoh K, et al. Diagnostic value of kinetic analysis using dynamic FDG PET in immunocompetent patients with primary CNS lymphoma. Eur J Nucl Med Mol Imaging. (2007) 34:78–86. doi: 10.1007/s00259-006-0153-z
5. Dimitrakopoulou-Strauss A, Pan L, Sachpekidis C. Kinetic modeling and parametric imaging with dynamic PET for oncological applications: general considerations, current clinical applications, and future perspectives. Eur J Nucl Med Mol Imaging. (2020) 48:21–39. doi: 10.1007/s00259-020-04843-6
6. Lammertsma AA. Forward to the past: the case for quantitative pet imaging. J Nucl Med. (2017) 58:1019–24. doi: 10.2967/jnumed.116.188029
7. Sadato N, Tsuchida T, Nakaumra S, Waki A, Uematsu H, Takahashi N, et al. Non-invasive estimation of the net influx constant using the standardized uptake value for quantification of FDG uptake of tumours. Eur J Nucl Med Mol Imaging. (1998) 25:559–64. doi: 10.1007/s002590050256
8. Naqa IE. The role of quantitative PET in predicting cancer treatment outcomes. Clin Transl Imaging. (2014) 2:305–20. doi: 10.1007/s40336-014-0063-1
9. Hofheinz F, Bütof R, Apostolova I, Zöphel K, Steffen IG, Amthauer H, et al. An investigation of the relation between tumor-to-liver ratio (TLR) and tumor-to-blood standard uptake ratio (SUR) in oncological FDG PET. EJNMMI Res. (2016) 6:19. doi: 10.1186/s13550-016-0174-y
10. Adams MC, Turkington TG, Wilson JM, Wong TZ. A systematic review of the factors affecting accuracy of SUV measurements. AJR Am J Roentgenol. (2010) 195:310–20. doi: 10.2214/AJR.10.4923
11. Zaidi H, Karakatsanis N. Towards enhanced PET quantification in clinical oncology. Br J Radiol. (2018) 91:20170508. doi: 10.1259/bjr.20170508
13. Marin A, Murchison JT, Skwarski KM, Tavares AAS, Fletcher A, Wallace WA, et al. Can dynamic imaging, using 18F-FDG PET/CT and CT perfusion differentiate between benign and malignant pulmonary nodules? Radiol Oncol. (2021) 55:259–67. doi: 10.2478/raon-2021-0024
14. Patlak CS, Blasberg RG, Fenstermacher JD. Graphical evaluation of blood-to-brain transfer constants from multiple-time uptake data. J Cereb Blood Flow Metab. (1983) 3:1–7. doi: 10.1038/jcbfm.1983.1
15. Patlak CS, Blasberg RG. Graphical evaluation of blood-to-brain transfer constants from multiple-time uptake data. generalizations. J Cereb Blood Flow Metab. (1985) 5:584–90. doi: 10.1038/jcbfm.1985.87
16. van der Weerdt AP, Klein LJ, Visser CA, Visser FC, Lammertsma AA. Use of arterialised venous instead of arterial blood for measurement of myocardial glucose metabolism during euglycaemic-hyperinsulinaemic clamping. Eur J Nucl Med Mol Imaging. (2002) 29:663–9. doi: 10.1007/s00259-002-0772-y
17. Liptrot M, Adams KH, Martiny L, Pinborg LH, Lonsdale MN, Olsen NV, et al. Cluster analysis in kinetic modelling of the brain: a noninvasive alternative to arterial sampling. Neuroimage. (2004) 21:483–93. doi: 10.1016/j.neuroimage.2003.09.058
18. Croteau E, Lavallée E, Labbe SM, Hubert L, Pifferi F, Rousseau JA, et al. Image-derived input function in dynamic human PET/CT: methodology and validation with 11C-acetate and 18F-fluorothioheptadecanoic acid in muscle and 18F-fluorodeoxyglucose in brain. Eur J Nucl Med Mol Imaging. (2010) 37:1539–50. doi: 10.1007/s00259-010-1443-z
19. Karakatsanis NA, Lodge MA, Tahari AK, Zhou Y, Wahl RL, Rahmim A. Dynamic whole body PET parametric imaging: I. concept, acquisition protocol optimization and clinical application. Phys Med Biol. (2013) 58:7391. doi: 10.1088/0031-9155/58/20/7391
20. Karakatsanis NA, Lodge MA, Zhou Y, Wahl RL, Rahmim A. Dynamic whole body PET parametric imaging: II. task-oriented statistical estimation. Phys Med Biol. (2013) 58:7419–45. doi: 10.1088/0031-9155/58/20/7419
21. Takikawa S, Dhawan V, Spetsieris P, Robeson W, Chaly T, Dahl R, et al. Noninvasive quantitative fluorodeoxyglucose PET studies with an estimated input function derived from a population-based arterial blood curve. Radiology. (1993) 188:131–6. doi: 10.1148/radiology.188.1.8511286
22. Zanotti-Fregonara P, Hines CS, Zoghbi SS, Liow J-S, Zhang Y, Pike VW, et al. Population-based input function and image-derived input function for [11C](R)-rolipram PET imaging: methodology, validation and application to the study of major depressive disorder. Neuroimage. (2012) 63:1532–41. doi: 10.1016/j.neuroimage.2012.08.007
23. Karakatsanis N, Zhou Y, Lodge M, Casey M, Wahl R, Subramaniam R, et al. Clinical whole-body PET patlak imaging 60-90min postinjection employing a population-based input function. J Nucl Med. (2015) 56(Supplement 3):1786.
24. Naganawa M, Gallezot J-D, Shah V, Mulnix T, Young C, Dias M, et al. Assessment of population-based input functions for Patlak imaging of whole body dynamic 18F-FDG PET. EJNMMI Phys. (2020) 7:67. doi: 10.1186/s40658-020-00330-x
25. Novikov M. Multiparametric quantitative and texture 18 F-FDG PET/CT analysis for primary malignant tumour grade differentiation. Eur Radiol Exp. (2019) 3:48. doi: 10.1186/s41747-019-0124-3
26. Hu J, Panin V, Smith AM, Spottiswoode B, Shah V, von Gall CCA, et al. Design and implementation of automated clinical whole body parametric pet with continuous bed motion. IEEE Trans Radiat Plasma Med Sci. (2020) 4:696–707. doi: 10.1109/TRPMS.2020.2994316
27. Braune A, Hofheinz F, Bluth T, Kiss T, Wittenstein J, Scharffenberg M, et al. Comparison of static and dynamic 18F-FDG PET/CT for quantification of pulmonary inflammation in acute lung injury. J Nucl Med. (2019) 60:1629–34. doi: 10.2967/jnumed.119.226597
28. Karakatsanis N, Lodge M, Zhou Y, Casey M, Wahl R, Subramaniam R, et al. Novel multi-parametric SUV/Patlak FDG-PET wholebody imaging framework for routine application to clinical oncology. J Nucl Med. (2015) 56(Supplement 3):625.
29. Karakatsanis NA, Casey ME, Knesaurek K, Fayad ZA, Kostakoglu L. SUV/Patlak-4D whole-body PET/CT dynamic and parametric imaging: clinical demonstration and validation of SUV synthesis from dynamic passes. IEEE Nucl Sci Symp Med Imaging Conf. (2017) 1–6. doi: 10.1109/NSSMIC.2017.8532712
30. Karakatsanis N, Lodge M, Wahl R, Rahmim A. Direct 4D whole-body PET/CT parametric image reconstruction: concept and comparison vs. indirect parametric imaging. J Nucl Med. (2013) 54(Supplement 2):2133.
31. Velasco C, Mota-Cobián A, Mateo J, España S. Explicit measurement of multi-tracer arterial input function for PET imaging using blood sampling spectroscopy. EJNMMI Physics. (2020) 7:7. doi: 10.1186/s40658-020-0277-4
32. Berradja K, Boughanmi N, Bentourkia M. Kinetic modeling of brain FDG data with input function derived from images by independent component analysis. 2009 IEEE Nucl Sci Symp Conf Rec. (2009) 2920–3. doi: 10.1109/NSSMIC.2009.5401614
33. Hunter GJ, Hamberg LM, Alpert NA, Choi NC, Fischman AJ. Simplified measurement of deoxyglucose utilization rate. J Nuc Med. (1996) 37:950–95.
34. Fahey FH, Kinahan PE, Doot RK, Kocak M, Thurston H, Poussaint TY. Variability in PET quantitation within a multicenter consortium. Med Phys. (2010) 37:3660–6. doi: 10.1118/1.3455705
35. Laffon E, Calcagni ML, Galli G, Giordano A, Capotosti A, Marthan R, et al. Comparison of three-parameter kinetic model analysis to standard Patlak's analysis in 18F-FDG PET imaging of lung cancer patients. EJNMMI Res. (2018) 8:24. doi: 10.1186/s13550-018-0369-5
36. Strauss LG, Conti PS. The application of PET in clinical oncology. J Nucl Med. (1991) 32:623–48.
37. Mintun MA, Raichle ME, Kilbourn MR, Wooten GF, Welch MJ. A quantitative model for the in vivo assessment of drug binding sites with positron emission tomography. Ann Neurol. (1984) 15:217–27. doi: 10.1002/ana.410150302
38. Mori K, Schmidt K, Jay T, Palombo E, Nelson T, Lucignani G, et al. Optimal duration of experimental period in measurement of local cerebral glucose utilization with the deoxyglucose method. J Neurochem. (1990) 54:307–19. doi: 10.1111/j.1471-4159.1990.tb13316.x
39. Zhuang M, Karakatsanis NA, Dierckx RAJO, Zaidi H. Quantitative Analysis of Heterogeneous[18F]FDG Static (SUV) vs. Patlak (Ki) Whole-body PET Imaging Using Different Segmentation Methods: a Simulation Study Mol Imaging Biol. (2019) 21:317–27. doi: 10.1007/s11307-018-1241-8
40. Aide N, Lasnon C, Veit-Haibach P, Sera T, Sattler B, Boellaard R. EANM/EARL harmonization strategies in PET quantification: from daily practice to multicentre oncological studies. Eur J Nucl Med Mol Imaging. (2017) 44:17–31. doi: 10.1007/s00259-017-3740-2
41. Zuo Y, Qi J, Wang G. Relative Patlak plot for dynamic PET parametric imaging without the need for early-time input function. Phys Med Biol. (2018) 63:165004. doi: 10.1088/1361-6560/aad444
42. Galli G, Indovina L, Calcagni ML, Mansi L, Giordano A. The quantification with FDG as seen by a physician. Nucl Med Biol. (2013) 40:720–30. doi: 10.1016/j.nucmedbio.2013.06.009
43. Wu J, Liu H, Ye Q, Gallezot J-D, Naganawa M, Miao T, et al. Generation of parametric Kiimages for FDG PET using two 5-min scans. Med Phys. (2021) 48:5219–31. doi: 10.1002/mp.15113
44. de Geus-Oei L-F, van der Heijden HFM, Visser EP, Hermsen R, van Hoorn BA, Timmer-Bonte JNH, et al. Chemotherapy response evaluation with 18F-FDG PET in patients with non-small cell lung cancer. J Nucl Med. (2007) 48:1592–8. doi: 10.2967/jnumed.107.043414
45. La Fontaine MD, Bruin NM, van Kranen S, Knegjens JL, van de Kamer JB, Vogel WV, et al. The dynamics and prognostic value of FDG PET-metrics in weekly monitoring of (chemo)radiotherapy for NSCLC. Radiother Oncol. (2021) 160:107–14. doi: 10.1016/j.radonc.2021.04.009
46. Yang D-M, Palma DA, Kwan K, Louie AV, Malthaner R, Fortin D, et al. Predicting pathological complete response (pCR) after stereotactic ablative radiation therapy (SABR) of lung cancer using quantitative dynamic [18F]FDG PET and CT perfusion: a prospective exploratory clinical study. Radiat Oncol. (2021) 16:11. doi: 10.1186/s13014-021-01747-z
47. Chen K, Chen X. Positron emission tomography imaging of cancer biology: current status and future prospects. Semin Oncol. (2011) 38:70–86. doi: 10.1053/j.seminoncol.2010.11.005
48. Hoekstra CJ, Hoekstra OS, Stroobants SG, Vansteenkiste J, Nuyts J, Smit EF, et al. Methods to monitor response to chemotherapy in non-small cell lung cancer with 18F-FDG PET. J Nucl Med. (2002) 43:1304–9.
49. Yang M, Lin Z, Xu Z, Li D, Lv W, Yang S, et al. Influx rate constant of 18F-FDG increases in metastatic lymph nodes of non-small cell lung cancer patients. Eur J Nucl Med Mol Imaging. (2020) 47:1198–208. doi: 10.1007/s00259-020-04682-5
50. Mankoff DA, Muzi M, Krohn KA. Quantitative positron emission tomography imaging to measure tumor response to therapy: what is the best method? Mol Imaging Biol. (2003) 5:281–5. doi: 10.1016/j.mibio.2003.09.002
51. Kroep JR, Van Groeningen CJ, Cuesta MA, Craanen ME, Hoekstra OS, Comans EF, et al. Positron emission tomography using 2-deoxy-2-[18F]-fluoro-D-glucose for response monitoring in locally advanced gastroesophageal cancer: a comparison of different analytical methods. Mol Imaging Biol. (2003) 5:337–46. doi: 10.1016/j.mibio.2003.09.007
52. van Elmpt W, Das M, Hüllner M, Sharifi H, Zegers CML, Reymen B, et al. Characterization of tumor heterogeneity using dynamic contrast enhanced CT and FDG-PET in non-small cell lung cancer. Radiother Oncol. (2013) 109:65–70. doi: 10.1016/j.radonc.2013.08.032
53. Fahrni G, Karakatsanis NA, Di Domenicantonio G, Garibotto V, Zaidi H. Does whole-body Patlak 18F-FDG PET imaging improve lesion detectability in clinical oncology? Eur Radiol. (2019) 29:4812–21. doi: 10.1007/s00330-018-5966-1
54. Karakatsanis NA, Zhou Y, Lodge MA, Casey ME, Wahl RL, Rahmim A. Quantitative whole-body parametric PET imaging incorporating a generalized Patlak model. IEEE Nucl Sci Symp Med Imaging Conf. (2013) 2013:1–9.
55. Karakatsanis NA, Lodge MA, Casey ME, Zaidi H, Rahmim A. Impact of acquisition time-window on clinical whole-body PET parametric imaging. IEEE Nucl Sci Symp Med Imaging Conf. (2014) 2014:1–8. doi: 10.1109/NSSMIC.2014.7430770
56. Messa C, Choi Y, Hoh CK, Jacobs EL, Glaspy JA, Rege Sheila, et al. Quantification of glucose utilization in liver metastases: parametric imaging of FDG uptake with PET. J Comput Assist Tomogr. (1992) 16:684–9. doi: 10.1097/00004728-199209000-00003
57. Karakatsanis NA, Casey ME, Lodge M, Rahmim A, Zaidi H. Whole-body direct 4D parametric PET imaging employing nested generalized Patlak expectation-maximization reconstruction. Phys Med Biol. (2016) 61:5456–85. doi: 10.1088/0031-9155/61/15/5456
58. Karakatsanis N, Lodge M, Fahrni G, Casey ME, Zhou Y, Subramaniam R, et al. Simultaneous SUV/Patlak-4D Whole-Body PET: a multiParametric 4D imaging framework for routine clinical application. J Nucl Med. (2016) 57(Supplement 2):367.
Keywords: PET dynamic acquisition, Patlak graphical analysis, non-small-cell lung cancer, influx rate constant, 2-[18F]Fluoro-2-deoxy-D-glucose
Citation: Indovina L, Scolozzi V, Capotosti A, Sestini S, Taralli S, Cusumano D, Giancipoli RG, Ciasca G, Cardillo G and Calcagni ML (2021) Short 2-[18F]Fluoro-2-Deoxy-D-Glucose PET Dynamic Acquisition Protocol to Evaluate the Influx Rate Constant by Regional Patlak Graphical Analysis in Patients With Non-Small-Cell Lung Cancer. Front. Med. 8:725387. doi: 10.3389/fmed.2021.725387
Received: 15 June 2021; Accepted: 04 October 2021;
Published: 22 November 2021.
Edited by:
Ronan Abgral, Centre Hospitalier Regional Universitaire (CHU) de Brest, FranceReviewed by:
Nicolas A. Karakatsanis, Cornell University, United StatesVirginia Liberini, University of Turin, Italy
Copyright © 2021 Indovina, Scolozzi, Capotosti, Sestini, Taralli, Cusumano, Giancipoli, Ciasca, Cardillo and Calcagni. This is an open-access article distributed under the terms of the Creative Commons Attribution License (CC BY). The use, distribution or reproduction in other forums is permitted, provided the original author(s) and the copyright owner(s) are credited and that the original publication in this journal is cited, in accordance with accepted academic practice. No use, distribution or reproduction is permitted which does not comply with these terms.
*Correspondence: Valentina Scolozzi, valentina.scolozzi@gmail.com