Effects of typhoons on primary production and dissolved oxygen in the East China Sea
 Wen Yang
 Haokun Wu
 Wenxia Zhang
- 1State Key Laboratory of Estuarine and Coastal Research, East China Normal University, Shanghai, China
- 2Key Laboratory of Ocean Space Resource Management Technology, Ministry of Natural Resources, Hangzhou, China
- 3State Key Laboratory of Satellite Ocean Environment Dynamics, Second Institute of Oceanography, Ministry of Natural Resources, Hangzhou, China
Previous investigations confirm that typhoons deliver both dissolved oxygen and nutrient sources via promoting vertical/lateral exchanges between water masses. The former one replenishes oxygen for the bottom water and prevents persistent oxygen depletion, while the latter one facilitates primary production and subsequent subsurface oxygen consumption. However, it is left unknown if typhoons ultimately result in net gain or loss of dissolved oxygen during the passage. Tropical cyclone information, satellite observations, and numerical simulations were used to investigate the response of primary production and dissolved oxygen dynamics to typhoons. Results imply that both typhoon intensity, and distance between typhoon track and the Changjiang estuary control the magnitude of responses in primary production, air-sea oxygen flux, advection-induced oxygen variation, and oxygen consumption variation. The model-based oxygen budget analysis indicated that oxygen content increased after the passage of all typhoons occurred between 2011-2020. The findings in this study suggest that typhoons ultimately result in net gain of oxygen. The increased strength and frequency of typhoon in the warming future would play an important role in counteracting deoxygenation, which is likely to slow down the pace of deterioration of the seasonal hypoxia in this region.
1 Introduction
The content and change of dissolved oxygen in water affect the survival and reproduction of marine organisms, and also play a key role in marine biogeochemical cycles (Levin and Breitburg, 2015; Fennel and Testa, 2019). Oxygen concentration in the coastal seas has continued to decline due to intensified anthropogenic activities and climate change (Diaz, 2001; Rabalais et al., 2010; Schmidtko et al., 2017). Low dissolved oxygen increases disease incidence, jeopardizes survival and reproduction, and ultimately leads to marine organism deaths (Dybas, 2005; Breitburg et al., 2018). Furthermore, bottom hypoxia (oxygen concentration< 2 mg/l) alters the cycles of important nutrients in the sediment, causing phosphate and sulfide to be released from sediments (Conley et al., 2009). Therefore, the study of dissolved oxygen dynamics is both scientifically and economically important for further understanding the state of marine ecological environment and maintaining the stability of marine ecosystem. Dissolved oxygen concentration in the water column is influenced by the oxygen sources and sinks induced by physical and biogeochemical processes, including stratification (Engle et al., 1999; Murphy et al., 2011), regional circulation (Rabalais et al., 2002; Qian et al., 2017), wind (Ni et al., 2016; Jalil et al., 2018), tides (Rabouille et al., 2008; Zhou et al., 2017), and oxygen consumption associated with organic matter decomposition (Conley et al., 2011).
Typhoons, as episodic strong wind events, regulate the spatiotemporal characteristics of dissolved oxygen content in the water column in two different directions. On the one hand, typhoons mix the water column which cools the sea surface temperature (Lévy et al., 2012), and serve as oxygen sources to replenish dissolved oxygen in the bottom water, preventing or attenuating the bottom oxygen deficiency (Xia and Jiang, 2015; Zheng et al., 2016; Weinke and Biddanda, 2019). On the other hand, mixing and upwelling (Falkowski et al., 1991; Li et al., 2022; Lao et al., 2023a) induced by typhoons and increased runoff (Qiu et al., 2019; Chen et al., 2024) also provide nutrients to the near-surface layer and facilitates phytoplankton growth (Robarts et al., 1998; Lin et al., 2003; Yin et al., 2007; Wang and Xiu, 2022). The subsequent organic matter decomposition increases oxygen consumption at the subsurface layer and serves as oxygen sink (Pan et al., 2017; Wang et al., 2017). Research also showed that organic matter imported from land or resuspended from sediment during typhoon consumed dissolved oxygen regardless of whether phytoplankton blooms occurred after typhoons (Lu et al., 2022; Chen et al., 2023; Lao et al., 2023c). Typhoons are found to significantly alter the distribution of primary production (simply represented by chlorophyll content in this study) and dissolved oxygen concentration in the Gulf of Mexico (Walker et al., 2005; Gierach and Subrahmanyam, 2008; Liu et al., 2009), Chesapeake Bay (Miller et al., 2006), the Arabian Sea (Subrahmanyam et al., 2002), the Pearl River estuary (Zhao et al., 2009; Qiu et al., 2019; Zhao et al., 2021), and the Changjiang estuary (Chen et al., 2012; Guo et al., 2019). The effects of typhoons on primary production and dissolved oxygen are complex and variable, and highly linked with local topography, eddies, typhoon intensity, and typhoon track (Lin, 2012; Wang et al., 2017; Chen et al., 2024). Due to airflow resonance and rainfall asymmetry, the response on the right side of the typhoon path being greater than on the left side (Wang and Zhang, 2021; Wu et al., 2021; Wang and Xiu, 2022). Existing investigations tend to focus on specific typhoon events (Fogel et al., 1999; Zheng and Tang, 2007; Tsuchiya et al., 2013). Comparative studies and statistical conclusions on multiple typhoon events are lacking. Furthermore, it has long been left unknown if typhoons ultimately serve as oxygen sources or sinks after the compensation of oxygen replenishment and consumption effects.
Changjiang introduces large amounts of freshwater and nutrients into the East China Sea (Chen et al., 2009), facilitating bottom oxygen depletion and the formation of bottom hypoxia (Wei et al., 2015, 2017; Zhou et al., 2017; Zhang et al., 2018). The East China Sea, on the northwest Pacific Ocean, is repeatedly hit by typhoons, more than five typhoons visit East China Sea Shelf each year (Li et al., 2019). In recent years, global warming has caused the possibility of typhoons/hurricanes to increase as marine heat waves can trigger typhoon events (Stanley et al., 2001; Wu et al., 2005; Pun et al., 2023). At the same time, the typhoon intensity increases with increasing global mean temperatures (Emanuel, 2005; Webster et al., 2005; Holland and Webster, 2007). In the East China Sea, Yang et al. (2009) found a significant increase in the landfall intensity of typhoons from 1949 to 2006. Wu et al. (2005) showed that over the past four decades the typhoon tracks have shifted westward significantly. The change of typhoon intensity and track implied that the impact of typhoons on the dissolved oxygen dynamics off the Changjiang estuary would also change, as typhoons can bring water mixing, change circulation, increase freshwater runoff (Lau et al., 2008; Ni et al., 2016; Zhao et al., 2021). Hence, the investigation of typhoon impacts on dissolved oxygen dynamics over the Changjiang estuary is of essential importance in the sustainment of local ecosystem.
This study investigated the responses of nutrients and primary production, and discussed the changing direction (net gain or loss) of dissolved oxygen after the passage of typhoons in the Changjiang estuary. Data from a coupled physical-biogeochemical model was used to comprehensively explore the variations in chlorophyll and dissolved oxygen concentration off the Changjiang estuary area during the passage of multiple typhoons. The time rate of dissolved oxygen content change was obtained by quantifying the oxygen budget to further investigate the aeration effect and the fertilization effect of typhoons.
2 Materials and methods
2.1 Tropical cyclone information
The tropical cyclone track information and wind speed data used in this study are obtained from the western North Pacific Tropical Cyclone database created by the China Meteorological Administration (https://tcdata.typhoon.org.cn/index.html), which contains the 6-hourly location and intensity of tropical cyclones in the western North Pacific (including the South China Sea, north of the equator and west of 180°E) since 1949. According to the ‘National Standards for the Implementation of Tropical Circus Levels’ (GBT19201-2006) (Supplementary Table 1) issued by the China Meteorological Administration, tropical cyclones are divided into six classes: TD, tropical depression; TS, tropical storm; STS, severe tropical storm; TY, typhoon; STY, severe typhoon; SuperTY, super typhoon. For simplicity, we refer to tropical cyclone events of all intensity classes as typhoons. In the following, the relationship between typhoon characteristics (typhoon intensity, and distance between typhoon path and Changjiang estuary) and various hydrological variables is explored. In the statistical analysis, typhoon intensity is expressed by the maximum wind speed of typhoon center, and the distance between typhoon path and Changjiang estuary refers to the closest straight-line distance between the typhoon path and the Changjiang estuary, measured by the ranging tool provided by the website of the Central Meteorological Observatory (http://typhoon.nmc.cn/web.html).
This study focused on the tropical cyclones that passed through and affected the Changjiang estuary during the 10-yrs period from 2011 to 2020. In recent years, the number of tropical cyclone events above typhoon class has increased, and accounted for about 76% of the total (Liu et al., 2018; Zhang, 2020). so super typhoon Chan-hom, Lekima, and severe typhoon Haikui are selected as typical cases for typhoon intensity analyses (Table 1). While Haikui, Kong-rey, and Bavi with similar intensity are selected as typical cases for typhoon track analyses as Haikui made landfall at Xiangshan while the other two typhoons did not. About 46% of the typhoons that affect the East China Sea make landfall along China’s eastern coast (Zhang, 2020). The year 2019 was chosen to analyze chlorophyll changes throughout two consecutive typhoons. Two typhoons, Danas and Lekima, passed through the Changjiang estuary in 2019. The intensity and track of the two typhoons were very different (Table 1). Danas, a tropical storm, generated on July 15 and crossed the Changjiang estuary on July 19 with a wind speed of 23m/s. Lekima is a super typhoon generated on August 4. Lekima moved slowly and the wind speed weakened rapidly after landing in Taizhou on August 10, with a maximum wind speed of 52m/s at the time of landfall. The two typhoons in 2019 occurred 22 days apart, and the impacts from the first typhoon were significantly weakened before the second typhoon affected the region. Therefore, the distinct features of these typhoons in the same year led to better comparative analysis.
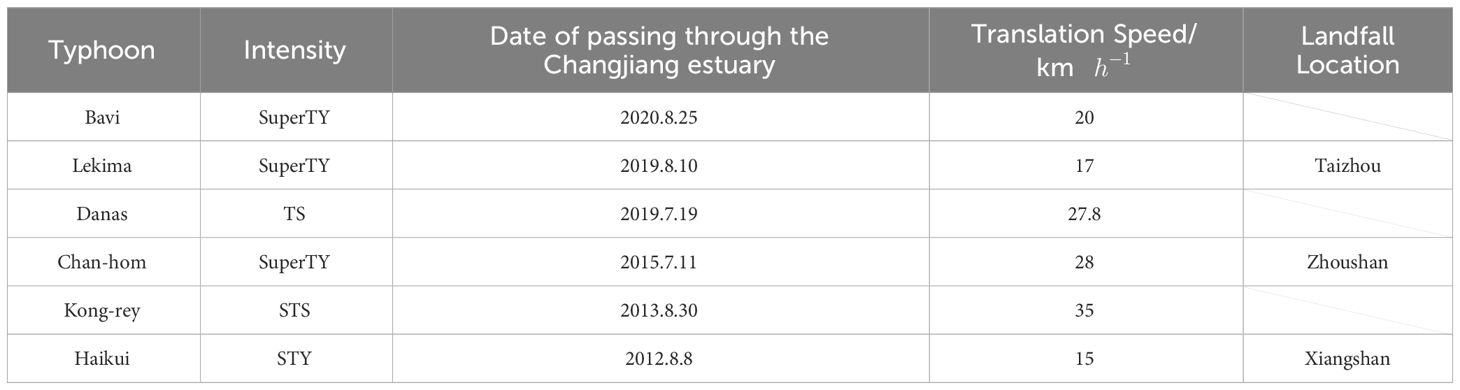
Table 1 Table of typhoons mentioned below.
2.2 GOCI satellite data
This study used GOCI (Geostationary Ocean Color Imager) chlorophyll data from the COMS satellite (https://oceandata.sci.gsfc.nasa.gov/directdataaccess/Level-2/GOCI), the first geostationary satellite sensor dedicated to ocean watercolor applications. The data span from July 2011 to December 2019, with high spatial (500 m) and temporal (eight times a day, measurement acquired every hour from 08:00 to 15:00 daily) resolution, with six visible bands and two near-infrared bands. The observation area is centered at around 130°E, 36°N. The area range is about 2500 km × 2500 km, covering the Bohai Sea, Yellow Sea, East China Sea, East/Japan Sea, and part of the South China Sea (Wang et al., 2013). GOCI data have been widely used for short-term and long-term regional marine environmental monitoring, disaster and marine hazard monitoring and prevention, and marine ecosystem and water quality evaluation and analysis (Ryu et al., 2011; Choi et al., 2012). This study used its Level-2 Ocean color production, chlorophyll concentration (CHL) downloaded from NOAA, which was averaged daily in this paper.
2.3 Coupled physical-biogeochemical model
This study used the Regional Ocean Modeling System (ROMS) (Shchepetkin and McWilliams, 2005) hydrodynamic model and coupled with a biogeochemical model. The hydrodynamic model domain encompasses the entire Bohai Sea, Yellow Sea, East China Sea, part of the Japan Sea and deep region offshore (Figure 1). This ROMS-based model has 30 vertical layers, with a minimum water depth of 3 m and a maximum depth of slightly greater than 7000 m. The horizontal resolution ranges from around 500 m in the upper estuary, to ~1 km in the plume near-field region, and to ~2 km in the offshore region. The model run was initiated from rest and was forced with surface momentum and heat fluxes from ERA5 dataset provided by the European Center for Medium-Range Weather Forecasts (ECMWF, https://www.ecmwf.int/en/forecasts/datasets), freshwater flux of Changjiang that obtained from Datong gauging station, and current and tide at the open boundary. Typhoon is basically imposed through the winds associated with the ERA5 reanalysis product. The initial and open boundary conditions for physical component are extracted from the daily Hybrid Coordinate Ocean Model (HYCOM, https://www.hycom.org/dataserver). Thirteen tidal constituents (MM, MF, Q1, O1, P1, K1, N2, M2, S2, K2, MN4, M4, and MS4) are imposed based on tidal elevations and currents extracted from the global inverse tide model TPXO7.2 of Oregon State University (Egbert and Erofeeva, 2002).
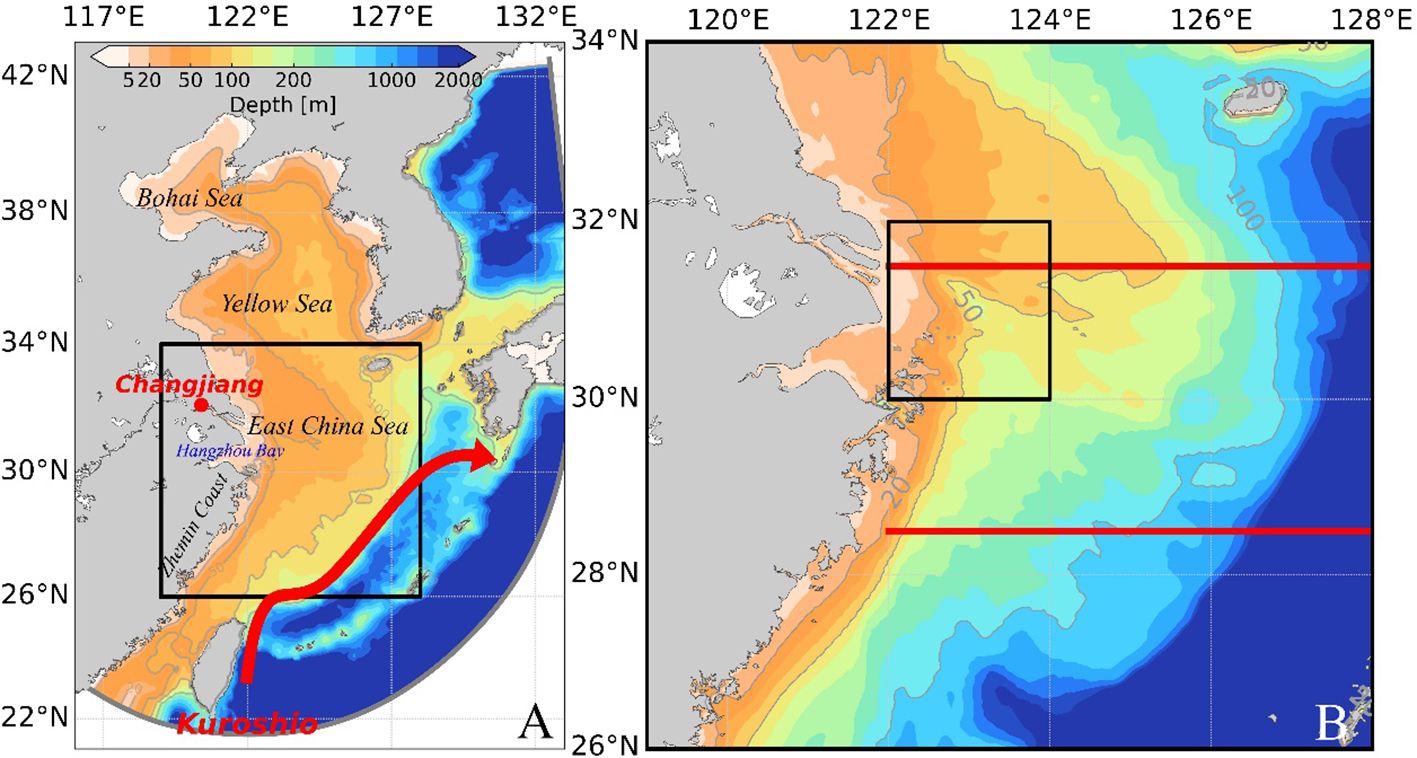
Figure 1 Map of the model domain, (A) the bathymetry of the model domain, with the red dot indicating the location of Changjiang and the red curve indicating the Kuroshio current, the black square marks the study region; (B) the study region, the black box indicates the region for calculating oxygen budget and the red lines are the 31.5°N and 28.5°N transects.
The biogeochemical component is a simplified nitrogen cycle model (Fennel et al., 2006) expanded to include the dynamics of DIP (Dissolved Inorganic Phosphorus) (Laurent et al., 2017). A mass-conserving sediment oxygen demand was specified following Fennel et al. (2006), which assumes all sinking (aquatic phytoplankton-derived) oceanic organic matter that reaches the water-sediment interface is remineralized instantaneously. This sediment treatment consumes dissolved oxygen and releases NH4 and PO4 to the bottom water, and a portion of the organic nitrogen is lost to nitrogen gas (N2) via denitrification. The same biogeochemical model scheme has been successfully applied and shown satisfying performance in other hypoxic regions, including the northern Gulf of Mexico, and the Chesapeake Bay (Fennel et al., 2013; Feng et al., 2015). The initial and open boundary conditions for nutrients and oxygen were extracted from the climatological monthly World Ocean Atlas 2013 (WOA13, https://www.nodc.noaa.gov/OC5/woa13/). A full description of the model setup is provided in Zhang (2022) and Zhang et al. (2018).
This coupled model has been validated to be in good agreement with the observed data from multiple research surveys for temperature, salinity, and bottom dissolved oxygen (RMSEs of 1.66, 2.22 and 0.95 for temperature, salinity, and bottom dissolved oxygen, respectively) (Zhang et al., 2019, 2018). The sea surface chlorophyll was compared with satellite data (Zhang et al., 2021). This model has been used to investigate oxygen dynamics off the Changjiang estuary and factors controlling short-timescale spatiotemporal spread of seasonal hypoxia off the estuary (Zhang et al., 2018, 2022). In this study, the modeled bottom dissolved oxygen and surface chlorophyll were further verified, which can be seen in the Supplementary information (Supplementary Figures 1, 2). The verification results show that the model performance is decent and the analysis of dynamical and biological processes in the Changjiang estuary region based on this model is reliable. In this study, the model is initiated in January 2009 and runs for 12 years, with the first two years constituting the spin-up period for the model. This paper focus on the Changjiang estuary and its adjacent waters, so we selected the study area as the black box (26-34°N, 119-128°E) indicated in Figure 1A, and the area is included in the model domain.
2.4 Calculation of dissolved oxygen budget terms
The time rate of dissolved oxygen content changes in the water column due to each process can quantitatively describe the variables evolution during typhoon and help explore the driving mechanism. The equation of dissolved oxygen content is given as.
Note that all the budget terms are provided by direct model output and then integrated over the corresponding regions to achieve dissolved oxygen budget. represents dissolved oxygen concentration (mmol m-3), is the volume of a model grid cell (m3). The time rate of dissolved oxygen content changes (the left-hand side term) is the change rate of oxygen content over time due to combined effects of all the physical and biogeochemical processes on the right-hand side. The first two budget terms on the right-hand side are advection and diffusion-induced oxygen changes, respectively. The term PP is the oxygen released by primary producers during photosynthesis, WCR is oxygen consumption in the water due to water column respiration and nitrification. and Fair-sea are the areal integral of oxygen fluxes across the bottom and the air-sea interface, respectively. The is calculated following Fennel et al. (2006). The readers are referred to Supplementary information for the detailed definition of each term and Zhang et al. (2018) for the list of the biological parameters. The oxygen budget analysis focuses primarily on advection, diffusion, primary production, and air-sea flux terms, and the remaining water column respiration, nitrification, and sediment oxygen consumption are combined and represented as ‘others’ in the subsequent figures and text.
In this study, we calculated the changes in dissolved oxygen due to each process (oxygen budget) to explore the response of dissolved oxygen to typhoons, and here we calculated the oxygen budget for the region as marked by the black box in Figure 1B. In 2017, no typhoon affected the Changjiang estuary region in July and August. Therefore, this study defines 2017 as a typhoon-free year, and the 2017 oxygen budget was used as a control group.
2.5 Surface chlorophyll after typhoon based on GOCI data
GOCI chlorophyll data was collected during typhoons from 2011 to 2020. The satellite data showed that the locations of high chlorophyll concentrations changed pre- and post-typhoons (Figure 2, only a few typhoons are selected to show here). After Typhoon Lekima in 2019, the location of high chlorophyll concentration shifted to the south and appeared in coastal areas of Zhejiang (Figures 2B, E). After Typhoons in 2013 and 2020, the high chlorophyll both appeared offshore at a depth deeper than 50 m (Figures 2A, D, and 2C, F). Although high chlorophyll concentrations all appeared in the study region after the passage of these typhoons, the post-typhoons high-concentration locations of these typhoons were distinct (Figure 2).
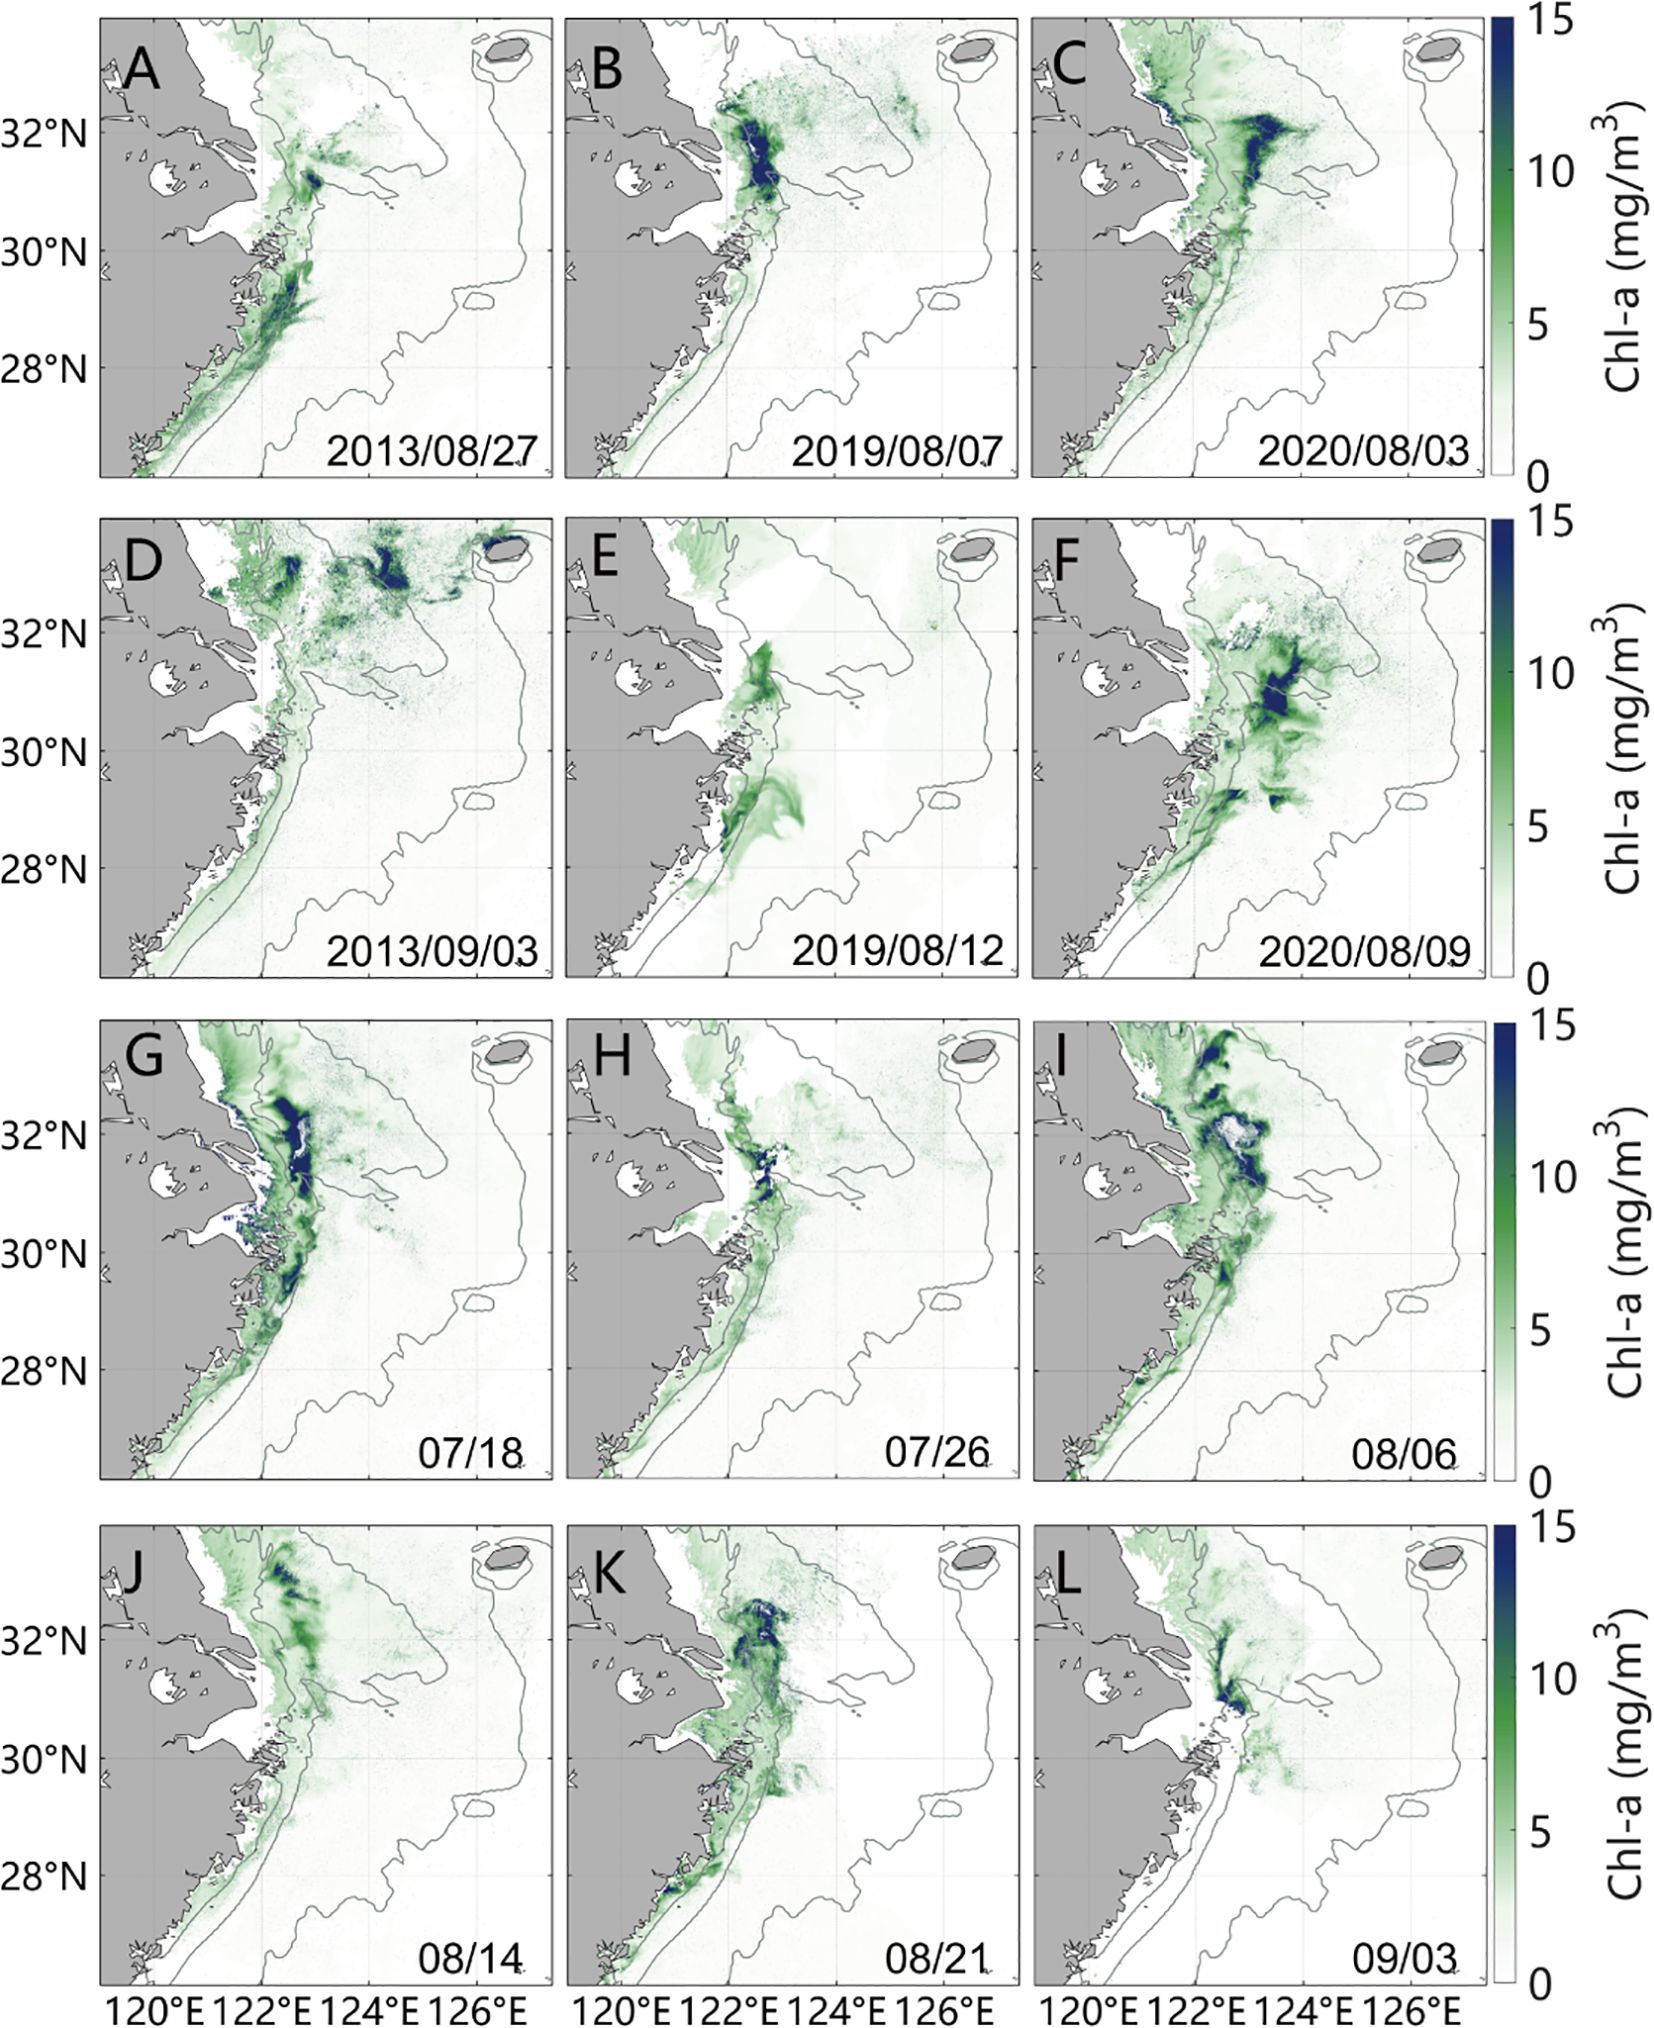
Figure 2 GOCI surface chlorophyll images. Panels (A–F) show surface chlorophyll before and after typhoons Kong-rey in 2013, Lekima in 2019, and Hagupit in 2020. Panel (G–L) show GOCI chlorophyll during 5 typhoons in 2018. Surface chlorophyll (G) pre-typhoon; (H) after Ampil; (I) after Jongdari; (J) after Yagi; (K) after Rumbia; (L) after Soulik. The gray isolines are the 20, 50, and 100 m isobaths, respectively.
Then, we selected 2018, the year with the most complete satellite images and frequent typhoons, for further analysis. In the summer of 2018, 5 typhoons successively passed through the selected region, including three severe tropical storms and two severe typhoons (Supplementary Figure 3). The 5 typhoons brought distinct chlorophyll changes (Figures 2G–L). The chlorophyll after Typhoons Ampil, Yagi, and Soulik did not significantly increase (Figures 2H, J, L), while after Typhoons Jongdari and Rumbia, the chlorophyll significantly increased (Figures 2I, K). The areas where chlorophyll increased after Typhoons Jongdari and Rumbia were different (Figures 2I, K). The area of high chlorophyll concentration after Ampil was small and distributed along the coast, while the area of high chlorophyll concentration expanded after Jongdari and moved to the north after Yagi, and moved to the south after Rumbia (Figures 2G–L). The large changes in chlorophyll after the typhoons were not consistent in magnitude or spatial distribution, and the cause of these differences required us to do further investigation. Satellite images are mostly disrupted by clouds during typhoons, and satellite data lacks information on the sub-surface layer. Therefore, we used a numerical model for further investigation in the following section.
3 Results
3.1 Responses of chlorophyll to typhoons in 2019 based on model simulations
3.1.1 Changes in chlorophyll
A wide range of high surface chlorophyll located south of the Hangzhou Bay prior to the passage of Danas (Figure 3A). North of the Changjiang estuary, surface chlorophyll was concentrated near the coast and chlorophyll concentration was low at water depth greater than 50 m (Figure 3A). The depth-integrated chlorophyll was mainly concentrated in the shallow coastal region (Supplementary Figure 5A). Danas passed through the Changjiang estuary on July 19, at which time the surface chlorophyll concentration decreased, before increasing again (both in the shallow and offshore regions) on July 22. The high values in offshore regions gradually disappeared, and the area of high chlorophyll concentration expanded and moved northward. The range of high values reached the maximum on August 2 (Figure 3D). The chlorophyll concentration remained at high levels for 6 days until the approach of typhoon Lekima on August 8 and 9, and the nearshore high values disappeared (Figure 3E). On August 13, chlorophyll began to rise extensively, covering nearly the entire study area (Figure 3F). On August 16, chlorophyll in the deep region began to decrease, and chlorophyll concentration peaked on August 17 and 19, with the range of high values concentrated off the estuary in the area between 20m and 50m isobath (Figure 3G).
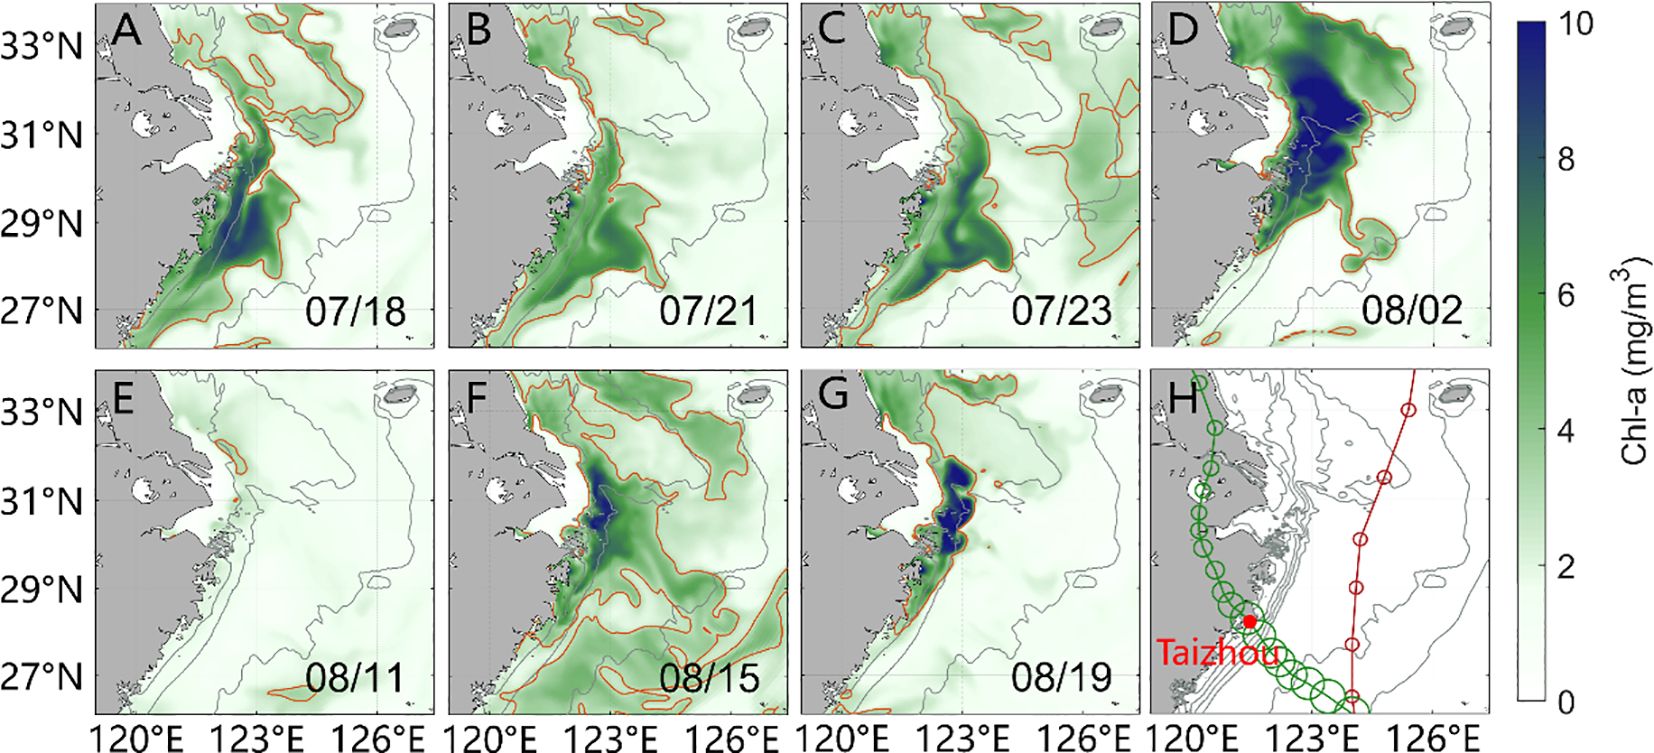
Figure 3 Modeled surface chlorophyll during typhoon passage in 2019. The gray isolines are 20, 50, and 100 m isobaths, respectively. In Panels (A–G), the red isoline is 3mg/m3 surface chlorophyll isoline. Panel (H) shows typhoon tracks, red is Typhoon Danas, green is Typhoon Lekima.
The variations of surface chlorophyll during and post the 2 typhoons can be divided into two stages. The first stage is the immediate decrease in chlorophyll in the pre-typhoon high-value areas and the following increase in chlorophyll in the offshore areas after the passage of a typhoon. The second stage is 4 or 5 days after the passage of a typhoon, high chlorophyll in the offshore disappears, while chlorophyll in the nearshore region gradually increases. And the nearshore high chlorophyll mostly concentrates off the estuary.
3.1.2 Chlorophyll evolution mechanism: wind, nutrients, river plume
To assess the underlying causes, the depth-integrated nitrate for the 0-20 m water layer, sea surface salinity, and nitrate concentration along 31.5°N during the typhoon period were compared (Figure 4). The 0-20m integrated nitrate content (integral within the study region as marked by the black box in Figure 1A, excluding regions constrained by 31 isohalines to remove the impact from Changjiang) increased significantly, from 1.98×10¹⁰ mol (Figure 4A1) to 3.04×10¹⁰ mol (Figure 4A2), in the offshore area after the passage of Danas. The offshore spread of freshwater is strongly constrained (Figure 4B2) and the water column was well mixed along 31.5°N at this time, with high nitrate concentrations at the surface (Figure 4C2). The nutrients limitation of phytoplankton growth in the offshore euphotic zone was temporally relieved (Figure 4C2). Corresponding to the first stage of the evolution of primary production, chlorophyll in the offshore area increased (Supplementary Figures 5B, C), because phytoplankton growth is directly related to high nutrient input (He et al., 2023). The offshore nutrients decreased, from 3.04×10¹⁰ mol (Figures 4A2, 4C2) to 1.13×10¹⁰ mol (Figures 4A3, 4C3), during uptake. Meanwhile, stratification (represented by surface salinity) gradually recovered (Figure 4B3). Without a constant supply of nutrients, chlorophyll in offshore areas decreased, and primary production entered the second stage of evolution. At this time, the Changjiang river is the controlling nutrients source, and the spread of freshwater determines the distribution of chlorophyll (Figures 4B3, Supplementary Figure 5D). Corresponding to the second stage, the high chlorophyll generally concentrated off the estuary (Figure 3D).
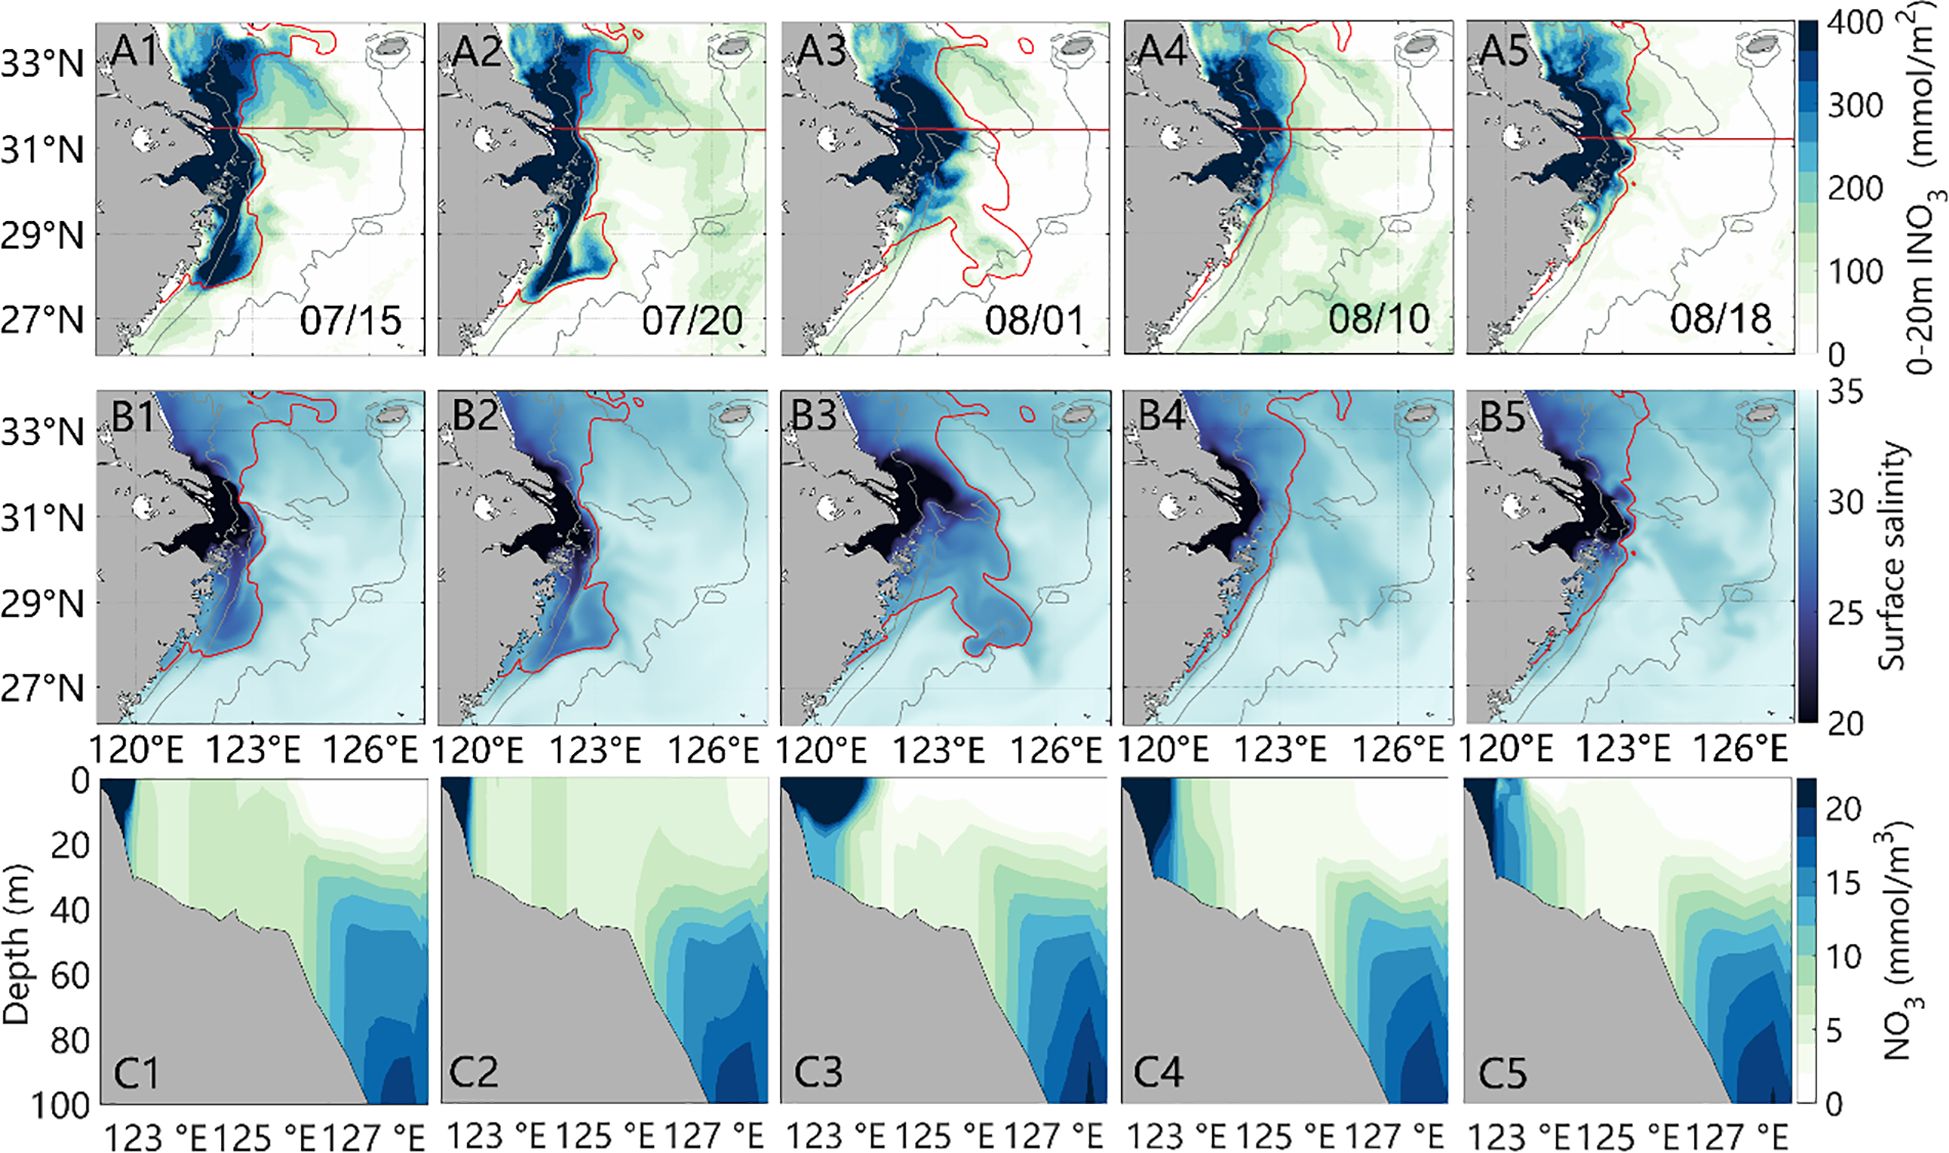
Figure 4 Primary production evolution mechanism. Panels (A) 0-20m depth-integrated nitrate concentration, INO3 represents integrated NO3, and the red line marks the location of 31.5°N transect, the red isoline is the 31 isohalines; (B) surface salinity, the red isoline is the 31 isohalines; (C) nitrate concentration along 31.5°N.
The variations after Typhoon Lekima were similar to those after Danas, with the offshore nitrate content increased from 1.13×10¹⁰ mol (Figures 4A3, 4C3) to 3.39×10¹⁰ mol (Figures 4A4, 4C4). The increase in chlorophyll occurred around 4~5 days after the increase in nitrate content (Supplementary Figure 5F), which demonstrated that the increase in offshore primary production in the first stage is due to the recharging of nutrients in the euphotic zone by the exchange of water masses. Unlike Danas, the location of post-Lekima plume did not change much, as the pre-Lekima plume mainly concentrated off the estuary and had not yet spread southward due to the influence of Danas (Figures 4B4, 4B5). Both typhoons brought significant nitrate content and subsequent chlorophyll increases for the offshore areas, and the location/magnitude of the increases appeared to be track-/intensity-dependent (Figures 3H, 4A2, 4A4).
3.2 Response of primary production to different typhoons
Following the above analysis, the severe typhoon Haikui in 2012, super typhoon Chan-hom in 2015, and super typhoon Lekima in 2019 were selected for a comparative analysis of intensity (Figure 5). Here we mainly compared the first stage of the evolution, as primary production at this stage is mainly affected by strong wind disturbances. The delivery in nutrients via mixing and increase in chlorophyll were related to typhoon intensity (Figures 5B1–B3), and about 1~4 days (specifically for these typhoons) after mixing, the chlorophyll concentration reaches the maximum. The primary production (integrated chlorophyll content within the study region as marked by the black box in Figure 1A) increased by 4.44×10⁹ g, 15.21×10⁹ g, and 8.12×10⁹ g after Haikui, Chan-hom, and Lekima, respectively (Supplementary Table 2). The severe typhoon Haikui in 2012, severe tropical storm Kong-rey in 2013, and super typhoon Bavi in 2020 were selected for a comparative analysis of tracks (Figure 6). The areas of chlorophyll increase after typhoon were closely related to the typhoon tracks (Figure 6A), due to the different effects of nutrients delivery along 28.5°N and 31.5°N (Figures 6B, C), since the transect near the typhoon track was better mixed. The primary production increased by 4.44×10⁹ g, 2.85×10⁹ g, and 5.92×10⁹ g after Haikui, Kong-rey, and Bavi, respectively. The primary production increased after the passage of 30 typhoons impacting the study region between 2011-2020 (Supplementary Table 2). The magnitude of the increase in primary production is positively correlated with typhoon intensity with the correlation coefficient r = 0.36 (Figure 7A).
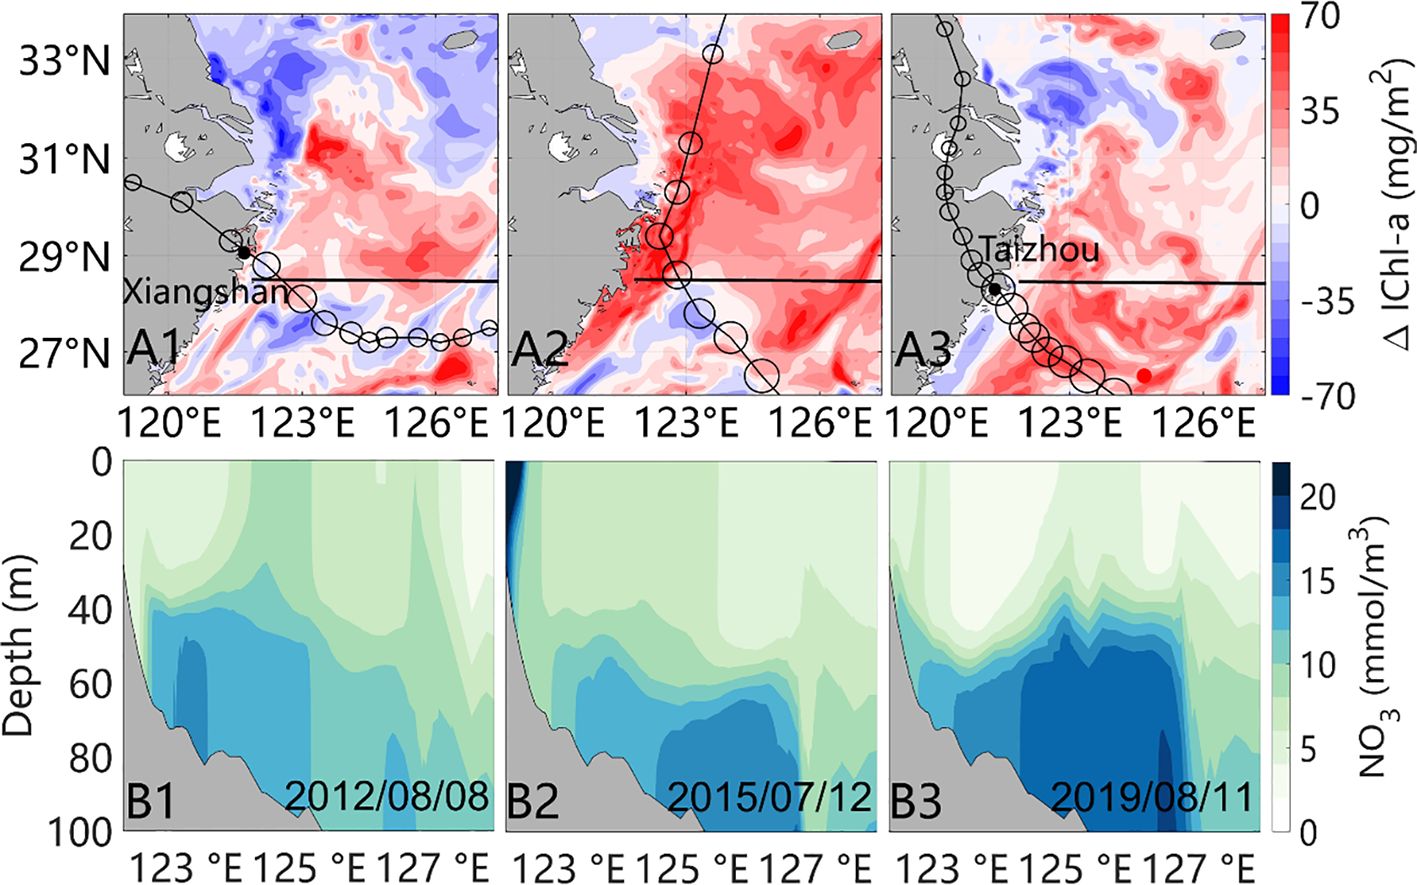
Figure 5 (A1-A3) show the depth-integrated chlorophyll differences between post- and pre-typhoons. The thick black line marks the 28.5°N transect, while the black dots in (A1), (A3) mark where the typhoon made landfall. Panels (B1-B3) show nitrate concentration along 28.5°N after typhoons.
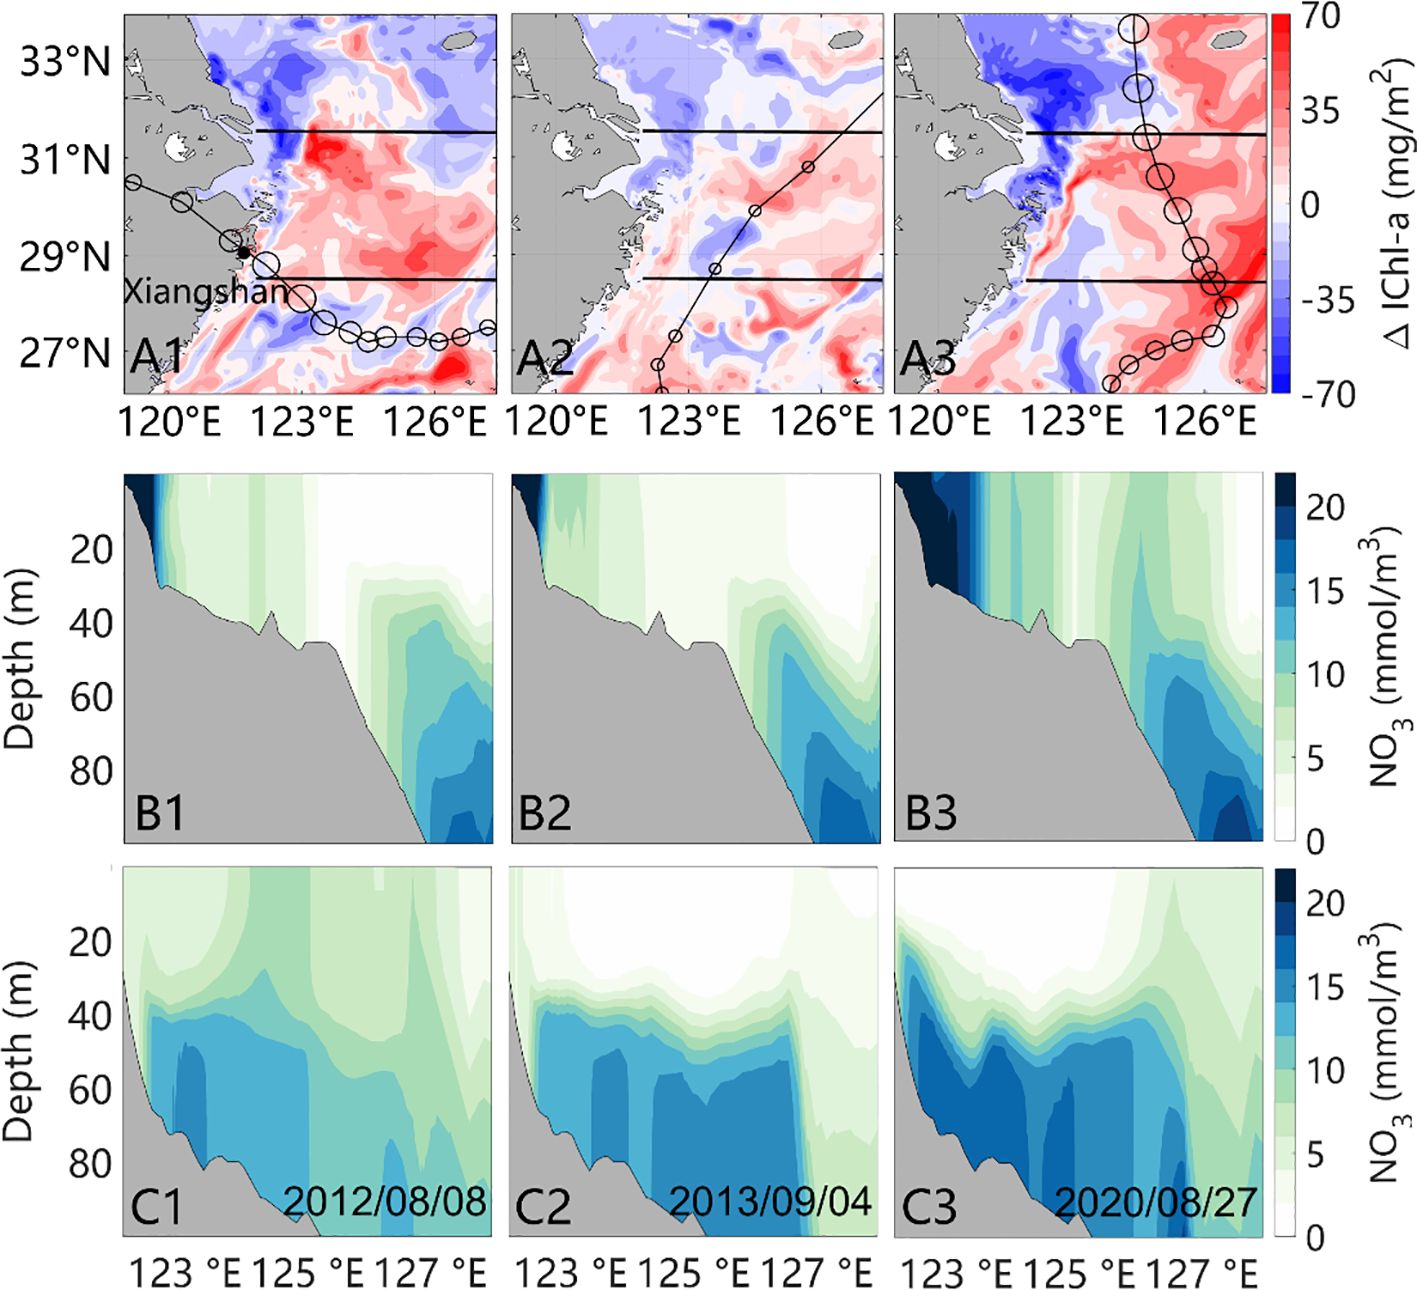
Figure 6 (A1-A3) show the depth-integrated chlorophyll differences between post- and pre-typhoons. The thick black lines mark the 28.5°N and 31.5°N transects, while the black dot in a1 marks where the typhoon made landfall. (B1-B3) show nitrate concentration along 31.5°N, while panels (C1-C3) show that along 28.5°N after typhoons.
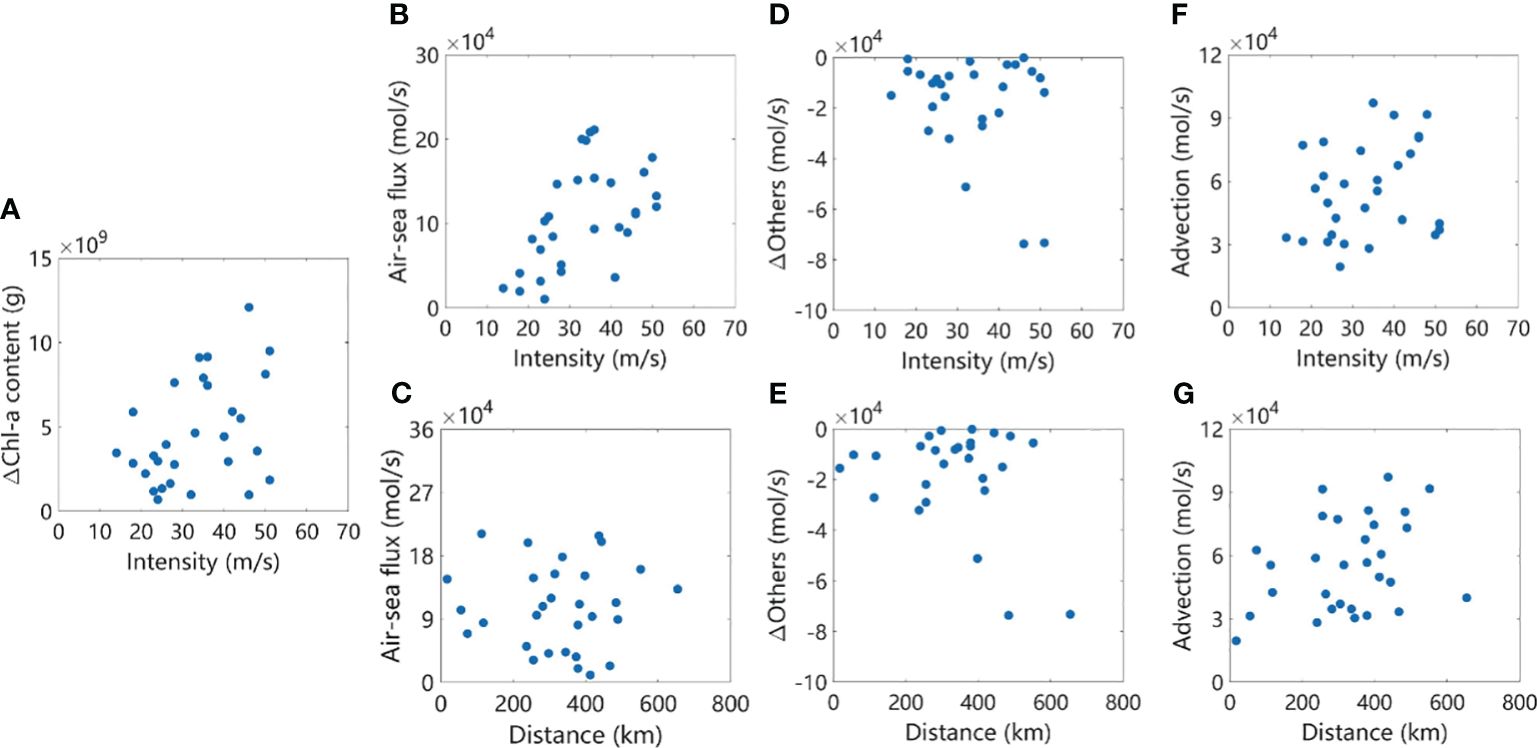
Figure 7 The impacts of typhoons between 2011-2020 in relation with the typhoon intensity and distance from the typhoon track. The (A) chlorophyll content differences, (B) air-sea flux variation, (D) others (oxygen consumption) term induced oxygen variation, and (F) advection-induced oxygen variation in response to typhoon intensity. Panels (C, E, G) show the air-sea flux variation, others term induced oxygen variation, and advection-induced oxygen variation in response to distance (between typhoon track and the black box as shown in Figure 1B), respectively. The ΔChl-a content is the study region integration of the post- and pre-typhoon chlorophyll differences. The air-sea flux and advection terms are the three-days average of the maximum value during the typhoon.
3.3 Changes in dissolved oxygen budget terms after typhoon
Oxygen budget during different typhoons was calculated to explore the response of dissolved oxygen to typhoons (Figure 8). It is worth noting that the diffusion term was almost zero in all time-series plots because the diffusion-induced oxygen variations in the upper and lower layers compensate each other (Figure 8). Without typhoon, the advection, and air-sea flux terms fluctuate around zero (Figure 8D). The overall dissolved oxygen variation rate (oxyrate, the left-hand side term in Equation 1) fluctuated around zero. During the passage of a typhoon, the oxygen budget terms showed large fluctuations, especially in the air-sea flux, the PP, and the advection terms which leaded to significant changes in oxyrate (Figures 8A–C).
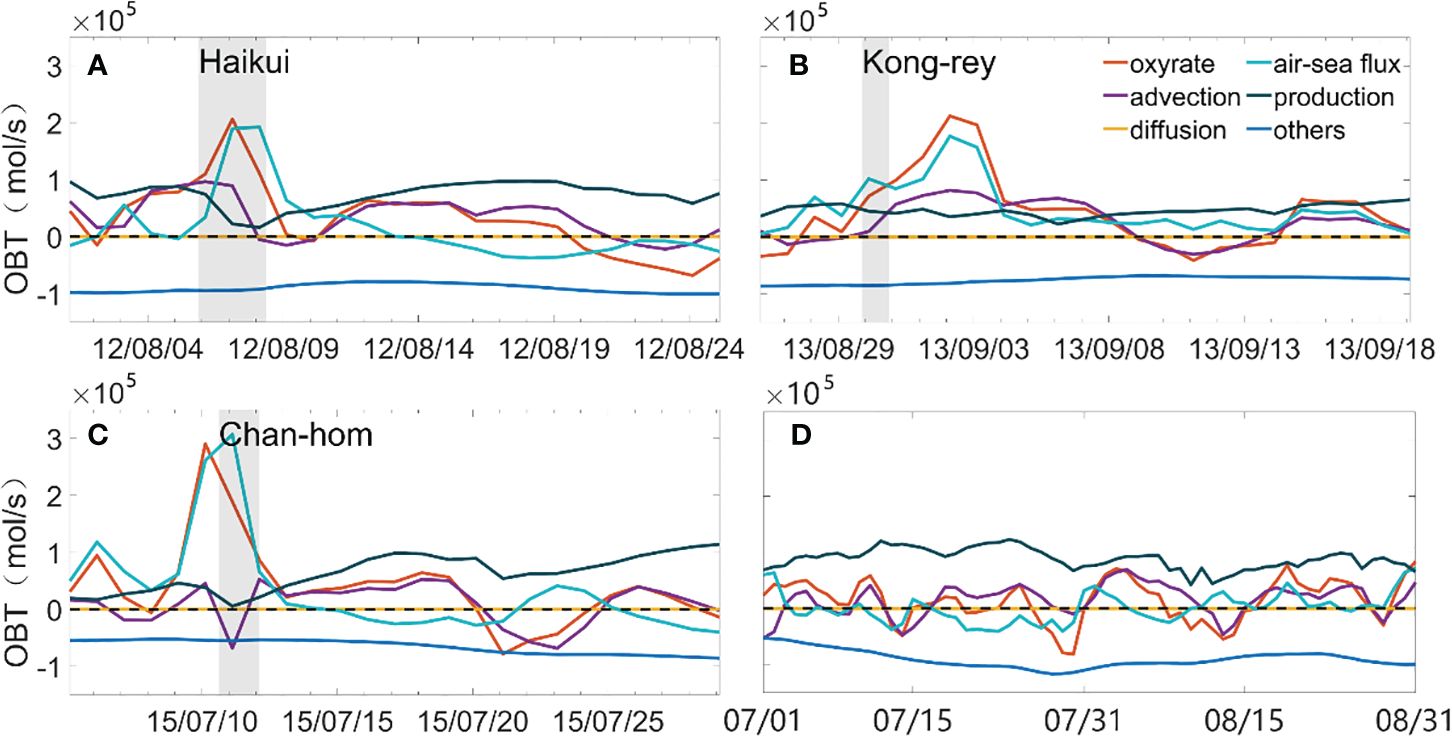
Figure 8 The variations in dissolved oxygen budget terms brought by typhoons of different intensities. (A) The oxygen budget during Haikui; (B) The oxygen budget during Kong-rey; (C) The oxygen budget during Chan-hom; (D) The oxygen budget in summer 2017. OBT represents the oxygen budget term calculated for the black box region in Figure 1B, which uniformly intercepted for the 25-day period covering the entire typhoon transit period (gray shaded area). And this study defines the transit period as the period from typhoon arriving in the area (27°N ~32°N, 121°E ~ warning line for 24 hours) to the typhoon departing the area or landfalling.
A significant increase in the air-sea flux term was seen when the typhoon reached the study area (the black square area in Figure 1B). Both Haikui and Chan-hom showed large increase in this term during the typhoon passed through the study area, while Typhoon Kong-rey showed an increase 2 days after the typhoon passed (Figure 8B, see Figures 5A1, A2, Figure 6A2 for the typhoon tracks) due to the existence of several wind-speed peaks during Kong-rey. Typhoon Chan-hom brought the most significant increase in air-sea flux term, which reached 3×10⁵ mol/s (Figure 8C). The air-sea fluxes during Typhoons Haikui and Kong-rey reached 2×10⁵ mol/s (Figures 8A, B). The positive increases in air-sea indicate net gains of oxygen from the atmosphere, and positive oxyrate. After the passage of typhoons, air-sea flux dropped rapidly in around 2 days (Figures 8A–C). The magnitude of air-sea flux during typhoons is positively correlated with typhoon intensity with the correlation coefficient r = 0.52 (Figure 7B, Supplementary Table 2). On the other hand, no clear trend was found in the magnitude of air-sea flux following the changes in distance between the region and typhoon track (Figure 7C, Supplementary Table 2).
Increases in the PP term were seen after both Typhoon Haikui and Chan-hom (Figures 8A, C). Notably, two increases in PP occurred after Chan-hom. The increase in PP was more persistent, lasting for more than 20 days, compared to the increase in air-sea flux during the typhoon (Figure 8). While the changes in PP term was small after Kong-rey, the weakest typhoon (Figure 8B). Note that the PP term usually distributes in the upper layer (Zhang et al., 2018), and the over-saturated dissolved oxygen would be degassed to the atmosphere. Hence, the air-sea flux decreased to negative values following the increase in PP term (Figures 8A, C). On the other hand, the increased organic matter associated with increased primary production (represented by increased chlorophyll content) resulted in increased oxygen consumption (Figures 7D, E). The ‘others’ term was negative (Figure 8), and its magnitude increased by 1.4×10⁴ mol/s and 3.2×10⁴ mol/s after Haikui and Chan-hom, respectively. The changes in the ‘others’ term was negatively correlated with the typhoon intensity (r = -0.23) and the distance from the typhoon track (r = -0.28) (Figures 7D, E).
The advection term also increased after the passage of all typhoons, although they were not as significant as the air-sea flux term (Supplementary Table 2, Figures 8A–C). The advection terms were 9.15×10⁴ mol/s, 7.72×10⁴ mol/s, and 5.54×10⁴ mol/s for Haikui, Kong-rey, and Chan-hom, respectively (Supplementary Table 2). The intensity of Kong-rey was weaker than that of Chan-hom, but the advection term associated with Kong-rey was larger than that associated with Chan-hom. The advection term has a higher correlation coefficient with distance, r = 0.32, than with typhoon intensity, r = 0.25 (Figures 7F, G). Therefore, results suggested that advection rather than mixing dominating dissolved oxygen variation is related to typhoon tracks. The advection effect is prominent for typhoons in decent distance from the Changjiang estuary, meanwhile mixing would have less impacts in the study region due to the long distance.
3.4 The time rate of dissolved oxygen content change, oxyrate
Strong wind enhances the vertical ventilation and lateral exchange of the water column, thus alleviating the bottom dissolved oxygen stress. On the other hand, the increase in nutrients within the euphotic zone associated with strong wind induced mixing fertilizes phytoplankton growth, and subsequently enhances dissolved oxygen consumption in the subsurface layer and beyond. However, it was difficult to tell which of these two effects brought more impact. The analysis of oxyrate can directly show whether typhoon would eventually lead to a net gain or net loss of dissolved oxygen in the region (Figure 9). Figure 10P shows the dissolved oxygen variation rate for summer 2017 (no typhoon), and is used here as a control case. Without typhoons, the oxyrate and changes in oxygen content tended to fluctuate around zero. Under the influence of typhoons, oxyrate showed large variations (Figure 9). The thick gray line indicates the moment when the typhoon reached the Changjiang estuary. Most of the negative values of oxyrate occurred 7 days after the passage of a typhoon (Figure 9). The magnitude of negative values of oxyrate was much smaller, with the positive oxyrate approaching 3×10¹⁰ mol d-1 (Figures 9B, D, E, L) and the negative value not lower than -1×10¹⁰ mol d-1.
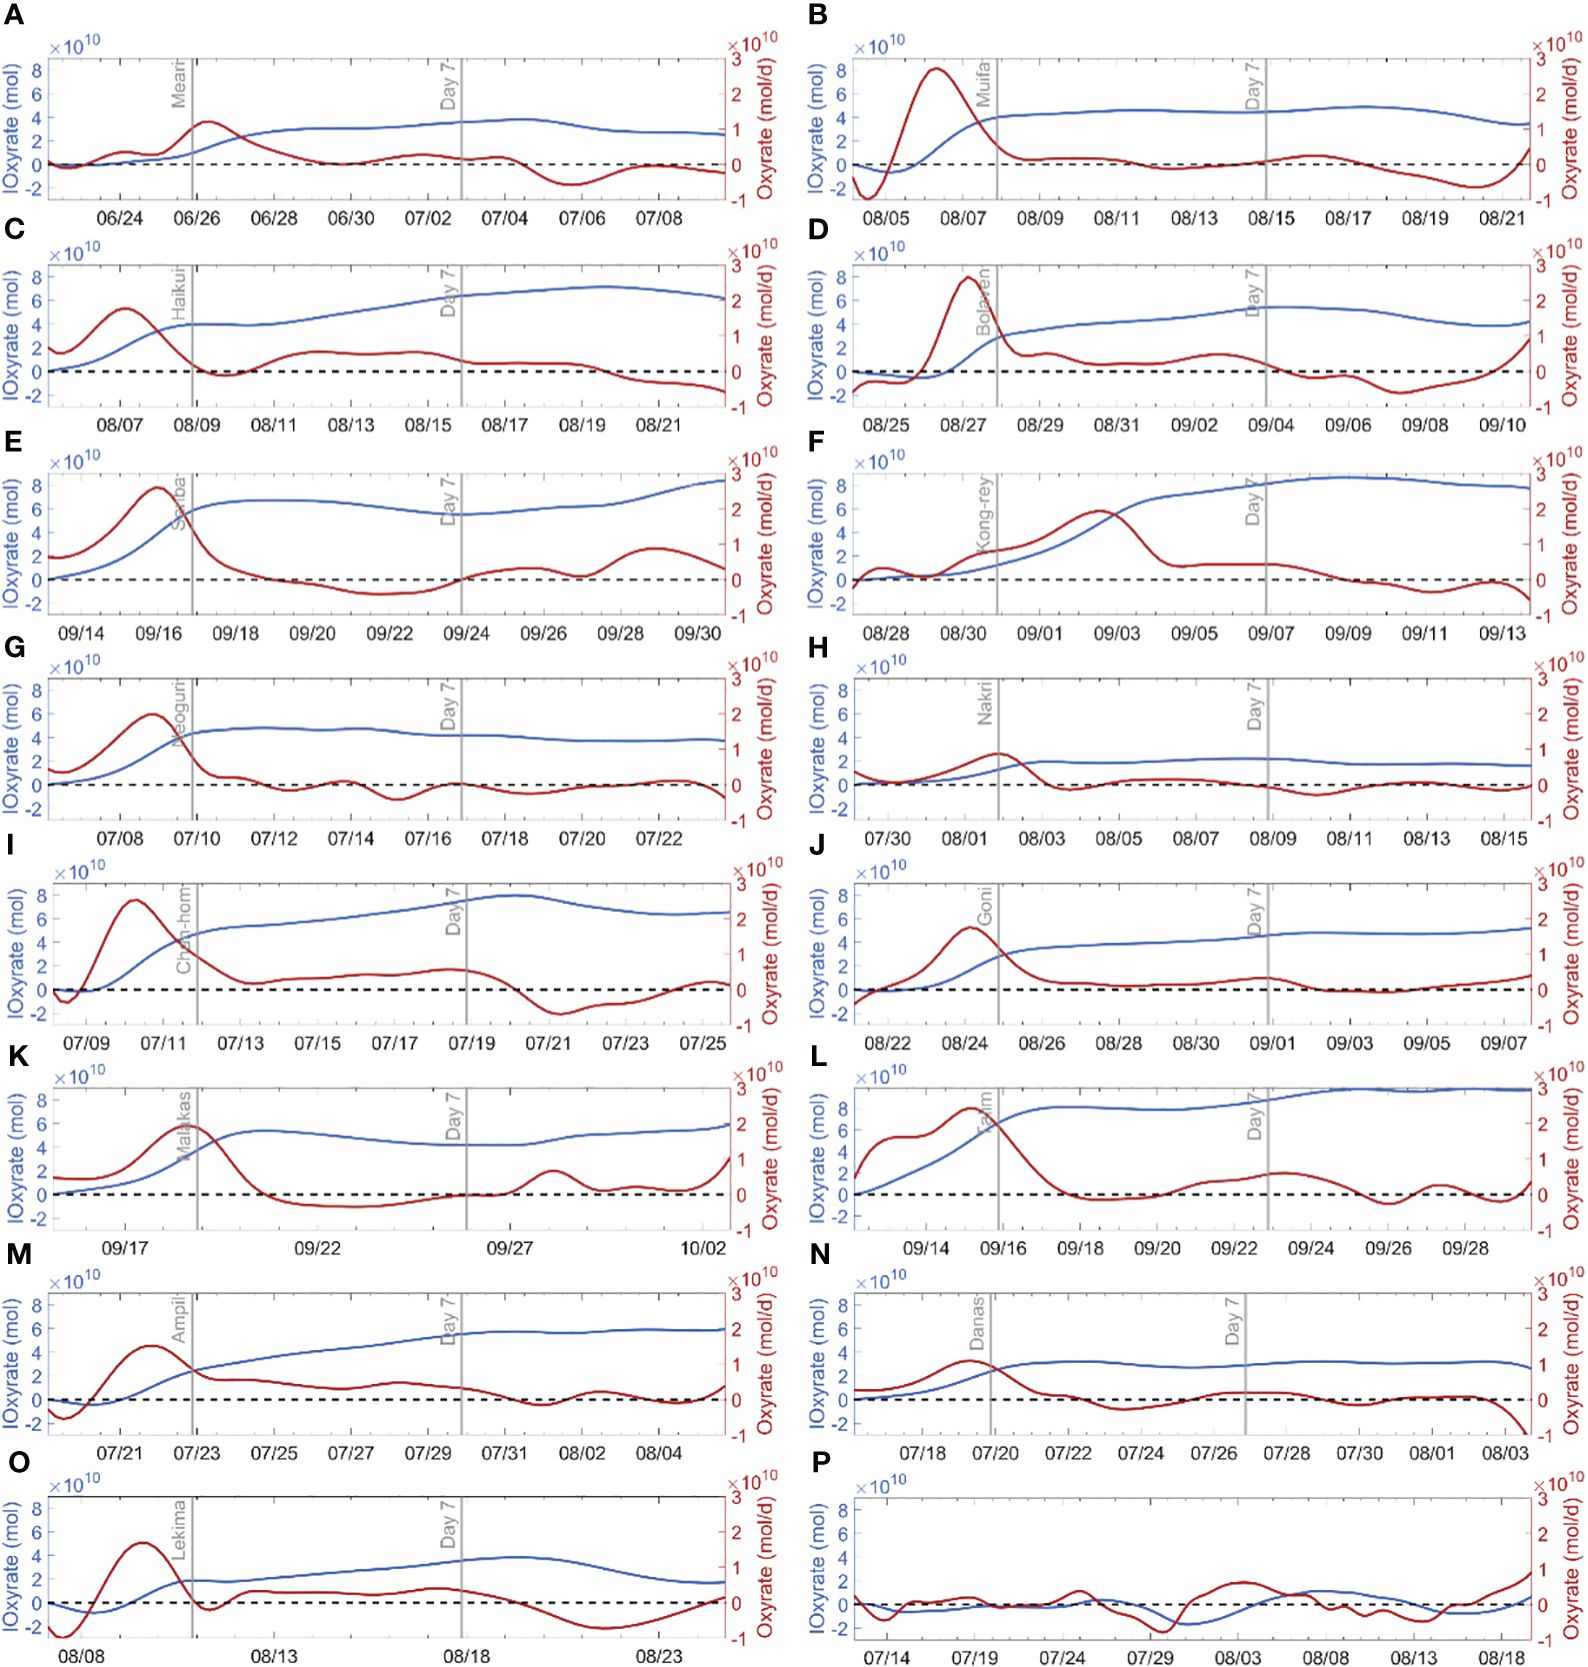
Figure 9 Time series of the dissolved oxygen change rate term (the red line) and time-integrated oxygen change rate term (the blue line) during typhoon passage. (A–O) Show the dissolved oxygen change of typhoons between 2011-2020, while (P) shows the situation without typhoon influence in 2017.
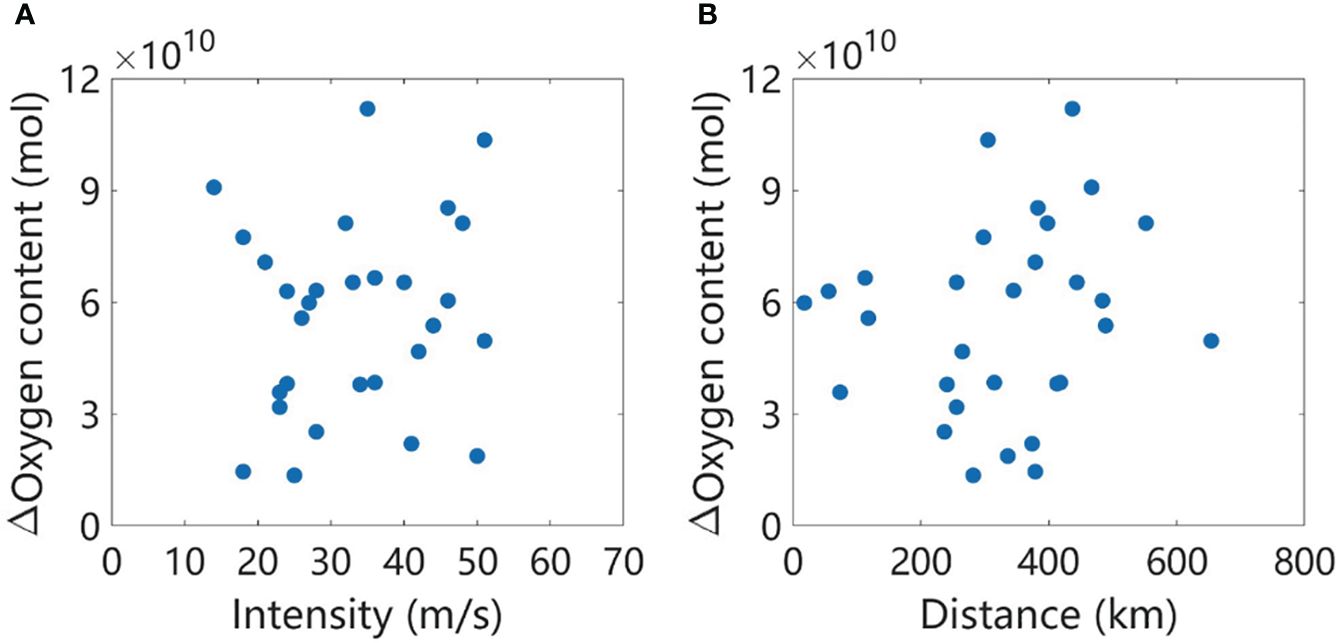
Figure 10 The changes in oxygen content in the black box as shown in Figure 1B in response to the (A) typhoon intensity and (B) the distance from the typhoon track. The Δ Oxygen content is time integration of oxyrate (Figure 9) between 14 days post-typhoon and at the time of the typhoon.
The oxygen content increased after the passage of all typhoons, indicated by the positive values of the time integration of oxyrate (Figure 9). The decrease in the dissolved oxygen content occurred in most cases in the time period 7 to 14 days after the typhoon (Figure 9), because of the increased oxygen consumption associated with increased organic matter (phytoplankton growth). There were some exceptions, such as typhoons Sanba, Goni, Malakas, Talim, and Danas, which showed a decrease in dissolved oxygen content within 7 days of the typhoon passage (Figure 9). Despite the overall increase in the oxygen content after typhoon passage, no clear trend was found in the magnitude of oxygen content increase following typhoon intensity or the distance between the region and typhoon track (Figure 10).
4 Discussion
Typhoon-induced marine primary production (represented by chlorophyll) responses were explored using satellite data and model simulations. Typhoon triggered gradual surface chlorophyll increase as intense storms bring the underlying nutrients to the euphotic zone through entrainment mixing (Figures 3D, 4A3; Robarts et al., 1998; Fogel et al., 1999; Zhao et al., 2015). Increased terrestrial runoff from heavy rainfall and the intrusion of high phosphate water brought by upwelling can also promote the growth of upper phytoplankton (Walker et al., 2005; Paerl et al., 2018; Li et al., 2022). Ye et al. (2013) found that chlorophyll concentrations significantly increased both at the surface and in the subsurface layer (above the thermocline) after typhoon. This is confirmed by the depth-integrated chlorophyll content (Figure 3, Supplementary Figure 5). The high integrated chlorophyll content was seen in the region of low surface chlorophyll concentration, especially on July 23 and August 15 (Supplementary Figures 5C, F). However, this change in primary production is different in nearshore and offshore regions, as the recovery of Changjiang river plume allows for continuous nutrient supplementation in nearshore area after the mixing weaken (Figures 4B3, C3, Qiu et al., 2019). Typhoon-induced phytoplankton blooms lead to an increase in the amount of organic matter in the Changjiang estuary region, which is bound to have important impact on dissolved oxygen in the region (Chen et al., 2007).
The effects of typhoons on the dynamics of dissolved oxygen are complex and multiple. Typhoons lead to strong vertical mixing which disturb vertical stratification, aerating near-bottom water via air-sea flux to alleviate bottom oxygen stress (Figures 7, 8; Feng et al., 2012). The magnitude of air-sea flux is correlated with typhoon intensity (Figure 7B). Meanwhile, the advection associated with strong wind triggers lateral exchange of dissolved oxygen and also alleviate local oxygen stress (Figure 7; Zhang et al., 2022). Meng et al. (2022) also found oceanic advection induced by Typhoon Bavi control the development and spatial migration of hypoxia. The magnitude of advection induced oxygen increase is positively correlated with both typhoon intensity and distance between typhoon track and the region (Figures 7F, G). On the other hand, the vertical mixing and lateral transport both deliver nutrients to euphotic zone and temporally increase primary production (Figures 5, 6; Li et al., 2022). The magnitude of increased primary production is linearly correlated with typhoon intensity (Figure 8A). The increased primary production leads to increased dissolved oxygen consumption via organic matter degradation (Figures 7, 8; Wang et al., 2017). In addition, strong mixing and increased freshwater runoff caused by typhoons suspended a large amount of organic matter and increased terrestrial organic matter, which also led to increased oxygen consumption (Lu et al., 2022; Lao et al., 2023a, b).
The dissolved oxygen content increased after the passage of all typhoons between 2011-2020 (Figure 9). In terms of oxygen changes in the two weeks after typhoons, the combination of physical and biogeochemical effects associated with typhoons ultimately results in net gains of dissolved oxygen for the impacted region, such that typhoons are oxygen sources. Super typhoon would occur in higher frequency under the warming climate (Webster et al., 2005; Holland and Webster, 2007; Mann et al., 2007), and the impacts of typhoons on eastern China would increase in the future (Yin et al., 2011). The warming climate would cause deoxygenation over the shelf via declining oxygen solubility and accelerating oxygen consumption rate (Zhang et al., 2022). Hence, typhoons potentially would serve to counter the deoxygenation of seawater triggered by climate warming, and would likely slow down the exacerbation of seasonal hypoxia associated with intensified eutrophication and warming. This implies that the ecosystem uncertainty in the Changjiang estuary region will be greatly enhanced during summer.
One important caveat of the present study is that the wind forcing field for the model was from ERA5 dataset provided by the European Center for Medium-Range Weather Forecasts (ECMWF, https://www.ecmwf.int/en/forecasts/datasets). Typhoon is basically imposed through the winds associated with the ERA5 reanalysis product. The differences of wind intensity between realistic wind and the ERA5 reanalysis wind would impact the response magnitude of nutrients delivery, primary production, air-sea flux, the subsequent oxygen content. Further investigation is needed to quantify the different responses of primary production and dissolved oxygen content to reanalysis wind and realistic wind. Preconditions like the nutrients and vertical stratification could also influence the results, which makes it difficult to judge whether the response is caused by the typhoon passage or by the differences in ocean environment. Lévy et al. (2012) found that typhoons can generate instantaneous CO2 fluxes, and the direction of CO2 flux depends on the oceanic condition at the time of the typhoon passage. How to exclude the influence of pre-typhoon ocean conditions on the results will be a direction for future research. In addition, several typhoons with different intensities and tracks are selected for case analysis in this paper. However, typhoon characteristics such as translation speed will also affect ocean response (Lin, 2012; Shropshire et al., 2016), and the results brought by different selected typhoons may be different, which needs further study.
5 Conclusions
The variations in primary production during the passage of typhoons can be divided into two stages. The first stage is the increase of primary production over the shelf immediately after the typhoon passes. The location of offshore increases is highly linked with typhoon tracks. This is because the typhoon disturbances increased the delivery of nutrients to the euphotic layer and temporally relief nutrients limitation for phytoplankton growth. The second stage is the decrease of primary production in the offshore area 4 or 5 days after the typhoon passage, while the primary production in the nearshore area continues to increase. This is due to the exhaustion of nutrients in the offshore area and the recovery of Changjiang river plume in the nearshore area. The primary production during the first stage increases, and the magnitude of increase is positively correlated with typhoon intensity.
This study quantified the relative importance of aeration effect and oxygen consumption effect triggered by typhoons. The analysis and findings identify that typhoons ultimately cause net gains of dissolved oxygen in a region and act as oxygen sources because the aeration effect overcomes the oxygen consumption effect. Typhoons cause large fluctuations in the oxygen budget terms. The responses of air-sea flux, PP, advection term, and others term are highly linked with the typhoon intensity and the distance between typhoon track and the region. With the increasing trend of the frequency of super typhoon under a warming climate, typhoon potentially serves to counteract the ocean deoxygenation caused by warming and anthropogenic activities and is likely to slow down the exacerbation of seasonal hypoxia. The unpredictable variabilities of wind and typhoon increase uncertainties during the evaluation of coastal dissolved oxygen dynamics in the future.
Data availability statement
The tropical cyclone track information and wind speed data provided by the China Meteorological Administration is publicly available at https://tcdata.typhoon.org.cn/index.html, while the portion that was used in this study is available at http://doi.org/10.5281/zenodo.7927441. The GOCI (Geostationary Ocean Color Imager) chlorophyll data is publicly available at https://oceandata.sci.gsfc.nasa.gov/directdataaccess/Level-2/GOCI. All modeled data needed to evaluate the conclusions in the study is available at http://doi.org/10.5281/zenodo.7902329.
Author contributions
WY: Investigation, Methodology, Validation, Visualization, Writing – original draft, Writing – review & editing. HW: Data curation, Validation, Writing – review & editing. WZ: Investigation, Methodology, Supervision, Writing – original draft, Writing – review & editing.
Funding
The author(s) declare financial support was received for the research, authorship, and/or publication of this article. This work was jointly supported by the National Key Research & Development Program of China (Task No. 2023YFC3108003 in Project No. 2023YFC3108000), the open fund of Key Laboratory of Ocean Space Resource Management Technology, MNR (KF-2023-113), the National Programme on Global Change and Air–Sea Interaction Phase II, Zhejiang Provincial Ten Thousand Talents Program (No. 2020R52038).
Conflict of interest
The authors declare that the research was conducted in the absence of any commercial or financial relationships that could be construed as a potential conflict of interest.
Publisher’s note
All claims expressed in this article are solely those of the authors and do not necessarily represent those of their affiliated organizations, or those of the publisher, the editors and the reviewers. Any product that may be evaluated in this article, or claim that may be made by its manufacturer, is not guaranteed or endorsed by the publisher.
Supplementary material
The Supplementary Material for this article can be found online at: https://www.frontiersin.org/articles/10.3389/fmars.2024.1376432/full#supplementary-material
References
Breitburg D., Levin L. A., Oschlies A., Gregoire M., Chavez F. P., Conley D. J., et al. (2018). Declining oxygen in the global ocean and coastal waters. Science 359, eaam7240. doi: 10.1126/science.aam7240
Chen C.-C., Gong G.-C., Shian F.-K. (2007). Hypoxia in the East China Sea: One of the largest coastal low-oxygen areas in the world. Mar. Environ. Res. 64, 399–408. doi: 10.1016/j.marenvres.2007.01.007
Chen F., Lao Q., Lu X., Wang C., Chen C., Liu S., et al. (2023). A review of the marine biogeochemical response to typhoons. Mar. Pollut. Bull. 194, 115408. doi: 10.1016/j.marpolbul.2023.115408
Chen C., Lao Q., Zhou X., Jin G., Zhu Q., Chen F. (2024). Tracks of typhoon movement (left and right sides) control marine dynamics and eco-environment in the coastal bays after typhoons: A case study in Zhanjiang Bay. Sci. Total Environ. 912, 168944. doi: 10.1016/j.scitotenv.2023.168944
Chen J. Y., Ni X. B., Mao Z. H., Wang Y., Liang L. J., Gong F. (2012). “Remote sensing and buoy-based effect analysis of typhoon on hypoxia off the Changjiang (Yangtze) Estuary,” in Proceedings of SPIE [Remote sensing of the ocean, sea ice, coastal waters, and large water regions 2012]. Conference on Remote Sensing of the Ocean, Sea Ice, Coastal Waters and Large Water Regions, Edinburgh, Scotand, Sep 26-27.
Chen C.-C., Shiah F.-K., Chiang K.-P., Gong G.-C., Kemp. W. M. (2009). Effects of the Changjiang (Yangtze) River discharge on planktonic community respiration in the East China Sea. J. Geophys. Res. 114. doi: 10.1029/2008JC004891
Choi J.-K., Park Y. J., Ahn J. H., Lim H.-S., Eom J., Ryu J.-H. (2012). GOCI, the world's first geostationary ocean color observation satellite, for the monitoring of temporal variability in coastal water turbidity. J. Geophysical Research-Oceans 117, C09004. doi: 10.1029/2012JC008046
Conley D. J., Bjorck S., Bonsdorff E., Carstensen J., Destouni G., Gustafsson B. G., et al. (2009). Hypoxia-related processes in the baltic sea. Environ. Sci. Technol. 43, 3412–3420. doi: 10.1021/es802762a
Conley D. J., Carstensen J., Aigars J., Axe P., Bonsdorff E., Eremina T., et al. (2011). Hypoxia is increasing in the coastal zone of the baltic sea. Environ. Sci. Technol. 45, 6777–6783. doi: 10.1021/es201212r
Diaz R. J. (2001). Overview of hypoxia around the world. J. Environ. Qual. 30, 275–281. doi: 10.2134/jeq2001.302275x
Dybas C. L. (2005). Dead zones spreading in world oceans. Bioscience 55, 552–557. doi: 10.1641/0006-3568(2005)055[0552:DZSIWO]2.0.CO;2
Egbert G. D., Erofeeva S. Y. (2002). ). Efficient inverse Modeling of barotropic ocean tides. J. Atmos. Ocean Technol. 19, 183–204. doi: 10.1175/1520-0426(2002)019<0183:EIMOBO>2.0.CO;2
Emanuel K. (2005). Increasing destructiveness of tropical cyclones over the past 30 years. Nature 436, 686–688. doi: 10.1038/nature03906
Engle V. D., Summers J. K., Macauley J. M. (1999). Dissolved oxygen conditions in northern Gulf of Mexico estuaries. Environ. Monit. Assess. 57, 1–20. doi: 10.1023/A:1005980410752
Falkowski P. G., Ziemann D., Kolber Z., Bienfang. P. K. (1991). Role of eddy pumping in enhancing primary production in the ocean. Nature 352, 55–58. doi: 10.1038/352055a0
Feng Y., Dimarco S. F., Jackson G. A. (2012). Relative role of wind forcing and riverine nutrient input on the extent of hypoxia in the northern Gulf of Mexico. Geophys. Res. Lett. 39, L09601. doi: 10.1029/2012GL051192
Feng Y., Friedrichs M. A. M., Wilkin J., Tian H., Yang Q., Hofmann E., et al. (2015). Chesapeake Bay nitrogen fluxes derived from a land-estuarine ocean biogeochemical modeling system: Model description, evaluation, and nitrogen budgets. J. Geophys. Res. Biogeosci. 120, 1666–1695. doi: 10.1002/2015JG002931
Fennel K., Hu J., Laurent A., Marta-Almeida M., Hetland R. (2013). Sensitivity of hypoxia predictions for the northern Gulf of Mexico to sediment oxygen consumption and model nesting. J. Geophys. Res. Oceans 118, 990–1002. doi: 10.1002/jgrc.20077
Fennel K., Testa J. M. (2019). Biogeochemical controls on coastal hypoxia. Annu. Rev. Mar. Sci 11 (1), 105–130. doi: 10.1146/annurev-marine-010318-095138
Fennel K., Wilkin J., Levin J., Moisan J., O'Reilly J., Haidvogel D. (2006). Nitrogen cycling in the Middle Atlantic Bight: Results from a three-dimensional model and implications for the North Atlantic nitrogen budget. Global Biogeochem. Cycles 20, Gb3007. doi: 10.1029/2005GB002456
Fogel M., Aguilar C., Cuhel R., Hollander D., Willey J., Paerl H. (1999). Biological and isotopic changes in coastal waters induced by Hurricane Gordon. Limnol Oceanogr 44, 1359–1369. doi: 10.4319/lo.1999.44.6.1359
Gierach M. M., Subrahmanyam B. (2008). Biophysical responses of the upper ocean to major Gulf of Mexico hurricanes in 2005. J. Geophys. Res. Oceans 113, C04029. doi: 10.1029/2007JC004419
Guo Y., Rong Z., Li B., Xu Z., Li P., Li X. (2019). Physical processes causing the formation of hypoxia off the Changjiang estuary after Typhoon Chan-hom 2015. J. Oceanology Limnology 37, 1–17. doi: 10.1007/s00343-019-7336-5
He Y., Zhang P., Xu F., Zhao L and Zhang J. (2023). Seasonal nutrients variation, eutrophication pattern, and Chlorophyll a response adjacent to Guangdong coastal water, China. Front. Mar. Sci. 10. doi: 10.3389/fmars.2023.1236609
Holland G. J., Webster P. J. (2007). Heightened tropical cyclone activity in the North Atlantic: natural variability or climate trend? Philos. Trans. R. Soc. a-Mathematical Phys. Eng. Sci. 365, 2695–2716. doi: 10.1098/rsta.2007.2083
Jalil A., Li Y., Du W., Wang W., Wang J., Gao X., et al. (2018). The role of wind field induced flow velocities in destratification and hypoxia reduction at Meiling Bay of large shallow Lake Taihu, China. Environ. Pollut. 232, 591–602. doi: 10.1016/j.envpol.2017.09.095
Lao Q., Chen F., Jin G., Lu X., Chen C., Zhou X., et al. (2023c). Characteristics and mechanisms of typhoon-induced decomposition of organic matter and its implication for climate change. J. Geophys. Res. Biogeosci. 128, e2023JG007518. doi: 10.1029/2023JG007518
Lao Q., Lu X., Chen F., Chen C., Jin G., Zhu Q. (2023b). A comparative study on source of water masses and nutrient supply in Zhanjiang Bay during the normal summer, rainstorm, and typhoon periods: Insights from dual water isotopes. Sci. Total Environ. 903, 166853. doi: 10.1016/j.scitotenv.2023.166853
Lao Q., Lu X., Chen F., Jin G., Chen C., Zhou X., et al. (2023a). Effects of upwelling and runoff on water mass mixing and nutrient supply induced by typhoons: insight from dual water isotopes tracing. Limnol. Oceanogr. 68, 284–295. doi: 10.1002/lno.12266
Lau K. M., Zhou Y. P., Wu H. T. (2008). ). Have tropical cyclones been feeding more extreme rainfall? J. Geophys. Res. 113, D23113. doi: 10.1029/2008JD009963
Laurent A., Fennel K., Cai W.-J., Huang W.-J., Barbero L., Wanninkhof R. (2017). Eutrophication-induced acidification of coastal waters in the northern Gulf of Mexico: Insights into origin and processes from a coupled physical-biogeochemical model. Geophysical Res. Lett. 44, 946–956. doi: 10.1002/2016GL071881
Levin L. A., Breitburg D. (2015). Linking coasts and seas to address ocean deoxygenation. Nat. Climate Change 5, 401–403. doi: 10.1038/nclimate2595
Lévy M., Lengaigne M., Bopp L., Vincent E. M., Madec G., Éthé C., et al. (2012). Contribution of tropical cyclones to the air-sea CO2 flux: A global view. Global Biogeochem. Cycles 26, GB2001. doi: 10.1029/2011GB004145
Li D., Chen J. F., Ni X., Wang K., Zeng D., Wang B., et al. (2019). Hypoxic bottom waters as a carbon source to atmosphere during a typhoon passage over the East China Sea. Geophys. Res. Lett. 46 (11), 329–11,337. doi: 10.1029/2019GL083933
Li Y., Yang D., Xu L., Gao G., He Z., Cui X., et al. (2022). Three types of typhooninduced upwellings enhance coastal algal blooms: a case study. J. Geophys. Res. Oceans 127, e2022JC018448. doi: 10.1029/2022JC018448
Lin I. I. (2012). Typhoon-induced phytoplankton blooms and primary productivity increase in the western North Pacific subtropical ocean. J. Geophys. Res. Oceans 117, C03039. doi: 10.1029/2011JC007626
Lin I., Liu W. T., Wu C. C., Wong G. T., Hu C., Chen Z., et al. (2003). New evidence for enhanced ocean primary production triggered by tropical cyclone. Geophys. Res. Lett. 30, 1718. doi: 10.1029/2003GL017141
Liu Y., Chen Y., Gan M., Li J. (2018). Characteristics of intensity variation of tropical cyclones influenced China with relations of ENSO from 1951 to 2016. J. Appl. Oceanogr. 37, 301–312. doi: 10.3969/J.ISSN.095-4972.2018.03.001
Liu X., Wang M., Shi W. (2009). A study of a Hurricane Katrina induced phytoplankton bloom using satellite observations and model simulations. J. Geophys. Res. 114, C03023. doi: 10.1029/2008JC004934
Lu X., Zhou X., Jin G., Chen F., Zhang S., Li Z., et al. (2022). Biological impact of Typhoon Wipha in the coastal area of western Guangdong: a comparative field observation perspective. J. Geophys. Res. Biogeosci. 127, (2). doi: 10.1029/2021JG006589
Mann M. E., Sabbatelli T. A., Neu U. (2007). Evidence for a modest undercount bias in early historical Atlantic tropical cyclone counts. Geophys. Res. Lett. 34, L22707. doi: 10.1029/2007GL031781
Meng Q., Zhou F., Ma X., Xuan J., Zhang H., Wang S., et al. (2022). Response process of coastal hypoxia to a passing typhoon in the east China sea. Front. Mar. Sci. 9. doi: 10.3389/fmars.2022.892797
Miller W. D., Harding L. W., Adolf J. E. (2006). Hurricane Isabel generated an unusual fall bloom in Chesapeake Bay. Geophys. Res. Lett. 33, L06612. doi: 10.1029/2005GL025658
Murphy R. R., Kemp W. M., Ball W. P. (2011). ). Long-term trends in chesapeake bay seasonal hypoxia, stratification, and nutrient loading. Estuaries Coasts 34, 1293–1309. doi: 10.1007/s12237-011-9413-7
Ni X., Huang D., Zeng D., Zhang T., Li H., Chen J. (2016). The impact of wind mixing on the variation of bottom dissolved oxygen off the Changjiang Estuary during summer. J. Mar. Syst. 154, 122–130. doi: 10.1016/j.jmarsys.2014.11.010
Paerl H. W., Crosswell J. R., Van Dam B., Hall N. S., Rossignol K. L., Osburn C. L., et al. (2018). Two decades of tropical cyclone impacts on North Carolina's estuarine carbon, nutrient and phytoplankton dynamics: Implications for biogeochemical cycling and water quality in a stormier world. Biogeochemistry 141, 307–332. doi: 10.1007/s10533-018-0438-x
Pan S., Shi J., Gao H., Guo X., Yao X., Gong X. (2017). Contributions of physical and biogeochemical processes to phytoplankton biomass enhancement in the surface and subsurface layers during the passage of Typhoon Damrey. J. Geophys. Res. Biogeosci. 122, 212–229. doi: 10.1002/2016JG003331
Pun I.-F., Hsu H.-H., Moon I.-J., Lin I-I., Jeong J-Y. (2023). Marine heatwave as a supercharger for the strongest typhoon in the East China Sea. NPJ Climate Atmospheric Sci. 6 (6), 128. doi: 10.1038/s41612-023-00449-5
Qian W., Dai M., Xu M., Kao S.-j., Du C., Liu J., et al. (2017). Non-local drivers of the summer hypoxia in the East China Sea off the Changjiang Estuary. Estuar. Coast. Shelf Sci. 198, 393–399. doi: 10.1016/j.ecss.2016.08.032
Qiu D., Zhong Y., Chen Y., Tan Y., Song X., Huang L. (2019). Short-term phytoplankton dynamics during typhoon season in and near the pearl river estuary, south China sea. J. Geophys. Res. Biogeosci. 124, 274–292. doi: 10.1029/2018JG004672
Rabalais N. N., Diaz R. J., Levin L. A., Turner R. E., Gilbert D., Zhang J. (2010). Dynamics and distribution of natural and human-caused hypoxia. Biogeosciences 7, 585–619. doi: 10.5194/bg-7-585-2010
Rabalais N. N., Turner R. E., Wiseman W. J. (2002). Gulf of Mexico hypoxia, aka "The dead zone". Annu. Rev. Ecol. Syst. 33, 235–263. doi: 10.1146/annurev.ecolsys.33.010802.150513
Rabouille C., Conley D. J., Dai M. H., Cai W. J., Chen C. T. A., Lansard B., et al. (2008). Comparison of hypoxia among four river-dominated ocean margins: The Changjiang (Yangtze), Mississippi, Pearl, and Rhone rivers. Continental Shelf Res. 28, 1527–1537. doi: 10.1016/j.csr.2008.01.020
Robarts R. D., Waiser M. J., Hadas O., Zoharyand T., Macintyre S. (1998). Relaxation of phosphorus limitation due to typhoon-induced mixing in two morphologically distinct basins of Lake Biwa, Japan. Limnol. Oceanogr. 43, 1023–1036. doi: 10.4319/lo.1998.43.6.1023
Ryu J. H., Choi J. K., Eom J., Ahn J. H. (2011). Temporal variation in Korean coastal waters using Geostationary Ocean Color Imager. J. Coast. Res. 64, 1731–1735.
Schmidtko S., Stramma L., Visbeck M. (2017). Decline in global oceanic oxygen content during the past five decades. Nature 542, 335. doi: 10.1038/nature21399
Shchepetkin A. F., McWilliams J. C. (2005). The regional oceanic modeling system (ROMS): a split-explicit, free-surface, topography-following-coordinate oceanic model. Ocean Model. 9, 347–404. doi: 10.1016/j.ocemod.2004.08.002
Shropshire T., Li Y., He R., Dare R. A., McBride J. L. (2016). Storm impact of sea surface temperature and chlorophyll a in the Gulf of Mexico and Sargasso Sea based on daily cloud-free satellite data reconstructions. Geophys. Res. Lett. 43, 12199–12207. doi: 10.1002/2016GL071178
Stanley B. G., Christopher W. L., Alberto M. M., William M. G. (2001). The recent increase in Atlantic hurricane activity: causes and implications. Science. 293 (5529), 474–479. doi: 10.1126/science.1060040
Subrahmanyam B., Rao K. H., Rao N. S., Murty V. S. N., Sharp R. J. (2002). Influence of a tropical cyclone on chlorophyll a concentration in the Arabian Sea. Geophys. Res. Lett. 29, 2051–2054. doi: 10.1029/2002GL015892
Tsuchiya K., Yoshiki T., Nakajima R., Miyagushi H., Kuwahara V. S., Taguchi S., et al. (2013). Typhoon-driven variations in primary production and phytoplankton assemblages in Sagami Bay, Japan: a case study of typhoon. Mawar (T0511). Plankton Benthos Res. 8, 74–87. doi: 10.3800/pbr.8.74
Walker N. D., Leben R. R., Balasubramanian S. (2005). Hurricane-forced upwelling and chlorophyll a enhancement within cold-core cyclones in the Gulf of Mexico. Geophys Res. Lett. 32, L18610. doi: 10.1029/2005GL023716
Wang M., Ahn J.-H., Jiang L., Shi W., Son S., Park Y.-J., et al. (2013). Ocean color products from the Korean Geostationary Ocean Color Imager (GOCI). Optics Express 21, 3835–3849. doi: 10.1364/OE.21.003835
Wang B., Chen J., Jin H., Li H., Huang D., Cai W.-J. (2017). Diatom bloom-derived bottom water hypoxia off the Changjiang estuary, with and without typhoon influence. Limnol. Oceanogr. 62, 1552–1569. doi: 10.1002/lno.10517
Wang Y., Xiu P. (2022). Typhoon footprints on ocean surface temperature and chlorophyll-a in the South China Sea. Sci. Total Environ. 840, 156686. doi: 10.1016/j.scitotenv.2022.156686
Wang T., Zhang S. (2021). Effect of summer typhoon linfa on the chlorophyll-a concentration in the continental shelf region of northern South China Sea. J. Mar. Sci. Eng. 9, 794. doi: 10.3390/jmse9080794
Webster P. J., Holland G. J., Curry J. A., Chang H. R. (2005). Changes in tropical cyclone number, duration, and intensity in a warming environment. Science 309, 1844–1846. doi: 10.1126/science.1116448
Wei Q., Wang B., Chen J., Xia C., Qu D., Xie L. (2015). Recognition on the forming-vanishing process and underlying mechanisms of the hypoxia off the Yangtze River estuary. Sci. China Earth Sci. 58, 628–648. doi: 10.1007/s11430-014-5007-0
Wei Q., Yu Z., Wang B., Wu H., Sun J., Zhang X., et al. (2017). Offshore detachment of the Changjiang River plume and its ecological impacts in summer. J. Oceanogr. 73, 277–294. doi: 10.1007/s10872-016-0402-0
Weinke A. D., Biddanda B. A. (2019). ). Influence of episodic wind events on thermal stratification and bottom water hypoxia in a Great Lakes estuary. J. Great Lakes Res. 45, 1103–1112. doi: 10.1016/j.jglr.2019.09.025
Wu L. G., Wang B., Geng S. Q. (2005). ). Growing typhoon influence on east Asia. Geophys. Res. Lett. 32, L18703. doi: 10.1029/2005GL022937
Wu R., Wu S., Chen T., Yang Q., Han B., Zhang H. (2021). Effects of wave-current interaction on the eastern China coastal waters during super typhoon lekima, (2019). J. Phys. Oceanogr. 51, 1611–1636. doi: 10.1175/JPO-D-20-0224.1
Xia M., Jiang L. (2015). Influence of wind and river discharge on the hypoxia in a shallow bay. Ocean Dyn. 65, 665–678. doi: 10.1007/s10236-015-0826-x
Yang Y., Ying M., Baode C. (2009). The climatic changes of landfall tropical cyclones in China over the past 58 years. Acta Meteorologica Sin. 67, 689–696.
Ye H. J., Sui Y., Tang D. L., Afanasyev Y. D. (2013). A subsurface chlorophyll a bloom induced by typhoon in the South China Sea. J. Mar. Syst. 128, 138–145. doi: 10.1016/j.jmarsys.2013.04.010
Yin X., Wang Z., Liu Y., Xu Y. (2007). Ocean response to typhoon ketsana traveling over the northwest Pacific and a numerical model approach. Geophys. Res. Lett. 34, L21606. doi: 10.1029/2007GL031477
Yin Y., Xiao F., Luo Y., Zhao S. (2011). Study on tropical cyclone potential impact index in China. Acta Geogr. Sin. 66 (3), 367–375.
Zhang Z. W. (2020). Response mechanism of diluted water expansion in Yangtze River under typhoon weather. East China Normal University, Shanghai. doi: 10.27149/d.cnki.ghdsu.2020.000358
Zhang W. (2022). Unexpected high indirect impacts of riverine organic matter to coastal deoxygenation. Water Res. 225, 119180. doi: 10.1016/j.watres.2022.119180
Zhang W., Dunne J. P., Wu H., Zhou F., Huang D. (2022). Using timescales of deficit and residence to evaluate near-bottom dissolved oxygen variation in coastal seas. J. Geophys. Res. Biogeosci. 127 (1), e2021JG006408. doi: 10.1029/2021JG006408
Zhang W., Moriarty J. M., Wu H., Feng Y. (2021). Response of bottom hypoxia off the Changjiang River Estuary to multiple factors: A numerical study. Ocean Model. 159, 101751. doi: 10.1016/j.ocemod.2021.101751
Zhang W., Wu H., Hetland R. D., Zhu Z. (2019). On mechanisms controlling the seasonal hypoxia hot spots off the changjiang river estuary. J. Geophys. Res. Oceans 124, 8683–8700. doi: 10.1029/2019JC015322
Zhang W., Wu H., Zhu Z. (2018). Transient hypoxia extent off changjiang river estuary due to mobile changjiang river plume. J. Geophys. Res. Oceans 123, 9196–9211. doi: 10.1029/2018JC014596
Zhao H., Shao J., Han G., Yang D., Lv J. (2015). Influence of typhoon Matsa on phytoplankton chlorophyll-a off east China. PloS One 10, e0137863. doi: 10.1371/journal.pone.0137863
Zhao H., Tang D., Wang D. (2009). Phytoplankton blooms near the Pearl River Estuary induced by Typhoon Nuri. J. Geophys. Res. Oceans 114, C12027. doi: 10.1029/2009JC005384
Zhao Y., Uthaipan K., Lu Z., Li Y., Liu J., Liu H., et al. (2021). Destruction and reinstatement of coastal hypoxia in the South China Sea off the Pearl River estuary. Biogeosciences 18, 2755–2775. doi: 10.5194/bg-18-2755-2021
Zheng J., Gao S., Liu G., Wang H., Zhu X. (2016). Modeling the impact of river discharge and wind on the hypoxia off Yangtze Estuary. Natural Hazards Earth System Sci. 16, 2559–2576. doi: 10.5194/nhess-16-2559-2016
Zheng G. M., Tang D. (2007). Offshore and nearshore chlorophyll increases induced by typhoon winds and subsequent terrestrial rainwater runoff. Mar. Ecol. Prog. Ser. 333, 61–74. doi: 10.3354/meps333061
Keywords: coastal hypoxia, Changjiang estuary, typhoon, primary production, dissolved oxygen budget
Citation: Yang W, Wu H and Zhang W (2024) Effects of typhoons on primary production and dissolved oxygen in the East China Sea. Front. Mar. Sci. 11:1376432. doi: 10.3389/fmars.2024.1376432
Received: 25 January 2024; Accepted: 11 March 2024;
Published: 22 March 2024.
Edited by:
Chung-Chi Chen, National Taiwan Normal University, TaiwanReviewed by:
Yang Ding, Ocean University of China, ChinaFajin Chen, Guangdong Ocean University, China
Teng-Chiu Lin, National Taiwan Normal University, Taiwan
Copyright © 2024 Yang, Wu and Zhang. This is an open-access article distributed under the terms of the Creative Commons Attribution License (CC BY). The use, distribution or reproduction in other forums is permitted, provided the original author(s) and the copyright owner(s) are credited and that the original publication in this journal is cited, in accordance with accepted academic practice. No use, distribution or reproduction is permitted which does not comply with these terms.
*Correspondence: Wenxia Zhang, wenxiazhang1986@126.com; zhangwx@sio.org.cn