Sr/Ca in shells of laboratory-grown bivalves (Arctica islandica) serves as a proxy for water temperature – implications for (paleo)environmental research?
 Cornélia Brosset1*
  Nils Höche1
  Rob Witbaard2
  Kozue Nishida3
  Kotaro Shirai4
  Regina Mertz-Kraus1
  Bernd R. Schöne1*
- 1Institute of Geosciences, University of Mainz, Mainz, Germany
- 2Department of Estuarine and Delta Systems, Royal Netherlands Institute for Sea Research, Yerseke, Netherlands
- 3Graduate School of Life and Environmental Sciences, University of Tsukuba, Tsukuba, Japan
- 4Atmosphere and Ocean Research Institute, The University of Tokyo, Chiba, Japan
Seawater temperature is an essential quantity for paleoclimatological and paleoecological studies. A potential archive that can provide century-long, temporally well-constrained and high-resolution temperature proxy data is available in the form of bivalve shells. However, the number of well-accepted and robust temperature proxies contained in shells is limited to stable oxygen isotopes and carbonate clumped isotopes. Many studies have therefore investigated the possibility to reconstruct temperature from element/Ca properties, specifically Sr/Ca ratios in case of aragonitic shells. As demonstrated here, in agreement with thermodynamic expectations and the lattice strain model, shell Sr/Ca of laboratory-grown Arctica islandica specimens is strongly positively coupled to water temperature. If ultrastructure-related bias is mathematically eliminated, up to 75% of the variability in shell Sr/Ca data can be explained by water temperature. However, in field-grown specimens, this relationship is superimposed by other environmental variables that can hardly be quantified and mathematically eliminated. The explained variability of Sr/Ca is reduced to merely 26% and the prediction uncertainty too large for reliable temperature estimates. Most likely, the equable, less biased conditions in the laboratory resulted in the production of a more uniform shell ultrastructure (with larger and more elongated biomineral units) which in turn was associated with less variable Sr/Ca values and a stronger link to water temperature. Without a detailed understanding and quantification of the factors controlling ultrastructural variations in field-grown bivalves, it remains impossible to employ shell Sr/Ca of wild A. islandica specimens for precise temperature estimates, merely a qualitative temperature reconstruction seems feasible.
1 Introduction
Ocean temperature is a crucial quantity in paleoclimatological and paleoecological research. Amongst other aspects, seasonally to annually resolved and temporally well-constrained temperature data are needed to verify and refine numerical climate models (Schmidt et al., 2014; Cauquoin et al., 2019), understand biogeographic distribution patterns (Adey and Steneck, 2001; Zacherl et al., 2003; Belanger et al., 2012) and assess the impact of short-term temperature changes on biota, specifically in coastal nearshore environments (Goberville et al., 2010; Węsławski et al., 2011). Potential archives that provide such data include shells of bivalve mollusks (Wanamaker et al., 2012; Butler et al., 2013; Lohmann and Schöne, 2013; Black et al., 2016). Bivalves are often abundant and sometimes well-preserved in the fossil record, extending their potential use back in time. They are widely distributed globally and some species such as the ocean quahog, Arctica islandica, can live for several hundred years (Schöne et al., 2005; Wanamaker et al., 2008a; Butler et al., 2013). More importantly, they record changes of ambient environmental conditions in their shells in precise chronological order (Jones, 1981; Witbaard et al., 1994; Schöne et al., 2005; Wanamaker et al., 2012; Wanamaker et al., 2019; Schöne et al., 2023). This environmental record is also spatially well-constrained, because bivalves are sessile organisms, compared to data extracted from mobile or migrating animals, e.g., fish (Schöne and Krause, 2016). However, extracting quantitative temperature data from bivalve shells remains a challenging task for a variety of reasons.
Due to known limitations of δ18O and Δ47-based temperature estimates (Witbaard et al., 1994; Eiler, 2011; De Winter et al., 2022), repeated attempts have been undertaken to explore the potential use of element/Ca ratios as paleothermometers, especially Sr/Ca values in aragonitic shells (Surge and Walker, 2006; Foster et al., 2009; Schöne et al., 2011; Schöne et al., 2013; Schöne et al., 2023) and Mg/Ca in calcitic shells (e.g., Wanamaker et al., 2008b; Tynan et al., 2017). Unlike δ18O, these element/Ca values are assumed to be fairly stable in marine waters (above a salinity of approx. 10; Dodd and Crisp, 1982) through time and space and can thus be assumed constant in paleothermometry equations. Furthermore, with in-situ analytical techniques (e.g., LA-ICP-MS), element/Ca data can be measured quickly, precisely and at very high spatial resolution. While Sr/Ca and Mg/Ca values are routinely used in many non-molluscan biogenic carbonates to reconstruct temperature histories (Beck et al., 1992; Rosenheim et al., 2004; Corrège, 2006), their use in bivalve shells (Dodd, 1965; Stecher et al., 1996; Zhao et al., 2017) is controversially debated, even in the same species. Reports on A. islandica range from positive (Hart and Blusztajn, 1998; Toland et al., 2000; Brosset et al., 2022) to negative (Schöne et al., 2013; Yan et al., 2013) to no correlation (Wanamaker and Gillikin, 2019) between shell Sr/Ca or Mg/Ca and temperature. Partly, these controversial findings are related to the experimental design, e.g., averaging Sr/Ca data from very slow and fast-growing shell portions, growth lines and growth increments, respectively (Schöne et al., 2013). Even if there was a relationship between shell Sr/Ca and temperature, the correlation remained low (ca. R² < 0.30). Only a single study explored this relationship in laboratory-grown A. islandica specimens, but merely at two different temperature regimes and without studying the underlying shell ultrastructure (Wanamaker and Gillikin, 2019).
As with most other trace and minor elements, the incorporation of Sr and Mg into bivalve shells is reported to be strongly controlled by vital and/or kinetic effects (e.g., Foster et al., 2009), possibly to maintain certain mechanical properties of the shell. As a result, their concentration typically remains well below values observed in abiogenic aragonite and scleractinian corals (Gaetani and Cohen, 2006), and their temperature sensitivity (= the slope of the regression curve between shell Sr/Ca or Mg/Ca and temperature) often deviates from that of abiogenic aragonite (compare, e.g., Gaetani and Cohen, 2006 with Schöne et al., 2013). Furthermore, a strong coupling with growth rate (Stecher et al., 1996; Gillikin et al., 2005), ontogenetic age (Freitas et al., 2005; Schöne et al., 2011; Schöne et al., 2023) and shell ultrastructure (Shirai et al., 2008; Foster et al., 2009; Schöne et al., 2013; Füllenbach et al., 2017; Roger et al., 2017) has been reported. For example, in annual growth lines of Arctica islandica which consist of irregular simple/spherulitic prismatic (ISP) ultrastructure (Ropes, 1984), the Sr concentration is much higher than in the annual increments, i.e., the fast-growing portions between adjacent growth lines (Schöne et al., 2013). In the outer portion of the outer shell layer (oOSL), annual growth increments consist predominantly of homogeneous (HOM) ultrastructure, whereas in the inner portion of the outer shell layer (iOSL) crossed-acicular (CA) and fine-complex crossed-lamellar ultrastructures prevail (Ropes, 1984). As recently demonstrated (Brosset et al., 2022), the shell Sr/Ca values in annual increments (reflecting the main growing season) of juvenile field-grown A. islandica specimens from NE Iceland are weakly positively correlated to water temperature. After mathematical elimination of growth rate and/or ultrastructure-related bias, only a slightly stronger positive correlation was observed implying that other environmental variables exert a strong control on shell Sr/Ca (Brosset et al., 2022). Notably, the positive relationship between Sr/Ca and temperature differs from such found in synthetic aragonite and scleractinian corals (negative correlation) but agrees with thermodynamic expectations and the lattice strain model (Gaetani and Cohen, 2006).
The present study explores whether juvenile A. islandica specimens record water temperature in shell Sr/Ca values if grown in laboratory tanks under controlled conditions, largely devoid of environmental disturbances. Furthermore, by comparison to data of conspecific specimens grown in the field, the potential use of shell Sr/Ca as a paleothermometer is evaluated. The following hypotheses were tested. (i) After mathematical correction for shell growth rate and ultrastructural biases, shell Sr/Ca values of specimens raised under controlled conditions in laboratory tanks are more strongly correlated to water temperature and show a stronger temperature sensitivity than specimens grown in the field. (ii) The uniformity of shell ultrastructure in tank-grown specimens is expected to facilitate the analysis of the Sr/Ca-temperature relationship. Results of this study have implications for future paleotemperature estimates based on molar Sr/Ca ratios of bivalve shells.
2 Materials and methods
2.1 Sample collection and experimental conditions
For the present work, shells of twenty-one juvenile specimens of Arctica islandica of two laboratory growth experiments were used (Witbaard et al., 1997; Beirne et al., 2012) (Table 1). All bivalves were raised in tanks under controlled temperature regimes. Some of the material of Beirne et al. (2012) was also analyzed by Wanamaker and Gillikin (2019) for element chemical properties and growth rate, whereas specimens of Witbaard et al. (1997) were used by Höche et al. (2021) largely for the ultrastructure analysis in the hinge portion of the shells (which differs from such in the ventral margin).
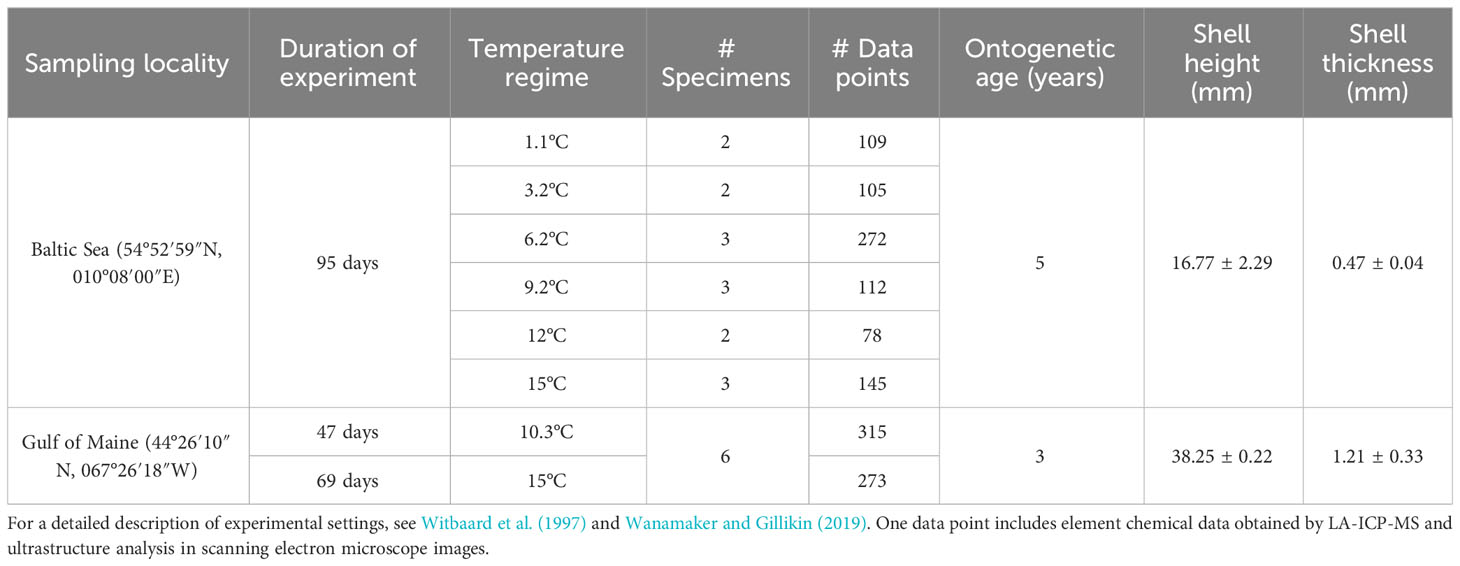
Table 1 Overview of laboratory-grown specimens of Arctica islandica used in the present study.
Fifteen specimens employed in the studies by Witbaard et al. (1997) and Höche et al. (2021) were collected at 20 m water depth in the western Baltic Sea, Germany (Table 1). After a one-month acclimatization to fully marine conditions in laboratory tanks at Texel, The Netherlands, bivalves were allowed to grow for 95 days in a total of six tanks under stable temperatures, with aerated and filtered seawater regularly replaced. The six stable temperature regimes used for culturing were 1.1, 3.2, 6.2, 9.2, 12°C and 15°C (for details on the experimental conditions, see Witbaard et al., 1997; note that the experiment conducted at 15°C was not reported in their study, but culturing conditions were identical). Two to three bivalves were selected for this study from the nine specimens cultured in each tank with ad libitum food composed of a phytoplankton mixture of Isochrysis galbana and Dunaliella marina.
Six additional specimens came from 82 m water depth in the Gulf of Maine (Beirne et al., 2012). Bivalves were then transported to the Darling Marine Center (University of Maine, Orono) in Walpole, Maine and exposed to ambient temperature, food, and salinity (Beirne et al., 2012). After ca. 1.5 years, the specimens were raised in a muddy estuarine sediment with ambient seawater under stable temperature conditions of 10.3 ± 0.2°C for 47 days, followed by another 69 days at 15 ± 0.3°C (for details, see Beirne et al., 2012 and Wanamaker and Gillikin, 2019).
2.2 Sample preparation
After the experiments, all specimens were shucked, and their shells rinsed with tap water. The right valves of the Baltic Sea (BS) specimens and the left valves of the Gulf of Maine (GOM) shells were mounted on acrylic glass cubes using a plastic welder (WIKO Multi Power 3). The subsequent preparation was done in accordance with methods described in Höche et al. (2022). Briefly, a protective layer of metal epoxy resin (WIKO 05) was applied to the shell surfaces along the planned cutting axis. From each valve, two approx. 2.5 mm thick sections were cut along the maximum growth using a low-speed saw (Buehler IsoMet 1000) operated at 200 rpm. The saw was equipped with a 0.4 mm diamond-coated blade. As shells from the Baltic Sea specimens were very thin (approx. 0.5 mm), the cross-sectioned slabs were embedded in epoxy resin (Araldite 2020) to avoid damage during the cutting process. Furthermore, the epoxy was mixed with a conductive filler (Buehler 20–8500) for subsequent scanning electron microscopic (SEM) analysis. All sections were then ground with F800 and F1200 SiC suspensions on glass plates, and polished using Al2O3 suspension (1 µm grain size) on a Buehler MasterTex cloth. Between each grinding and polishing step specimens were ultrasonically cleaned in tap water. Once dried from air, one slab of each specimen was attached with a carbon sticker to a one-inch sample holder for SEM analysis. The mirroring section was glued to a glass slide used for in-situ trace element analysis by laser ablation inductively coupled plasma mass spectrometry (LA-ICP-MS).
2.3 In-situ chemical analysis (LA-ICP-MS)
The trace element analysis of the shells of the laboratory-grown specimens was done by LA-ICP-MS at the Institute of Geosciences, University of Mainz, following the same method and settings used in Brosset et al. (2022) for field-grown specimens. Briefly, the system consisted of a 193 nm ArF Eximer laser (ESI NWR 193; repetition rate = 10 Hz; energy density = approx. 3 J/cm²) equipped with a TwoVol2 ablation cell, coupled to a quadrupole inductively coupled plasma mass spectrometer (Agilent 7500ce). The laser spots (n = 1,409; 60 µm diameter) were placed 90 µm apart (center to center). In each of the two sublayers (outer, inner) of the outer shell layer (oOSL, iOSL) of the ventral margin, one transect of LA spots was placed parallel to the main growth axis (Figure 1). Strontium concentration in the shells was monitored using the 88Sr intensity. Data were reduced using an in-house software program following the calculations of Longerich et al. (1996) and Jochum et al. (2011). NIST SRM 610 and NIST SRM 612 were used for calibration, and USGS MACS-3, BCR-2G, JCp-1 and JCt-1 as quality control materials, with the preferred values given in the GeoReM database (available at http://georem.mpch-mainz.gwdg.de, ver. 34, last access: 16 Dec. 2022; Jochum et al., 2005; Jochum et al., 2012; Table S1). The element concentrations determined for the quality control materials were in the range of published values, and average detection limit (3σbackground, Jochum et al., 2012) and element-specific Relative Standard Deviation (RSD%) values are shown in Table S1. Data from the reference materials and bivalve shells were normalized using 43Ca as internal standard, and molar Sr/Ca ratios were calculated from Sr concentrations using a shell calcium content of 380,000 µg/g (Marali et al., 2017).
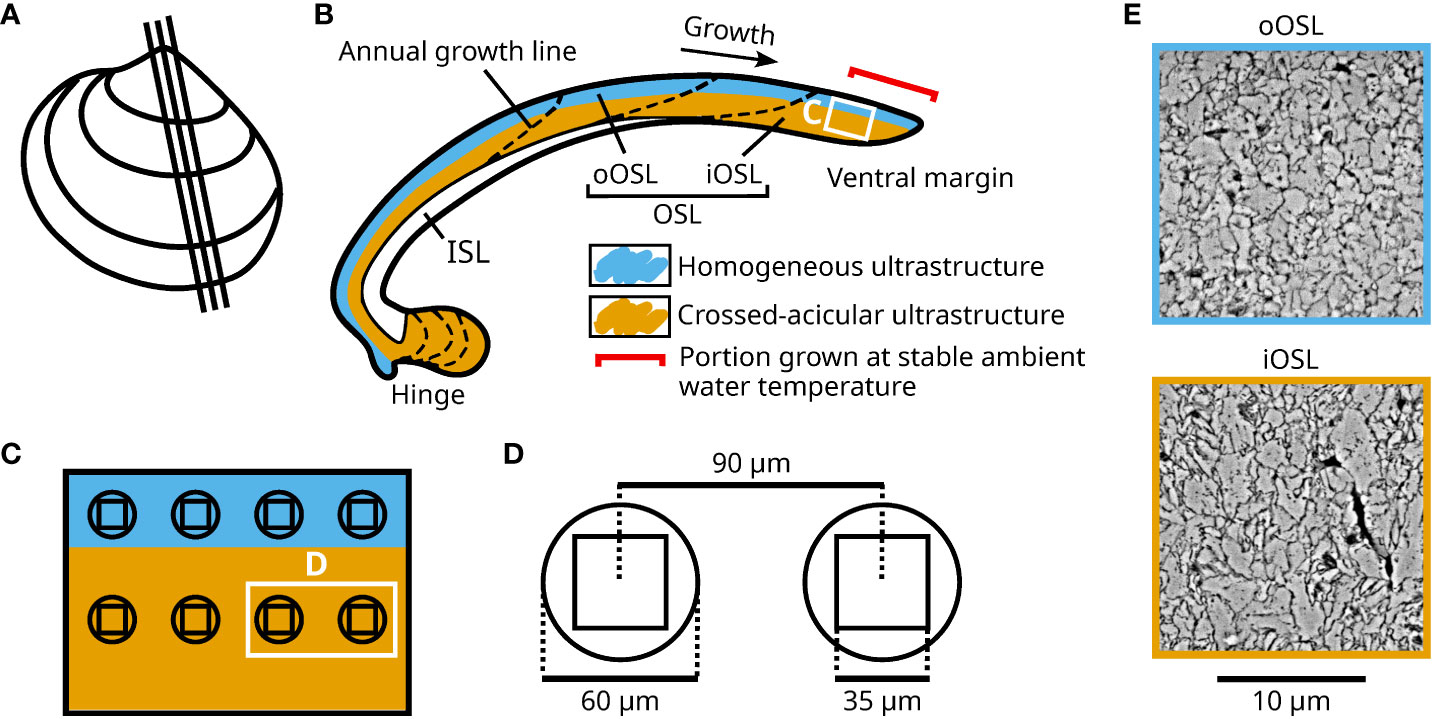
Figure 1 Overview of the sampling positions for ultrastructural and in-situ element chemical analyses in shells of Arctica islandica specimens cultured at 1.1, 3.2, 6.2, 9.2, 10.3, 12 and 15°C. (A) Depiction of a left valve from a cultured specimen illustrating the cutting axes of the studied shell. (B) Schematic representation of a shell slab. The shell is divided into an inner and outer shell layer (ISL, OSL), separated by the myostracum. The outer portion of the OSL (oOSL) primarily consists of homogeneous ultrastructure (blue), while crossed-acicular ultrastructure (orange) dominates in the inner portion of the OSL (iOSL). The portion of the shell grown during the experimental interval is indicated by the red bracket. (C) Enlargement of panel (B) showing the sampling positions for LA-ICP-MS and SEM for the two shell sections analyzed for every specimen. (D) Enlarged schematic representation of the SEM images (35 µm²) compared to the laser spots (60 µm diameter, 90 µm between LA centers) depicted in panel (C). (E) Example of SEM image obtained in the oOSL and the iOSL. The scale applies to both images.
2.4 Ultrastructure morphometry
The other polished cross-section of each specimen was used for ultrastructural properties analysis by means of SEM, following the method reported by Höche et al. (2022). An ultrafine chemo-mechanical polishing, i.e., superficial oxidation of the inter-crystalline organics and smoothing of the carbonate phase, was performed on the cross-sections to better distinguish individual biomineral units (BMUs). Accordingly, the shell slabs were polished for ca. 10 min with a 60 nm suspension (Buehler MasterMet, pH ca. 10.1) on a Buehler MasterTex polishing cloth mounted on a rotational lap (Buehler MetaServ 2000; 50 rpm).
For direct comparison of the Sr/Ca data with the ultrastructural properties, both sections of each specimen were photographed with a digital camera under a light microscope with reflective illumination (Leica Stemi 508), and images were stitched together using the open-source software Hugin (available at https://sourceforge.net/projects/hugin/, last access: 19 Jul. 2023). In each specimen, the width of the portion grown in the laboratory was measured along the maximum growth axis, and the shell daily growth rates were approximated assuming a constant shell growth during the respective experimental intervals (for details on laboratory-grown sections identification, see Beirne et al., 2012 and Höche et al., 2021). The BigWarp tool (Fiji built-in BigDataViewer plugin available at https://imagej.net/software/fiji/, last access: 16 Dec. 2022) of the software ImageJ (Schindelin et al., 2012; Bogovic et al., 2016) was employed to align both sections of each specimen, and thus to align ultrastructure data to Sr/Ca data (Figure 1). To this avail, one SEM image (35 µm × 35 µm) was taken in corresponding shell portions in which the chemical measurements were completed. A 3rd generation Phenom Pro Desktop SEM equipped with a backscatter electron detector and a CeB6 electron source was used to take 1,409 SEM images at 7,700× magnification and 10keV.
Prior to morphometric analyses, individual BMUs were detected in the SEM photographs following the segmentation method depicted in Höche et al. (2021). Briefly, the machine learning software Ilastik (Berg et al., 2019) was trained to recognize individual BMUs on a sample set of the studied SEM images. Subsequently, all SEM images were processed semi-automatically. The quality of the segmentations was manually assessed, and the software training refined if necessary. Morphometrical parameters, including BMU area and BMU elongation (= ratio between the minor and major axes of an ellipse fitted to the BMU), were automatically measured using the scikit-image processing library (van der Walt et al., 2014) operated through a python script (Höche et al., 2021). For each experimental temperature regime and OSL sublayers, examples of BMU segmentations are depicted in Figures S1, S2. The 15% largest BMUs of each SEM image were considered for consecutive analysis. According to previous work, this threshold value reveals the highest BMU morphology variation and provides the strongest link between the size of individual BMUs in the shell of A. islandica and water temperature (Höche et al., 2021).
2.5 Statistical analysis and detrending of shell Sr/Ca and ultrastructure
To assess the mathematical correlation between water temperature and shell properties, shell growth rate, Sr/Ca, BMU area and BMU elongation data were plotted against temperature (section 3.1). Kruskal-Wallis (KW) rank tests were used to compare data between all temperature regimes, and Dunn tests (generalized Bonferroni adjustment for multiple comparisons; Table S2) were used to compare data between pairs of two temperature regimes. Data from the oOSL and the iOSL were compared using Mann-Whitney U (MWU) two-sample rank tests. At each temperature regime and for both shell sublayers (oOSL and iOSL), median values weighted for the number of studied specimens were calculated for Sr/Ca, BMU area and BMU elongation, and were used for the subsequent analyses.
To identify potential links between shell growth rate, ultrastructure and chemical properties that could have biased the temperature sensitivity of these shell properties, crossplots were generated between (i) growth rate and Sr/Ca, (ii) Sr/Ca and ultrastructural properties, and (iii) growth rate and ultrastructural properties (BMU area and elongation). Based on these crossplots, non-linear (natural logarithm) regression models were computed and subsequently used to detrend the chemical and ultrastructural data. For this purpose, predicted values given by these regression models were subtracted from the chemical and ultrastructural data, resulting in growth rate-detrended Sr/Ca data (dGRSr/Ca), BMU area-detrended Sr/Ca data (dARSr/Ca) as well as BMU elongation-detrended Sr/Ca data (dELSr/Ca) i.e., residuals for each of these parameters after detrending (section 3.2). Furthermore, Sr/Ca data were mathematically corrected for combinations of growth rate and BMU area (dGRARSr/Ca), growth rate and BMU elongation (dGRELSr/Ca), as well as growth rate, BMU area and elongation (dGRARELSr/Ca). Also, the correlation with growth rate was eliminated from ultrastructural properties (section 3.2) to obtain growth rate-detrended BMU area data (dGRAR) and growth rate-detrended BMU elongation data (dGREL).
All computations were done separately for each OSL sublayer (oOSL and iOSL; Tables 2, 3). As indicated by previous studies, A. islandica shell growth rate differs significantly between populations and sampling localities (e.g., Begum et al., 2010; Höche et al., 2022). Therefore, data detrending for shell growth-related effects was performed independently between BS and GOM specimens. All other calculations were done with data from BS and GOM combined. In order to achieve the best description of all detrended and undetrended data, linear regressions were computed between Sr/Ca and water temperature, whereas natural logarithms models were used between water temperature and shell ultrastructural properties, i.e., BMU area and elongation. Subsequently, these models were employed to compute temperature prediction intervals (1σ) based on detrended and undetrended shell Sr/Ca. These intervals were then compared with data gathered from field-grown A. islandica specimens from NE Iceland (Brosset et al., 2022). Alternatively, for all analyses, models using specimen-specific medians or non-weighted median values, as well as linear and/or natural logarithm detrending and regressions to water temperature for both experiments combined or exclusive to the Baltic Sea experiment, can be found in the online repository of the present study, i.e., in Brosset et al. (2023).
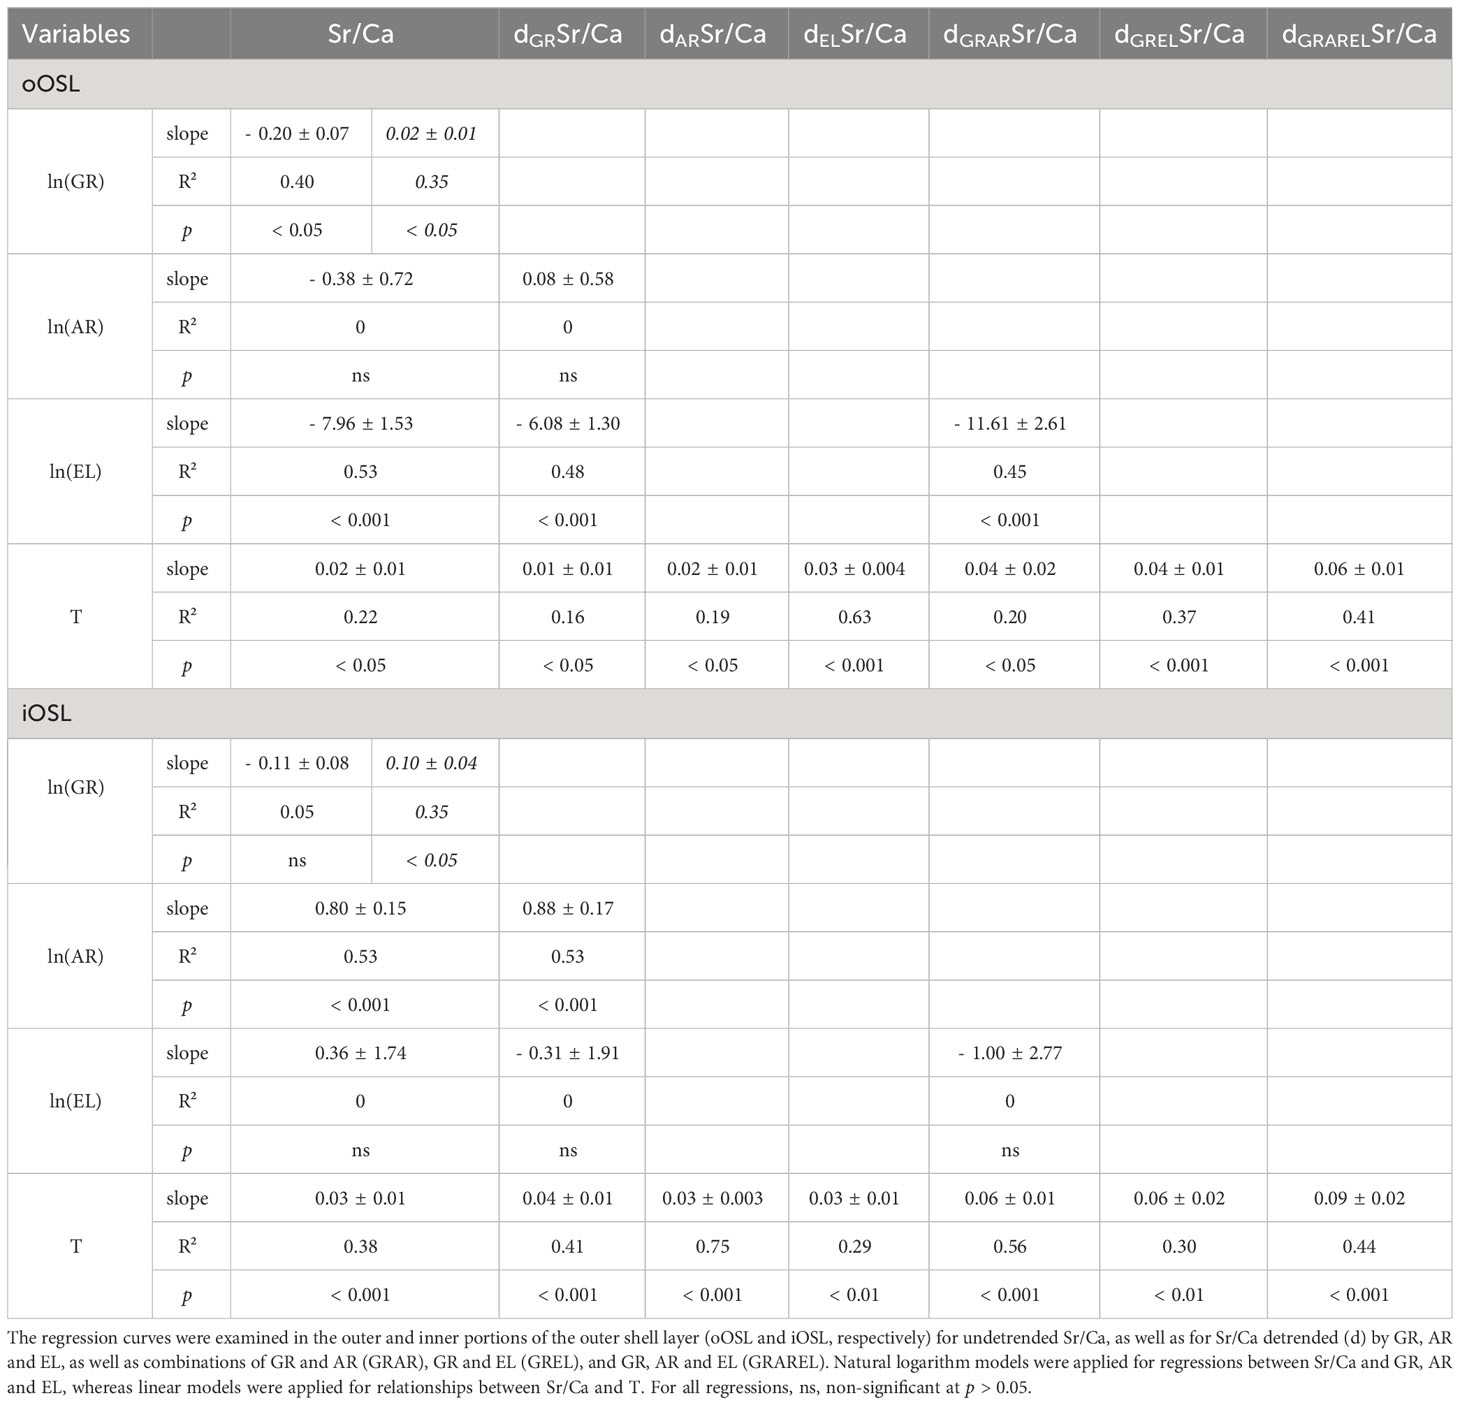
Table 2 Overview of the regression parameters (slope; R², coefficient of determination; p, probability) between shell Sr/Ca data of cultured Arctica islandica specimens and shell growth rate (GR; data from Baltic Sea and Gulf of Maine in regular and italic font, respectively), ultrastructural properties, i.e., area and elongation of the biomineral units (AR and EL, respectively), and temperature of the laboratory tanks (T).
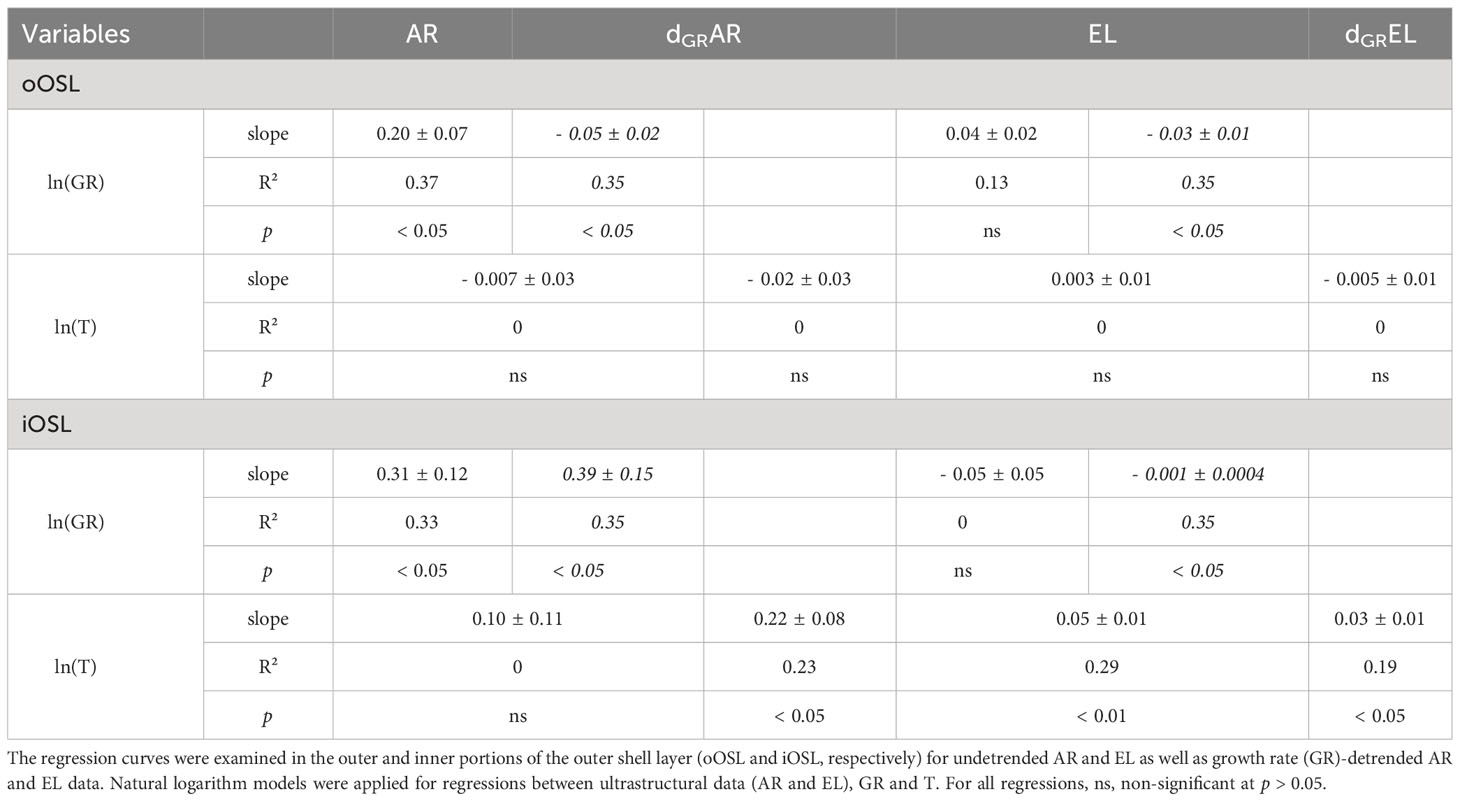
Table 3 Overview of the regression parameters (slope; R², coefficient of determination; p, probability) between shell ultrastructural properties of cultured Arctica islandica specimens, i.e., area and elongation of the biomineral units (AR and EL, respectively), shell growth rate (GR; data from Baltic Sea and Gulf of Maine in regular and italic font, respectively), and temperature of the laboratory tanks (T).
3 Results
A. islandica specimens from the Baltic Sea (BS) and the Gulf of Maine (GOM) differed in shell height, thickness and ontogenetic age (Table 1). GOM specimens were younger (3 years-old) than those originating from BS (5 years-old). However, shells from GOM were larger (average height: 38.25 ± 0.22 mm) and thicker (1.21 ± 0.33 mm) than those from BS (height = 16.77 ± 2.29 mm; thickness = 0.27 ± 0.04 mm, Table 1). Given these differences, shell growth rates were calculated separately for BS and GOM specimens (Figure 2A), and size differences were also considered when shell chemical and ultrastructural properties were compared with water temperature.
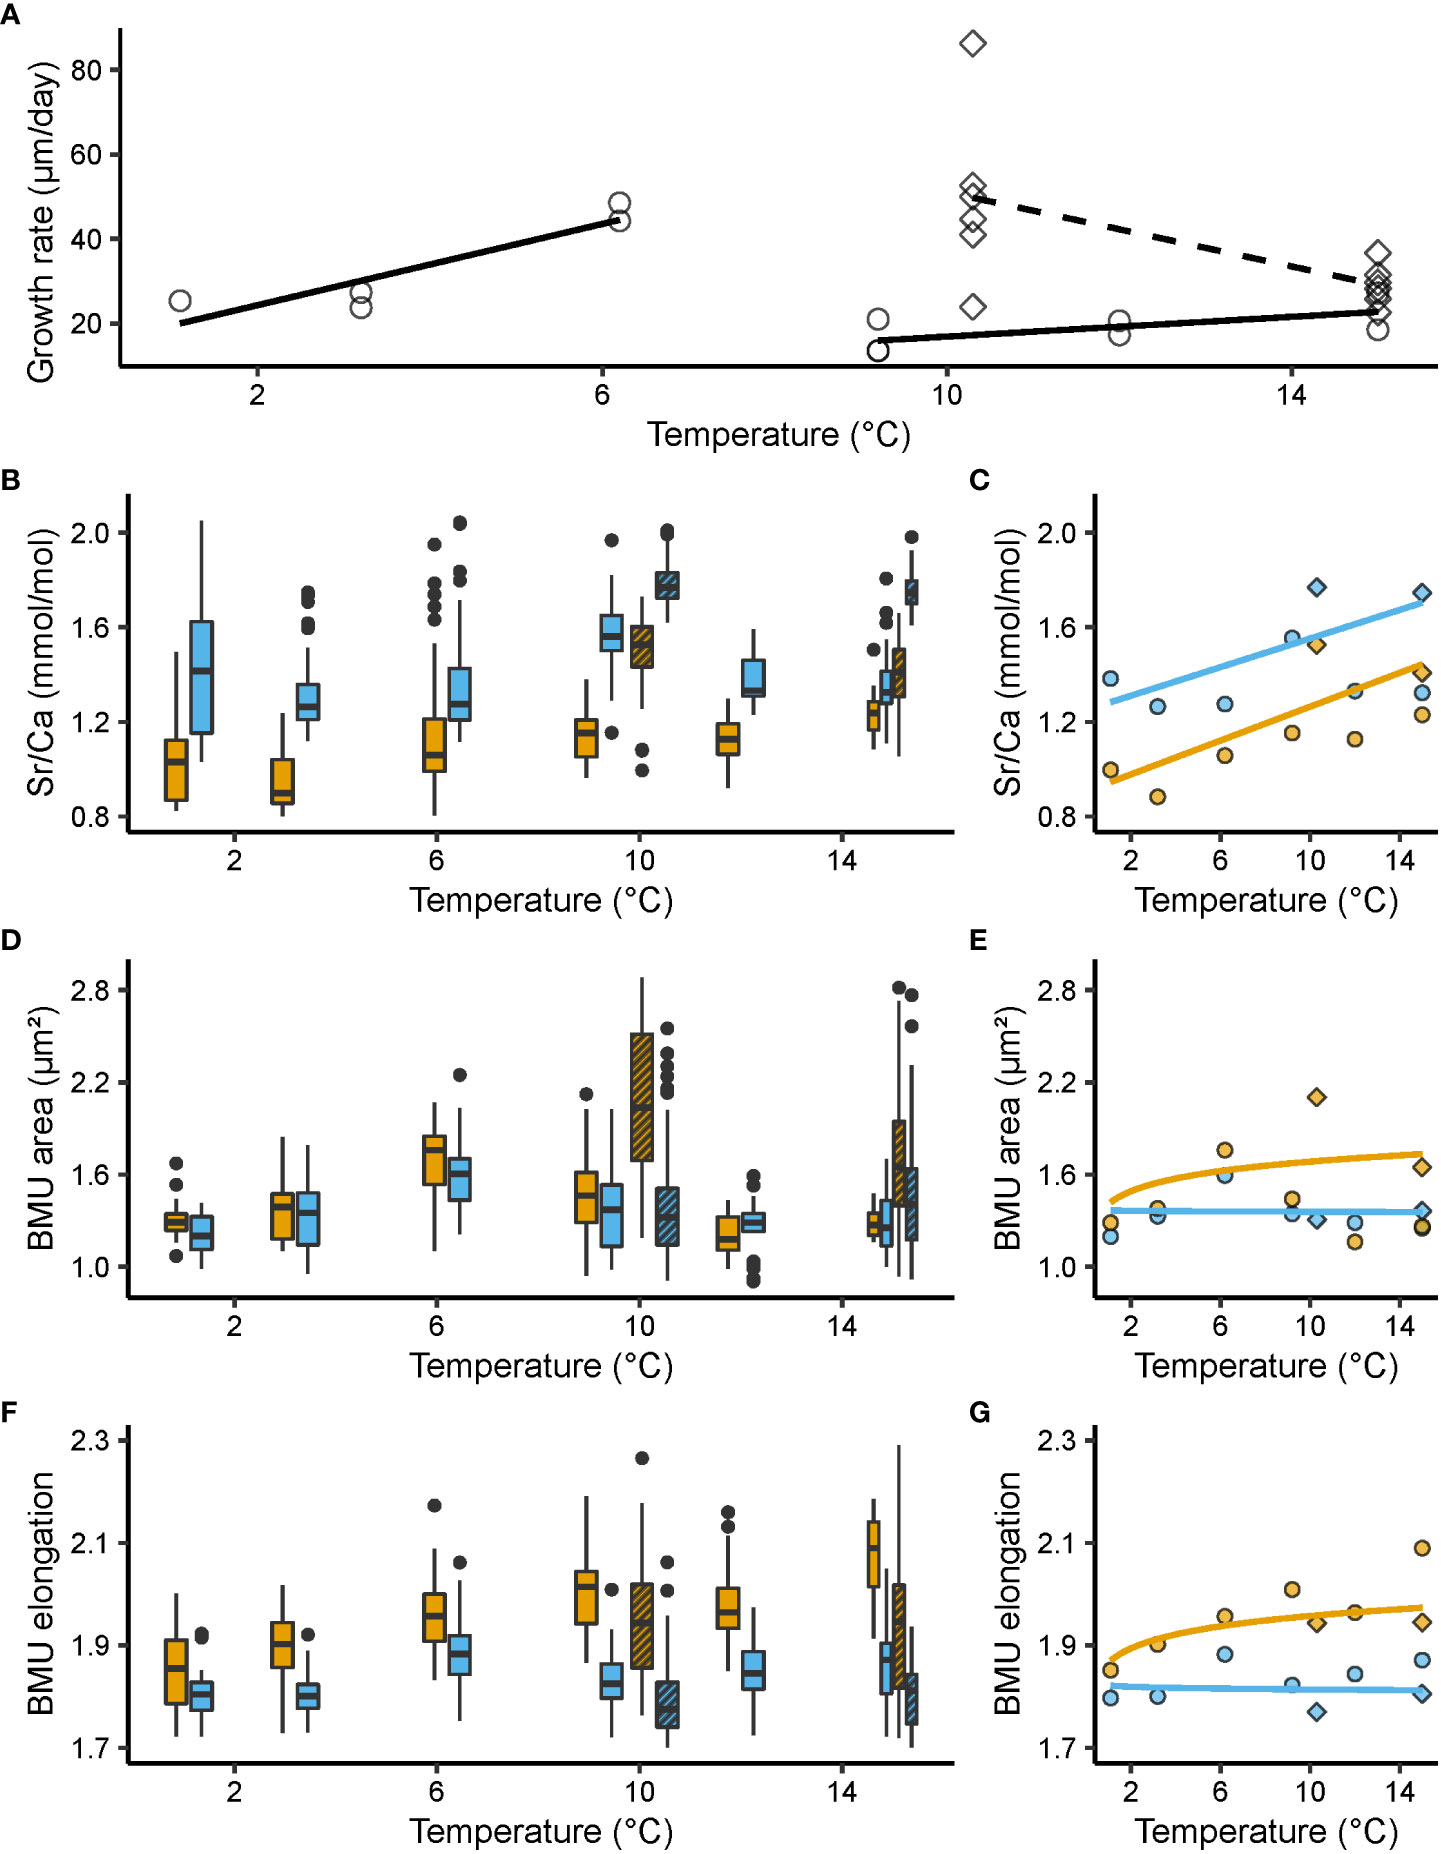
Figure 2 Shell growth rate (µm/day), molar Sr/Ca ratios (mmol/mol) and ultrastructural properties, i.e., biomineral unit (BMU) area (µm²) and elongation, from the outer portion of the outer shell layer (oOSL, blue) and the inner portion of the outer shell layer (iOSL, orange) of Arctica islandica specimens cultured at 1.1, 3.2, 6.2, 9.2, 10.3, 12 and 15°C. (A) Shell growth rate of studied specimens. Black solid line: linear model for Baltic Sea (BS); black dashed line: linear model for Gulf of Maine (GOM). (B) Shell Sr/Ca values and corresponding (C) median values weighted for the number of specimens (linear regression). (D) Area of the BMUs and corresponding (E) median values weighted for the number of specimens (natural logarithm regression). (F) Elongation of the BMUs and corresponding (G) median values weighted for the number of specimens (natural logarithm regression). In (A, C, E, G), circles represent data from the BS experiment, while squares stand for data from the GOM experiment. In (B, D, F), the bold black line represents the median, lower and upper limits of the boxes stand for the first and third quartiles, vertical lines denote the minimum and maximum values, and black dots equal outliers. Solid filled boxes = data from the Baltic Sea experiment; striped boxes = data from the Gulf of Maine experiment.
3.1 Relationship between shell properties and water temperature
3.1.1 Shell Sr/Ca and water temperature
In both sublayers of the outer shell layer, Sr/Ca was significantly (p < 0.05) positively linked to water temperature and differed significantly between the adjacent temperature regimes (KW, p < 0.001) (Figures 2B, C). When adjusted for multiple comparisons, i.e., Bonferroni correction, this relationship remained significant in more than 60% of the groups tested (Dunn, p < 0.025; Table S2). Noteworthy, Sr/Ca ratios of the oOSL were significantly higher than those of the iOSL, on average, by 0.28 ± 0.02 mmol/mol (MWU, p < 0.001), with a range of 1.26 to 1.77 and 0.88 to 1.53 mmol/mol in the oOSL and iOSL, respectively (Figures 2B, C). Sr/Ca of the iOSL was more strongly coupled to water temperature, i.e., showed a higher temperature sensitivity (slope = 0.03 ± 0.01 mmol/mol/°C, R² = 0.38, p < 0.001) than that of the oOSL (slope = 0.02 ± 0.01 mmol/mol/°C, R² = 0.22, p < 0.05) (Figure 2C, Table 2).
3.1.2 Shell ultrastructure and water temperature
At some temperature settings, ultrastructural properties differed significantly between the oOSL and iOSL (MWU, p < 0.001) (Figures 2D, E). For example, at 1.1, 6.2 and 15°C, BMUs were significantly larger in the iOSL than in oOSL (MWU, p < 0.05), whereas nearly identical sizes were observed at the remaining studied temperature regimes (MWU, p > 0.05). In the iOSL, the weak tendency toward larger BMUs forming in warmer water was not significant (slope = 0.10 ± 0.11 µm²/°C, p > 0.05). Nevertheless, in over 66% of the temperature pairs assessed, a significant difference in the area of the BMUs was obtained (Dunn, p < 0.025, Table S2). In contrast, irrespective on the prevailing temperature, the BMU area of the oOSL remained largely unchanged (Dunn, p > 0.025 for more than 70% of the tested pairs, Table S2).
The two sublayers of the OSL differed more clearly with respect to BMU elongation. BMUs were approx. 0.14 ± 0.002 more elongated in the iOSL than the oOSL (Figures 2F, G). Between adjacent temperature regimes, the BMU elongation statistically differed (KW, p < 0.001), but after Bonferroni adjustment only half of the paired temperature regime comparisons remained significant (Dunn, p < 0.025, Table S2). In the iOSL, slightly more needle-shaped BMUs were formed in warmer waters (slope = 0.05 ± 0.01, R² = 0.29, p < 0.01), which was not the case in the oOSL (p > 0.05; Table 3).
Compared with field-grown juveniles from NE Iceland (Brosset et al., 2022), the ultrastructure of the studied lab-grown specimens of A. islandica was more uniform. The difference cannot only be visually identified (Figure S3), but also expressed in numbers. For example, the size of BMUs varied less in shells of tank-raised bivalves than specimens grown in the field (relative 1σ variance of the mean in the oOSL: 21 vs 18%; iOSL: 20 vs 18%; Table S3). Furthermore, in tank-raised specimens, BMUs were generally much larger (oOSL: 1.47 vs 0.85 µm2; iOSL: 1.54 vs 0.97 µm2) and more elongated (oOSL: 1.85 vs 1.78; iOSL: 1.96 vs 1.77; Table S3) than in field specimens.
3.1.3 Shell growth rate and water temperature
At large, the shell growth rate of the specimens selected for this study decreased with temperature (Figure 2A). This trend was steep in GOM shells (slope = - 4.39 ± 1.83 µm/day/°C, R² = 0.30, p < 0.01) but non-significant in BS specimens (slope = - 0.84 ± 0.71 µm/day/°C, p > 0.05). The relationship between BS shell growth rate and temperature could also be described with two linear trends, which would better address the abrupt decline of shell growth rate at around 6°C (Figure 2A). Between 1.1 and 6.2°C, shell growth rate of BS specimens increased by 76% (slope = 4.81 ± 1.27 µm/day/°C, R² = 0.77, p < 0.01), ranging from approx. 24.23 ± 1.07 µm/day at 1.1°C to 42.71 ± 6.36 µm/day at 6.2°C. In warmer water, shell growth of BS shells declined and merely 16.60 ± 3.73 µm were added per day at 9.2°C. Between 9.2 and 15°C, daily growth rate increased slightly (slope = 1.17 ± 0.63 µm/day/°C, R = 0.29, p < 0.05), but only attained 27.53 ± 5.51 µm/day. In contrast, GOM specimens grew, on average, much faster than shells from BS, i.e., 54.79 ± 19.46 µm/day at 10.3°C and 29.88 ± 4.47 µm/day at 15°C, which translated into a gradual reduction of shell growth by nearly 10% for every degree Celsius increase. Growth at 15°C was still significantly faster (on average, 7.21 ± 1.02 µm/day faster; p < 0.001) in GOM specimens than in shells from BS. It should be added that the six GOM specimens showed high variability in daily growth rate at 10.3°C, ranging from 23.89 to 86.26 µm/day (Figure 2A).
3.2 Relationship between shell properties
3.2.1 Sr/Ca vs growth rate
In both OSL sublayers, Sr/Ca correlated with the shell growth rate of the specimens considered, but the signs differed between the two experiments (Figure 3A, Table 2). In BS specimens, faster shell growth was associated with lower Sr/Ca values (Table 2), specifically, in the oOSL (slope = - 0.20 ± 0.07 mmol/mol per 1 µm/day, R² = 0.40, p < 0.05). In contrast, shell growth rate was predominantly positively linked to Sr/Ca in GOM shells, specifically in the iOSL (slope = 0.10 ± 0.04 mmol/mol per 1 µm/day, R² = 0.35, p < 0.05), while the slope was less steep in the oOSL (slope = 0.02 ± 0.01, R² = 0.35, p < 0.05; Table 2).
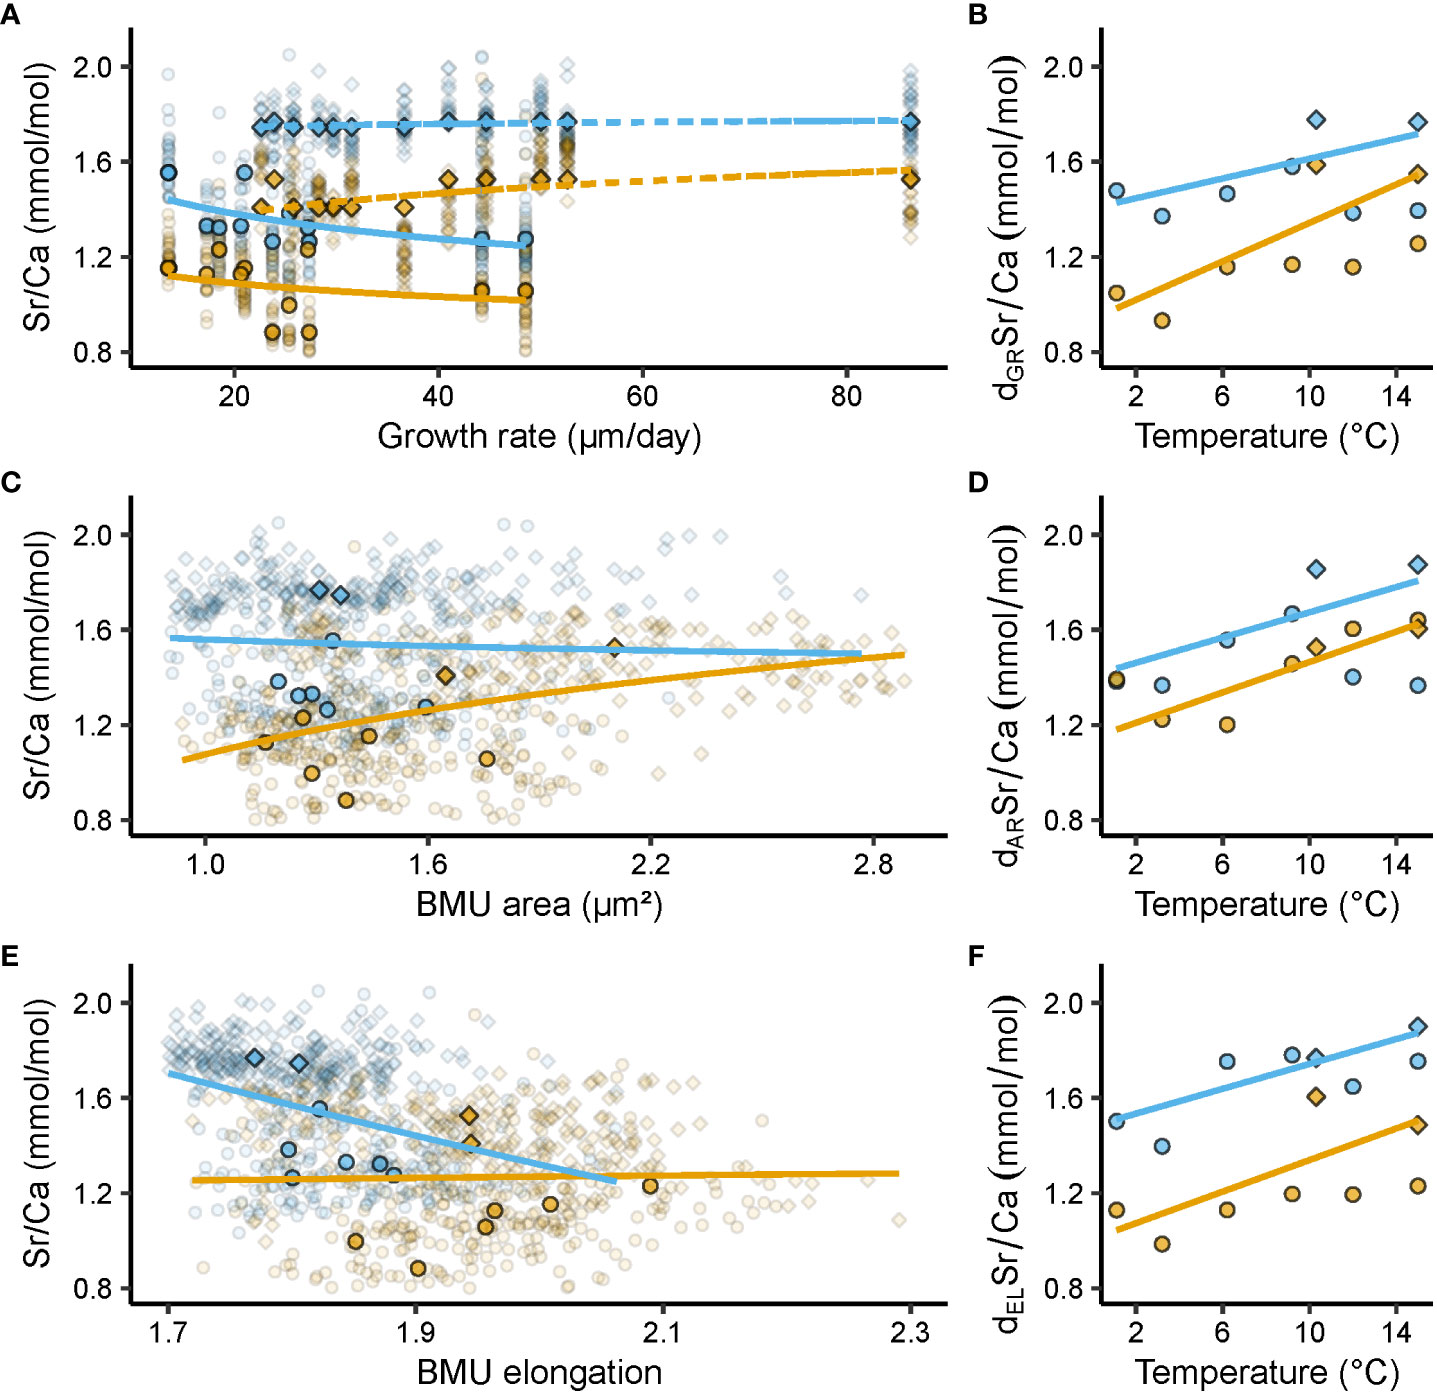
Figure 3 Relationships between shell Sr/Ca ratios (mmol/mol) and growth rate (µm/day), ultrastructural properties, i.e., biomineral unit (BMU) area (µm²) and elongation, and temperature (°C). Blue and orange denote data from the outer and inner portion of the outer shell layer (oOSL, iOSL), respectively, of Arctica islandica specimens cultured at 1.1, 3.2, 6.2, 9.2, 10.3, 12 and 15°C. (A) Relationship between shell Sr/Ca and growth rate (GR) (solid line = Baltic Sea specimens; dashed line = Gulf of Maine specimens). (B) Relationship between detrended (d) Sr/Ca and temperature (T), after removal of GR-related effects. (C) Relationship between Sr/Ca and BMU area (AR). (D) AR-detrended Sr/Ca vs T. (E) Relationship between Sr/Ca and BMU elongation (EL). (F) EL-detrended Sr/Ca vs T. Circles denote data from the Baltic Sea experiment, while squares stand for data from the Gulf of Maine experiment. In (A, C, E) opaque symbols = median weighted for the number of specimens, translucent symbols = raw data from which medians were calculated. All regression models were fitted to the median Sr/Ca values of a given temperature regime, weighted for the number of specimens, with a natural logarithm function for GR, AR and EL, and a linear function for T (regression parameters depicted in Table 2).
3.2.2 Sr/Ca vs ultrastructure
Sr/Ca was significantly correlated to the ultrastructural properties of the shells, with a comparable Sr/Ca difference between the OSL sublayers for both experiments (Figures 3C, E and Table 2). In the iOSL, 53% of the Sr/Ca variance could be explained by the size of the BMUs, with an increase of 0.80 ± 0.15 mmol/mol/µm² (p < 0.001), whereas only a non-significant positive correlation was found between Sr/Ca and BMU elongation (p > 0.05). The link between Sr/Ca and BMU elongation was negative, significant and much stronger in the oOSL (R² = 0.53, p < 0.001) indicating that the strontium content was higher in rounder BMUs (Table 2). In contrast, Sr/Ca was not significantly correlated to the BMU area in the oOSL (p > 0.05).
3.2.3 Shell growth vs ultrastructure
Ultrastructural properties and shell growth rate were significantly correlated (Table 3). For example, in the iOSL, the BMU area variability explained by the shell growth rate varied between 33 and 35% for BS and GOM shells, respectively (p < 0.05; Figure 4A, Table 3). The size of the BMUs increased between 0.31 ± 0.12 µm² (BS) and 0.39 ± 0.15 µm² (GOM) for each µm/day of shell growth (Table 3). In the oOSL of BS specimens, larger BMUs were also formed during faster shell growth (slope = 0.20 ± 0.07 µm² per µm/day; R² = 0.37, p < 0.05), whereas the BMU area decreased slightly with growth rate in GOM shells (slope = - 0.05 ± 0.02, R² = 0.35, p < 0.05, Table 3).
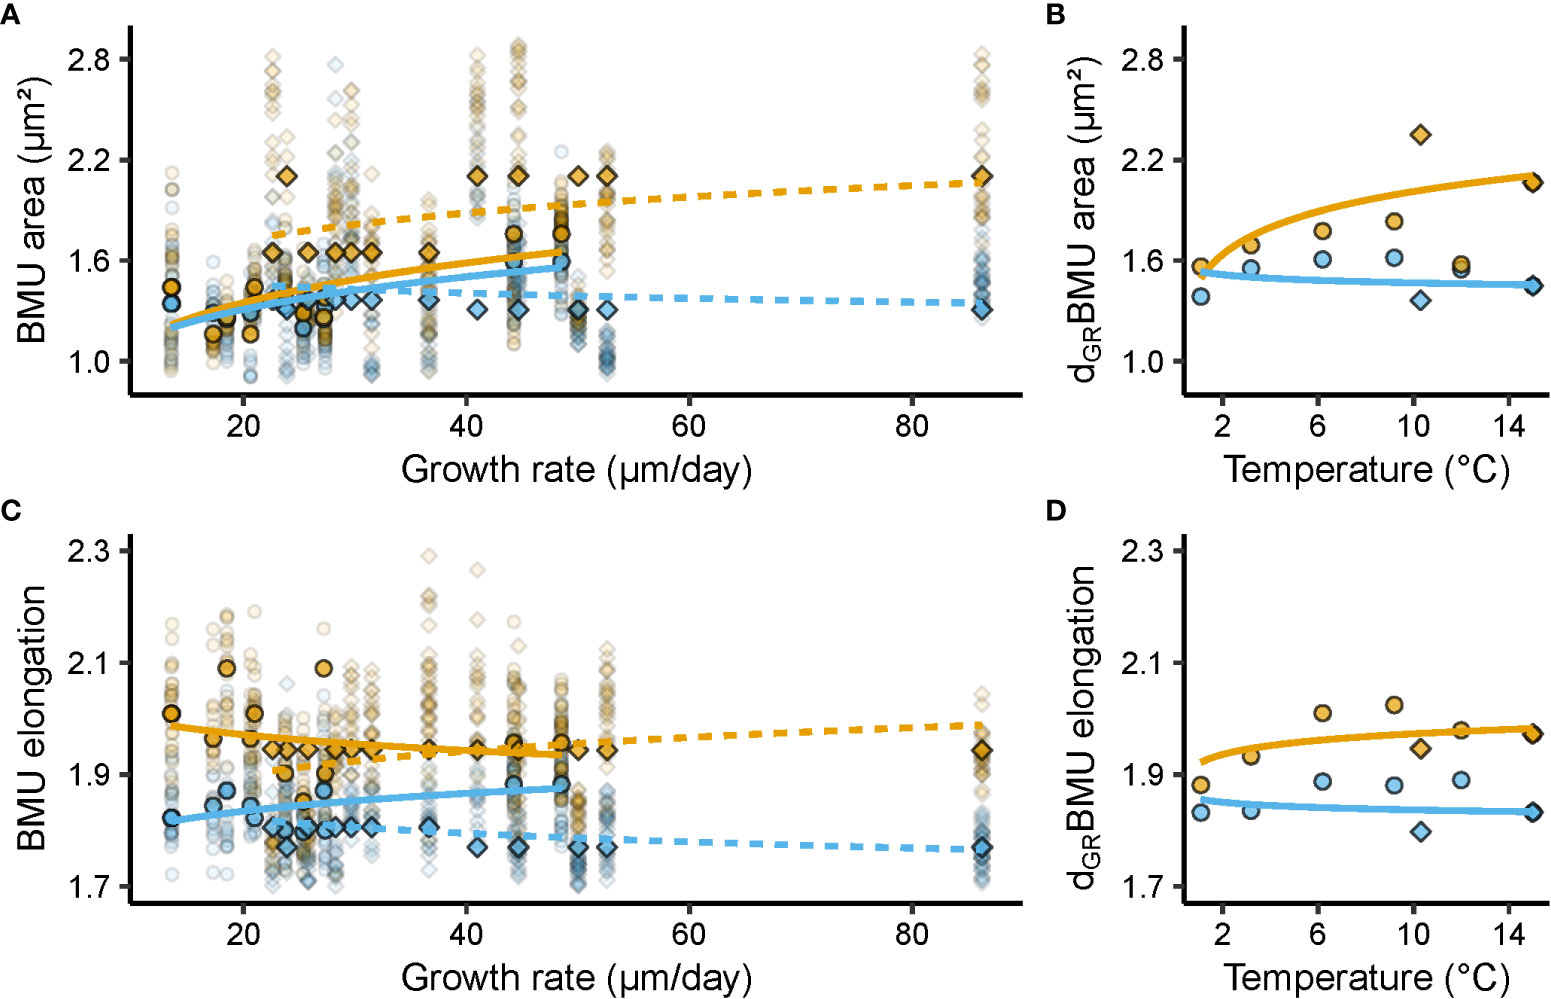
Figure 4 Relationships between shell ultrastructural properties, i.e., biomineral unit (BMU) area (µm²) and elongation, growth rate (µm/day), and temperature (°C). Blue and orange denote data from the outer and inner portion of the outer shell layer (oOSL, iOSL), respectively, of Arctica islandica specimens cultured at 1.1, 3.2, 6.2, 9.2, 10.3, 12 and 15°C. (A) Relationship between BMU area and shell growth rate (GR). (B) Relationship between GR-detrended (d) BMU area (AR) and temperature (T). (C) Relationship between BMU elongation (EL) and GR. (D) GR-detrended EL vs T. In (A, C) solid line = Baltic Sea specimens; dashed line = Gulf of Maine specimens. Circles denote data from the Baltic Sea experiment, while squares stand for data from the Gulf of Maine experiment. Opaque symbols = median weighted for the number of specimens; translucent symbols = raw data from which medians were calculated. All regression models were fitted to the median BMU area and elongation values of a given temperature regime, weighted for the number of specimens, with a natural logarithm function for GR and T (regression parameters depicted in Table 3).
3.3 Relationship between detrended shell properties and water temperature
3.3.1 Ultrastructure-detrended Sr/Ca vs temperature
Once the correlation between Sr/Ca and BMU elongation was mathematically eliminated, dELSr/Ca values of the oOSL correlated much stronger with water temperature than undetrended Sr/Ca (R² = 0.63, p < 0.001 vs R² = 0.22, p < 0.05, respectively; Figure 3E, Table 2). Likewise, mathematical elimination of BMU area-related effects from shell Sr/Ca ratios increased the correlation between Sr/Ca and water temperature. For example, 75% of dARSr/Ca variance in the iOSL was explained by the temperature (Figure 3D, Table 2).
3.3.2 Growth rate-detrended Sr/Ca vs temperature
After elimination of growth rate-related effects, shell Sr/Ca fmars.2023.1279164data (dGRSr/Ca) were still positively correlated to water temperature (Figure 3B), but the temperature sensitivity of Sr/Ca of the oOSL was weaker than before detrending (slope = 0.01 ± 0.01 mmol/mol/°C, R² = 0.16, p < 0.05; compare Figures 3B, 2B). In contrast, 41% of the iOSL dGRSr/Ca variance was explained by water temperature, i.e., an increase by more than 7% compared to undetrended Sr/Ca data (Table 2).
3.3.3 Combined shell growth and ultrastructure-detrended Sr/Ca vs temperature
Similar to undetrended Sr/Ca, dGRSr/Ca was positively linked to the BMU area in the iOSL (R² = 0.53, p < 0.001; Figures 5A, C, Table 2). Therefore, the double-detrending of Sr/Ca (i.e., detrending by shell growth rate and BMU area [GRAR]), resulted in comparable results as those obtained by simple detrending (GR, AR), and no significant increase in R² was identified for dGRARSr/Ca vs temperature (Table 2). However, the temperature sensitivity of dGRARSr/Ca of the iOSL doubled compared to simple detrending (0.06 ± 0.01 vs 0.03 ± 0.01 mmol/mol/°C; Figures 5B, D). In the oOSL, the temperature sensitivity increased up to 0.04 ± 0.01 mmol/mol/°C for dGRELSr/Ca. Furthermore, a combined detrending of Sr/Ca by growth rate, BMU area and elongation (dGRARELSr/Ca; Figure 5E) tripled the temperature sensitivity of Sr/Ca of the oOSL and increased the temperature sensitivity by 0.06 ± 0.002 mmol/mol/°C in the iOSL (Figure 5F), albeit at the expense of explained variability (Table 2). However, in both OSL sublayers, the linear models between dGRARELSr/Ca and water temperature still showed a better fit that those obtained with undetrended Sr/Ca data (R² = 0.41 and 0.44 in the oOSL and iOSL, respectively; p < 0.001; Table 2).
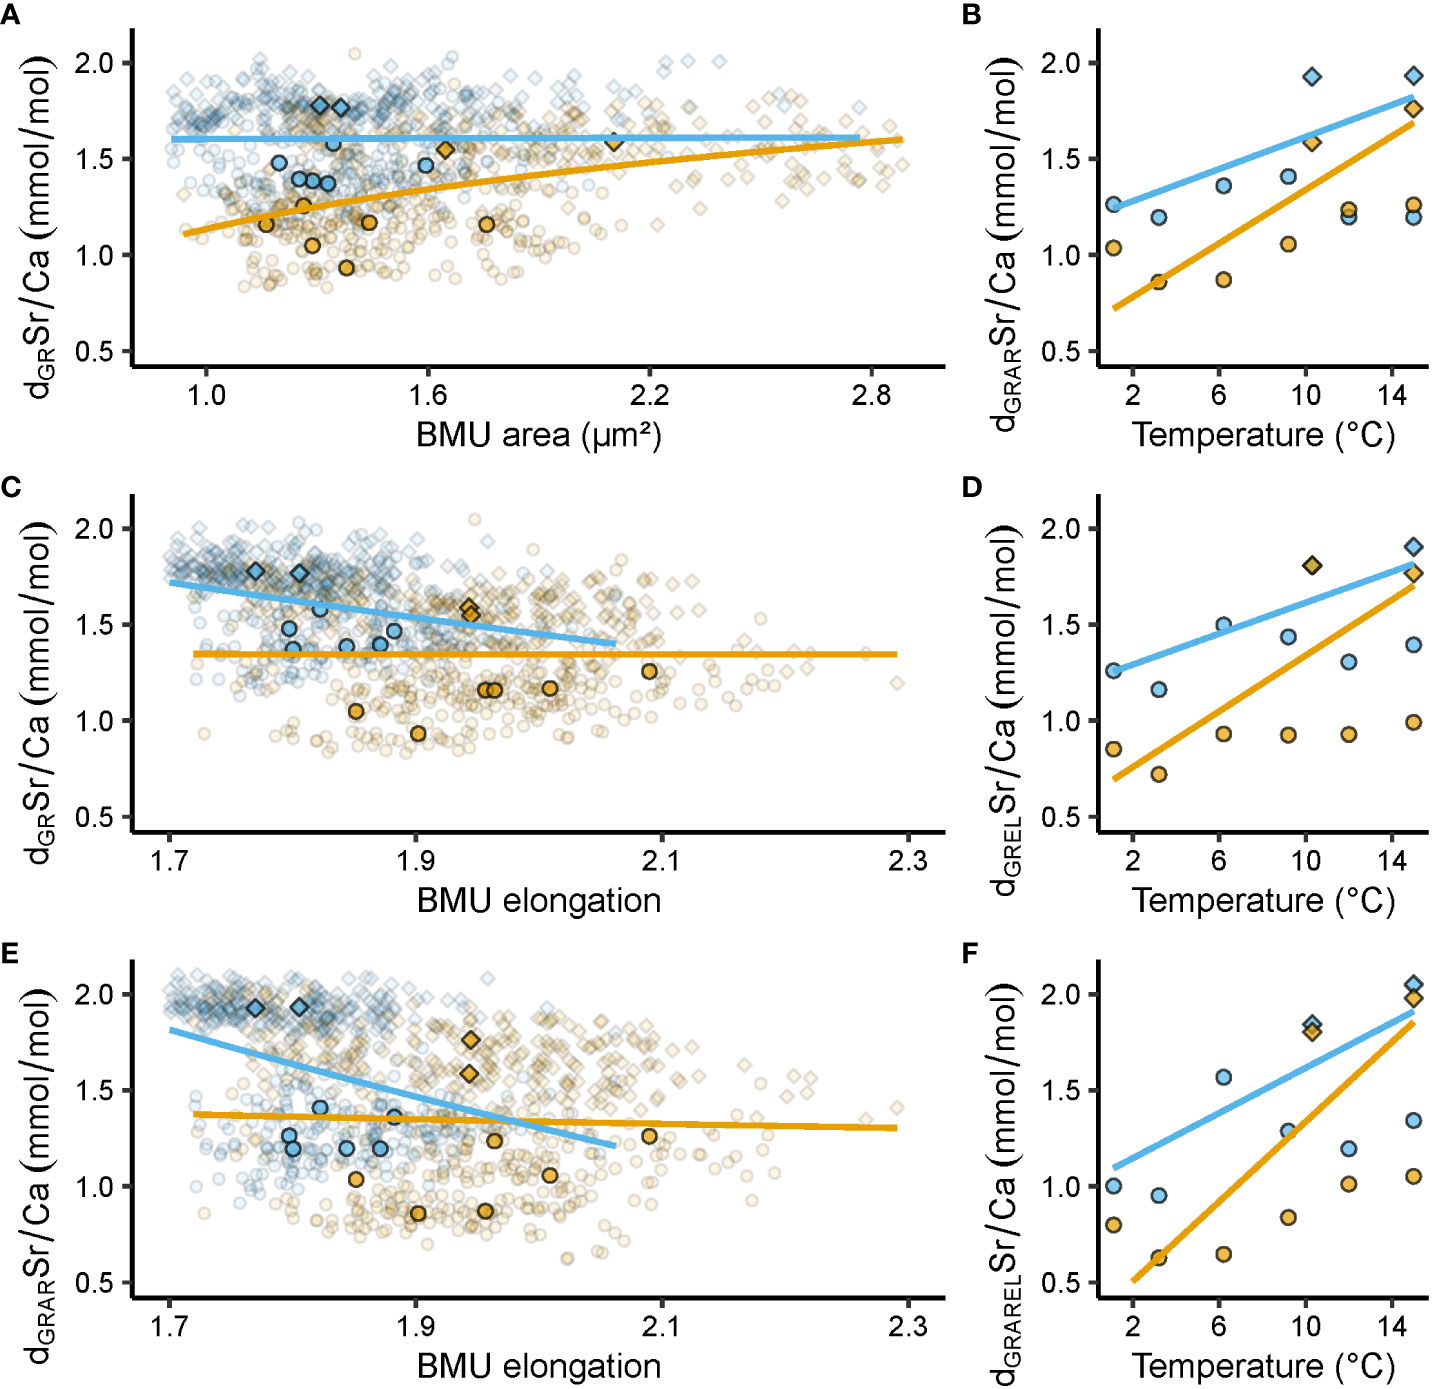
Figure 5 Relationships between shell Sr/Ca ratios (mmol/mol), ultrastructural properties, i.e., biomineral unit (BMU) area (µm²) and elongation, and temperature (°C). Blue and orange denote data from the outer and inner portion of the outer shell layer (oOSL, iOSL), respectively, of Arctica islandica specimens cultured at 1.1, 3.2, 6.2, 9.2, 10.3, 12 and 15°C. (A) Relationship between growth rate (GR)-detrended (d) shell Sr/Ca data and BMU area (AR). (B) Relationship between GR and AR-detrended Sr/Ca data and temperature (T). (C) Relationship between GR-detrended shell Sr/Ca data and BMU elongation (EL). (D) GR and EL-detrended Sr/Ca data vs T. (E) Relationship between GR and AR-detrended shell Sr/Ca data and EL. (F) GRAREL-detrended Sr/Ca data vs T. Circles denote data from the Baltic Sea experiment, while squares stand for data from the Gulf of Maine experiment. In (A, C, E), opaque symbols = median weighted for the number of specimens; translucent symbols = raw data from which medians were calculated. All regression models were fitted to the median Sr/Ca values of a given temperature regime, weighted for the number of specimens, with a natural logarithm function for GR, AR and EL, and a linear function for T (regression parameters depicted in Table 2).
3.3.4 Growth rate-detrended ultrastructural properties vs temperature
Growth rate-detrended BMU area (dGRAR) data were positively correlated to water temperature in the iOSL (Figure 4B, Table 3). 23% of the dGRAR variance in the iOSL could be significantly (p < 0.05) explained by water temperature (natural logarithm model) and sensitivity increased to 0.23 ± 0.08 µm²/°C, whereas the regression model was not significant for undetrended BMU area data (Figure 4B, Table 3). Detrending of the BMU elongation values for growth rate-related effects resulted in lower R² data and reduced temperature sensitivity compared to undetrended data of the iOSL (slope = 0.03 ± 0.01 per °C, R² = 0.19, p < 0.05; Figure 4D, Table 3).
4 Discussion
The present study provided new insights into the complex relationships between shell Sr/Ca of Arctica islandica and water temperature and confirmed previous observations and assumptions. For example, a layer-specific chemical analysis is mandatory, because the Sr content is strongly linked to the prevailing ultrastructure and is higher in the oOSL than iOSL (HOM vs CA ultrastructure). Similar findings were reported for the ocean quahog by many previous studies (e.g., Schöne et al., 2011; Karney et al., 2012; Schöne et al., 2013; Shirai et al., 2014). In addition, to properly identify relationships between shell Sr/Ca and temperature, a broad range of different experimental temperature conditions needs to be assessed (here: 1 to 15°C), specifically near the optimal growth temperature of 12 to 18°C of A. islandica (Witbaard et al., 1997).
Most importantly, the present study confirmed the finding by Brosset et al. (2022) according to which shell Sr/Ca of field-grown A. islandica contains information on water temperature (positive correlation Figures 2B, C, Table 2), but is also controlled by growth rate, ultrastructure and other environmental variables. However, as shown here, shell Sr/Ca values of laboratory-raised specimens provided much more robust temperature estimates than field-grown bivalves, especially after mathematical elimination of ultrastructure-related effects from Sr/Ca data (Figures 2–5, Table 2). In tangible terms, the correlation of (ultrastructure-detrended) shell Sr/Ca with water temperature was much stronger in specimens grown in laboratory tanks (up to R² = 0.75; this study) than in nature (R² = 0.26; Brosset et al., 2022). Very likely, this can be attributed to more equable growth conditions in the laboratory minimizing environmental biases.
The present work also demonstrated that transfer functions calibrated with tank specimens cannot be used to compute temperature from Sr/Ca data of field-grown A. islandica specimens. This is partly due to the fact that the temperature sensitivity of Sr/Ca was stronger in tank shells than in shells of specimens from the field (oOSL: 0.03 vs 0.007 mmol/mol/°C; iOSL: 0.03 vs 0.02 mmol/mol/°C). In addition, BMUs of lab-grown specimens were larger (oOSL) and more elongated (iOSL) than in wild specimens, so that transfer functions based on ultrastructure-detrended Sr/Ca data can likewise not be applied to specimens from the field.
Overall, the findings suggested that the shell Sr/Ca thermometer of ocean quahogs merely works well under artificial laboratory conditions (temperature predicted up to ± 2.6°C in the oOSL, ± 1.0°C in the iOSL, Figure 6), but not in nature where the Sr/Ca vs temperature relationship is apparently strongly biased by environmental conditions that can hardly be quantified and corrected for. In field-grown specimens, the explained variability of shell Sr/Ca is simply too low (R² = 0.04 and 0.30 in the oOSL and the iOSL, respectively, Figure 6) and the prediction uncertainty too large for a reliable reconstruction of water temperature (prediction interval of ± 2.1°C and ± 2.4°C in the iOSL and oOSL, respectively; Figure 6). It is important to note that Sr/Ca values in seawater can vary temporally and regionally, particularly in coastal areas (Lebrato et al., 2020; Lebrato et al., 2021; Khare et al., 2023). Assuming a constant Sr/Ca composition of the water can introduce bias in temperature estimates from bivalve shell Sr/Ca, especially when the temperature sensitivity of shell Sr/Ca is low. This underlines the need to obtain highly resolved seasonal location-specific Sr/Cawater data in future studies, particularly in regions affected by riverine influx (e.g., Khare et al., 2023).
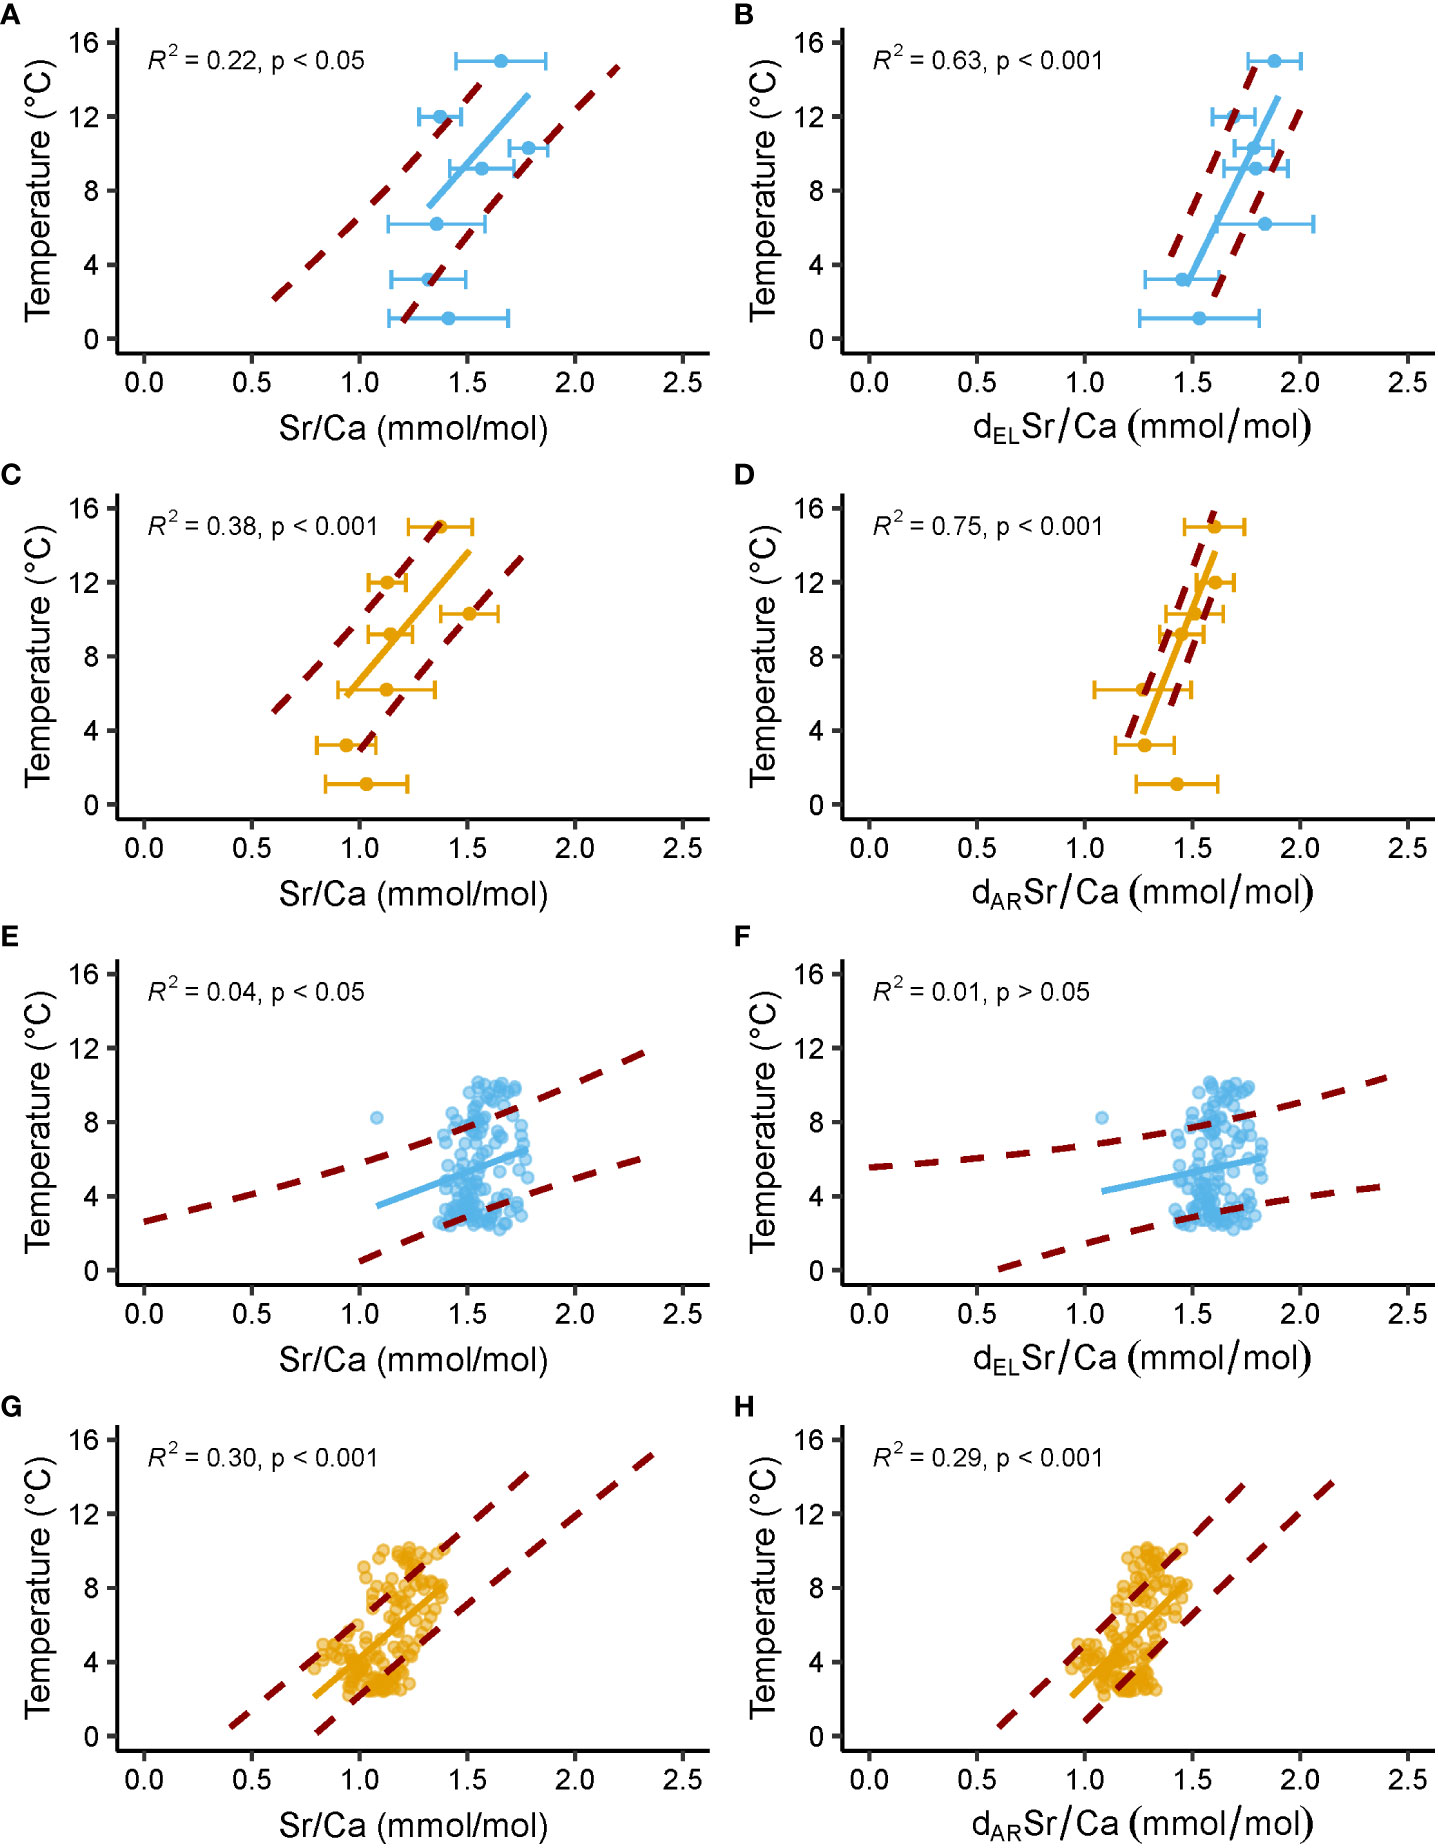
Figure 6 Temperature predicted from shell Sr/Ca ratios of laboratory-grown and field-grown A. islandica specimens. Blue and orange denote data from the outer and inner portion of the outer shell layer (oOSL, iOSL), respectively. Solid line = linear regression between predicted temperature and measured Sr/Ca; red dashed lines = upper and lower limits of the 1σ temperature interval predicted from measured Sr/Ca data. (A–D) Data from Baltic Sea and Gulf of Maine specimens cultured at 1.1, 3.2, 6.2, 9.2, 10.3, 12 and 15°C in laboratory tanks. Error bars = average ± 1σ. (E–H) Data from NE Iceland specimens grown in nature (Brosset et al., 2022). In (B, F) Sr/Ca data are detrended (d) for the elongation (EL) of individual biomineral units (BMUs) of the shell ultrastructure, whereas Sr/Ca data detrended for the area (AR) of the BMUs are depicted in (D, H).
4.1 Predicted and observed relationship of Sr/Ca vs temperature
The observed positive correlation between shell Sr/Ca and temperature is in agreement with both thermodynamic expectations and the lattice strain model (Gaetani and Cohen, 2006). Note that the same trend is obtained if only the data from the Baltic Sea are used (see Brosset et al., 2023). In the crystal lattice of aragonite, Sr2+ can substitute for Ca2+ due to the same charge and similar ion size (Sr2+ measures 1.31 Å in 9-fold coordination, Ca2 + 1.18 Å, Shannon, 1976). This enables strontium ions to occupy the same sites as calcium ions without significantly disrupting the lattice structure. With rising temperature, the lattice distortions increase and allow for more Sr2+ to be incorporated, resulting in higher Sr/Ca ratios (Gaetani and Cohen, 2006). The temperature sensitivity of shell Sr/Ca was nearly identical to such expected for thermodynamic equilibrium, i.e., 0.04 mmol/mol/°C (Table 2; Gaetani and Cohen, 2006). This suggests that the increase in strontium partition coefficient during moderate and rapid shell growth (HOM and CA ultrastructure) was primarily governed by thermodynamic factors.
In contrast to the temperature sensitivity, significant differences were found between predicted and observed Sr/Ca levels. For example, the Sr/Ca values of the CA ultrastructure of the iOSL (1.37 ± 0.15 mmol/mol at 15°C, Figure 2B) were almost three times higher than predicted by thermodynamics and the lattice strain model (0.51 mmol/mol at 15°C; Gaetani and Cohen, 2006). Even higher values were measured in the homogenous oOSL (1.64 ± 0.19 mmol/mol at 15°C; Figure 2B) and in particular, in the ISP ultrastructure of annual growth lines (> 3 mmol/mol, Schöne et al., 2013; Schöne et al., 2023), indicating that additional factors controlled the incorporation of strontium into the shell.
As outlined in more detail in Brosset et al. (2022), the size and shape of BMUs and ultimately, the habit of aragonite crystals could have been responsible for the Sr enrichment in the studied shells. The varying strontium concentrations in the different ultrastructure types (CA < HOM < ISP) may be explained by the amount of specific crystal faces facilitating the incorporation of trace impurities, for example, due to lattice defects (e.g., Plummer and Busenberg, 1987; Paquette and Reeder, 1995; Mavromatis et al., 2022). The substitution of Ca2+ by compatible ions is energetically less costly in crystals with a larger number of lattice defects. Furthermore, in aragonite, much less energy is required to substitute Ca2+ by Sr2+ ions on the surface than deeper inside of the crystal (Menadakis et al., 2008). Large exposed aragonite crystal faces thus promote the substitution of Ca2+ by Sr2+ (Menadakis et al., 2008). This may explain why the large, blocky, idiomorphic BMUs occurring at the annual growth lines contain much more strontium than xenomorphic BMUs lacking a distinct habit such as the granular HOM-BMUs of the oOSL (often irregularly shaped twinned crystallites). The highly ramified and convoluted CA-BMUs of the iOSL likely have the least developed primary crystal faces and thus come with the lowest Sr/Ca values.
An alternative or complementary explanation for the strongly varying Sr concentrations (CA < HOM < ISP) and the different relationships between Sr/Ca and temperature in the different ultrastructures (positive in HOM and CA, negative if ISP is included) may include differences in energy allocation or availability. Given that Sr/Ca values in shells of ocean quahogs remain below such observed in synthetic aragonite and above values expected for thermodynamic equilibrium, an active, energy-consumptive process seems to regulate the amount of trace impurities that end up in the shell aragonite. Such a control may be required to maintain specific mechanical properties of the shell and facilitate the formation of specific ultrastructures. It remains unclear how exactly this is achieved, e.g., by pumping undesirable ions out of the extrapallial space or by producing molecules capable to capture undesirable ions to prevent their incorporation into the shell carbonate.
It is further hypothesized that more primitive ultrastructures, i.e., ISP, are formed when less energy is available or less energy is allocated for biomineralization. In A. islandica, ISP ultrastructures are formed during times of strongly reduced metabolic rate during formation of annual growth lines (Schöne et al., 2023). In addition, ISP is increasingly formed during later stages of life as a result of gradually declining shell growth rate and energy-rerouting to body maintenance and gonad production, rather than biomineralization and active control over trace impurity content of the shell. As a consequence, ISP ultrastructures are then not limited to annual growth lines, but are also produced during other times of the growing season and hence, the proportion of ISP relative to CA and HOM increases gradually through lifetime. Increasingly narrower growth bands are deposited as the bivalve ages and the actual annual growth lines may be challenging to identify. Very likely, during later stages of life, shell growth with CA and HOM formation only occurs when sufficient food is available. This would be supported by the high valve gape activity and shell growth observed in A. islandica specimens at high [Chl-a], i.e., during phytoplankton blooms (Ballesta-Artero et al., 2017).
It is hypothesized here that during ISP formation, similar mechanisms are at work that control the incorporation of Sr into abiogenic aragonite, i.e., surface entrapment during crystal growth (Watson, 1996; Watson, 2004; Gaetani and Cohen, 2006). At lower temperatures, the rate of crystal growth is faster than the transport of Sr2+ to the near-surface region of the crystal and solid solution diffusion thus limited. The chemistry of the near-surface region thus becomes ‘entrapped’ resulting in higher Sr/Ca values in the crystal. With increasing temperature, the solid solution diffusion rate increases and the Sr/Ca values of the forming crystal decrease gradually. This mechanism has been evoked to explain the negative correlation between Sr/Ca and temperature in synthetic aragonite (Gaetani and Cohen, 2006), and may likewise be at work during ISP formation, i.e., during times when vital effects are at minimum. In contrast, when sufficient energy is available, the bivalve exerts strong control over the amount of Sr2+ that substitutes for Ca2+ in the crystal lattice and perhaps, thermodynamic processes prevail over surface entrapment so that a positive relationship establishes between shell Sr/Ca and temperature.
The positive correlation between Sr/Ca and temperature in laboratory-grown shells further increases (up to R² = 0.75, Table 2), if the Sr/Ca data are mathematically corrected for ultrastructure and growth rate-related effects. According to these findings, the relationship between shell Sr/Ca and temperature in laboratory-grown A. islandica specimens is predominantly governed by ultrastructure properties or processes related to ultrastructure formation. However, the temperature sensitivity of Sr/Ca ratios corrected for ultrastructure and growth rate-related effects (dGRAR, dGREL and dGRARELSr/Ca) exceeded predictions of the lattice strain model as well as thermodynamics and reached values of up to 0.09 ± 0.02 mmol/mol/°C (dGRARELSr/Ca of the iOSL vs T; Table 2). We currently do not have a conclusive explanation for this observation.
Noteworthy, the shell growth rate of the specimens selected for this study showed highly inconsistent trends with water temperature, both between the two experiments and across the studied temperature range (Figure 2A). It should be added that the mathematical elimination of growth rate-related effects from shell Sr/Ca data barely improved the correlation between Sr and temperature (Figure 3B, Table 2). Accordingly, for specimens grown under stable laboratory conditions selected for this study, kinetics do not seem to be the main factor regulating the incorporation of strontium into shells of A. islandica.
4.2 Sr/Ca thermometer only works in laboratory-grown A. islandica
As expected, tank-grown specimens formed shells with more uniform ultrastructure than wild specimens, possibly as a result of more equable, undisturbed growth conditions. For example, aside from HOM (oOSL) and CA (iOSL), no other ultrastructure type was formed under laboratory conditions after the acclimatization period. Specifically, fine complex cross-lamellar ultrastructure was absent, which was often reported in conjunction with stressful environmental conditions (Höche et al., 2022). Likewise, no ISP was produced, which typically occurs during annual growth line formation, i.e., during times of very slow growth (Dunca et al., 2009; Schöne et al., 2011; Karney et al., 2012; Schöne et al., 2013). Also, at a given temperature regime and within a given temperature range, BMU sizes exhibited less variability in tank-grown bivalves than specimens grown in the field (Table S3). Notably, BMUs in shells of tank specimens were 73% (oOSL) to 59% (iOSL) larger and 4% (oOSL) to 11% (iOSL) more needle-shaped than in shells of wild specimens (Table 3S).
Most likely, the more uniform ultrastructure in conjunction with larger/more elongated BMUs of laboratory-grown specimens was the main reason why shell Sr/Ca was more strongly coupled with temperature than Sr/Ca of wild A. islandica. As illustrated by many previous studies, some element chemical properties, specifically for Sr and Mg, are strongly tied to the prevailing shell nanoarchitecture (e.g., Schöne et al., 2011; Karney et al., 2012; Schöne et al., 2013; Shirai et al., 2014; Höche et al., 2022). Accordingly, if the shell ultrastructure properties change as the result of physiological or environmental variations (other than temperature) (compare Höche et al., 2022), the relationship between shell Sr/Ca and temperature will break down. If that assumption holds true, Sr/Ca-based temperature reconstructions are limited to ocean quahogs grown under optimum conditions in laboratory tanks, unless the factors controlling ultrastructural variations in the field are known in detail and can be quantified. It may be worthwhile to study if similar observations can be made in other species.
4.3 Considerations on tank experiments
Although the relationship between shell Sr/Ca and temperature observed in A. islandica specimens grown in laboratory tanks cannot be used to reconstruct temperature from field grown specimens, such experiments can provide insights into principles behind the Sr incorporation into shells. Specifically, controlled tank experiments can help to quantify the degree to which Sr/Ca values of bivalve shells are controlled by a single environmental variable, here water temperature, while other environmental disturbances are kept at minimum. In comparison with field-grown specimens this can reveal which environmental variables mask the temperature information recorded in shell Sr/Ca. Potentially, this can lead to the development of methods capable of retaining a larger proportion of the temperature signal encoded in this element/Ca ratio of wild A. islandica than currently possible.
To reliably identify relationships between shell properties and temperature, tank experiments should be conducted at a broad range of different thermal regimes (not just two as in Wanamaker and Gillikin, 2019) encompassing the species-specific optimum growth temperature. This is particularly relevant, if specimens exhibit large individual differences in growth rate and ultrastructure, which was the case in the GOM specimens at 10.3°C (Figures 2A, D, F). Data from the BS experiment provided a more robust insight into the temperature sensitivity of shell Sr/Ca, because specimens were exposed a broad spectrum of different temperatures ranging from 1 to 15°C, i.e., close to the lower growth temperature threshold and overlapping with the reported optimum growth temperature range (12 – 18°C, Witbaard et al., 1997). It would have been interesting to assess the extent of Sr incorporation into the shell of the GOM specimens grown below 10°C. Such an experiment would also have revealed whether individual variations in shell properties were attributable to population-specific (genotypic or epigenetic) differences or arose from ontogenetic factors such as age or size. For example, the high individual variability in growth rate observed at 10.3°C could indicate that specimens of the GOM population exhibited a broader thermal tolerance and growth response to temperature variations (Wanamaker et al., 2019) than A. islandica from BS (Table 2).
Slightly different results on the relationship between shell properties and water temperature may also relate to the experimental designs. In the BS experiment of Witbaard et al. (1997), all bivalves were fed ad libitum with a known composition of algae (Isochrysis galbana and Dunaliella marina) and experienced the exact same environmental conditions, i.e, the same water chemistry and salinity (although these were not quantified), but different water temperatures. This approach (parallel experiments) allowed to study the effect of temperature on shell properties of this species (or population) but could not unravel the response of individual specimens to changes of the thermal regime. The latter was possible with the GOM experiment (serial experiment), where the same bivalves were successively exposed to different thermal regimes. However, during the GOM experiment, food supply and salinity varied throughout the experiment (30.20 ± 0.70 at 10.3°C; 30.70 ± 0.70 at 15°C; Beirne et al., 2012; Wanamaker and Gillikin, 2019; food supply was not monitored), because laboratory aquaria were supplied with ambient seawater.
5 Summary and conclusions
As demonstrated here, shell Sr/Ca of laboratory-grown A. islandica specimens can be used to reconstruct water temperature with 1σ prediction uncertainty of 1°C. Shell Sr/Cr values increased with water temperature by 0.03 mmol/mol/°C which agrees with thermodynamic expectations. The explained variability was significantly higher than in field-grown specimens (Brosset et al., 2022) and attained 63% in the oOSL (homogeneous ultrastructure) and 75% in the iOSL (crossed-acicular ultrastructure). Most likely, the equable, less biased conditions in the laboratory resulted in the production of a more uniform shell ultrastructure (with larger and more elongated biomineral units) which in turn was associated with less variable Sr/Ca values and a stronger link to water temperature.
Transfer functions based on laboratory specimens cannot be used to compute temperature from Sr/Ca data of field-grown A. islandica. Firstly, this is impossible because the temperature sensitivity of Sr/Ca was stronger in tank-grown shells than in wild specimens (oOSL: 0.02 vs 0.007 mmol/mol/°C; iOSL: 0.03 vs 0.02 mmol/mol/°C). Secondly, BMUs of lab-grown specimens were larger (oOSL) and more elongated (iOSL) than in field-grown specimens, so that ultrastructure-detrending of Sr/Ca data leads to different results.
While the shell Sr/Ca thermometer of ocean quahogs works well under artificial laboratory conditions, the Sr/Ca vs temperature relationship is strongly biased by environmental conditions that can hardly be quantified and mathematically eliminated. In field-grown specimens, the explained variability of shell Sr/Ca is too low and the prediction uncertainty too large for a reliable reconstruction of water temperature.
Data availability statement
The datasets presented in this study can be found in online repositories. The names of the repository/repositories and accession number(s) can be found below: Brosset et al., 2023 (https://zenodo.org/record/8249992).
Ethics statement
The manuscript presents research on animals that do not require ethical approval for their study.
Author contributions
CB: Data curation, Formal Analysis, Investigation, Methodology, Validation, Visualization, Writing – original draft, Writing – review & editing. NH: Investigation, Methodology, Writing – review & editing. RW: Resources, Writing – review & editing. KN: Writing – review & editing. KS: Funding acquisition, Writing – review & editing. RM-K: Writing – review & editing. BS: Conceptualization, Data curation, Formal Analysis, Funding acquisition, Investigation, Methodology, Project administration, Supervision, Validation, Writing – original draft, Writing – review & editing.
Funding
The author(s) declare financial support was received for the research, authorship, and/or publication of this article. BRS, SCHO 793/23, German Research Foundation (DFG); KS, JPJSJRP 20181607, Japan Society for Promotion of Science (JSPS) under the Joint Research Projects-LEAD with the DFG (JRPs-LEAD with DFG). The funders had no role in study design, data collection and analysis, decision to publish, or preparation of the manuscript.
Acknowledgments
We thank Alan D. Wanamaker for providing the specimens from the Gulf of Maine experiment. We thank the two reviewers for their comments which helped to improve the clarity of this manuscript.
Conflict of interest
The authors declare that the research was conducted in the absence of any commercial or financial relationships that could be construed as a potential conflict of interest.
Publisher’s note
All claims expressed in this article are solely those of the authors and do not necessarily represent those of their affiliated organizations, or those of the publisher, the editors and the reviewers. Any product that may be evaluated in this article, or claim that may be made by its manufacturer, is not guaranteed or endorsed by the publisher.
Supplementary material
The Supplementary Material for this article can be found online at: https://www.frontiersin.org/articles/10.3389/fmars.2023.1279164/full#supplementary-material
References
Adey W. H., Steneck R. S. (2001). Thermogeography over time creates biogeographic regions: a temperature/space/time-integrated model and an abundance-weighted test for benthic marine algae. J. Phycol. 37, 677–698. doi: 10.1046/j.1529-8817.2001.00176.x
Ballesta-Artero I., Witbaard R., Carroll M. L., van der Meer J. (2017). Environmental factors regulating gaping activity of the bivalve Arctica islandica in Northern Norway. Mar. Biol. 164, 116. doi: 10.1007/s00227-017-3144-7
Beck J. W., Edwards R. L., Ito E., Taylor F. W., Recy J., Rougerie F., et al. (1992). Sea-Surface Temperature from coral skeletal Strontium/Calcium ratios. Science 257, 644–647. doi: 10.1126/science.257.5070.644
Begum S., Basova L., Heilmayer O., Philipp E. E. R., Abele D., Brey T. (2010). Growth and energy budget models of the bivalve Arctica islandica at six different sites in the Northeast Atlantic realm. J. Shellfish Res. 29, 107–115. doi: 10.2983/035.029.0103
Beirne E. C., Wanamaker A. D., Feindel S. C. (2012). Experimental validation of environmental controls on the δ13C of Arctica islandica (ocean quahog) shell carbonate. Geochim. Cosmochim. Acta 84, 395–409. doi: 10.1016/j.gca.2012.01.021
Belanger C. L., Jablonski D., Roy K., Berke S. K., Krug A. Z., Valentine J. W. (2012). Global environmental predictors of benthic marine biogeographic structure. Proc. Natl. Acad. Sci. U.S.A. 109, 14046–14051. doi: 10.1073/pnas.1212381109
Berg S., Kutra D., Kroeger T., Straehle C. N., Kausler B. X., Haubold C., et al. (2019). ilastik: interactive machine learning for (bio)image analysis. Nat. Methods 16, 1226–1232. doi: 10.1038/s41592-019-0582-9
Black B. A., Griffin D., van der Sleen P., Wanamaker A. D., Speer J. H., Frank D. C., et al. (2016). The value of crossdating to retain high-frequency variability, climate signals, and extreme events in environmental proxies. Glob. Change. Biol. 22, 2582–2595. doi: 10.1111/gcb.13256
Bogovic J. A., Hanslovsky P., Wong A., Saalfeld S. (2016) in 2016 IEEE 13th International Symposium on Biomedical Imaging (ISBI), Prague, Czech Republic: IEEE. 1123–1126. doi: 10.1109/ISBI.2016.7493463
Brosset C., Höche N., Shirai K., Nishida K., Mertz-Kraus R., Schöne B. R., et al. (2022). Strong coupling between biomineral morphology and Sr/Ca of Arctica islandica (Bivalvia)—Implications for shell Sr/Ca-based temperature estimates. Minerals 12, 500. doi: 10.3390/min12050500
Brosset C., Höche N., Witbaard R., Nishida K., Shirai K., Mertz-Kraus R., et al. (2023). Data for “Sr/Ca in shells of laboratory-grown bivalves (Arctica islandica) serves as a proxy for water temperature – Perspectives for (paleo)environmental research? doi: 10.5281/ZENODO.8249992
Butler P. G., Wanamaker A. D., Scourse J. D., Richardson C. A., Reynolds D. J. (2013). Variability of marine climate on the North Icelandic Shelf in a 1357-year proxy archive based on growth increments in the bivalve Arctica islandica. Palaeogeogr. Palaeoclimatol. Palaeoecol. 373, 141–151. doi: 10.1016/j.palaeo.2012.01.016
Cauquoin A., Werner M., Lohmann G. (2019). Water isotopes – climate relationships for the mid-Holocene and preindustrial period simulated with an isotope-enabled version of MPI-ESM. Clim. Past 15, 1913–1937. doi: 10.5194/cp-15-1913-2019
Corrège T. (2006). Sea surface temperature and salinity reconstruction from coral geochemical tracers. Palaeogeogr. Palaeoclimatol. Palaeoecol. 232, 408–428. doi: 10.1016/j.palaeo.2005.10.014
De Winter N. J., Witbaard R., Kocken I. J., Müller I. A., Guo J., Goudsmit B., et al. (2022). Temperature dependence of clumped isotopes (Δ 47 ) in aragonite. Geophys. Res. Lett. 49, 1–12. doi: 10.1029/2022GL099479
Dodd J. R. (1965). Environmental control of strontium and magnesium in Mytilus. Geochim. Cosmochim. Acta 29, 385–398. doi: 10.1016/0016-7037(65)90035-9
Dodd J. R., Crisp E. L. (1982). Non-linear variation with salinity of Sr/Ca and Mg/Ca ratios in water and aragonitic bivalve shells and implications for paleosalinity studies. Palaeogeogr. Palaeoclimatol. Palaeoecol. 38, 45–56. doi: 10.1016/0031-0182(82)90063-3
Dunca E., Mutvei H., Göransson P., Mörth C.-M., Schöne B. R., Whitehouse M. J., et al. (2009). Using ocean quahog (Arctica islandica) shells to reconstruct palaeoenvironment in Öresund, Kattegat and Skagerrak, Sweden. Int. J. Earth Sci. (Geol Rundsch) 98, 3–17. doi: 10.1007/s00531-008-0348-6
Eiler J. M. (2011). Paleoclimate reconstruction using carbonate clumped isotope thermometry. Quat. Sci. Rev. 30, 3575–3588. doi: 10.1016/j.quascirev.2011.09.001
Foster L. C., Allison N., Finch A. A., Andersson C. (2009). Strontium distribution in the shell of the aragonite bivalve Arctica islandica: Sr in the shell of Arctica islandica. Geochem. Geophys. Geosyst. 10, 1–14. doi: 10.1029/2007GC001915
Freitas P., Clarke L. J., Kennedy H., Richardson C., Abrantes F. (2005). Mg/Ca, Sr/Ca, and stable-isotope (δ 18 O and δ 13 C) ratio profiles from the fan mussel Pinna nobilis: Seasonal records and temperature relationships. Geochem. Geophys. Geosyst. 6, 1–16. doi: 10.1029/2004GC000872
Füllenbach C. S., Schöne B. R., Shirai K., Takahata N., Ishida A., Sano Y. (2017). Minute co-variations of Sr/Ca ratios and microstructures in the aragonitic shell of Cerastoderma edule (Bivalvia) – Are geochemical variations at the ultra-scale masking potential environmental signals? Geochim. Cosmochim. Acta 205, 256–271. doi: 10.1016/j.gca.2017.02.019
Gaetani G. A., Cohen A. L. (2006). Element partitioning during precipitation of aragonite from seawater: A framework for understanding paleoproxies. Geochim. Cosmochim. Acta 70, 4617–4634. doi: 10.1016/j.gca.2006.07.008
Gillikin D. P., De Ridder F., Ulens H., Elskens M., Keppens E., Baeyens W., et al. (2005). Assessing the reproducibility and reliability of estuarine bivalve shells (Saxidomus giganteus) for sea surface temperature reconstruction: Implications for paleoclimate studies. Palaeogeogr. Palaeoclimatol. Palaeoecol. 228, 70–85. doi: 10.1016/j.palaeo.2005.03.047
Goberville E., Beaugrand G., Sautour B., Tréguer P., Somlit T. (2010). Climate-driven changes in coastal marine systems of western Europe. Mar. Ecol. Prog. Ser. 408, 129–147. doi: 10.3354/meps08564
Hart S. R., Blusztajn J. (1998). Clams as recorders of ocean ridge volcanism and hydrothermal vent field activity. Science 280, 883–886. doi: 10.1126/science.280.5365.883
Höche N., Walliser E. O., de Winter N. J., Witbaard R., Schöne B. R. (2021). Temperature-induced microstructural changes in shells of laboratory-grown Arctica islandica (Bivalvia). PloS One 16, e0247968. doi: 10.1371/journal.pone.0247968
Höche N., Walliser E. O., Schöne B. R. (2022). Microstructural mapping of Arctica islandica shells reveals environmental and physiological controls on biomineral size. Front. Earth Sci. 9. doi: 10.3389/feart.2021.781305
Jochum K. P., Nohl U., Herwig K., Lammel E., Stoll B., Hofmann A. W. (2005). GeoReM: a new geochemical database for reference materials and isotopic standards. Geostand Geoanalyt Res. 29, 333–338. doi: 10.1111/j.1751-908X.2005.tb00904.x
Jochum K. P., Scholz D., Stoll B., Weis U., Wilson S. A., Yang Q., et al. (2012). Accurate trace element analysis of speleothems and biogenic calcium carbonates by LA-ICP-MS. Chem. Geol. 318-319. doi: 10.1016/j.chemgeo.2012.05.009
Jochum K. P., Weis U., Stoll B., Kuzmin D., Yang Q., Raczek I., et al. (2011). Determination of reference values for NIST SRM 610-617 glasses following ISO guidelines. Geostand Geoanal Res. 35, 397–429. doi: 10.1111/j.1751-908X.2011.00120.x
Jones D. S. (1981). Annual growth increments in shells of Spisula solidissima record marine temperature variability. Science 211, 165–167. doi: 10.1126/science.211.4478.165
Karney G. B., Butler P. G., Speller S., Scourse J. D., Richardson C. A., Schröder M., et al. (2012). Characterizing the microstructure of Arctica islandica shells using NanoSIMS and EBSD. Geochem. Geophys. Geosyst. 13, Q04002. doi: 10.1029/2011GC003961
Khare A., Hughes H. P., Schijf J., Kilbourne K. H. (2023). Apparently seasonal variations of the seawater Sr/Ca ratio across the Florida Keys Reef Tract. Geochem Geophys Geosyst 24, e2022GC010728. doi: 10.1029/2022GC010728
Lebrato M., Garbe-Schönberg D., Müller M. N., Blanco-Ameijeiras S., Feely R. A., Lorenzoni L., et al. (2020). Global variability in seawater Mg:Ca and Sr:Ca ratios in the modern ocean. Proc. Natl. Acad. Sci. U.S.A. 117, 22281–22292. doi: 10.1073/pnas.1918943117
Lebrato M., Garbe-Schönberg D., Müller M. N., Blanco-Ameijeiras S., Feely R. A., Lorenzoni L., et al. (2021). Correction for Lebrato et al., Global variability in seawater Mg:Ca and Sr:Ca ratios in the modern ocean. Proc. Natl. Acad. Sci. U.S.A. 118, e2119099118. doi: 10.1073/pnas.2119099118
Lohmann G., Schöne B. R. (2013). Climate signatures on decadal to interdecadal time scales as obtained from mollusk shells (Arctica islandica) from Iceland. Palaeogeogr. Palaeoclimatol. Palaeoecol. 373, 152–162. doi: 10.1016/j.palaeo.2012.08.006
Longerich H. P., Jackson S. E., Günther D. (1996). Laser ablation inductively coupled plasma mass spectrometric transient signal data acquisition and analyte concentration calculation. J. Anal. At. Spectrom. 11, 899–904. doi: 10.1039/JA9961100899
Marali S., Schöne B. R., Mertz-Kraus R., Griffin S. M., Wanamaker A. D., Butler P. G., et al. (2017). Reproducibility of trace element time-series (Na/Ca, Mg/Ca, Mn/Ca, Sr/Ca, and Ba/Ca) within and between specimens of the bivalve Arctica islandica – A LA-ICP-MS line scan study. Palaeogeogr. Palaeoclimatol. Palaeoecol. 484, 109–128. doi: 10.1016/j.palaeo.2016.11.024
Mavromatis V., Brazier J.-M., Goetschl K. E. (2022). Controls of temperature and mineral growth rate on Mg incorporation in aragonite. Geochim. Cosmochim. Acta 317, 53–64. doi: 10.1016/j.gca.2021.10.015
Menadakis M., Maroulis G., Koutsoukos P. G. (2008). Incorporation of Mg2+, Sr2+, Ba2+ and Zn2+ into aragonite and comparison with calcite. J. Math Chem. 46, 484–491. doi: 10.1007/s10910-008-9490-4
Paquette J., Reeder R. J. (1995). Relationship between surface structure, growth mechanism, and trace element incorporation in calcite. Geochim. Cosmochim. Acta 59, 735–749. doi: 10.1016/0016-7037(95)00004-J
Plummer L. N., Busenberg E. (1987). Thermodynamics of aragonite-strontianite solid solutions: Results from stoichiometric solubility at 25 and 76°C. Geochim. Cosmochim. Acta 51, 1393–1411. doi: 10.1016/0016-7037(87)90324-3
Roger L. M., George A. D., Shaw J., Hart R. D., Roberts M., Becker T., et al. (2017). Geochemical and microstructural characterization of two species of cool-water bivalves (Fulvia tenuicostata and Soletellina biradiata) from Western Australia. Biogeosciences 14, 1721–1737. doi: 10.5194/bg-14-1721-2017
Ropes J. H. (1984). Procedures for preparing acetate peels and evidence validating the annual periodicity of growth lines formed in the shells of ocean quahogs, Arctica islandica. Mar. Fish. Rev. 46, 27–35.
Rosenheim B. E., Swart P. K., Thorrold S. R., Willenz P., Berry L., Latkoczy C. (2004). High-resolution Sr/Ca records in sclerosponges calibrated to temperature in situ. Geol 32, 145. doi: 10.1130/G20117.1
Schindelin J., Arganda-Carreras I., Frise E., Kaynig V., Longair M., Pietzsch T., et al. (2012). Fiji: an open-source platform for biological-image analysis. Nat. Methods 9, 676–682. doi: 10.1038/nmeth.2019
Schmidt G. A., Annan J. D., Bartlein P. J., Cook B. I., Guilyardi E., Hargreaves J. C., et al. (2014). Using palaeo-climate comparisons to constrain future projections in CMIP5. Clim. Past 10, 221–250. doi: 10.5194/cp-10-221-2014
Schöne B. R., Fiebig J., Pfeiffer M., Gleβ R., Hickson J., Johnson A. L. A., et al. (2005). Climate records from a bivalved Methuselah (Arctica islandica, Mollusca; Iceland). Palaeogeogr. Palaeoclimatol. Palaeoecol. 228, 130–148. doi: 10.1016/j.palaeo.2005.03.049
Schöne B. R., Krause R. A. (2016). Retrospective environmental biomonitoring – Mussel Watch expanded. Global Planetary Change 144, 228–251. doi: 10.1016/j.gloplacha.2016.08.002
Schöne B. R., Marali S., Jantschke A., Mertz-Kraus R., Butler P. G., Fröhlich L. (2023). Can element chemical impurities in aragonitic shells of marine bivalves serve as proxies for environmental variability? Chem. Geol. 616, 121215. doi: 10.1016/j.chemgeo.2022.121215
Schöne B. R., Radermacher P., Zhang Z., Jacob D. E. (2013). Crystal fabrics and element impurities (Sr/Ca, Mg/Ca, and Ba/Ca) in shells of Arctica islandica—Implications for paleoclimate reconstructions. Palaeogeogr. Palaeoclimatol. Palaeoecol. 373, 50–59. doi: 10.1016/j.palaeo.2011.05.013
Schöne B. R., Zhang Z., Radermacher P., Thébault J., Jacob D. E., Nunn E. V., et al. (2011). Sr/Ca and Mg/Ca ratios of ontogenetically old, long-lived bivalve shells (Arctica islandica) and their function as paleotemperature proxies. Palaeogeogr. Palaeoclimatol. Palaeoecol. 302, 52–64. doi: 10.1016/j.palaeo.2010.03.016
Shannon R. D. (1976). Revised effective ionic radii and systematic studies of interatomic distances in halides and chalcogenides. Acta Cryst A 32, 751–767. doi: 10.1107/S0567739476001551
Shirai K., Takahata N., Yamamoto H., Omata T., Sasaki T., Sano Y. (2008). Novel analytical approach to bivalve shell biogeochemistry: A case study of hydrothermal mussel shell. Geochem. J. 42, 413–420. doi: 10.2343/geochemj.42.413
Shirai K., Schöne B. R., Miyaji T., Radarmacher P., Krause R. A., Tanabe K. (2014). Assessment of the mechanism of elemental incorporation into bivalve shells (Arctica islandica) based on elemental distribution at the microstructural scale. Geochim. Cosmochim. Acta 126, 307–320. doi: 10.1016/j.gca.2013.10.050
Stecher H. A., Krantz D. E., Lord C. J., Luther G. W., Bock K. W. (1996). Profiles of strontium and barium in Mercenaria mercenaria and Spisula solidissima shells. Geochim. Cosmochim. Acta 60, 3445–3456. doi: 10.1016/0016-7037(96)00179-2
Surge D., Walker K. J. (2006). Geochemical variation in microstructural shell layers of the southern quahog (Mercenaria campechiensis): Implications for reconstructing seasonality. Palaeogeography Palaeoclimatology Palaeoecol. 237, 182–190. doi: 10.1016/j.palaeo.2005.11.016
Toland H., Perkins B., Pearce N., Keenan F., Leng M. J. (2000). A study of sclerochronology by laser ablation ICP-MS. J. Anal. At. Spectrom. 15, 1143–1148. doi: 10.1039/b002014l
Tynan S., Opdyke B. N., Walczak M., Eggins S., Dutton A. (2017). Assessment of Mg/Ca in Saccostrea glomerata (the Sydney rock oyster) shell as a potential temperature record. Palaeogeography Palaeoclimatology Palaeoecol. 484, 79–88. doi: 10.1016/j.palaeo.2016.08.009
van der Walt S., Schönberger J. L., Nunez-Iglesias J., Boulogne F., Warner J. D., Yager N., et al. (2014). scikit-image: image processing in Python. PeerJ 2, e453. doi: 10.7717/peerj.453
Węsławski J. M., Kendall M. A., Włodarska-Kowalczuk M., Iken K., Kędra M., Legezynska J., et al. (2011). Climate change effects on Arctic fjord and coastal macrobenthic diversity—Observations and predictions. Mar. Biodiv 41, 71–85. doi: 10.1007/s12526-010-0073-9
Wanamaker A. D., Butler P. G., Scourse J. D., Heinemeier J., Eiríksson J., Knudsen K. L., et al. (2012). Surface changes in the North Atlantic meridional overturning circulation during the last millennium. Nat. Commun. 3, 1–7. doi: 10.1038/ncomms1901
Wanamaker A. D., Gillikin D. P. (2019). Strontium, magnesium, and barium incorporation in aragonitic shells of juvenile Arctica islandica: Insights from temperature controlled experiments. Chem. Geol. 526, 117–129. doi: 10.1016/j.chemgeo.2018.02.012
Wanamaker A. D., Griffin S. M., Ummenhofer C. C., Whitney N. M., Black B., Parfitt R., et al. (2019). Pacific climate influences on ocean conditions and extreme shell growth events in the Northwestern Atlantic (Gulf of Maine). Clim Dyn 52, 6339–6356. doi: 10.1007/s00382-018-4513-8
Wanamaker A. D., Heinemeier J., Scourse J. D., Richardson C. A., Butler P. G., Eiríksson J., et al. (2008a). Very long-lived mollusks confirm 17th century AD tephra-based radiocarbon reservoir ages for north Icelandic shelf waters. Radiocarbon 50, 399–412. doi: 10.1017/S0033822200053510
Wanamaker A. D. Jr., Kreutz K. J., Wilson T., Borns H. W. Jr., Introne D. S., Feindel S. (2008b). Experimentally determined Mg/Ca and Sr/Ca ratios in juvenile bivalve calcite for Mytilus edulis: implications for paleotemperature reconstructions. Geo-Mar Lett. 28, 359–368. doi: 10.1007/s00367-008-0112-8
Watson E. B. (1996). Surface enrichment and trace-element uptake during crystal growth. Geochim. Cosmochim. Acta 60, 5013–5020. doi: 10.1016/S0016-7037(96)00299-2
Watson E. B. (2004). A conceptual model for near-surface kinetic controls on the trace-element and stable isotope composition of abiogenic calcite crystals. Geochim. Cosmochim. Acta 68, 1473–1488. doi: 10.1016/j.gca.2003.10.003
Witbaard R., Franken R., Visser B. (1997). Growth of juvenile Arctica islandica under experimental conditions. Helgoländer Meeresunters. 51, 417–431. doi: 10.1007/BF02908724
Witbaard R., Jenness M. I., van der Borg K., Ganssen G. (1994). Verification of annual growth increments in Arctica islandica L. from the North Sea by means of oxygen and carbon isotopes. J. Sea Res. 33, 91–101. doi: 10.1016/0077-7579(94)90054-X
Yan H., Shao D., Wang Y., Sun L. (2013). Sr/Ca profile of long-lived Tridacna gigas bivalves from South China Sea: A new high-resolution SST proxy. Geochim. Cosmochim. Acta 112, 52–65. doi: 10.1016/j.gca.2013.03.007
Zacherl D., Gaines S. D., Lonhart S. I. (2003). The limits to biogeographical distributions: insights from the northward range extension of the marine snail, Kelletia kelletii (Forbes 1852): Northward range extension of Kelletia kelletii. J. Biogeogr. 30, 913–924. doi: 10.1046/j.1365-2699.2003.00899.x
Keywords: bivalve sclerochronology, water temperature proxy, strontium-to-calcium ratio, shell ultrastructure, growth rate
Citation: Brosset C, Höche N, Witbaard R, Nishida K, Shirai K, Mertz-Kraus R and Schöne BR (2023) Sr/Ca in shells of laboratory-grown bivalves (Arctica islandica) serves as a proxy for water temperature – implications for (paleo)environmental research? Front. Mar. Sci. 10:1279164. doi: 10.3389/fmars.2023.1279164
Received: 17 August 2023; Accepted: 16 October 2023;
Published: 26 October 2023.
Edited by:
Hali Kilbourne, University of Maryland Center for Environmental Science, United StatesReviewed by:
Madelyn Mette, United States Department of the Interior, United StatesJustin P. Dodd, Northern Illinois University, United States
Copyright © 2023 Brosset, Höche, Witbaard, Nishida, Shirai, Mertz-Kraus and Schöne. This is an open-access article distributed under the terms of the Creative Commons Attribution License (CC BY). The use, distribution or reproduction in other forums is permitted, provided the original author(s) and the copyright owner(s) are credited and that the original publication in this journal is cited, in accordance with accepted academic practice. No use, distribution or reproduction is permitted which does not comply with these terms.
*Correspondence: Cornélia Brosset, cornelia.brosset@uni-mainz.de; Bernd R. Schöne, bernd.schoene@uni-mainz.de