A global unstructured, coupled, high-resolution hindcast of waves and storm surge
 Lorenzo Mentaschi1*
  Michalis I. Vousdoukas2
  Guillermo García-Sánchez3,4
  Tomás Fernández-Montblanc5
  Aron Roland6
  Evangelos Voukouvalas7
  Ivan Federico8
  Ali Abdolali9,10
  Yinglong J. Zhang11
  Luc Feyen12*
- 1Department of Physics and Astronomy “Augusto Righi” (DIFA), University of Bologna, Bologna, Italy
- 2Department of Marine Sciences, University of the Aegean, Mytilene, Greece
- 3Instituto de Ciencias Matemáticas, Consejo Superior de Investigaciones Científicas (CSIC), Madrid, Spain
- 4Escuela Técnica Superior de Ingenieros de Telecomunicación, Universidad Politécnica de Madrid, Madrid, Spain
- 5Earth Sciences Department, University of Cadiz Instituto Universitario de Investigación Marina (INMAR), Puerto Real, Spain
- 6BGS IT and E, Darmstadt, Hesse, Germany
- 7Unisystems Luxembourg Sarl, Bertrange, Luxembourg
- 8Fondazione Centro Euro-Mediterraneo sui Cambiamenti Climatici (CMCC), Lecce, Italy
- 9US Army Engineer Research and Development Center, Coastal and Hydraulics Laboratory, Vicksburg, MS, United States
- 10Earth System Science Interdisciplinary Center (ESSIC), University of Maryland, College Park, MD, United States
- 11Center for Coastal Resource Management, Virginia Institute of Marine Science, College of William & Mary, Gloucester Point, VA, United States
- 12European Commission, Joint Research Centre (JRC), Ispra, Italy
Accurate information on waves and storm surges is essential to understand coastal hazards that are expected to increase in view of global warming and rising sea levels. Despite the recent advancement in development and application of large-scale coastal models, nearshore processes are still not sufficiently resolved due to coarse resolutions, transferring errors to coastal risk assessments and other large-scale applications. Here we developed a 73-year hindcast of waves and storm surges on an unstructured mesh of >650,000 nodes with an unprecedented resolution of 2-4 km at the global coast. Our modelling system is based on the circulation model SCHISM that is fully coupled with the WWM-V (WindWaveModel) and is forced by surface winds, pressure, and ice coverage from the ERA5 reanalysis. Results are compared with observations from satellite altimeters, tidal gauges and buoys, and show good skill for both Sea Surface Height (SSH) and Significant Wave Height (Hs), and a much-improved ability to reproduce the nearshore dynamics compared with previous, lower-resolution studies. Besides SSH, the modelling system also produces a range of other wave-related fields at each node of the mesh with a time step of 3 hours, including the spectral parameters of the first three largest energy peaks. This dataset offers the potential for more accurate global-scale applications on coastal hazard and risk.
Introduction
Waves and storm surges are complex oceanographic phenomena that can have significant impacts on coastal communities, particularly during extreme weather events such as hurricanes, typhoons, and extratropical cyclones. Global warming is expected to increase extreme sea levels and coastal flooding around the world (McGranahan et al., 2007; Wahl et al., 2017; Vousdoukas et al., 2018; Tebaldi et al., 2021). To better understand trends in past and future coastal hazards and risks there is a growing need for accurate modeling of waves and storm surge at a global scale, incorporating the mutual impact of wind-waves and storm surge models in a coupled framework. In the last decades, advances in numerical modeling, computing power and availability of coastal observations (in-situ and remote sensing) have enabled the development of global models of waves and storm surges that can provide valuable information for coastal hazard assessment and risk management (e.g. Vousdoukas et al., 2020). The skill of existing large scale coastal hindcasts and reanalyses is generally good when compared versus satellite observations offshore. Closer to shores, however, complex coastal and bathymetric features and interactions hamper the ability of existing models to fully capture the relevant dynamics, partly due to their low resolution and the lack of coupling waves and circulation. In addition, the dynamic interaction of coastal circulation, wind wave, inland hydrology, ice and atmospheric models are not fully captured in standalone or 1 way coupled fashion (Moghimi et al., 2020; Abdolali et al., 2021).
In recent years, unstructured-grid models are more and more becoming an alternative to regular grids for large-scale simulations. These models are flexible by employing meshes with varying resolution that can be adjusted to fit any arbitrary geometry, making them ideal for modeling coastal environments with irregular coastlines, complex bathymetry and structures. The history of unstructured wave and storm surge models dates back to the 1990s when researchers began exploring the use of finite element and finite volume numerical methods to solve differential equations (e.g. Luettich et al., 1992; Lynch et al., 1996), and they soon became a consolidated tool for coastal modelling. Nowadays, among the established circulation unstructured models are ADCIRC (Luettich et al., 1992; Pringle et al., 2021), the Finite-Volume Coastal Ocean Model (FVCOM, Chen et al., 2003), the Semi-implicit Cross-scale Hydroscience Integrated System Model (SCHISM, Zhang and Baptista, 2008; Zhang et al., 2016), the System of HydrodYnamic Finite Element Modules (SHYFEM, Umgiesser and Zampato, 2001; Micaletto et al., 2022), the model TELEMAC (Hervouet and Bates, 2000).
Among the earliest spectral wave models employing numerical schemes unstructured grids were the model TOMAWAC (Benoit et al., 1997) and CREST e.g. Ardhuin and Herbers, 2005), which solve the wave action balance equation (WAE) based on semi-Lagrangian schemes. In the following other models developed, which solve the WAE based on a Eulerian viewpoint, in analogy to the mostly applied models based on structured grids (WAM, WW3, SWAN), which have been WWM (Hsu et al., 2005; Roland et al., 2005; Hsu et al., 2008) and MIKE2-SW (Sørensen et al., 2004).
In the following decade the development of the Eulerian-approach gained further momentum and mostly all of the available spectral wave models have been enhanced for the possibility to apply unstructured grids (e.g. Roland, 2008 (WWM-II), 2012b (WAM), Zijlema and Stelling, 2008 (UnSWAN), Qi et al., 2009 (FVCOM)).
The schemes developed in Roland, 2008 included efficient implicit schemes to overcome the strict CFL constraint and resulted in WWM-II, which was fully coupled to SCHISM and parallelized using Domain Decomposition methods and lead to WWM-III, Roland et al., 2012). The latest efforts in Sikirić et al., 2019 and further development in this study resulted in the latest Version of the wind wave model (WWM-V), which was utilized in this study. We have validated the implicit schemes in WWM-V and compared those to the latest WW3 version, which showed only marginally worse performance for the global setup. Furthermore, the integration of the triads by applying Patankar rules (Patankar, 1980) and underrelaxation of the wave breaking and triad source term to increase the robustness of the model have improved in the implicit scheme. Moreover, the memory management in the model was improved in terms of memory alignment, memory usage and cache locality, which improved the performance of the model in contrast to WWM-III.
Most of the elements have been implemented in the actual “development” Version of the WW3 Framework. The implementation of implicit solvers as done helped provided an opportunity to further develop the wave models to resolve the dominant coastal processes (Abdolali et al., 2020).
For long, the use of unstructured meshes was confined to local high-resolution studies that deepened insights into the complexity of nearshore interactions (e.g. Roland, 2008; Bertin et al., 2012; Roland et al., 2012; Federico et al., 2017; Amores et al., 2020; Park et al., 2022). Large/global scale unstructured models of circulation and storm surges were developed in the late 2010s (e.g. Muis et al., 2016; Vousdoukas et al., 2018; Fernández-Montblanc et al., 2020; Saillour et al., 2021). Recently, Zhang et al. (2023) developed a global 3D baroclinic model that includes tides using SCHISM. Existing global studies on circulation and storm surges can reach high spatial resolution at large scale. For example, Wang et al. (2022) reaches a global resolution of about 1.25 km. Zhang et al. (2023) have an offshore resolution of 10-15 km, and nearshore of 3 km globally and 1-2 km in North America.
For waves, the adoption of unstructured meshes at large scale was slower, related to the high computational demand of spectral wave models. The first study using unstructured local subgrids in a global wave model was (Rascle and Ardhuin, 2013). More recent applications pioneered the viability of global unstructured wave models (Mentaschi et al., 2020; Brus et al., 2021), though retaining a relatively low resolution at the global coast of ~10 km. This was achieved thanks to the adoption of efficient domain decomposition techniques and governance of the CFL number (Abdolali et al., 2020), and of subscale modelling techniques that simplify the workload of mesh generation by introducing a parameterization of wave dampening due to unresolved features (Mentaschi et al., 2015b; Mentaschi et al., 2018). Also worth mentioning, there are studies on large basins like the Mediterranean Sea, reaching very high spatial resolution in the order of 100 m, carried out with WW3 and WWM (Lira-Loarca et al., 2022; Toomey et al., 2022).
Another important aspect of ocean modelling is the coupling between waves and circulation. Wind waves can alter circulation in the ocean and affect the surface roughness and near-surface turbulence, while currents can influence the propagation and characteristics of waves, via Doppler effect, whitecapping when propagating against counter currents and by fostering non-linear interactions. Accounting for this coupling is important for accurate modelling, especially in nearshore environments. The coupling of waves and circulation was explored in a number of local studies (e.g. Ferrarin et al., 2008; Roland et al., 2009; Babanin et al., 2011; Roland et al., 2012; Staneva et al., 2016; Clementi et al., 2017; Causio et al., 2021), and only recently global applications were developed (e.g. Law-Chune et al., 2021). Incorporation of variability of water level (tide + surge) in the wave model and inland hydrology enhance the model accuracy in nearshore and provided better estimates of wetting and drying and compound flooding (Bakhtyar et al., 2020; Moghimi et al., 2020).
Taking advantage of these recent advances, here we developed a global coupled model that simulates waves and storm surges on an unstructured mesh with an unprecedented resolution at the coasts of 2-4 km globally. The coupled model combines the circulation model SCHISM (Zhang et al., 2016) and the spectral wave model WWM (Roland, 2008) and is forced by the latest-generation atmosphere reanalysis ERA5 (Hersbach et al., 2020). With this setup, we carried out a 53-year hindcast of waves and storm surges and present here its validation versus satellite and field observations, and a comparison with results from prior lower-resolution studies.
Materials and methods
Model setup
Our modelling framework consists of the Semi-implicit Cross-scale Hydroscience Integrated System Model (SCHISM, Zhang et al., 2016; Zhang et al., 2023) that is 2-way coupled with the 3rd-generation spectral wave model Wind Wave Model (WWM-V, Roland et al., 2012; Sikirić et al., 2019).
SCHISM is an extension of the original SELFE code (Zhang and Baptista, 2008) that has undergone several enhancements and upgrades, including the inclusion of large-scale eddying and a seamless cross-scale capability from small bodies of water to the ocean. The model solves the Navier-Stokes equation, under hydrostatic and Boussinesq approximation, on unstructured grids, using a Finite-Element semi-implicit Galerkin scheme for horizontal motions, and a Finite-Volume scheme for vertical motions. The model accounts for the combined effects of wind and atmospheric pressure gradients. In this study, SCHISM was configured in its two-dimensional barotropic mode, which increases model efficiency and is a reasonable approximation for global applications with high computational and storage requirements (Fernández-Montblanc et al., 2019). In this work, SCHISM was used to simulate the generation and propagation of storm surges. The surface stress in SCHISM was calculated using a bulk formula with the drag coefficient computed estimated as a function of the wave motion. The bed shear stress was computed using the Manning approach, assuming a value of 0.02 for the Manning friction coefficient. A biharmonic viscosity filter with a diffusion number-like dimensionless constant of 0.025 is used to suppress grid-scale noises.
WWM-V is a 3rd-generation state-of-the-art spectral wave model that solves the wave action equation on unstructured grids using the CRD-N-Scheme (e.g. Ricchiuto et al., 2005) for the advection part and discreitzing the spectral part using simple 1st order implicit finite difference schemes, rending the whole approach monotone and convergent. For the integration, the source terms have been linearized (e.g. Patankar, 1980; Patankar, 1981) and if the linearization was not possible, we have underrelaxed the source terms as done for the triad-wave-wave interactions source term. For this study we employed the fully implicit RD-schemes with no splitting, using a Block-Gauss & Jacobi iterative solvers (e.g. Abdolali et al., 2020) on unstructured grids. The spectral domain used in this study consists of 36 frequencies and 24 directions. The frequencies are separated by a constant factor, from 0.04 Hz, corresponding to a period of 25 s, to 1 Hz, corresponding to a period of 1 second. The growth/dissipation of the waves was parameterized using (Ardhuin et al., 2010), setting the parameter BETAMAX to the value suggested for ECMWF data, while the non-linear interactions are reproduced by means of the Discrete Interaction Approximation (DIA) (Hasselmann and Hasselmann, 1985). With a resolution of 2 km along coasts, shallow-water interactions can play a significant role. In particular, the bottom friction was parameterized using the JONSWAP approximation (Hasselmann et al., 1973). Depth-limited breaking was represented using the approach by (Battjes and Janssen, 1978). In particular, the Unresolved Obstacles Source Term (UOST, Mentaschi et al., 2015b; Mentaschi et al., 2018; Mentaschi et al., 2019; Mentaschi et al., 2020) was introduced to parameterize the energy dampening of small unresolved islands. Furthermore, as ice plays an important role on wave dynamics at high latitudes, an approach based on UOST was implemented to dampen the energy as a function of the ice concentration. No treatment of ice was adopted in the circulation model. Finally, the methodology proposed by (Tracy et al., 2006) for spectral decomposition was implemented in the model. This approach allows for saving the mean parameter for the separate peaks of the wave spectrum, providing summarized information on the spectra at each node.
The models are 2-way coupled, in that the hydrodynamic component provides the wave model with current velocities and sea levels, while the sea wind stress is estimated by WWM-V within the growth-dissipation source term ST4 (Ardhuin et al., 2010) and passed back to SCHISM. In this parameterization the sea surface roughness is a function of the wave age according to (Janssen, 1989). The beneficial effect of such coupling on both waves and circulation was shown in several past studies, in particular with regards to sea levels and extreme conditions (Brown and Wolf, 2009; Bertin et al., 2012; Bertin et al., 2015; Staneva et al., 2016; Clementi et al., 2017).
The hindcast simulation was carried out on an unstructured mesh of 651,652 nodes covering the global ocean with a resolution ranging from about 50 km offshore to about 2-4 km nearshore globally. The mesh was generated using the OceanMesh2D tool (Roberts et al., 2019). The bathymetry was taken from the General Bathymetric Chart of the Oceans (GEBCO) dataset (Weatherall et al., 2015). The model was forced with hourly data of sea level pressure, wind speed and sea ice concentration from the fifth-generation reanalysis ERA5 (Hersbach et al., 2020). Apart from its resolution of 25 km, high for a global reanalysis, we selected ERA5 for its extended time span (from 1950 on), and its accuracy, compared to other products, in reproducing long-term trends (Erikson et al., 2022). The model time step was 400 s for both the circulation component and the wave component, with circulation-wave coupling occurring at each time step. The time span of the simulation is from 1950 to 2022. Model output was saved at each domain node with a time frequency of 3 hours for the variables listed in Table 1.
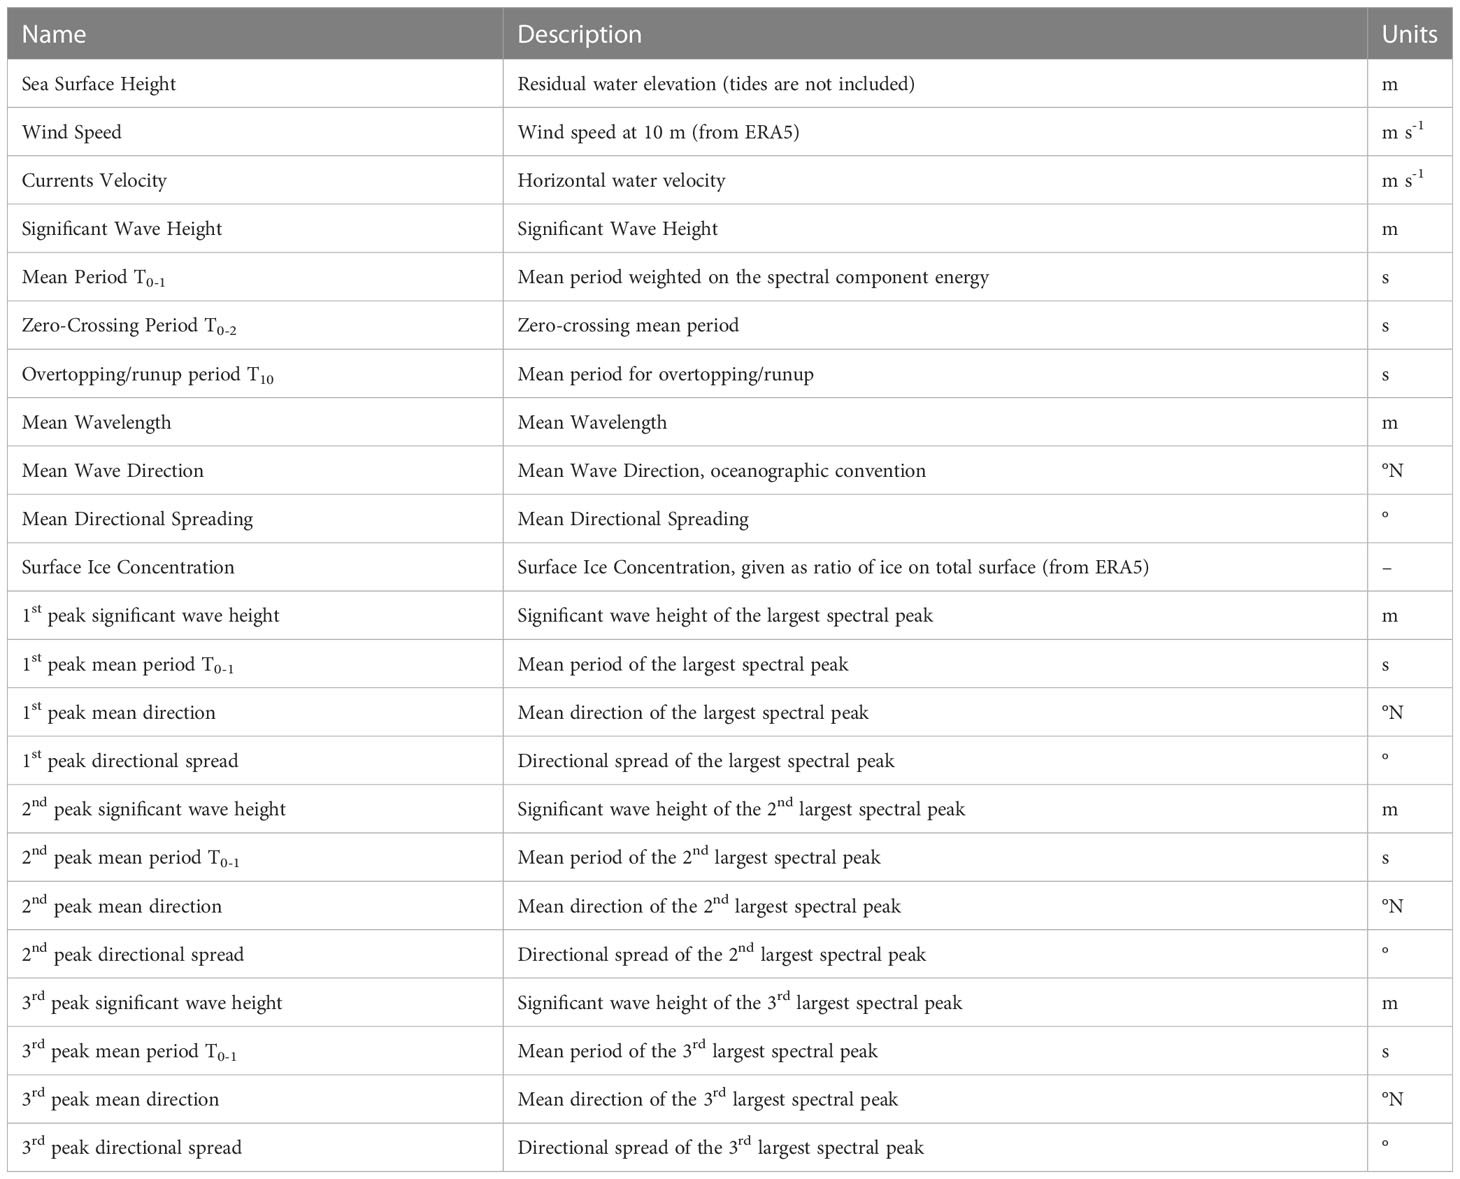
Table 1 List of variables saved at each mesh node with a 3-hour time step.
Model performance evaluation
SSH and Hs exhibit different statistical properties that require different treatments of the signal in the validation. Specifically, Hs is always positive, allowing for an easy-to-read interpretation of indicators such as Bias and Root Mean Squared Error as fractions of the mean Hs, by means of a normalization. On the other hand, SSH can be negative and the mean value of SSH may be close to 0. Therefore, the normalization often used for Hs is not meaningful for SSH. Additionally, our model is unable to replicate long-term trends in SSH observed in the data, such as Sea Level Rise (SLR). As a result, it was necessary to remove these trends from both the observations and the model output prior to the validation, and an indicator such as the Bias, which for Hs is a proxy of systematic error, loses its meaning for SSH. In the reminder of this section, the different signal treatments and error indicators used for SSH and Hs are explained.
Sea surface height
Modelled Sea Surface Height (SSH) was compared globally versus along-track altimetry data from the Copernicus Marine Service (CMS) (Pujol et al., 2022), which comprises several altimeter missions (Topex-Poseidon, Jason-1, OSTM/Jason-2, Sentinel-3A, ERS-1, ERS-2, Envisat, Geosat Follow On, Cryosat, SARAL/AltiKa, HY-2A) from 1993 ongoing. The dataset includes all the atmospheric forcing contributions to sea level variation, included as a linear component to the overall Sea Level Anomaly (SLA). The model output was space-time interpolated to the corresponding points along the tracks. The paired observation and modelled values were then binned on a validation grid with a spatial resolution of 0.5°x0.5° and the skill was evaluated for each cell.
In addition to the SSH validation at the open ocean, the performance of the nearshore SSH was assessed versus the tidal gauge data provided by the GESLA-2 database (Woodworth et al., 2016; Haigh et al., 2022). The astronomical tide was removed from the station data by means of tidal analysis on an annual basis, using the classical harmonic analysis tool developed by (Pawlowicz et al., 2002).
As our barotropic model is unable to reproduce low-frequency variability of sea levels and Sea Level Rise, both simulations and observations of SSH were detrended prior to comparison.
The statistical indicators used to quantify the skill both of the offshore and nearshore SSH are:
* Root Mean Squared Error (RMSESSH):
where N is the number of observation-simulation pairs, and
and are the modelled and observed SSH, respectively.
• Normalized Root Mean Squared Error, NRMSESSH, similar to RMSE but normalized by the difference between the 1st and 99th percentile of the observed water levels:
This normalization allows an easy-to-read expression of the error as a percentage of the observation range.
• Pearson correlation:
where and are the mean modelled and observed SSH, and and are the standard deviations of the 2 signals.
To assess the behavior of the model in normal and extreme water level conditions, the skill indicators were evaluated a) on the whole time series and b) on the data beyond the 95th percentile of the model or observation of each cell/tidal gauge.
Waves
The modelled significant wave height Hs was validated with the along-track altimetry Hs data provided by CMS, in collaboration with the Climate Change Initiative (CCI) of the European Space Agency (ESA) (Dodet et al., 2020). Similar to SSH, the model data were space-time interpolated to the points along the satellite tracks, and binned on the same validation grid. Hs was also compared with buoy data from a dataset of wave buoys from different sources, including the National Buoy Data Center (NDBC) and the European Marine Observation and Data Network (EMODnet).
The statistical indicators used to quantify the skill of significant wave height are:
• Normalized Bias (NBI):
where
and are the modelled and observed significant wave height, respectively. This indicator is a proxy of the model’s systematic error expressed as a percentage of the mean significant wave height (e.g. Mentaschi et al., 2013).
* The Root Mean Squared Error (RMSEHs) with a definition similar to that of SSH:
• Normalized Root Mean Squared Error (NRMSEHs):
Similar to NRMSESSH, the normalization in eq. 6 allows an easy-to-read expression of the error as a percentage of the observational range.
Similar to SSH, the behavior of the model was assessed both in normal and extreme conditions of Hs.
Results
The model shows overall good skill of SSH versus altimeters, with an average RMSESSH of about 8 cm, a NRMSESSH of 17.47%, and a Pearson correlation of 0.55. In large portions of the global ocean RMSESSH is below 6 cm, NRMSESSH is below 10% and the correlation is > 0.7 (Figures 1A, 2). The model performance decreases in areas characterized by low-frequency variability, for example in correspondence with western-boundary currents. This is clear at the Gulf Stream, the Kuroshio current, the Brazil current, at the Mozambique current and the gradient between the latter and the Southern Atlantic and Southern Indian currents, and the Eastern Australia current, especially when the model skill is evaluated in terms of RMSESSH (Figure 1A). Model performance expressed in terms of relative indicators such as NRMSESSH and correlation also varies with latitude. At higher latitudes both north- and southward correlation is higher and NRMSESSH lower, whereas closer to the equator the correlation becomes non-significant, despite NRMSESSH values in the order of 20% or lower (Figure 2). For several semi-enclosed basins, such as the Mediterranean Sea, the Red Sea, the Persian Gulf, the East China Sea, part of the South China Sea, the Gulf of Thailand, the Arafura Sea, the correlation is significantly higher than in open-ocean areas at the same latitude. Higher values beyond the 95th percentile of SSH are to be expected as the normalization term is the same as for the whole signal. The map of NRMSESSH beyond the 95th percentile presents spatial patterns similar to the ones found for the whole signal, but with higher relative uncertainty at the western boundary currents and at some section of the Southern Circumpolar Current (Figure 3A). The correlation model-altimeters beyond the 95th percentile shows a general improvement over the whole signal, with r > 0.9 in large swaths of the domain, and significant values of the correlation even in proximity of the equator (Figure 3A).
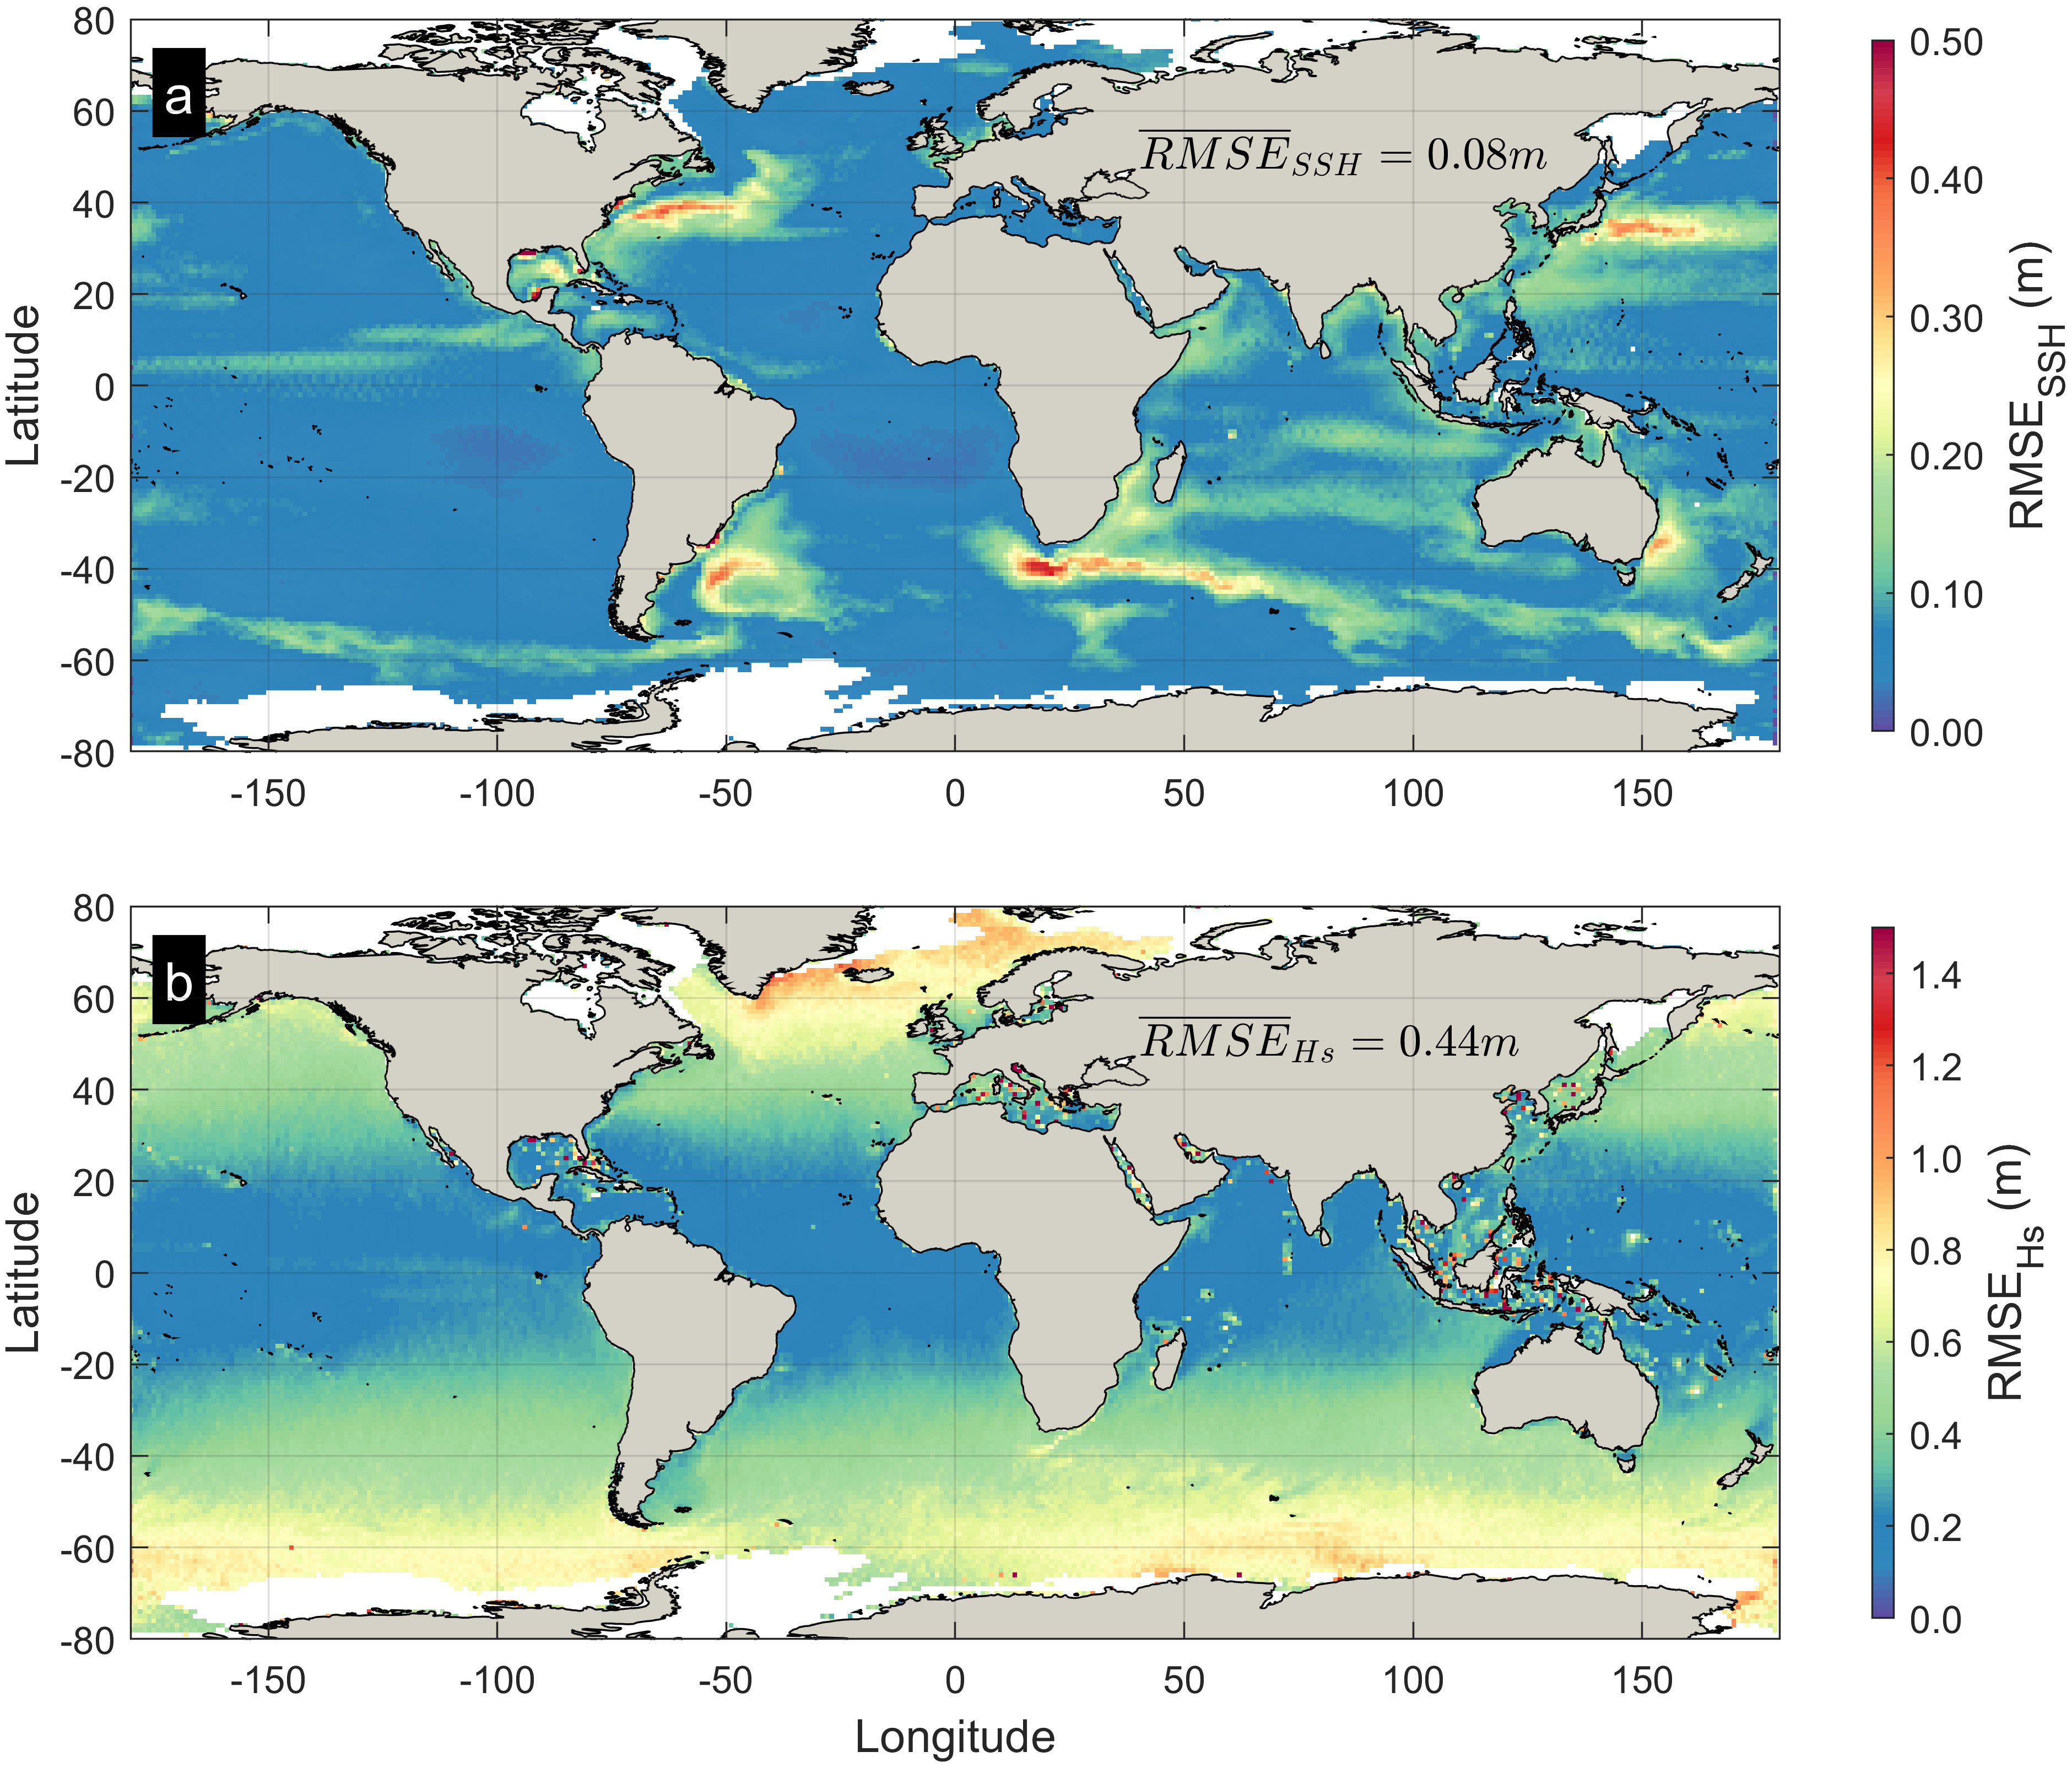
Figure 1 Maps of RMSE for SSH (A) and Hs (B).

Figure 2 Skill for Sea Surface Height (SSH), model vs altimeters, (A) percentage Root Mean Square Error NRMSESSH, (B) Pearson Correlation.
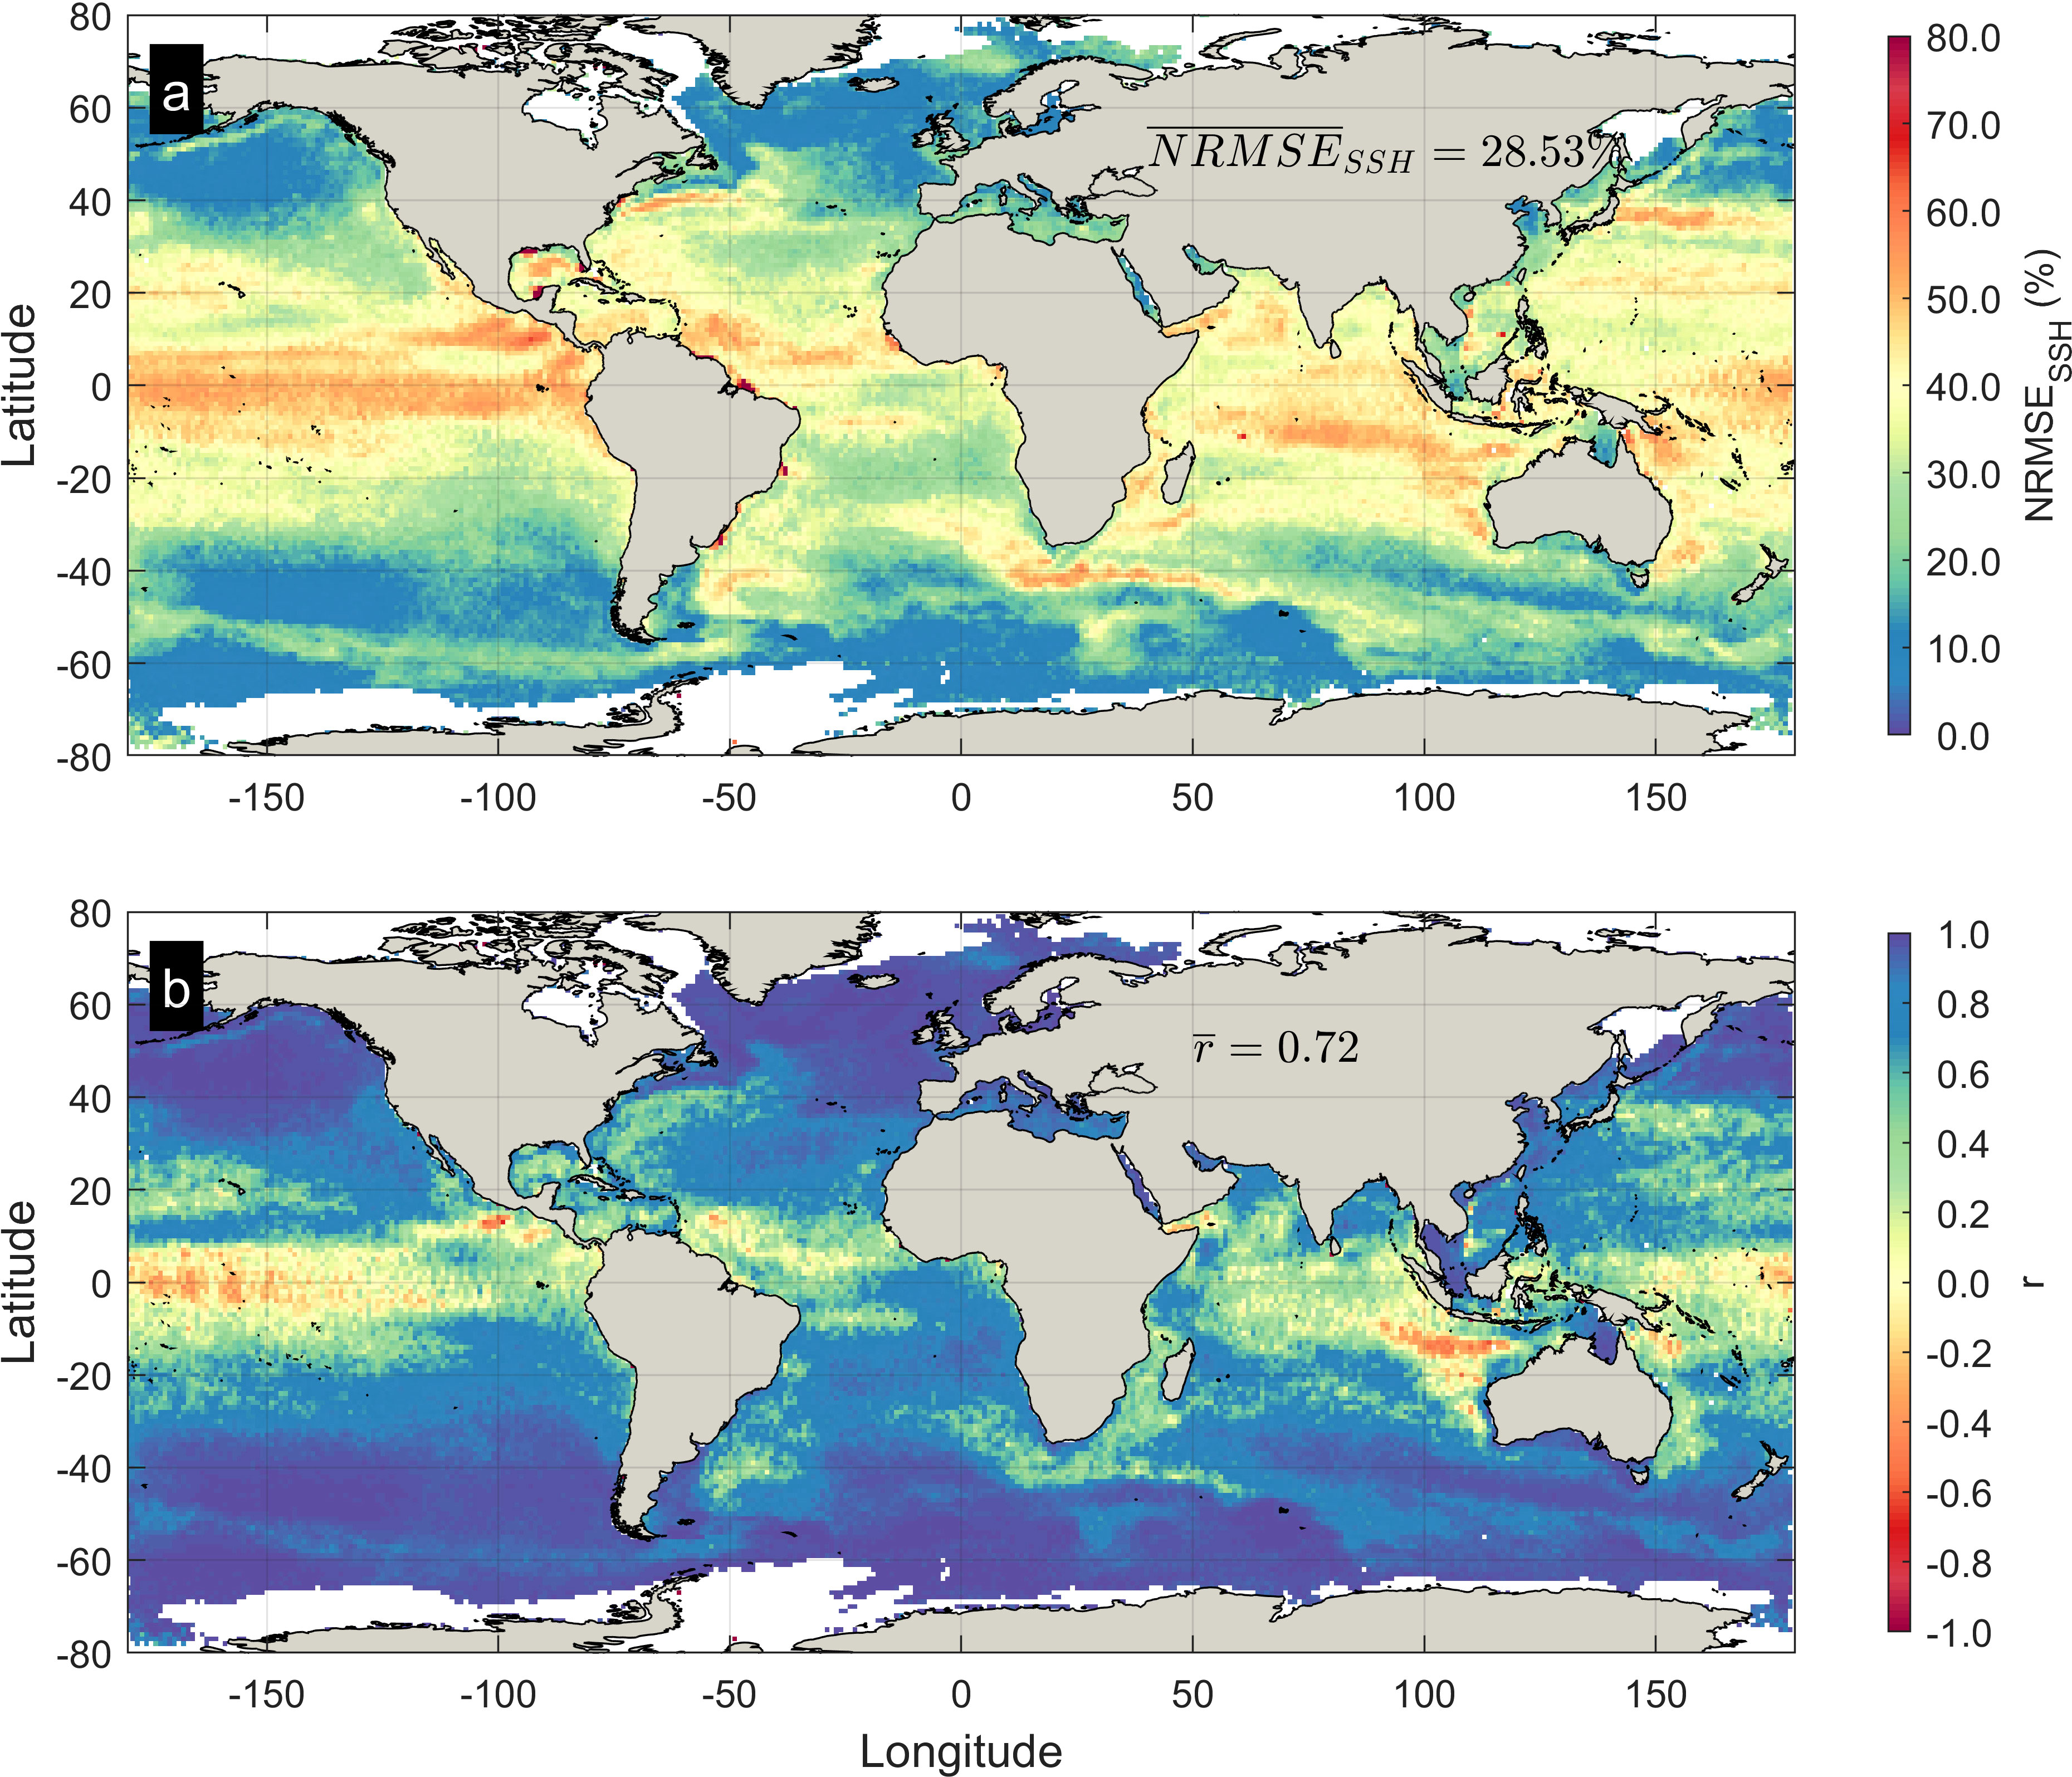
Figure 3 Skill for Sea Surface Height (SSH) >95th percentile, model vs altimeters, (A) percentage Root Mean Square Error NRMSESSH, (B) Pearson Correlation.
The comparison of simulated SSH with tidal gauge records shows similar model performance compared to altimeters. There is overall good skill, especially at higher latitudes for both mean (Figure 4) and extreme conditions (Figure 5), and also for tidal gauges located in proximity to the coast.
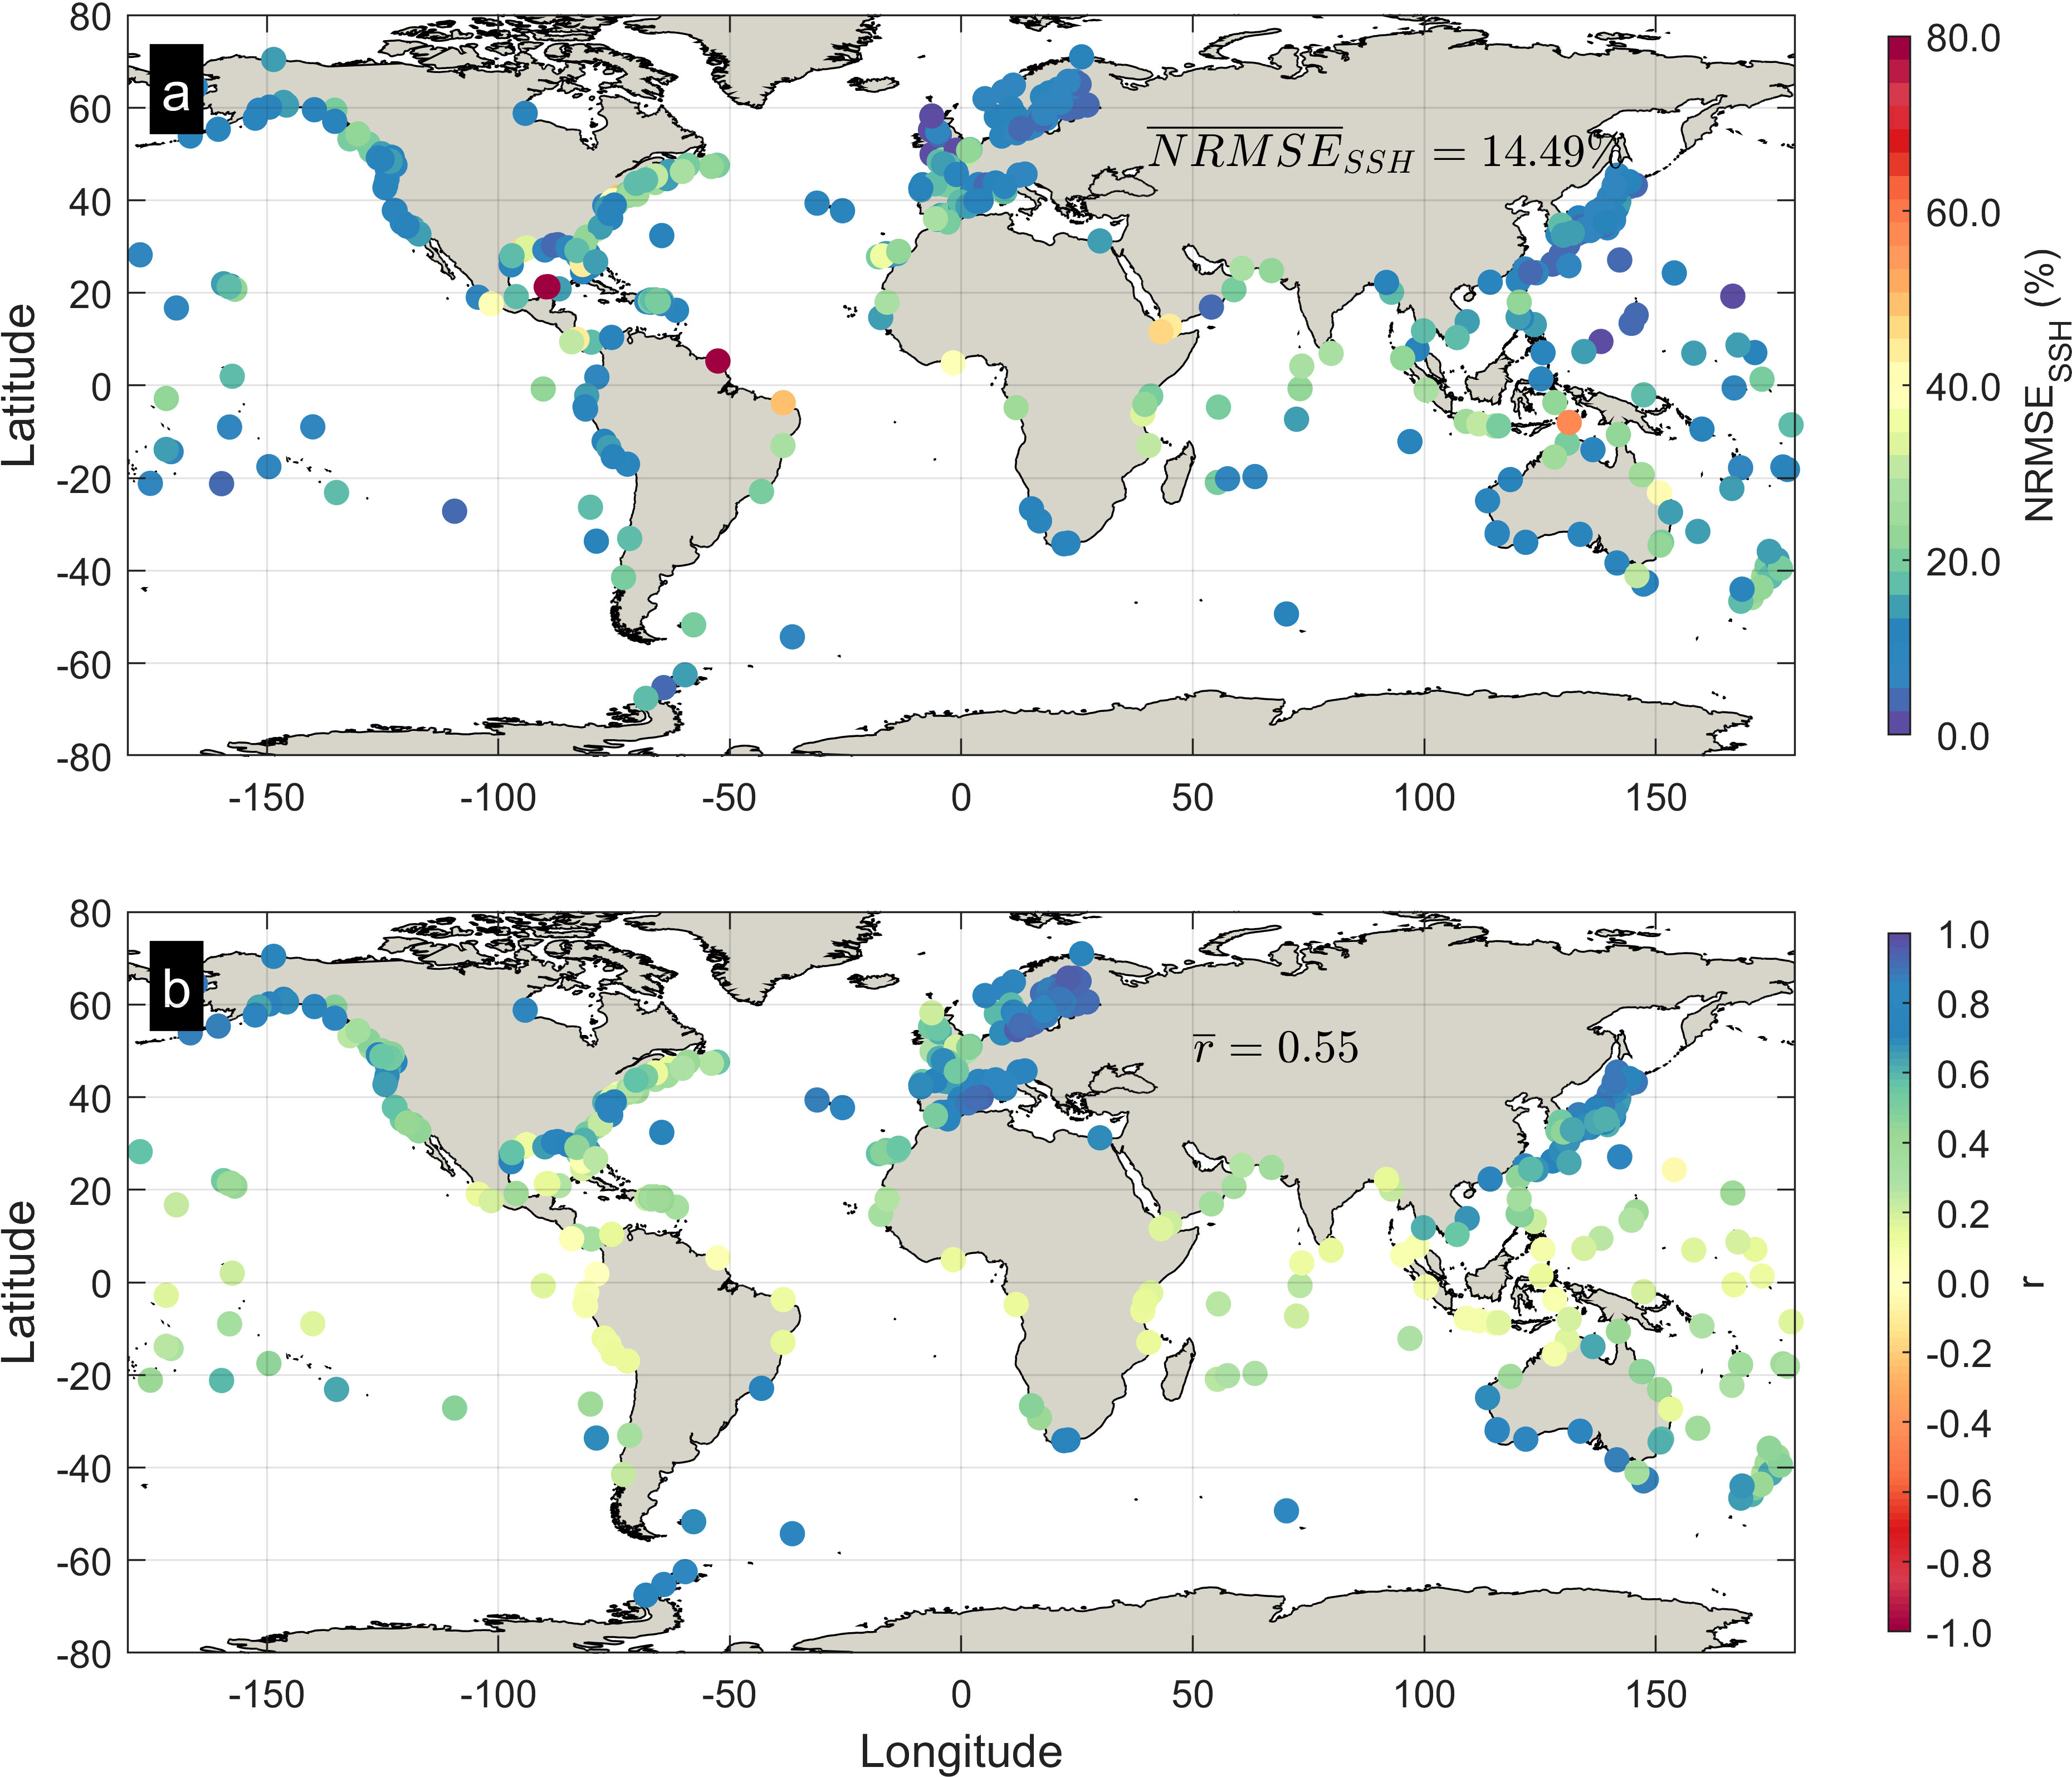
Figure 4 Skill for Sea Surface Height (SSH), model vs tidal gauges, (A) percentage Root Mean Square Error NRMSESSH, (B) Pearson Correlation.
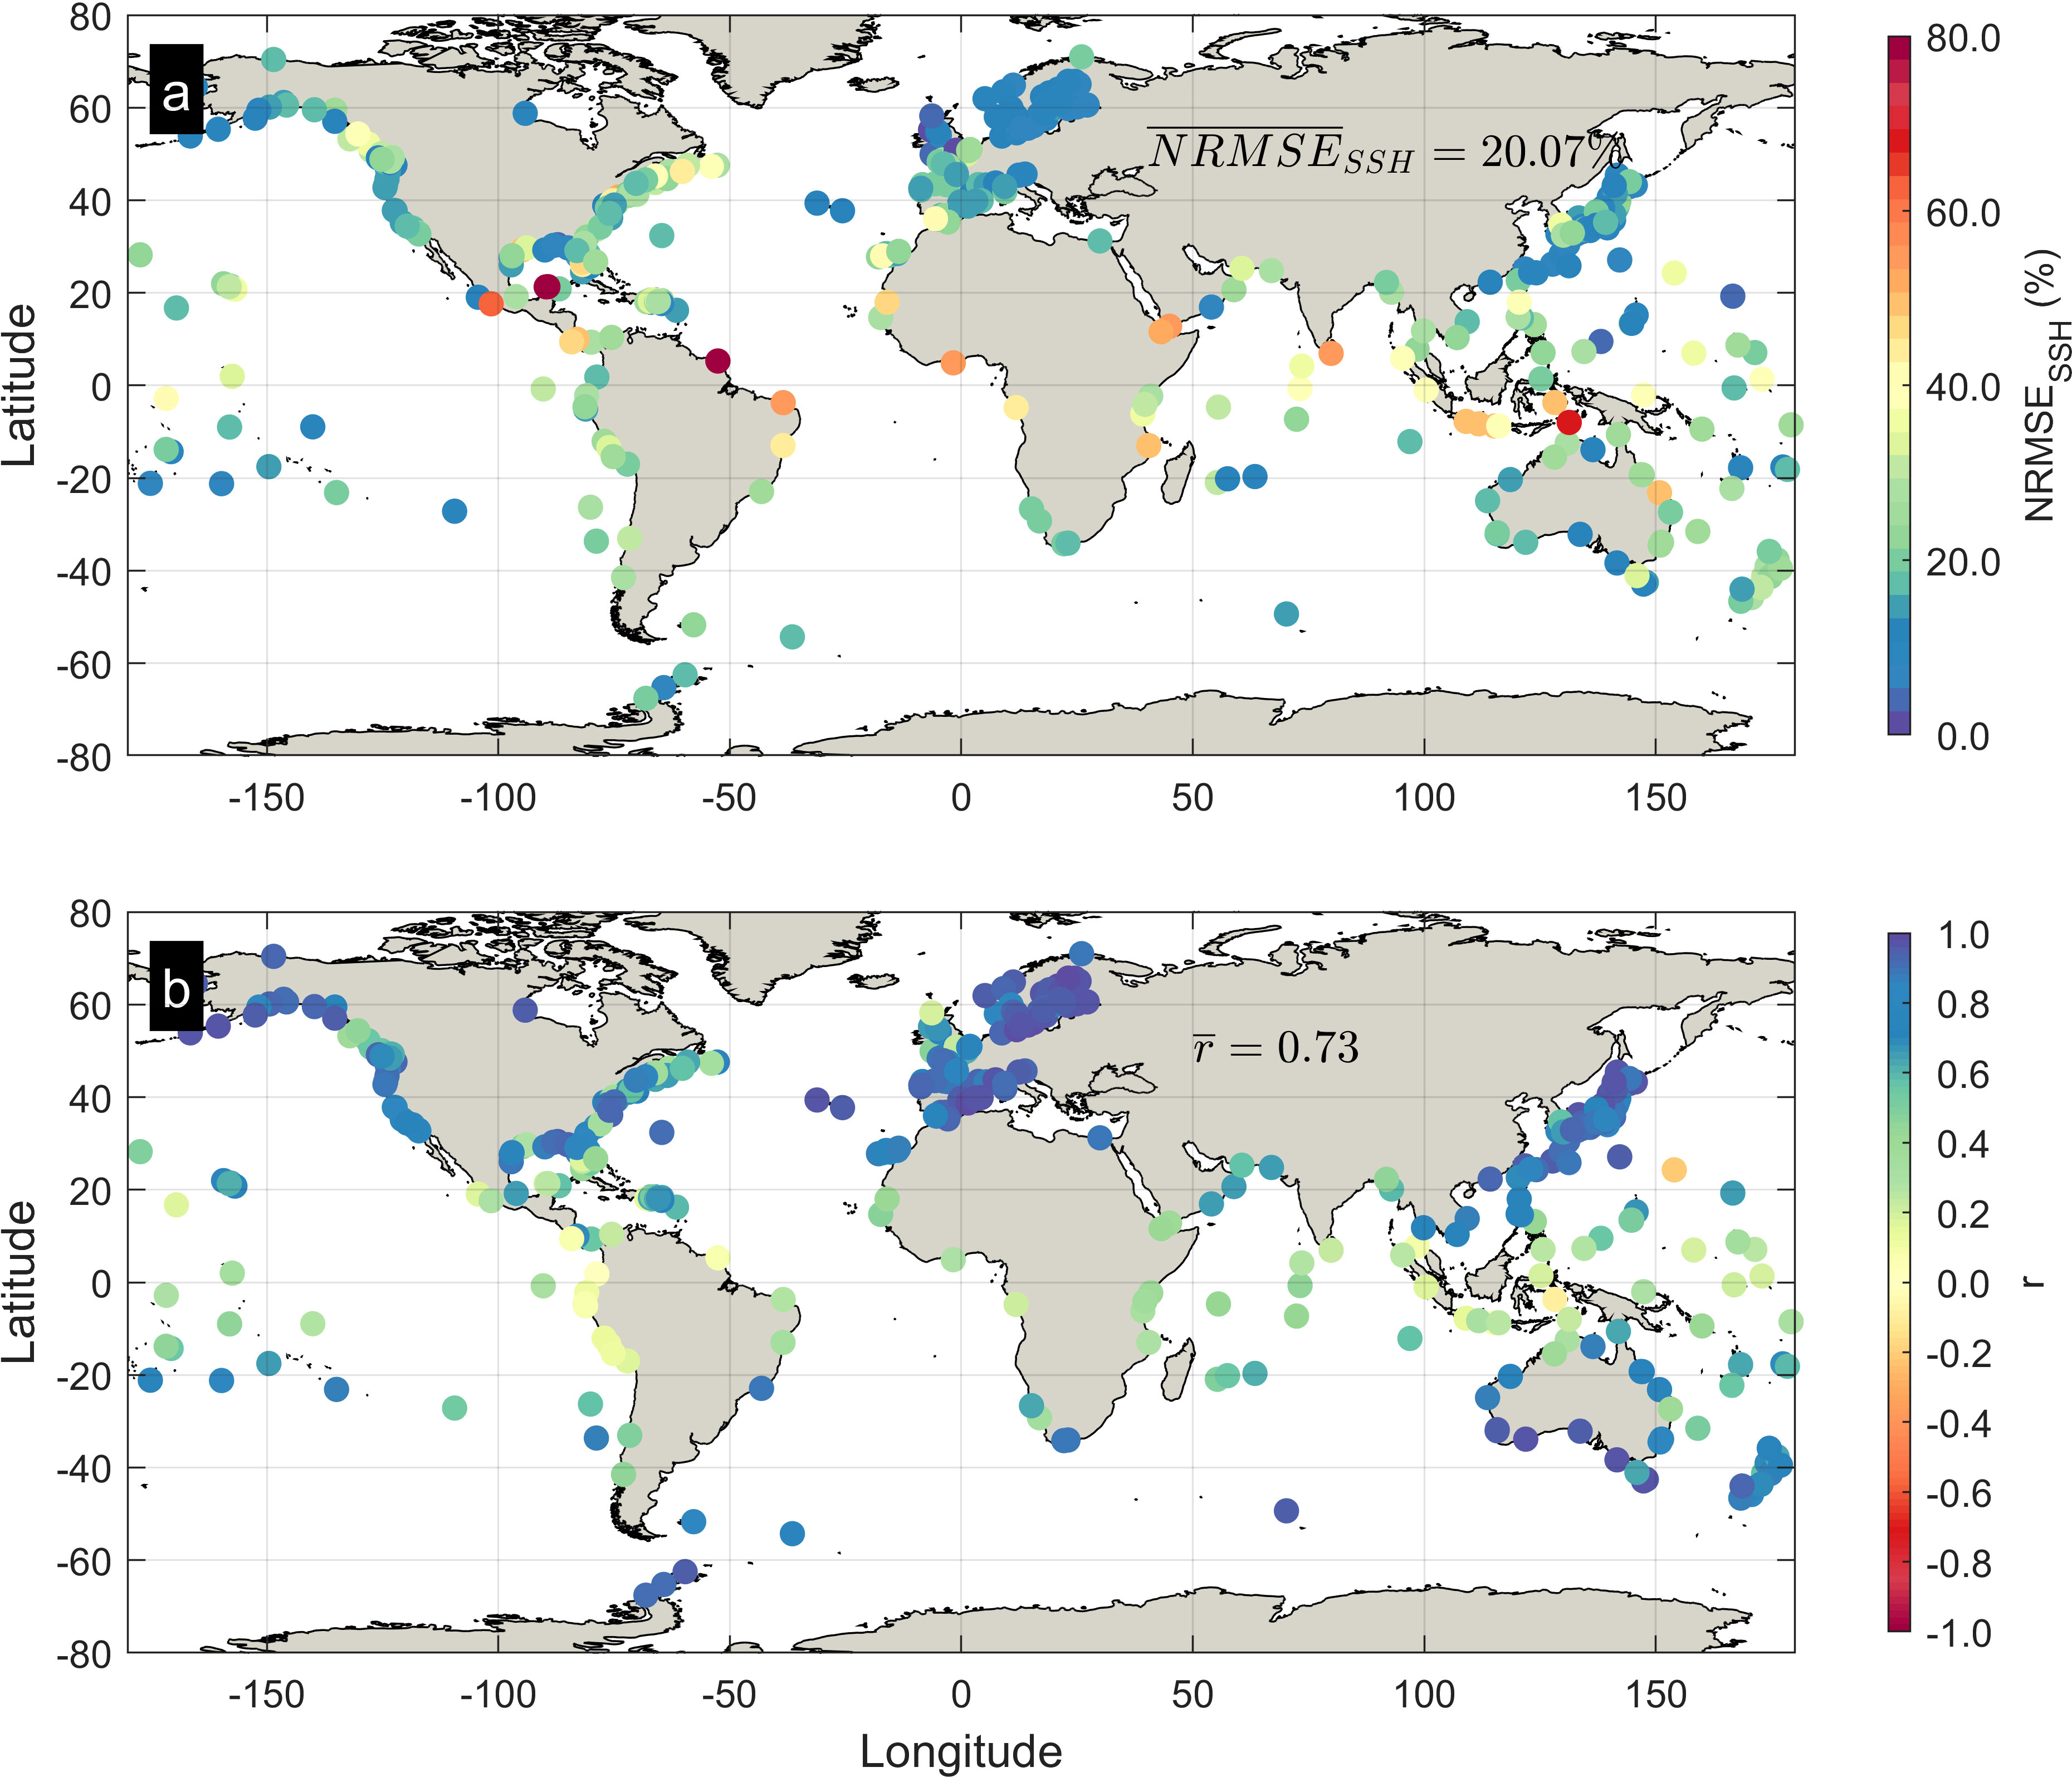
Figure 5 Skill for Sea Surface Height (SSH) >95th percentile, model vs tidal gauges, (A) percentage Root Mean Square Error NRMSESSH, (B) Pearson Correlation.
The comparison of modelled vs altimeter values for Hs shows that NRMSEHs is smaller than 25% over most of the domain (Figure 6A). Contrary to the skill of SSH (Figure 2A), both RMSEHs and NRMSEHs increase at higher latitudes north and south and are smaller closer to the equator (Figures 1B, 6A). Biases are generally positive at low latitudes and negative at high latitudes, especially in the Northern Hemisphere but also in large swaths of the Southern Hemisphere (Figure 6B). The mean normalized bias over the entire domain is -3.73%. When the whole wave climate is considered (both mean and extreme conditions), the bias is generally negative in semi enclosed basins, such as the Mediterranean Sea, the Red Sea, the Persian Gulf, the East China Sea, part of the South China Sea, the inner seas of the Indonesian archipelago. Part of the Antarctic coasts are instead characterized by a positive bias (Figure 6B). The evaluation of the model skill on the extreme tails (Hs beyond the 95th percentile of the observations) shows patterns of NRMSEHs similar to those found for the whole signal, but with significant improvements in some areas, in particular in semi-enclosed basins (Figure 7A). Beyond the 95th percentile the bias of Hs becomes more negative than in mean conditions, -7.85% on average, and the only areas retaining a positive bias are Coral Sea, North-West of Australia, and parts of the western Indian Ocean. The bias is low especially at high latitudes in the Northern Hemisphere, with negative bias values less than -15% in the Labrador Sea, in the Hudson Bay, along the coasts of Greenland and in other areas partially covered in ice during winter. In small, semi-enclosed basins such as the Mediterranean Sea, the Red Sea, the Persian Gulf, the inner seas of Indonesia and others, the negative bias improves beyond the 95th percentile of Hs compared with mean conditions (Figure 7B). The comparison of Hs with buoys offers a picture similar to altimeters, though with more local variability as the ability of the model to reproduce observations can depend on the resolution of coastal micro-features and sheltering (Figures 8, 9). With few exceptions, the model generally shows skill in line with that versus altimeters even for buoys close to the coasts, though with a significantly more pronounced negative bias (-11.8% on the whole signal, and -16.26 beyond the 95th percentile, Figures 8B, 9B).
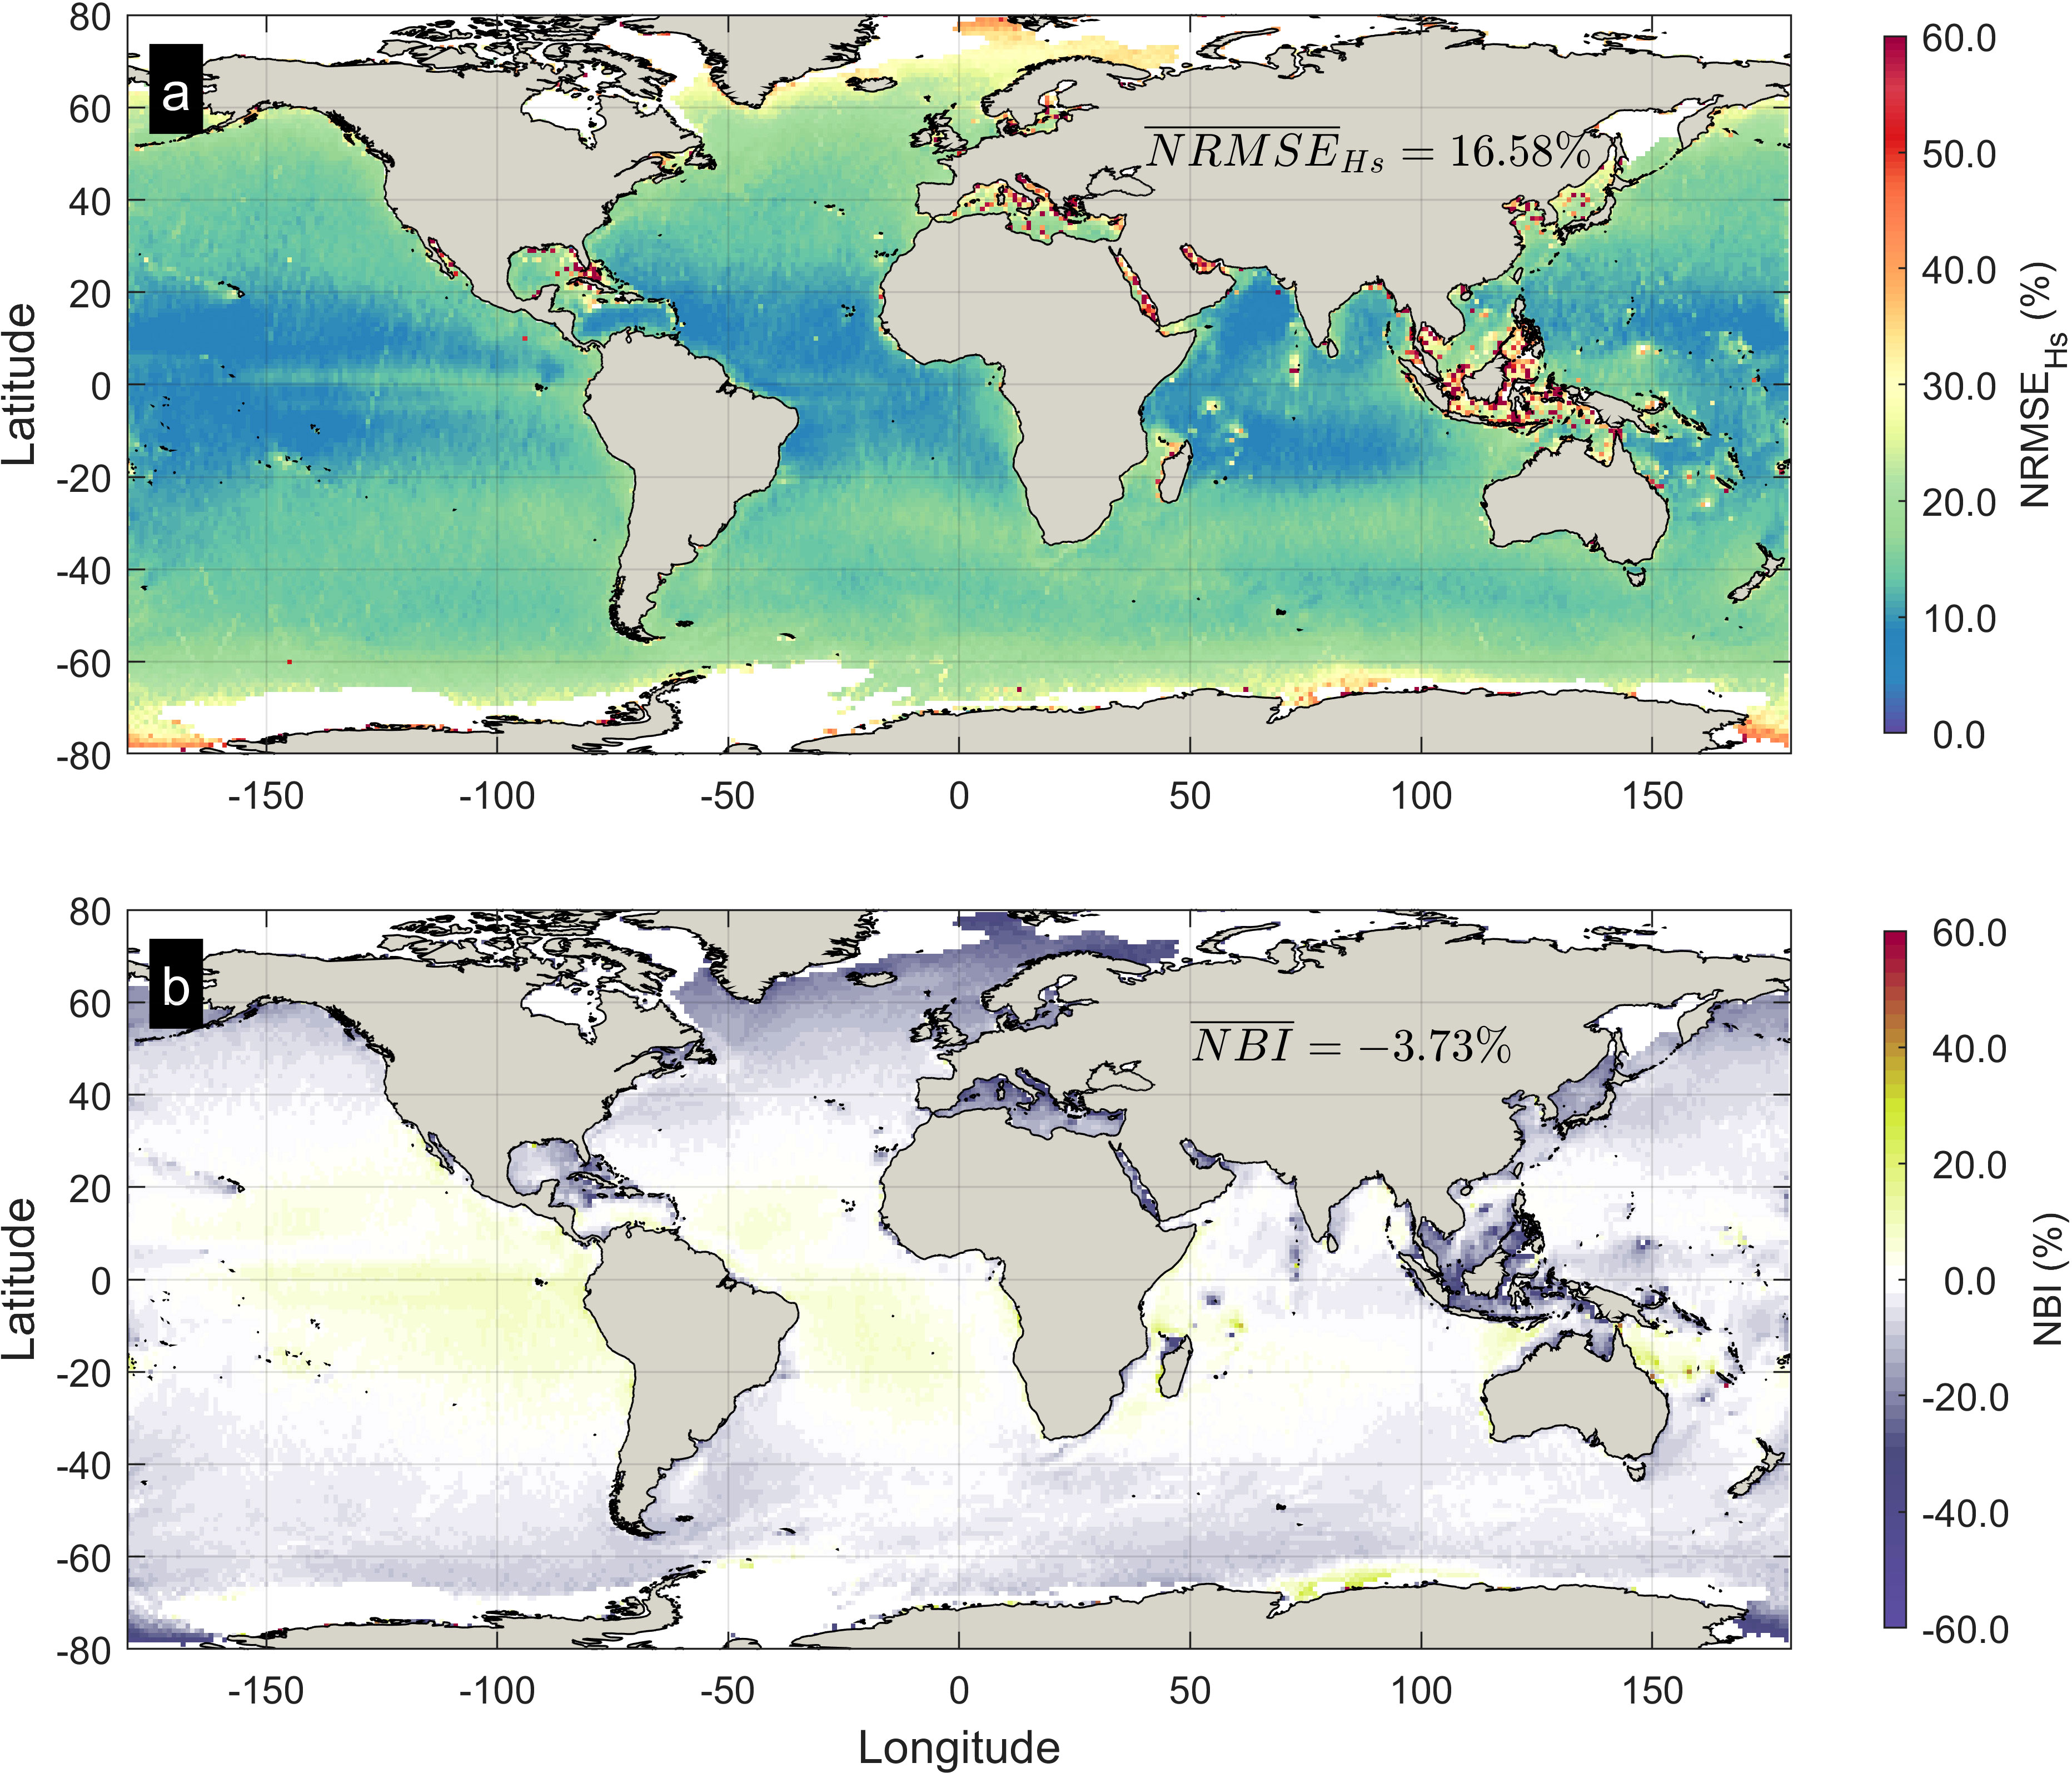
Figure 6 Skill of Significant Wave Height (Hs), model vs altimeters, (A) percentage Normalized Root Mean Squared Error (NRMSEHs) (B) Normalized Bias (NBI).
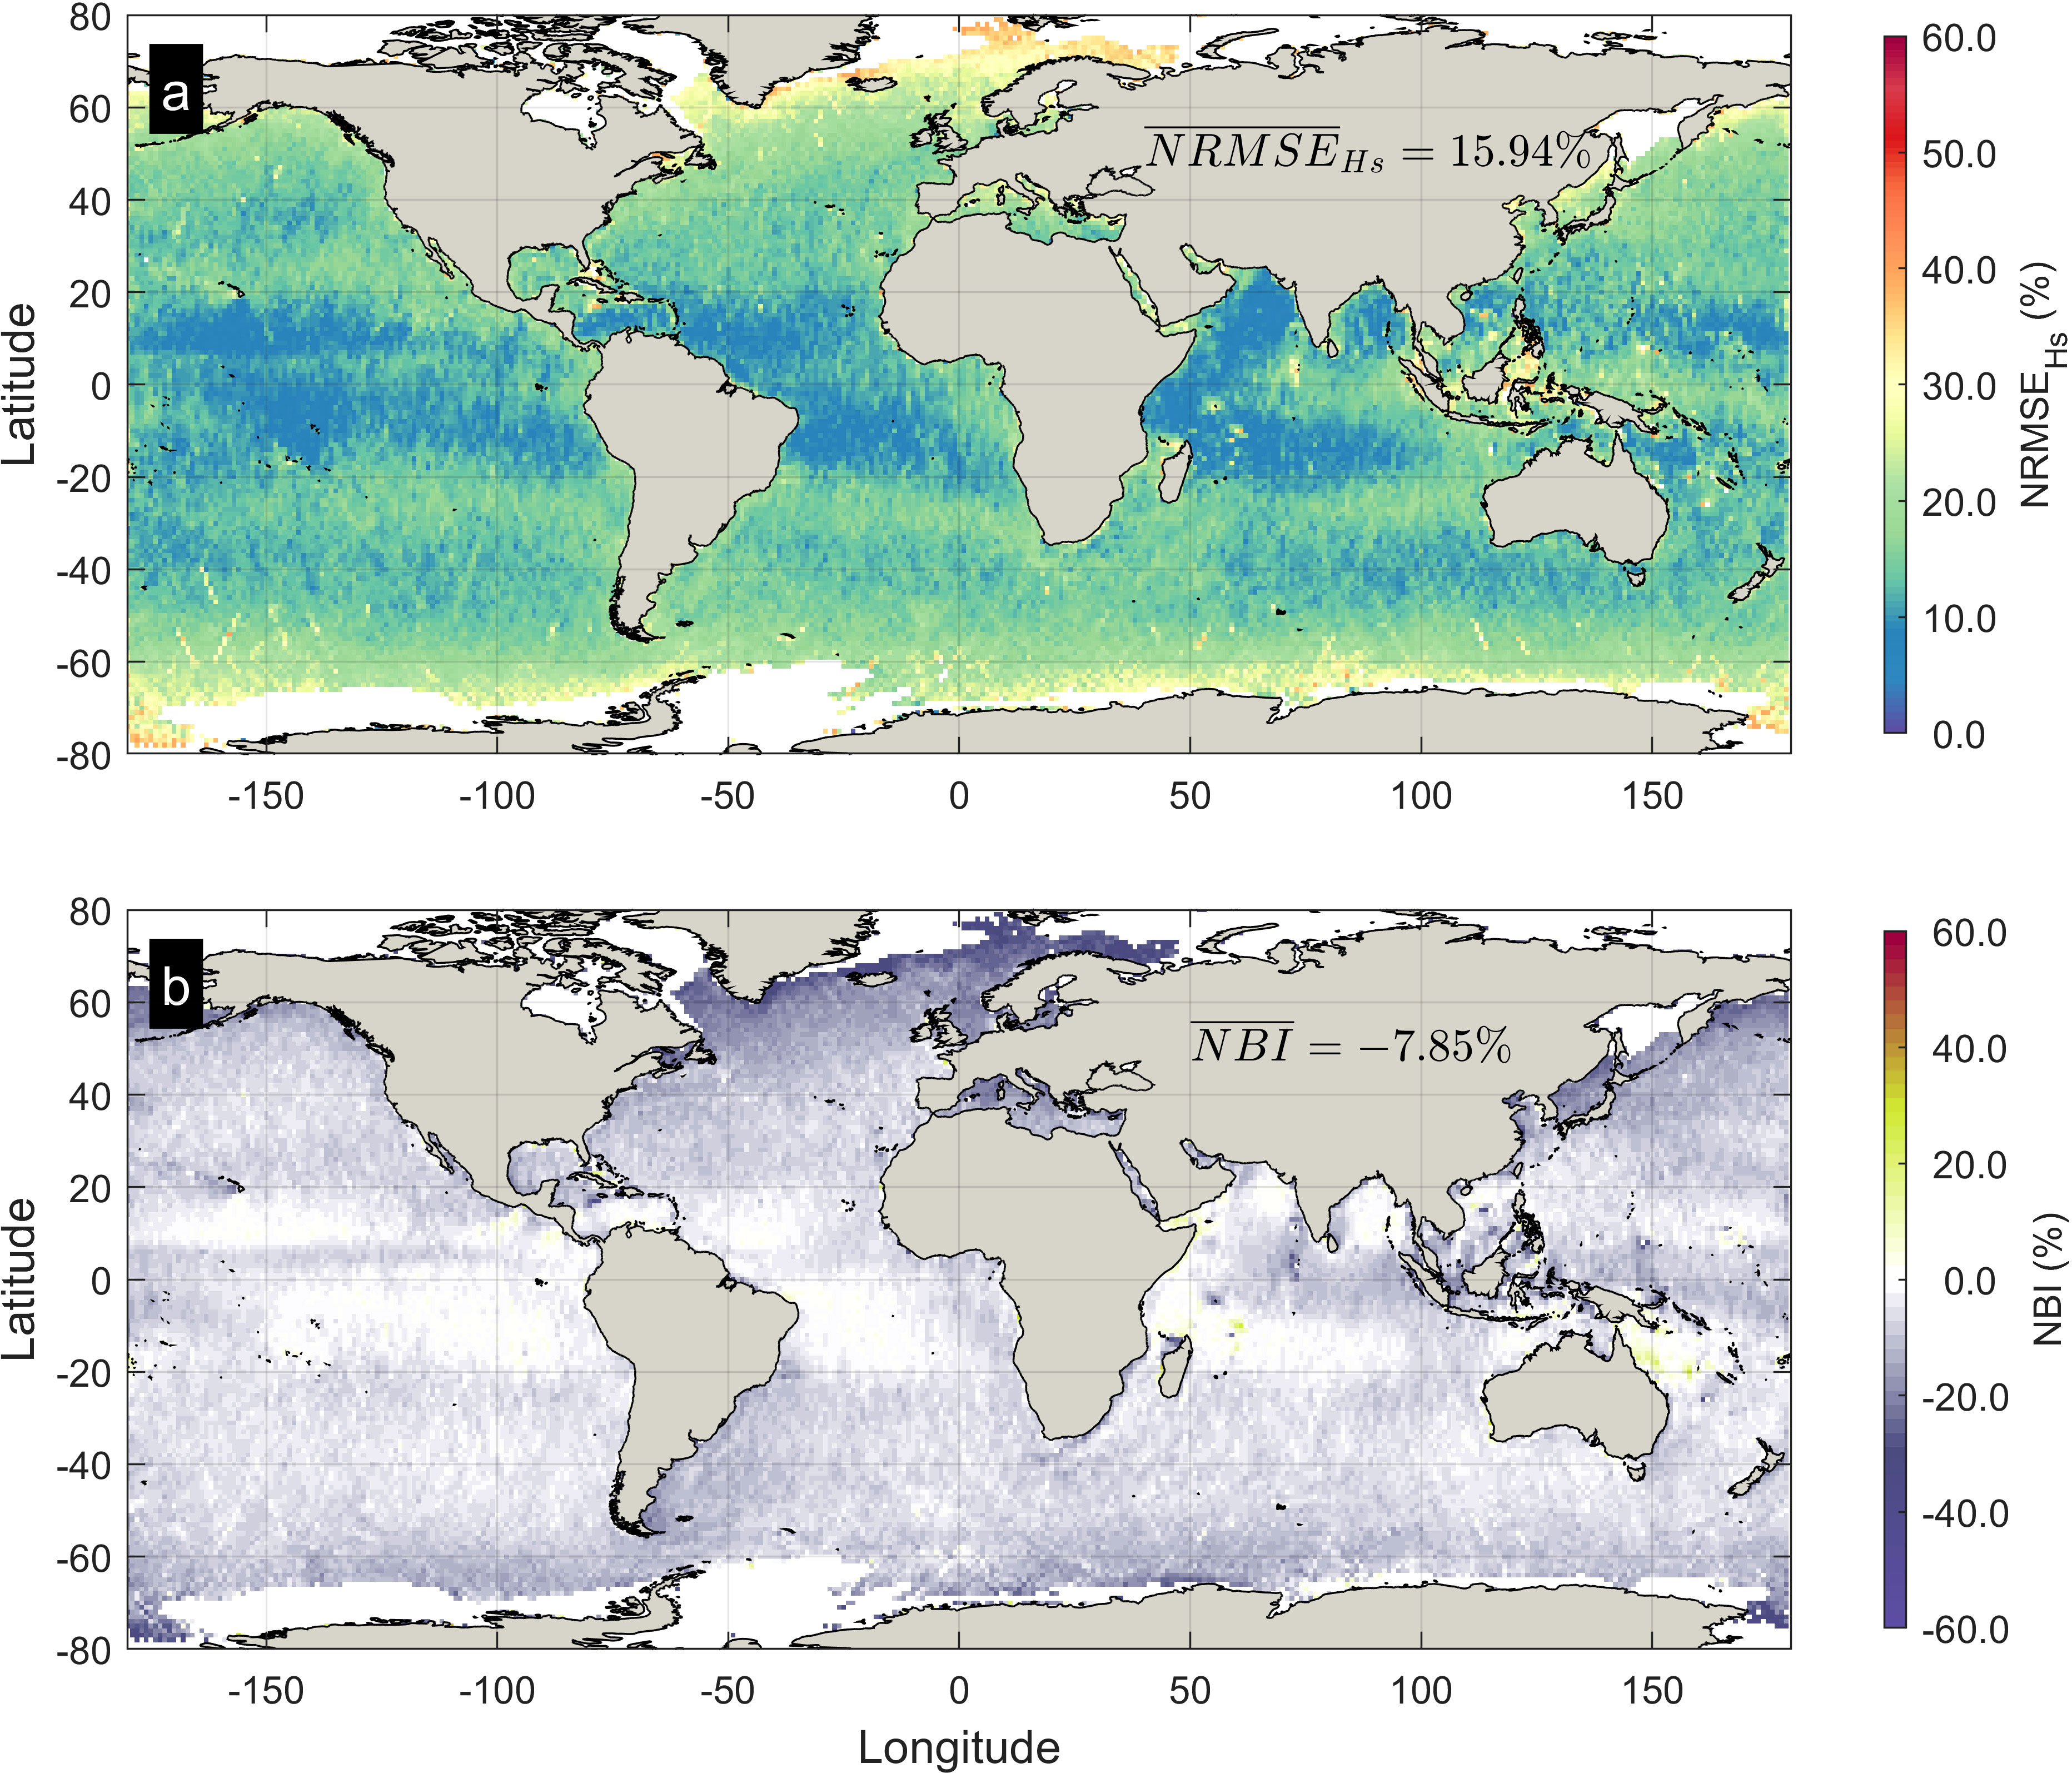
Figure 7 Skill of Significant Wave Height (Hs) >95th percentile, model vs altimeters, (A) percentage Normalized Root Mean Squared Error (NRMSEHs) (B) Normalized Bias (NBI).
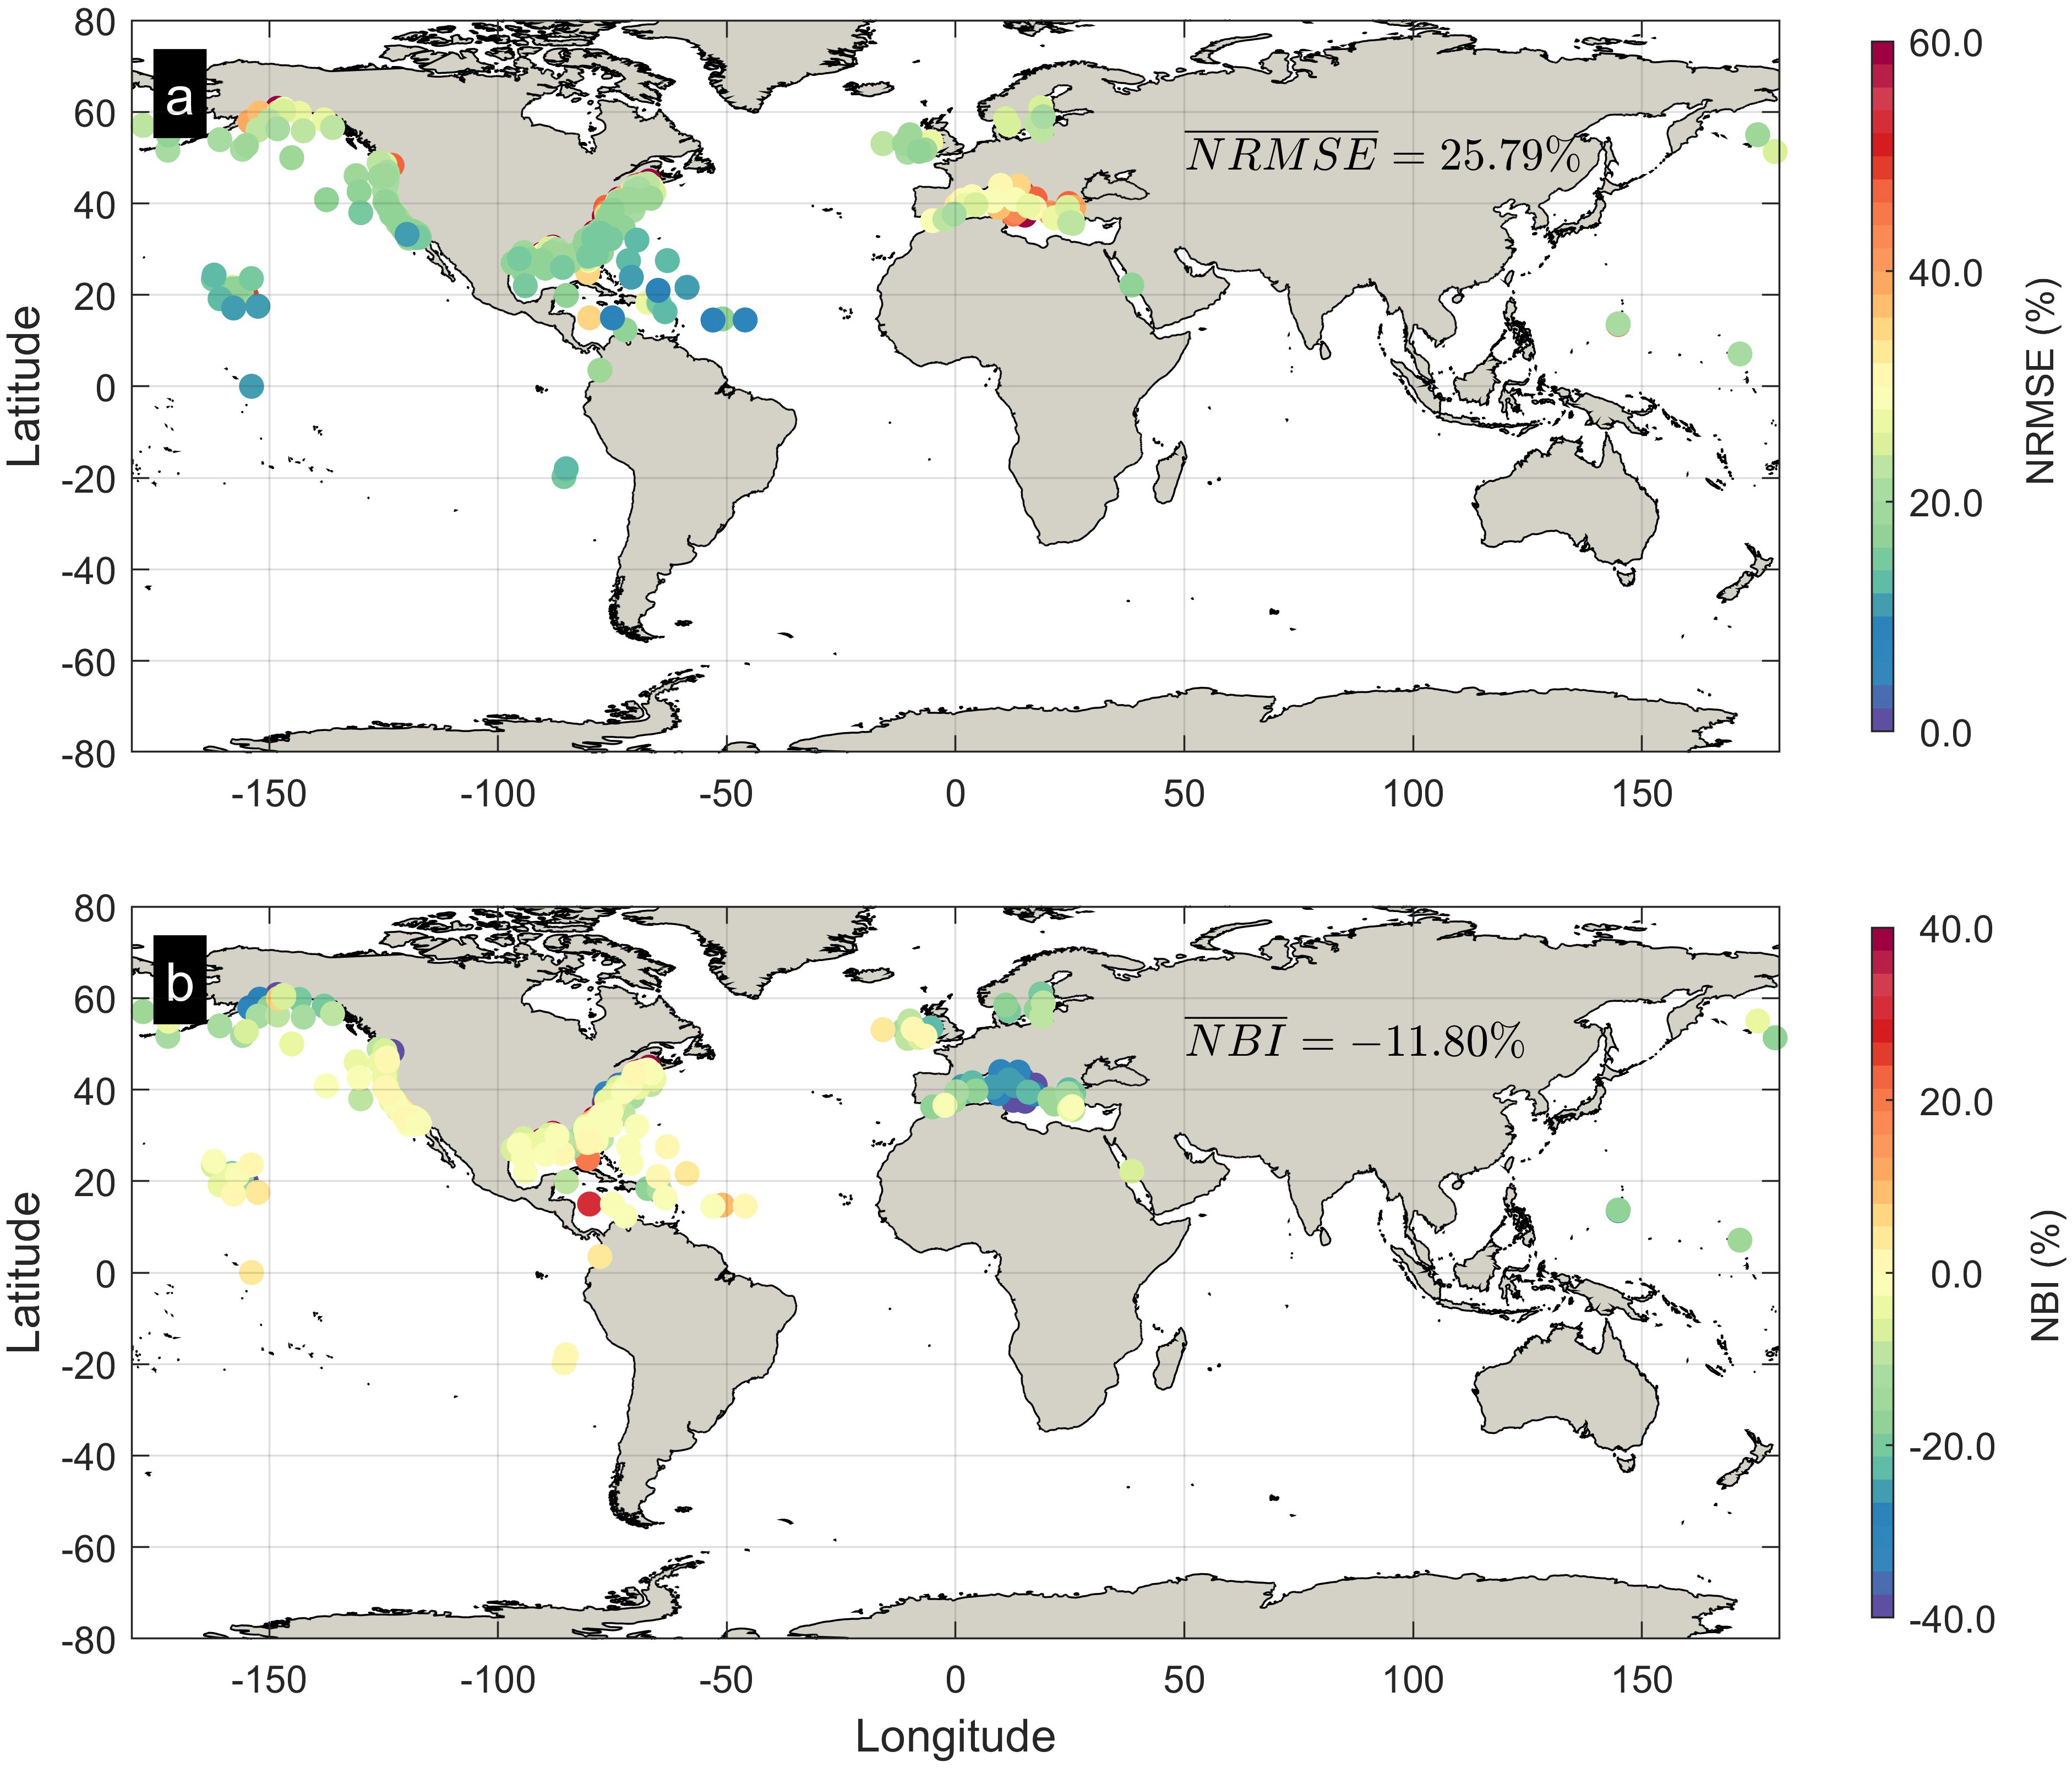
Figure 8 Skill of Significant Wave Height (Hs), model vs buoys, (A) percentage Normalized Root Mean Squared Error (NRMSEHs) (B) Normalized Bias (NBI).
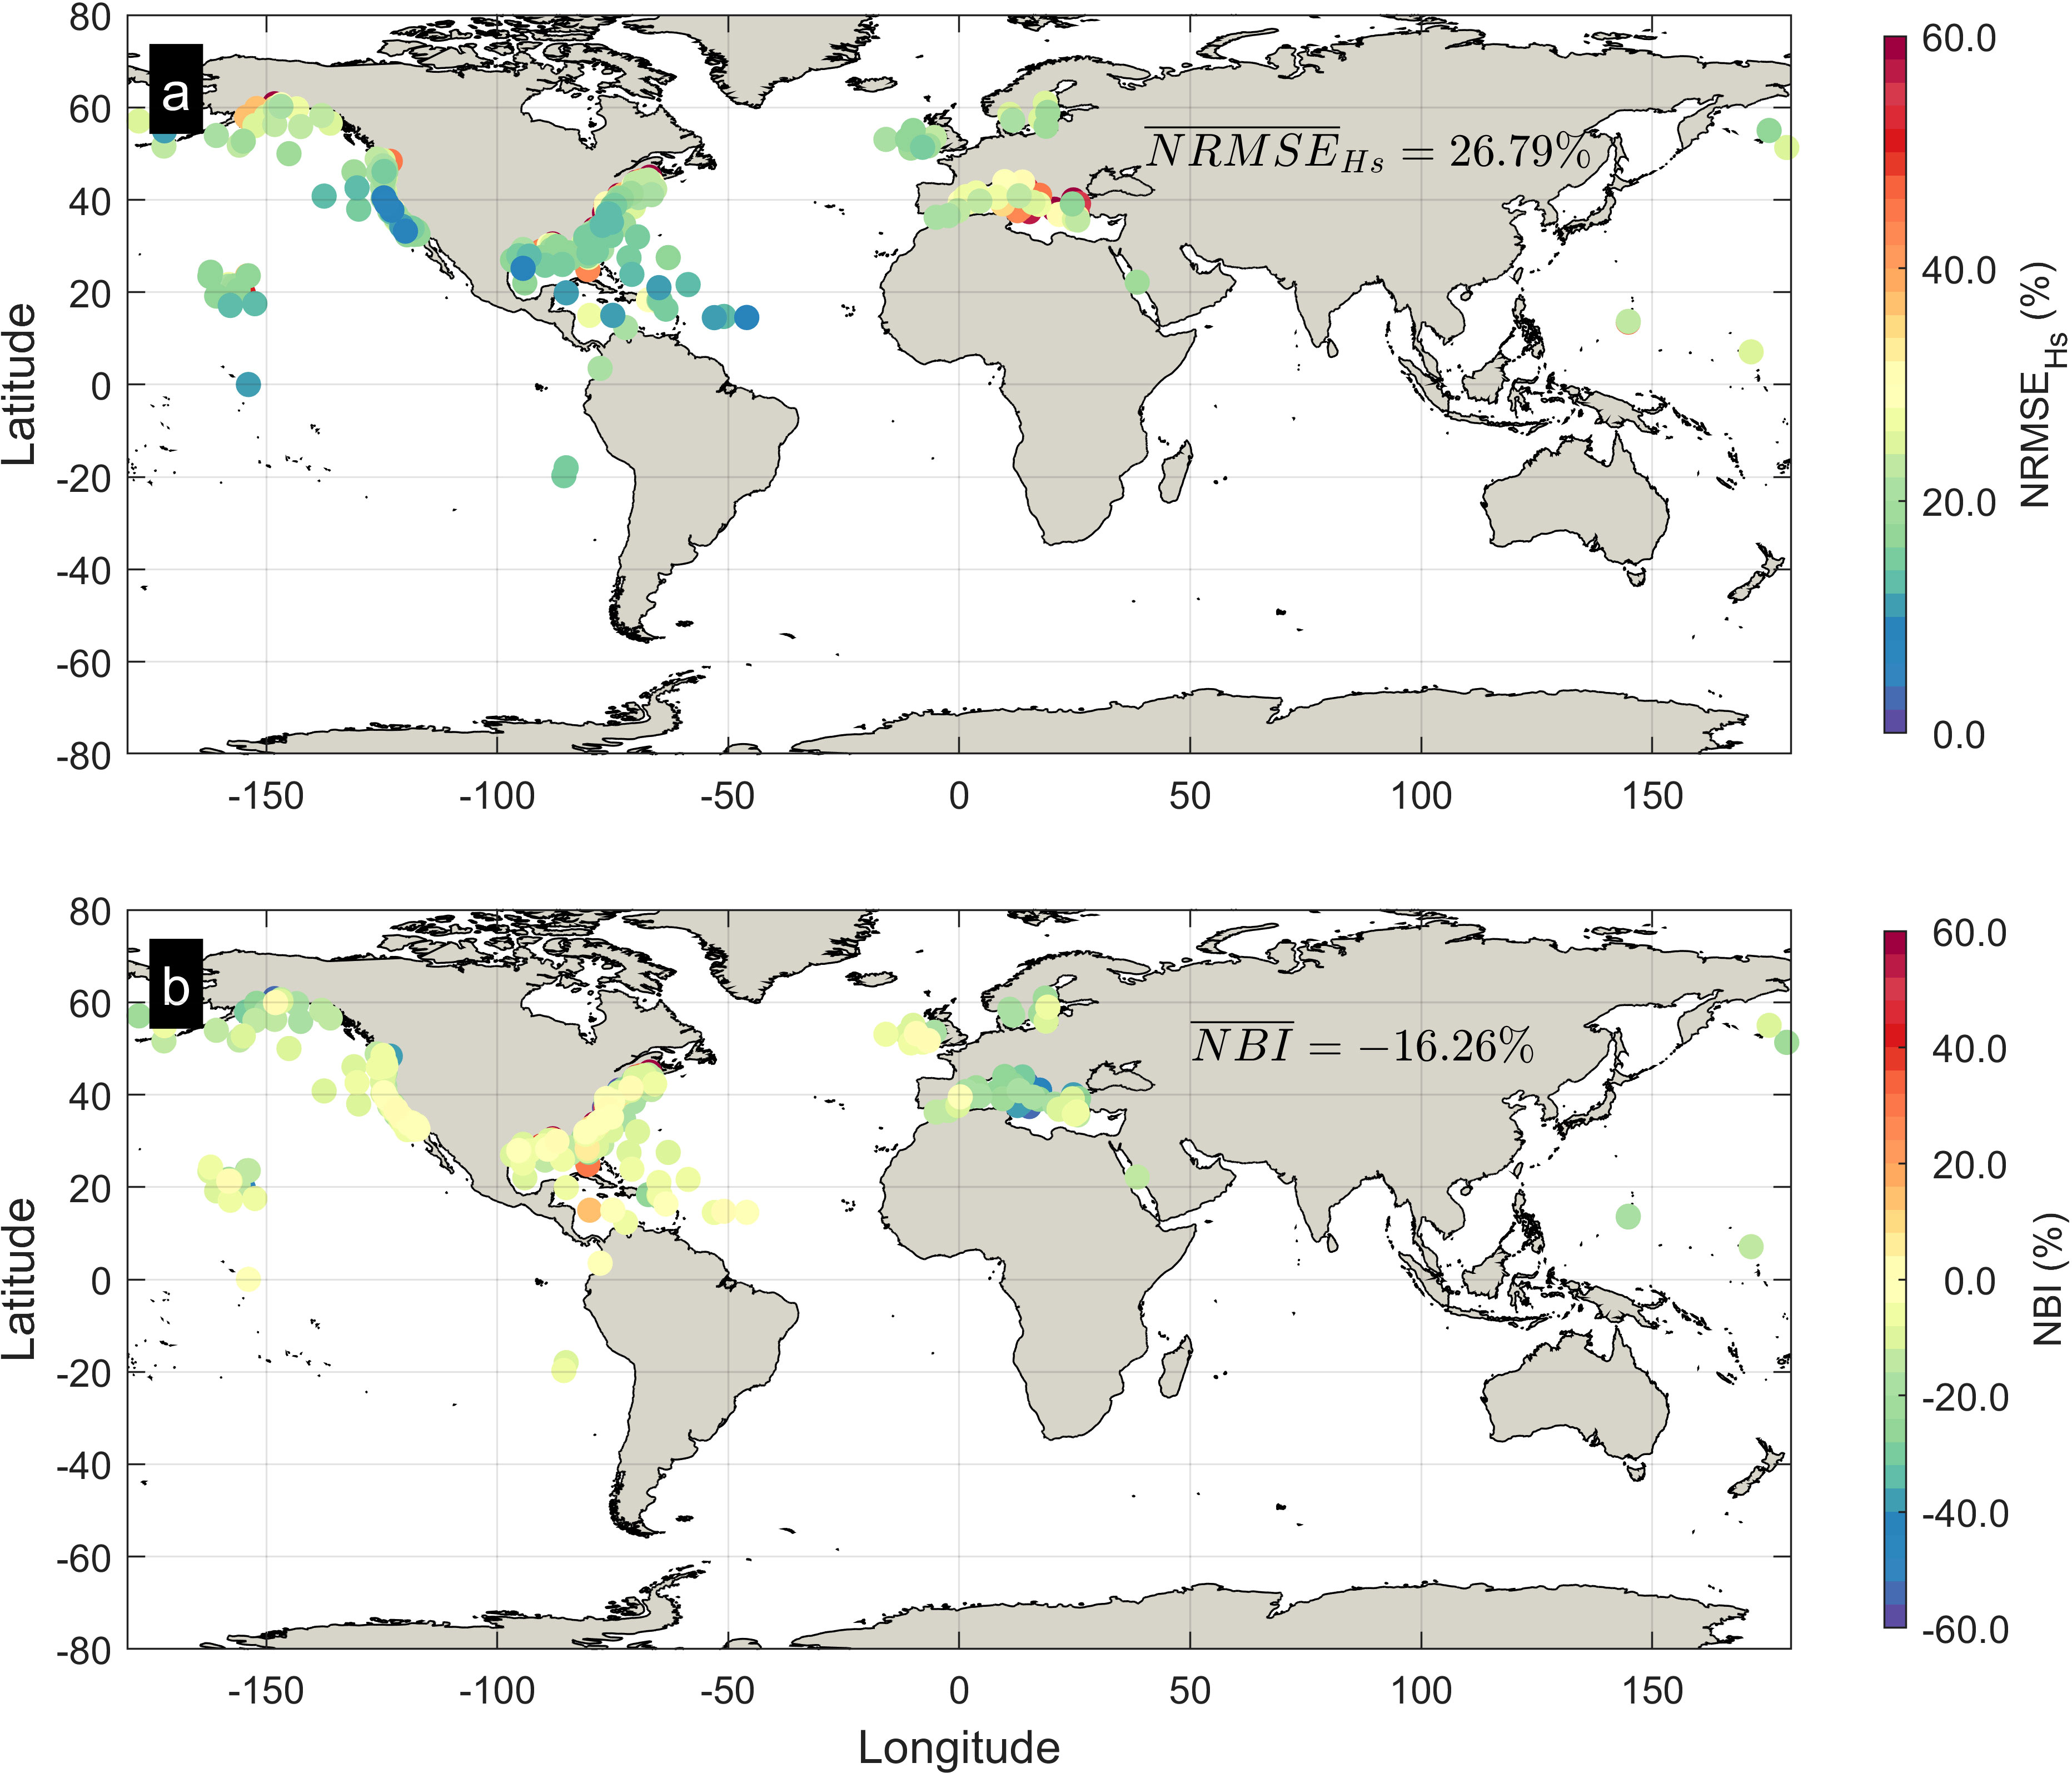
Figure 9 Skill of Significant Wave Height (Hs) >95th percentile, model vs buoys, (A) percentage Normalized Root Mean Squared Error (NRMSEHs) (B) Normalized Bias (NBI).
Discussion
Offshore skill
Overall, our results show offshore skills in line with the ones of other contemporary large-scale models, for both storm surges (Muis et al., 2016; Vousdoukas et al., 2017; Fernández-Montblanc et al., 2020; Tadesse et al., 2020) and waves (e.g. Perez et al., 2017; Mentaschi et al., 2020; Smith et al., 2021; Morim et al., 2022).
While RMSESSH appears generally low both at high and low latitudes (Figure 1A), the offshore skill of SSH expressed in terms of normalized indicators such as NRMSESSH and correlation shows a clear dependence on latitude (Figures 2, 3), with values of NRMSESSH and correlation significantly better at mid-high latitudes with respect to tropical and equatorial areas. This is a common feature in storm surge models and is due to a range of factors. The variability of sea levels at mid-high latitudes is higher and dominated by the eddy activity and baroclinic instability in the atmosphere, which result in short-term inverse barometric effect and wind setup that our model can capture. The lower atmospheric eddy activity in tropical/equatorial regions is a reason for the poorer skills for SSH in these areas (Hoskins and Valdes, 1990). At low latitudes the short-term variability of SSH is low with respect to middle-high latitudes, and storm surges are typically caused by tropical cyclones, hurricanes, and typhoons, which are relatively rare events, with a limited contribution to the mean signal. Though ERA5 can reproduce such events to some extent, limitations still exist, partially related to the still relatively low spatial resolution (Hersbach et al., 2020), with results usually characterized by negative biases of wind. Another reason is the complex ocean currents and coastal geography in the equatorial region, which is characterized by weak Coriolis acceleration. The equatorial region is home to the Equatorial Undercurrent (EUC) and the Equatorial Counter Current (ECC), which are difficult to model due to their strong variability and complexity (e.g. Stellema et al., 2022). These currents can also cause upwelling and vertical circulation, which can have an impact on SSH, but the ability of barotropic models to reproduce it is limited. Related to this is the low-frequency variability that characterizes the sea levels in tropical and equatorial areas, due to the Tropical Instability Waves and the seasonal cycle, and the associated thermostatic expansion. Another source of uncertainty is the oscillating intensities of the monsoons and of the Walker cells, and the associated patterns of variability such as the El Nino Southern Oscillation (Nidheesh et al., 2013). Other areas characterized by low-frequency variability are the western boundary currents, where the water levels depend on the intensity of the currents. The better skill in relatively sheltered tropical/equatorial basins such as the Red Sea, the Persian Gulf, the East China Sea, part of the South China Sea, the Gulf of Thailand and the Arafura Sea, is likely due to the relatively smaller low-frequency variability. In this respect, a 3D circulation model could be able to better capture the low-frequency component of SLA, resulting in better overall skill at low latitudes.
That low-frequency variability is a major contribution to the error is confirmed by a comparison of our model’s SSH against the data of Dynamic Atmospheric Correction (DAC) from Pujol et al. (2022), which better identifies the short-term variability than SLA (Figure 10). The comparison, done for the mean signal, shows a significantly improved model skill, with a mean correlation of 0.75 versus 0.55 against SLA (Figure 1B), and better performances everywhere, with the exception of the Red Sea and the coasts of Vietnam.
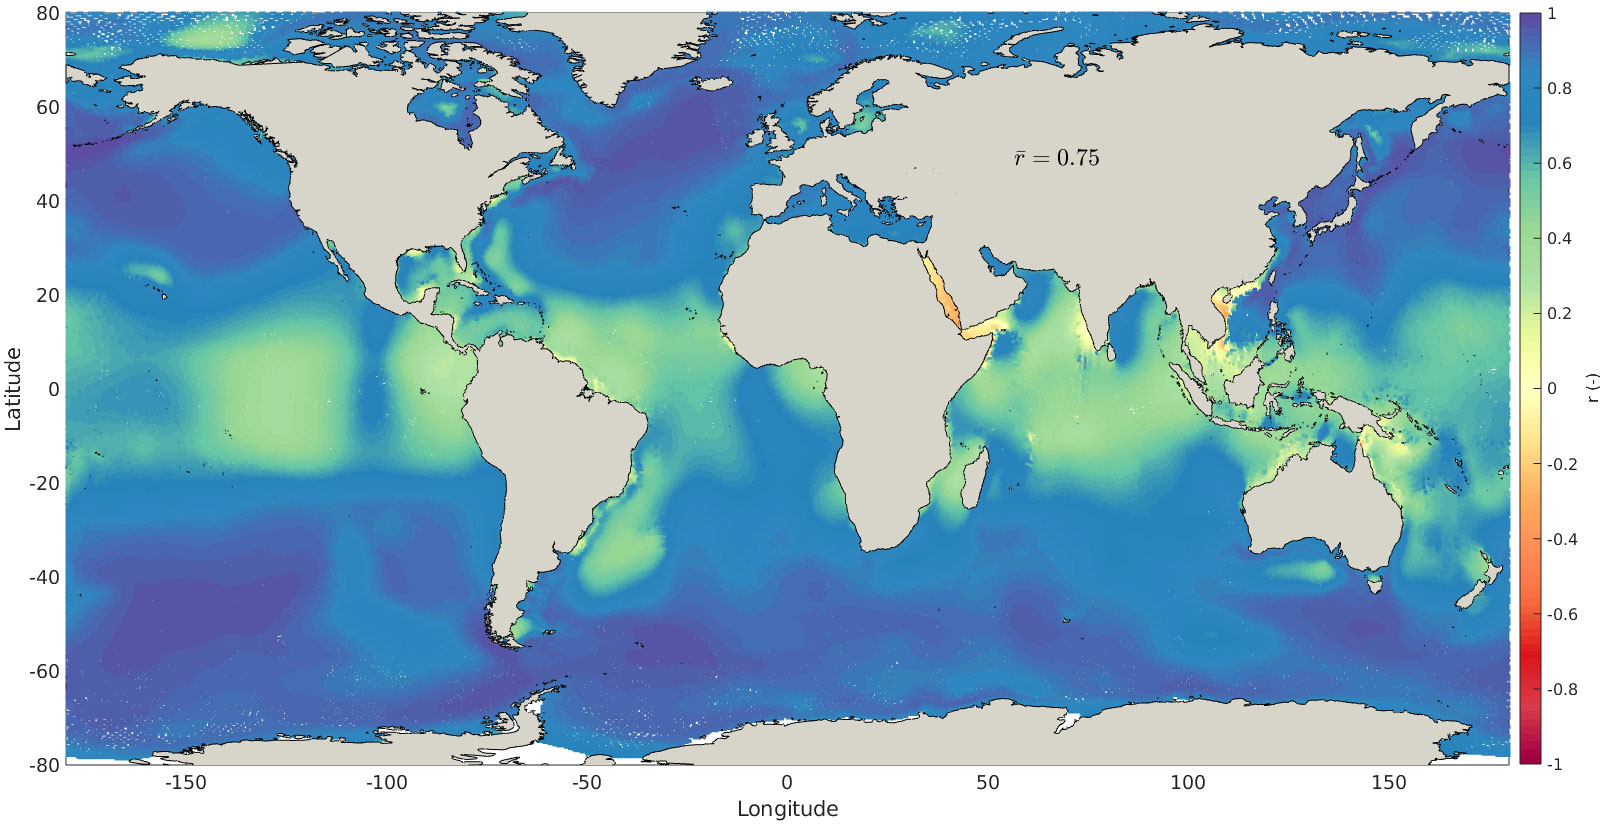
Figure 10 Comparison of model SSH versus Dynamic Atmospheric Correction (DAC) from (Pujol et al., 2022). Map of correlation coefficient r.
Wave results show overall good skill, though with a tendentially negative bias, especially low in areas characterized by seasonal presence of ice, e.g. in the southern portion of the Arctic Ocean, in the Labrador Sea, and in the Southern hemisphere in the Weddell and Ross seas, and in semi-enclosed basins, with consequent higher values of NRMSEHs (Figure 5). The error in Hs in these areas is related to the high uncertainty in the sea ice concentration datum provided by ERA5, especially in the Marginal Ice Zones (Renfrew et al., 2021), together with the fact that the presence of ice invalidates the altimetric observations of Hs (Dodet et al., 2020). On the other hand, introducing a parameterization of ice-induced wave dampening comes with benefits, as simulations neglecting it result in significant positive biases of Hs in the Southern Ocean and in the Northern Pacific Ocean and Atlantic Ocean that are now absent. The negative bias and NRMSEHs increase beyond the 95th percentile (Figure 6), reflecting a general tendency of our wave models in underestimating the peaks, partly due to an underestimation of extreme winds in ERA5 (e.g. Campos et al., 2022) as well as possible limitations of 3rd generation models in extreme conditions (Cavaleri, 2009). At the same time, in enclosed and semi enclosed basins (the Mediterranean Sea, the Red Sea, the Persian Gulf, the inner seas of Indonesia and others) the negative bias of Hs beyond the 95th percentile improves with respect to the whole signal. This suggests that the higher resolution of ERA5 compared to previous reanalyses and that of our model allow for a better reproduction of mesoscale events relevant for the statistics of the extremes in short fetches (e.g. Mentaschi et al., 2015a).
Nearshore skill
The advantage of the high resolution used in this study becomes clear when examining the model skill vs tidal gauges and buoys located close to the coasts. Here our model generally outperforms lower resolution ones, in particular the ones from previous studies by the authors (Mentaschi et al., 2017; Vousdoukas et al., 2017; Vousdoukas et al., 2018). At global scale, the performance of SSH versus tidal gauges is remarkably in line with the one versus altimeters. The global mean NRMSESSH/correlation is 17.09%/0.58 versus altimeters, and 14.49%/0.54 versus tidal gauges (Figures 1, 3). This picture is consistent for SSH beyond the 95th percentile, with a global mean NRMSESSH/correlation of 27.41%/0.74 versus altimeters, and 20.07%/0.73 versus tidal gauges (Figures 2, 4).
For significant wave height the skill versus buoys is significantly worse than that versus altimeters, with a more pronounced negative bias, especially beyond the 95th percentile. When considering the whole signal, the global mean NRMSEHs/NBI is 16.58%/-3.73% versus altimeters, and 25.79%/-11.8% versus buoys (Figures 5, 7). Beyond the 95th percentile the figures are 15.94%/-7.85% versus altimeters, and 26.67%/-16.26% versus buoys (Figures 6, 8). The NRMSEHs versus buoys can be decomposed into its random and systematic components according to (Mentaschi et al., 2013), revealing that beyond the 95th percentile the bias account for roughly 20% of the mean squared deviation. The larger bias of Hs nearshore is, beside the underresolved coastal zone, likely due to multiple factors, such as limitations in reproducing growth-dissipation in short fetches, and uncertainties in the parameterizations of shallow-water dynamics.
The significant improvement over lower resolution, non-coupled models for both SSH and Hs relates to the ability to better reproduce the dynamic effect of small coastal features, and to considering the interactions between waves and currents, and the effect of waves on the sea surface roughness. A comparison of the new hindcast versus previous ones (Mentaschi et al., 2017; Vousdoukas et al., 2018, Figure 11) shows how the present model better captures local short-term variability. For the 20% of tidal gauges with the best RMSESSH in the present study, the old hindcast showed nowhere a better skill (Figure 12A). Furthermore, RMSESSH/NRMSESSH was larger than the 80th percentile of RMSESSH/NRMSESSH of the present study in >50% of the tidal gauges. If SSH beyond the 95th percentile is considered, this percentage exceeds 60% (Figures 12A, B). The increase in skill for SSH >95th percentile can be observed especially at middle-high latitudes, while at low latitudes the improvement is less pronounced (Figure 12E). For Hs, in normal conditions the improvement of skill is in line with that of SSH, while if we consider Hs beyond the 95th percentile the improvement of skill with respect to the old hindcast is still clear, but less marked, due to the significant negative bias of Hs (Figures 12C, D). For Hs >95th percentile the improvement in skill can be observed especially for buoys in close proximity to the shore, while it is less strong for offshore buoys (Figure 12F).
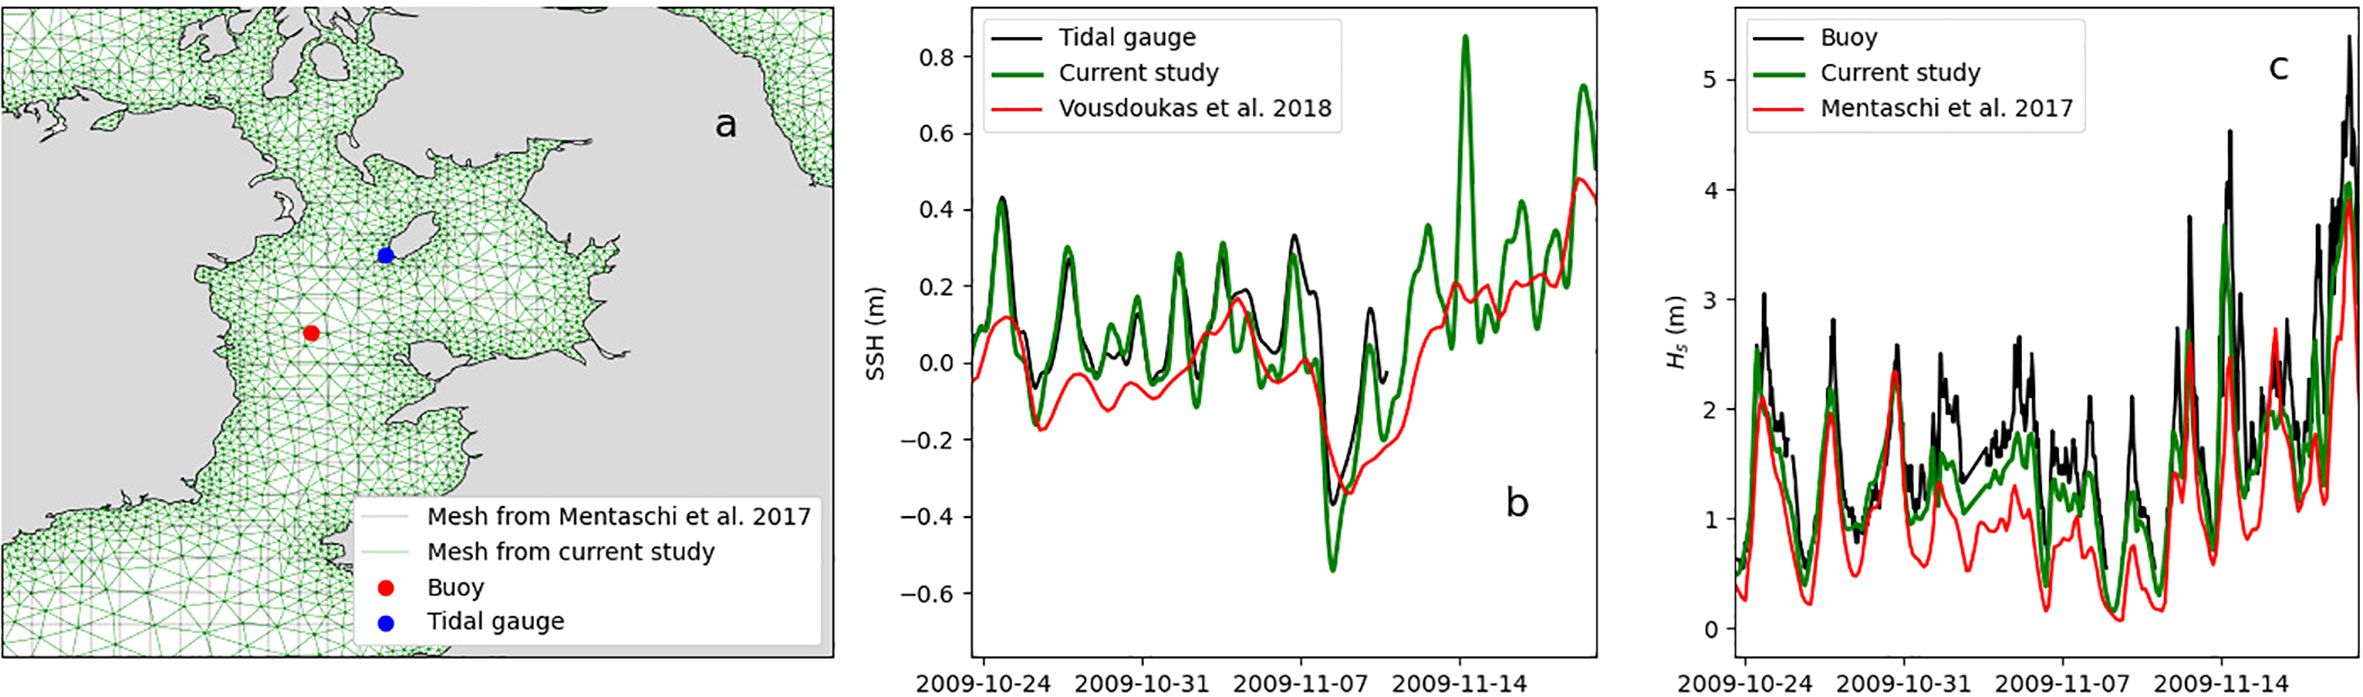
Figure 11 Time series of SSH at a tidal gauge (B) and of Hs at a buoy (C) in the Irish Sea (A). In map (A) the mesh used in the current study (green line) is superimposed to the 0.25° subdomain used for Northern Europe in (Mentaschi et al., 2017), and the positions of the buoy and the tidal gauge are represented. In the time series panels (B, C) the black line represents the observations, the green line the results from the present study, the red line for Hs the results from Mentaschi et al. (2017) and for SSH from Vousdoukas et al. (2018).
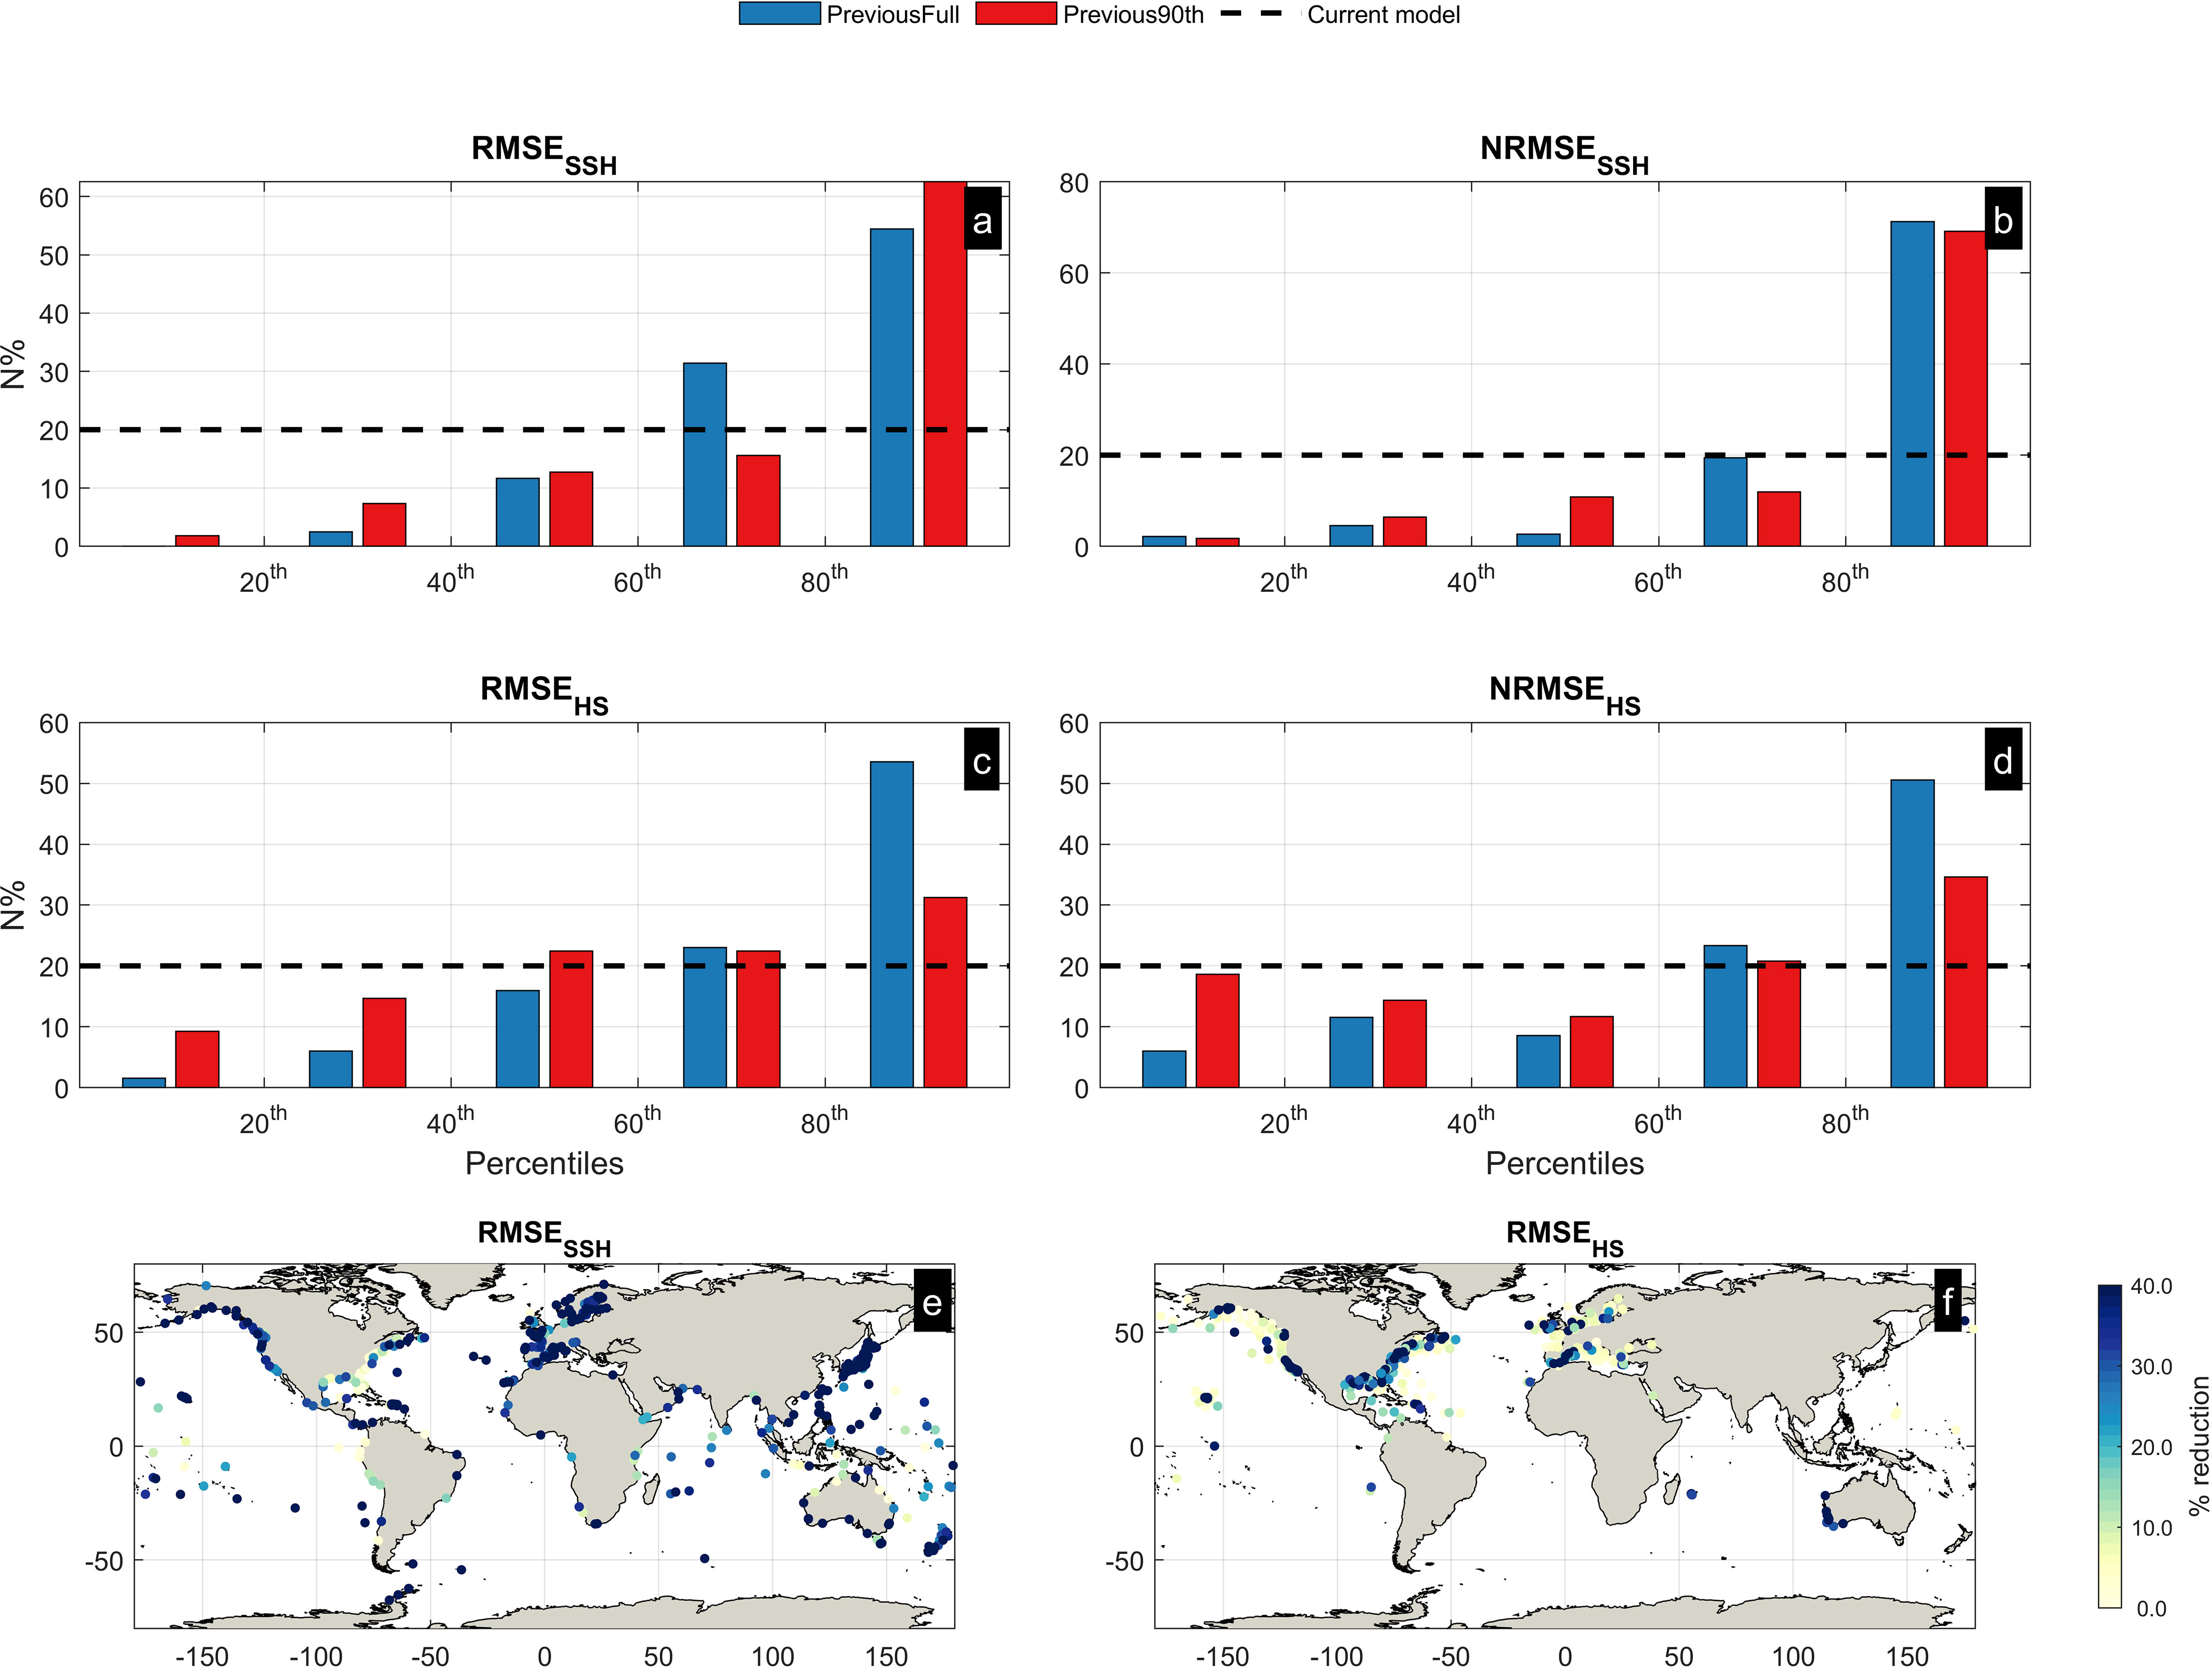
Figure 12 Skill comparison between the present study and previous, lower-resolution hindcasts (Mentaschi et al., 2017; Vousdoukas et al., 2018). In the panels, the tidal gauges (A, B) and the buoys (C, D) are grouped by quintile of error in the present study. The dashed line in each panel reproduces the constant percentage of gauges/buoy falling in each quintile. The bars represent the percentage of gauges/buoys of the older hindcasts falling in the same quantiles, in normal conditions (blue bars), and for the part of the signal beyond the 95th percentile. The skill indicators are RMSESSH and NRMSESSH (AB), and RMSEHs and NRMSEHs (C, D). Maps of percentage improvement of RMSE beyond the 95th percentile, for SSH (E) and Hs (F).
It is worth mentioning that the setup of the physics in WW3 and D-FLOW in (Mentaschi et al., 2017; Vousdoukas et al., 2018) is similar to that of the present study, and the offshore skill comparable. Therefore, the nearshore improvement of skill is due to the increase in resolution and to the coupling.
Limitations
Our model represents a clear improvement on previous lower resolution hindcasts. However, it comes with a number of limitations that will be listed in this section. Tidal forcing was not included in the setup, as we aimed to isolate the contribution of the storm surges. While tide elevation can be added a-posteriori, from tidal databases such as FES2014 (Lyard et al., 2021) or TPXO (Dushaw et al., 1997), recent studies pointed to the importance on non-linear interactions between tides and storm surges nearshore (Krien et al., 2017; Fernández-Montblanc et al., 2019; Arns et al., 2020; Tausía et al., 2023). Such non-linear interactions are not explicitly accounted for in this study.
As a resolution of 2-4 km is not enough to resolve exhaustively everywhere coastal processes such as nearshore wave dissipation, we opted not to introduce the nearshore wave-circulation coupling described by (Bennis et al., 2011) and implemented in SCHISM by (Martins et al., 2022). Therefore, the water levels at the coast do not include the wave setup. This is a common approach for large-scale models, but it should be mentioned because it is important for certain applications.
The ability of our model to capture tropical cyclones (TCs) is still limited by the offshore grid resolution (~ 50 km) and by the ability of the forcing fields from ERA5 to reproduce TCs. This is another known limitation of large-scale models (e.g. Bloemendaal et al., 2019) and requires separate special modelling to be addressed.
As mentioned in the methods section, ERA5 forcing was selected for its advantages over other products (high spatial resolution for a global reanalysis, long time extent, ability to detect long-term trends). However, ERA5 comes with significant underestimation of extreme winds (e.g. Campos et al., 2022), which reflects in negative bias especially of extreme Hs.
Last but not least, this study was conducted using a 2D barotropic model for storm surges, which comes with a limited ability to reproduce 3D ocean circulation and currents. Though an accurate representation of 3D circulation is not an objective of this study, this could have an impact on storm surges, e.g., in relation to phenomena such as the Coriolis setup. Furthermore, this can have consequences on waves, related to the current-induced Doppler effect.
Final remarks
In this study we developed the first global coupled hindcast of waves and storm surges on unstructured meshes, reaching a nearshore spatial resolution of 2-4 km, unprecedented for waves. Thanks to its high resolution, our hindcast achieves better skill nearshore than previous, lower resolution ones, in particular the ones developed in the past by the authors (Mentaschi et al., 2017; Vousdoukas et al., 2018). This offers several opportunities for advancements in understanding and quantification of coastal hazard and risk at large scale. For example, it offers the potential to better characterize areas of erosion or accretion, and reproduce the occurrence of past flooding events. Its extended time span (50 years, with its extension up to 70 years ongoing) offers opportunities for attribution studies in view of climate change.
The model and hindcast presented advance the state of the art on global scale coastal hydrodynamic modelling, and the limitations discussed represent some key challenges for future further improvement. Some of them can only be addressed in the long term, by running new models on different meshes using improved approaches. Among these, the obvious need for even higher spatial resolution to reproduce the coastal interaction between circulation and waves, the need of even better atmospheric forcing for more accurate modelling TCs and extremes in general, and the use of 3D circulation models to better reproduce ocean circulation.
Other limitations can be partially overcome via Machine-Learning post-processing of our results. Noticeably, the systematic errors of key quantities, such as SSH and Hs, can be reduced via bias correction versus long-term altimetric observations, similar to what is done with simulated climate variables by general circulation and regional climate models (e.g. Lange, 2019). The non-linear tide-surge interactions can be inferred from model runs that consider both, and our results of SSH can be corrected accordingly (Arns et al., 2020). Separate, high-resolution models can be run for TCs, for a better characterization of extreme conditions at lower latitudes, as done by (Vousdoukas et al., 2018). Wave runup can be parameterized using empirical approaches such as (Stockdon et al., 2006). These and other improvements will be the subject of follow-up research and will contribute to the creation of an even more accurate global database for coastal applications and engineering.
Data availability statement
The raw data supporting the conclusions of this article will be made available by the authors, without undue reservation.
Author contributions
This study was conceived by LM, MV, TF-M, LF. LM and AR carried out the model development. TF-M generated the mesh. LM, AR and TF-M contributed to the model setup. LM and GG-S worked on the implementation. The validation was carried out by LM, GG-S, TF-M and EV. LM drafted the manuscript receiving contributions and suggestions from all the coauthors.
Acknowledgments
The authors acknowledge Xavier Bertin for his useful suggestions and careful review of the manuscript.
Conflict of interest
Author EV is employed by the company Unisystems Luxembourg Sarl. Author AR is employed by the company BGS IT and E.
The remaining authors declare that the research was conducted in the absence of any commercial or financial relationships that could be construed as a potential conflict of interest.
Publisher’s note
All claims expressed in this article are solely those of the authors and do not necessarily represent those of their affiliated organizations, or those of the publisher, the editors and the reviewers. Any product that may be evaluated in this article, or claim that may be made by its manufacturer, is not guaranteed or endorsed by the publisher.
References
Abdolali A., Roland A., van der Westhuysen A., Meixner J., Chawla A., Hesser T. J., et al. (2020). Large-scale hurricane modeling using domain decomposition parallelization and implicit scheme implemented in WAVEWATCH III wave model. Coast. Eng. 157, 103656. doi: 10.1016/j.coastaleng.2020.103656
Abdolali A., van der Westhuysen A., Ma Z., Mehra A., Roland A., Moghimi S. (2021). Evaluating the accuracy and uncertainty of atmospheric and wave model hindcasts during severe events using model ensembles. Ocean Dyn. 71, 217–235. doi: 10.1007/s10236-020-01426-9
Amores A., Marcos M., Carrió D. S., Gómez-Pujol L. (2020). Coastal impacts of Storm Gloria (January 2020) over the north-western Mediterranean. Nat. Hazards Earth Syst. Sci. 20, 1955–1968. doi: 10.5194/nhess-20-1955-2020
Ardhuin F., Herbers T. H. (2005). Numerical and physical diffusion: Can wave prediction models resolve directional spread? J. Atmospheric Oceanic Technol. 22 (7), 886–95.
Ardhuin F., Rogers E., Babanin A. V., Filipot J.-F. J.-F., Magne R., Roland A., et al. (2010). Semiempirical dissipation source functions for ocean waves. Part I: definition, calibration, and validation. J. Phys. Oceanogr. 40, 1917–1941. doi: 10.1175/2010JPO4324.1
Arns A., Wahl T., Wolff C., Vafeidis A. T., Haigh I. D., Woodworth P., et al. (2020). Non-linear interaction modulates global extreme sea levels, coastal flood exposure, and impacts. Nat. Commun. 11, 1918. doi: 10.1038/s41467-020-15752-5
Babanin A. V., Hsu T.-W., Roland A., Ou S.-H., Doong D.-J., Kao C. C. (2011). Spectral wave modelling of Typhoon Krosa. Nat. Hazards Earth Syst. Sci. 11, 501–511. doi: 10.5194/nhess-11-501-2011
Bakhtyar R., Maitaria K., Velissariou P., Trimble B., Mashriqui H., Moghimi S., et al. (2020). A new 1D/2D coupled modeling approach for a riverine-estuarine system under storm events: application to delaware river basin. J. Geophys. Res. Ocean. 125. doi: 10.1029/2019JC015822
Battjes J. A., Janssen J. P. F. M. (1978). “Energy Loss and set-up due to breaking of random waves,” in Proceedings of the Coastal Engineering Conference, New York, NY: American Society of Civil Engineers. 569–587. doi: 10.9753/icce.v16.32
Bennis A.-C., Ardhuin F., Dumas F. (2011). On the coupling of wave and three-dimensional circulation models: Choice of theoretical framework, practical implementation and adiabatic tests. Ocean Model. 40, 260–272. doi: 10.1016/j.ocemod.2011.09.003
Benoit M., Marcos F., Becq F. (1997). TOMAWAC. A prediction model for offshore and nearshore storm waves (France).
Bertin X., Bruneau N., Breilh J. F., Fortunato A. B., Karpytchev M. (2012). Importance of wave age and resonance in storm surges: The case Xynthia, Bay of Biscay. Ocean Model. 42, 16–30. doi: 10.1016/j.ocemod.2011.11.001
Bertin X., Li K., Roland A., Bidlot J.-R. (2015). The contribution of short-waves in storm surges: Two case studies in the Bay of Biscay. Cont. Shelf Res. 96, 1–15. doi: 10.1016/j.csr.2015.01.005
Bloemendaal N., Muis S., Haarsma R. J., Verlaan M., Irazoqui Apecechea M., de Moel H., et al. (2019). Global modeling of tropical cyclone storm surges using high-resolution forecasts. Clim. Dyn. 52, 5031–5044. doi: 10.1007/s00382-018-4430-x
Brown J. M., Wolf J. (2009). Coupled wave and surge modelling for the eastern Irish Sea and implications for model wind-stress. Cont. Shelf Res. 29, 1329–1342. doi: 10.1016/j.csr.2009.03.004
Brus S. R., Wolfram P. J., Van Roekel L. P., Meixner J. D. (2021). Unstructured global to coastal wave modeling for the Energy Exascale Earth System Model using WAVEWATCH III version 6.07. Geosci. Model. Dev. 14, 2917–2938. doi: 10.5194/gmd-14-2917-2021
Campos R. M., Gramcianinov C. B., de Camargo R., da Silva Dias P. L. (2022). Assessment and calibration of ERA5 severe winds in the atlantic ocean using satellite data. Remote Sens. 14, 4918. doi: 10.3390/rs14194918
Causio S., Ciliberti S. A., Clementi E., Coppini G., Lionello P. (2021). A modelling approach for the assessment of wave-currents interaction in the black sea. J. Mar. Sci. Eng. 9, 893. doi: 10.3390/jmse9080893
Cavaleri L. (2009). Wave modeling - missing the peaks. J. Phys. Oceanogr. 39, 2757–2778. doi: 10.1175/2009JPO4067.1
Chen C., Liu H., Beardsley R. C. (2003). An unstructured grid, finite-volume, three-dimensional, primitive equations ocean model: application to coastal ocean and estuaries. J. Atmos. Ocean. Technol. 20, 159–186. doi: 10.1175/1520-0426(2003)020<0159:AUGFVT>2.0.CO;2
Clementi E., Oddo P., Drudi M., Pinardi N., Korres G., Grandi A. (2017). Coupling hydrodynamic and wave models: first step and sensitivity experiments in the Mediterranean Sea. Ocean Dyn. 67, 1293–1312. doi: 10.1007/s10236-017-1087-7
Dodet G., Piolle J.-F., Quilfen Y., Abdalla S., Accensi M., Ardhuin F., et al. (2020). The Sea State CCI dataset v1: towards a sea state climate data record based on satellite observations. Earth Syst. Sci. Data 12, 1929–1951. doi: 10.5194/essd-12-1929-2020
Dushaw B. D., Egbert G. D., Worcester P. F., Cornuelle B. D., Howe B. M., Metzger K. (1997). A TOPEX/POSEIDON global tidal model (TPXO.2) and barotropic tidal currents determined from long-range acoustic transmissions. Prog. Oceanogr. 40, 337–367. doi: 10.1016/S0079-6611(98)00008-1
Erikson L., Morim J., Hemer M., Young I., Wang X. L., Mentaschi L., et al. (2022). Global ocean wave fields show consistent regional trends between 1980 and 2014 in a multi-product ensemble. Commun. Earth Environ. 3, 320. doi: 10.1038/s43247-022-00654-9
Federico I., Pinardi N., Coppini G., Oddo P., Lecci R., Mossa M. (2017). Coastal ocean forecasting with an unstructured grid model in the southern Adriatic and northern Ionian seas. Nat. Hazards Earth Syst. Sci. 17, 45–59. doi: 10.5194/nhess-17-45-2017
Fernández-Montblanc T., Vousdoukas M. I., Ciavola P., Voukouvalas E., Mentaschi L., Breyiannis G., et al. (2019). Towards robust pan-European storm surge forecasting. Ocean Model. 133. doi: 10.1016/j.ocemod.2018.12.001
Fernández-Montblanc T., Vousdoukas M. I., Mentaschi L., Ciavola P. (2020). A Pan-European high resolution storm surge hindcast. Environ. Int. 135. doi: 10.1016/j.envint.2019.105367
Ferrarin C., Umgiesser G., Cucco A., Hsu T.-W., Roland A., Amos C. L. (2008). Development and validation of a finite element morphological model for shallow water basins. Coast. Eng. 55, 716–731. doi: 10.1016/j.coastaleng.2008.02.016
Haigh I. D., Marcos M., Talke S. A., Woodworth P. L., Hunter J. R., Hague B. S., et al. (2022). GESLA Version 3: A major update to the global higher-frequency sea-level dataset. Geosci. Data J. doi: 10.1002/gdj3.174
Hasselmann K., Barnett T. P., Bouws E., Carlson H., Cartwright D. E., Eake K., et al. (1973). Measurements of wind-wave growth and swell decay during the Joint North Sea Wave Project (JONSWAP). Ergnzungsh. zur Dtsch. Hydrogr. Z. R. 8, 95.
Hasselmann S., Hasselmann K. (1985). Computations and parametrizations of the nonlinear energy transfer in a gravity-wave spectrum. I: A new method for efficient computations of the exact nonlinear transfer integral. J. Phys. Oceanogr. 15, 1369–1377. doi: 10.1175/1520-0485(1985)015<1369:CAPOTN>2.0.CO;2
Hersbach H., Bell B., Berrisford P., Hirahara S., Horányi A., Muñoz-Sabater J., et al. (2020). The ERA5 global reanalysis. Q. J. R. Meteorol. Soc 146, 1999–2049. doi: 10.1002/qj.3803
Hervouet J.-M., Bates P. (2000). The TELEMAC modelling system Special issue. Hydrol. Process. 14, 2207–2208. doi: 10.1002/1099-1085(200009)14:13<2207::AID-HYP22>3.0.CO;2-B
Hoskins B. J., Valdes P. J. (1990). On the existence of storm-tracks. J. Atmos. Sci. 47, 1854–1864. doi: 10.1175/1520-0469(1990)047<1854:OTEOST>2.0.CO;2
Hsu T. W., Liau J. M., Ou S. H., Zanke U. C., Roland A., Mewis P. (2005). Development and implement of a spectral finite element wave model. InProc. Fifth COPRI Int. Conf. on Ocean Wave Measurement and Analysis.
Hsu T. W., Liau J. M., Ou S. H., Shin C. Y. (2008). WWM extended to account for wave diffraction on a current over a rapidly varying topography. Int. Confer. Offshore Mechanics Arctic Engineer. 48210, 729–736. doi: 10.1115/OMAE2008-57981
Janssen P. A. E. M. (1989). Wave-induced stress and the drag of air flow over sea waves. J. Phys. Oceanogr. 19, 745–754. doi: 10.1175/1520-0485(1989)019<0745:WISATD>2.0.CO;2
Krien Y., Testut L., Islam A. K. M. S., Bertin X., Durand F., Mayet C., et al. (2017). Towards improved storm surge models in the northern Bay of Bengal. Cont. Shelf Res. 135, 58–73. doi: 10.1016/j.csr.2017.01.014
Lange S. (2019). Trend-preserving bias adjustment and statistical downscaling with ISIMIP3BASD (v1.0). Geosci. Model. Dev. 12, 3055–3070. doi: 10.5194/gmd-12-3055-2019
Law-Chune S., Aouf L., Dalphinet A., Levier B., Drillet Y., Drevillon M. (2021). WAVERYS: a CMEMS global wave reanalysis during the altimetry period. Ocean Dyn. 71, 357–378. doi: 10.1007/s10236-020-01433-w
Lira-Loarca A., Cáceres-Euse A., De-Leo F., Besio G. (2022). Wave modeling with unstructured mesh for hindcast, forecast and wave hazard applications in the Mediterranean Sea. Appl. Ocean Res. 122, 103118. doi: 10.1016/j.apor.2022.103118
Luettich R. A., Westerink J. J., Scheffner N. W. (1992). ADCIRC: an advanced three-dimensional circulation model for shelves, coasts, and estuaries. Report 1, Theory and methodology of ADCIRC-2DD1 and ADCIRC-3DL.
Lyard F. H., Allain D. J., Cancet M., Carrère L., Picot N. (2021). FES2014 global ocean tide atlas: design and performance. Ocean Sci. 17, 615–649. doi: 10.5194/os-17-615-2021
Lynch D. R., Ip J. T. C., Naimie C. E., Werner F. E. (1996). Comprehensive coastal circulation model with application to the Gulf of Maine. Cont. Shelf Res. 16, 875–906. doi: 10.1016/0278-4343(95)00028-3
Martins K., Bertin X., Mengual B., Pezerat M., Lavaud L., Guérin T., et al. (2022). Wave-induced mean currents and setup over barred and steep sandy beaches. Ocean Model. 179, 102110. doi: 10.1016/j.ocemod.2022.102110
McGranahan G., Balk D., Anderson B. (2007). The rising tide: assessing the risks of climate change and human settlements in low elevation coastal zones. Environ. Urban. 19, 17–37. doi: 10.1177/0956247807076960
Mentaschi L., Besio G., Cassola F., Mazzino a. (2013). Problems in RMSE-based wave model validations. Ocean Model. 72, 53–58. doi: 10.1016/j.ocemod.2013.08.003
Mentaschi L., Besio G., Cassola F., Mazzino A. (2015a). Performance evaluation of wavewatch III in the mediterranean sea. Ocean Model. 90, 82–94. doi: 10.1016/j.ocemod.2015.04.003
Mentaschi L., Kakoulaki G., Vousdoukas M. I., Voukouvalas E., Feyen L., Besio G. (2018). Parameterizing unresolved obstacles with source terms in wave modeling: A real-world application. Ocean Model. 126, 77–84. doi: 10.1016/j.ocemod.2018.04.003
Mentaschi L., Pérez J., Besio G., Mendez F. J., Menendez M. (2015b). Parameterization of unresolved obstacles in wave modelling: A source term approach. Ocean Model. 96, 93–102. doi: 10.1016/j.ocemod.2015.05.004
Mentaschi L., Vousdoukas M., Besio G., Feyen L. (2019). alphaBetaLab: Automatic estimation of subscale transparencies for the Unresolved Obstacles Source Term in ocean wave modelling. SoftwareX 9, 1–6. doi: 10.1016/j.softx.2018.11.006
Mentaschi L., Vousdoukas M., Montblanc T. F., Kakoulaki G., Voukouvalas E., Besio G., et al. (2020). Assessment of global wave models on regular and unstructured grids using the Unresolved Obstacles Source Term. Ocean Dyn. 70, 1475–1483. doi: 10.1007/s10236-020-01410-3
Mentaschi L., Vousdoukas M. I., Voukouvalas E., Dosio A., Feyen L. (2017). Global changes of extreme coastal wave energy fluxes triggered by intensified teleconnection patterns. Geophys. Res. Lett. 44, 2416–2426. doi: 10.1002/2016GL072488
Micaletto G., Barletta I., Mocavero S., Federico I., Epicoco I., Verri G., et al. (2022). Parallel implementation of the SHYFEM (System of HydrodYnamic Finite Element Modules) model. Geosci. Model. Dev. 15, 6025–6046. doi: 10.5194/gmd-15-6025-2022
Moghimi S., van der Westhuysen A., Abdolali A., Myers E., Vinogradov S., Ma Z., et al. (2020). Development of an ESMF based flexible coupling application of ADCIRC and WAVEWATCH III for high fidelity coastal inundation studies. J. Mar. Sci. Eng. 8, 308. doi: 10.3390/jmse8050308
Morim J., Erikson L. H., Hemer M., Young I., Wang X., Mori N., et al. (2022). A global ensemble of ocean wave climate statistics from contemporary wave reanalysis and hindcasts. Sci. Data 9, 358. doi: 10.1038/s41597-022-01459-3
Muis S., Verlaan M., Winsemius H. C., Aerts J. C. J. H., Ward P. J. (2016). A global reanalysis of storm surges and extreme sea levels. Nat. Commun. 7, 11969. doi: 10.1038/ncomms11969
Nidheesh A. G., Lengaigne M., Vialard J., Unnikrishnan A. S., Dayan H. (2013). Decadal and long-term sea level variability in the tropical Indo-Pacific Ocean. Clim. Dyn. 41, 381–402. doi: 10.1007/s00382-012-1463-4
Park K., Federico I., Di Lorenzo E., Ezer T., Cobb K. M., Pinardi N., et al. (2022). The contribution of hurricane remote ocean forcing to storm surge along the Southeastern U.S. coast. Coast. Eng. 173, 104098. doi: 10.1016/j.coastaleng.2022.104098
Patankar S. V. (1980). Numerical heat transfer and fluid flow (CRC Press). doi: 10.1201/9781482234213
Patankar S. V. (1981). A CALCULATION PROCEDURE FOR TWO-DIMENSIONAL ELLIPTIC SITUATIONS. Numer. Heat Transf. 4, 409–425. doi: 10.1080/01495728108961801
Pawlowicz R., Beardsley B., Lentz S. (2002). Classical tidal harmonic analysis including error estimates in MATLAB using T_TIDE. Comput. Geosci. 28, 929–937. doi: 10.1016/S0098-3004(02)00013-4
Perez J., Menendez M., Losada I. J. (2017). GOW2: A global wave hindcast for coastal applications. Coast. Eng. 124, 1–11. doi: 10.1016/j.coastaleng.2017.03.005
Pringle W. J., Wirasaet D., Roberts K. J., Westerink J. J. (2021). Global storm tide modeling with ADCIRC v55: unstructured mesh design and performance. Geosci. Model. Dev. 14, 1125–1145. doi: 10.5194/gmd-14-1125-2021
Pujol M. I., Dupuy S., Vergara O., Sánchez Román A., Faugère Y., Prandi P., et al. (2023). Refining the Resolution of DUACS Along-Track Level-3 Sea Level Altimetry Products. Remote Sensing 15 (3), 793. doi: 10.3390/rs15030793
Qi J., Chen C., Beardsley R. C., Perrie W., Cowles G. W., Lai Z. (2009). An unstructured-grid finite-volume surface wave model (FVCOM-SWAVE): Implementation, validations and applications. Ocean Modelling 28 (1-3), 153–66.
Rascle N., Ardhuin F. (2013). A global wave parameter database for geophysical applications. Part 2: Model validation with improved source term parameterization. Ocean Model. 70, 174–188. doi: 10.1016/j.ocemod.2012.12.001
Renfrew I. A., Barrell C., Elvidge A. D., Brooke J. K., Duscha C., King J. C., et al. (2021). An evaluation of surface meteorology and fluxes over the Iceland and Greenland Seas in ERA5 reanalysis: The impact of sea ice distribution. Q. J. R. Meteorol. Soc 147, 691–712. doi: 10.1002/qj.3941
Ricchiuto M., Csík Á., Deconinck H. (2005). Residual distribution for general time-dependent conservation laws. J. Comput. Phys. 209, 249–289. doi: 10.1016/j.jcp.2005.03.003
Roberts K. J., Pringle W. J., Westerink J. J. (2019). OceanMesh2D 1.0: MATLAB-based software for two-dimensional unstructured mesh generation in coastal ocean modeling. Geosci. Model. Dev. 12, 1847–1868. doi: 10.5194/gmd-12-1847-2019
Roland A., Mewis P., Zanke U., Ou S. H., Hsu T. W., Liau J. M. (2005). Verification and Improvement of a Finite Element spectral Wave model. Proceedings of Ocean Waves Measurement and Analysis Fifth International Symposium WAVES.
Roland A., Cucco A., Ferrarin C., Hsu T.-W., Liau J.-M., Ou S.-H., et al. (2009). On the development and verification of a 2-D coupled wave-current model on unstructured meshes. J. Mar. Syst. 78, S244–S254. doi: 10.1016/j.jmarsys.2009.01.026
Roland A., Zhang Y. J., Wang H. V., Meng Y., Teng Y.-C., Maderich V., et al. (2012). A fully coupled 3D wave-current interaction model on unstructured grids. J. Geophys. Res. Ocean. 117, n/a–n/a. doi: 10.1029/2012JC007952
Saillour T., Cozzuto G., Ligorio F., Lupoi G., Bourban S. (2021). “Modeling the world oceans with TELEMAC,” in Proceedings of the papers submitted to the 2020 TELEMAC-MASCARET User Conference, , October 2021. 86–91.
Sikirić M. D., Ivanković D., Roland A., Ivatek-Šahdan S., Tudor M. (2019). Operational wave modelling in the Adriatic Sea with the Wind Wave Model. Meteorology and Climatology of the Mediterranean and Black Seas 2019, 81–95.
Smith G. A., Hemer M., Greenslade D., Trenham C., Zieger S., Durrant T. (2021). Global wave hindcast with Australian and Pacific Island Focus: From past to present. Geosci. Data J. 8, 24–33. doi: 10.1002/gdj3.104
Sørensen O. R., Kofoed-Hansen H., Rugbjerg M., Sørensen L. S. (2004). A third-generation spectral wave model using an unstructured finite volume technique. In Coastal Engineering 894–906.
Staneva J., Wahle K., Günther H., Stanev E. (2016). Coupling of wave and circulation models in coastal–ocean predicting systems: a case study for the German Bight. Ocean Sci. 12, 797–806. doi: 10.5194/os-12-797-2016
Stellema A., Sen Gupta A., Taschetto A. S., Feng M. (2022). Pacific Equatorial Undercurrent: Mean state, sources, and future changes across models. Front. Clim. 4. doi: 10.3389/fclim.2022.933091
Stockdon H. F., Holman R. A., Howd P. A., Sallenger A. H., Sallenger J. A.H. (2006). Empirical parameterization of setup, swash, and runup. Coast. Eng. 53, 573–588. doi: 10.1016/j.coastaleng.2005.12.005
Tadesse M., Wahl T., Cid A. (2020). Data-driven modeling of global storm surges. Front. Mar. Sci. 7. doi: 10.3389/fmars.2020.00260
Tausía J., Delaux S., Camus P., Rueda A., Méndez F., Bryan K. R., et al. (2023). Rapid response data-driven reconstructions for storm surge around New Zealand. Appl. Ocean Res. 133, 103496. doi: 10.1016/j.apor.2023.103496
Tebaldi C., Ranasinghe R., Vousdoukas M., Rasmussen D. J., Vega-Westhoff B., Kirezci E., et al. (2021). Extreme sea levels at different global warming levels. Nat. Clim. Change 11, 746–751. doi: 10.1038/s41558-021-01127-1
Toomey T., Amores A., Marcos M., Orfila A. (2022). Coastal sea levels and wind-waves in the Mediterranean Sea since 1950 from a high-resolution ocean reanalysis. Front. Mar. Sci. 9. doi: 10.3389/fmars.2022.991504
Tracy F. T., Tracy B. A., Hanson J. L. (2006). Sorting out waves with a fast sort algorithm. ERDC MSRC Resource (Fall 2006). US Army Eng. Res. Dev. Center Vicksburg MS.
Umgiesser G., Zampato L. (2001). Hydrodynamic and salinity modeling of the Venice channel network with coupled 1-D–2-D mathematical models. Ecol. Modell. 138, 75–85. doi: 10.1016/S0304-3800(00)00394-X
Vousdoukas M. I., Mentaschi L., Hinkel J., Ward P. J., Mongelli I., Ciscar J.-C., et al. (2020). Economic motivation for raising coastal flood defenses in Europe. Nat. Commun. 11, 2119. doi: 10.1038/s41467-020-15665-3
Vousdoukas M. I., Mentaschi L., Voukouvalas E., Verlaan M., Feyen L. (2017). Extreme sea levels on the rise along Europe’s coasts. Earth’s Futur. doi: 10.1002/2016EF000505
Vousdoukas M. I., Mentaschi L., Voukouvalas E., Verlaan M., Jevrejeva S., Jackson L. P., et al. (2018). Global probabilistic projections of extreme sea levels show intensification of coastal flood hazard. Nat. Commun. 9, 2360. doi: 10.1038/s41467-018-04692-w
Wahl T., Haigh I. D., Nicholls R. J., Arns A., Dangendorf S., Hinkel J., et al. (2017). Understanding extreme sea levels for broad-scale coastal impact and adaptation analysis. Nat. Commun. 8, 16075. doi: 10.1038/ncomms16075
Wang X., Verlaan M., Veenstra J., Lin H. X. (2022). Data-assimilation-based parameter estimation of bathymetry and bottom friction coefficient to improve coastal accuracy in a global tide model. Ocean Sci. 18, 881–904. doi: 10.5194/os-18-881-2022
Weatherall P., Marks K. M., Jakobsson M., Schmitt T., Tani S., Arndt J. E., et al. (2015). A new digital bathymetric model of the world’s oceans. Earth Sp. Sci. 2, 331–345. doi: 10.1002/2015EA000107
Woodworth P. L., Hunter J. R., Marcos M., Caldwell P., Menéndez M., Haigh I. (2016). Towards a global higher-frequency sea level dataset. Geosci. Data J. 3, 50–59. doi: 10.1002/gdj3.42
Zhang Y., Baptista A. M. (2008). SELFE: A semi-implicit Eulerian–Lagrangian finite-element model for cross-scale ocean circulation. Ocean Model. 21, 71–96. doi: 10.1016/j.ocemod.2007.11.005
Zhang Y. J., Fernandez-Montblanc T., Pringle W. J., Yu H. C., Cui L. (2023). Global seamless tidal simulation using a 3D unstructured-grid model (SCHISM v5.10.0). Geosci. Model. Dev. doi: 10.5194/gmd-16-2565-2023
Zhang Y. J., Ye F., Stanev E. V., Grashorn S. (2016). Seamless cross-scale modeling with SCHISM. Ocean Model. 102, 64–81. doi: 10.1016/j.ocemod.2016.05.002
Keywords: ocean waves, storm surge, global ocean modelling, high-resolution, unstructured grid, coastal hazard, SCHISM-WWMV
Citation: Mentaschi L, Vousdoukas MI, García-Sánchez G, Fernández-Montblanc T, Roland A, Voukouvalas E, Federico I, Abdolali A, Zhang YJ and Feyen L (2023) A global unstructured, coupled, high-resolution hindcast of waves and storm surge. Front. Mar. Sci. 10:1233679. doi: 10.3389/fmars.2023.1233679
Received: 02 June 2023; Accepted: 02 August 2023;
Published: 30 August 2023.
Edited by:
Jinbao Song, Zhejiang University, ChinaCopyright © 2023 Mentaschi, Vousdoukas, García-Sánchez, Fernández-Montblanc, Roland, Voukouvalas, Federico, Abdolali, Zhang and Feyen. This is an open-access article distributed under the terms of the Creative Commons Attribution License (CC BY). The use, distribution or reproduction in other forums is permitted, provided the original author(s) and the copyright owner(s) are credited and that the original publication in this journal is cited, in accordance with accepted academic practice. No use, distribution or reproduction is permitted which does not comply with these terms.
*Correspondence: Lorenzo Mentaschi, lorenzo.mentaschi@unibo.it; Luc Feyen, luc.feyen@ec.europa.eu