Island Mass Effect: A Review of Oceanic Physical Processes
 Chiara De Falco
 Fabien Desbiolles
 Annalisa Bracco
 Claudia Pasquero
- 1NORCE Norwegian Research Centre and Bjerknes Centre for Climate Research, Bergen, Norway
- 2Department of Earth and Environmental Sciences, University of Milan-Bicocca, Milan, Italy
- 3CIMA Research Foundation, Savona, Italy
- 4School of Earth and Atmospheric Sciences, Georgia Institute of Technology, Atlanta, GA, United States
Increased Net Primary Productivity (NPP) around small islands have been documented worldwide. Despite having been known for decades, the interactions between physical and biogeochemical processes behind this phenomenon – that takes the name of Island Mass Effect –remain unclear. In this paper we review the physical processes involved while proposing a method to identify the prevailing mechanisms by analyzing their imprint on NPP and Sea Surface Temperature (SST). These mechanisms can be quite different, but all enhance vertical exchanges, increasing the input of nutrients in the euphotic layer and favoring biological productivity. Nutrient-rich deeper waters are brought up to the surface through upwelling and mixing, leaving a cold imprint on the SST as well. Here we analyze satellite data of SST and NPP around small islands and archipelagos to catalog the physical mechanisms that favor the Island Mass Effect, with the aid of oceanic and atmospheric reanalysis. The multiplicity of these processes and the convolution of their interactions highlight the complexity of the physical forcing on the biomass production and the uniqueness of each island. However, analysis from 19 small islands throughout the tropics shows that two kinds of SST patterns emerge, depending on the size and altitude of the island. Around islands with considerable elevation and greatest diameters, cold/warm anomalies, most likely corresponding to upwelling/downwelling zones, emerge. This signal can be mainly ascribed to oceanic and atmospheric forcing. Around small islands, on the other hand, warm anomalies do not appear and only local cooling, associated with current-island interactions, is found. In the vicinity of a single island, more than one process responsible for the increased nutrient input into the euphotic layer might coexist, the prevailing one varying along the year and depending on the strength and direction of the incoming atmospheric and oceanic flow.
1 Introduction
The enhancement of primary productivity around islands has been reported since the late 1950’s and is known as Island Mass Effect (IME) (Doty and Oguri, 1956), yet much remains to be understood about the prevalence and drivers of this ecologically important phenomenon (Gove et al., 2016). IME refers to a spectrum of biological and physical processes, in close proximity, and downstream of islands and reefs (Hamner and Hauri, 1981). Plumes with high concentration of chlorophyll-a have been detected upstream of islands (Hamner and Hauri, 1981; Gove et al., 2006; Liu et al., 2014), as well as propagating downstream (Coutis and Middleton, 2002; Sasamal, 2006; Dong et al., 2007; Andrade et al., 2014; Zeiden et al., 2019). Long-term phytoplankton biomass around islands has been observed to be as much as 86% higher than offshore (Gove et al., 2016).
Increased productivity has been measured near several islands, however, a systematic and worldwide survey is lacking, with most studies carried out in few geographically confined locations. Gove et al. (2016) focused on coral reefs, proving that the increase in net primary productivity (NPP) is a near-ubiquitous feature, affecting as many as 91% of the reefs across the tropical Pacific.
The physical processes at the origin of this phenomenon can be differ but all result in an enhanced input of nutrients in the euphotic layer, which favors biological productivity. Nutrient rich deeper waters are brought up towards the surface through upwelling and mixing. In the lee of an island, the generation of cyclonic eddies via barotropic or baroclinic instabilities (Dong et al., 2007; Teinturier et al., 2010), and flow divergence (Hasegawa et al., 2004; Chang et al., 2013) are common upwelling mechanisms. Upstream of an island, currents impinging on the bathymetry can uplift the isotherms and lead to vertical transport (Hamner and Hauri, 1981; Gove et al., 2006; Liu et al., 2014). Increased vertical shear, due to the interaction between strong incoming currents and bottom friction, can enhance vertical mixing and intrude water from the thermocline in the mixed layer (De Falco et al., 2020). Finally tidal waves interacting with the sea floor can generate internal waves that deliver cold and nutrient-rich waters to the surface (Wyatt et al., 2020; Storlazzi et al., 2020).
Several land-born factors may also lead to the IME, such as nutrient intake from island runoff (Bell, 1992), atoll flushing (Gove et al., 2016), groundwater discharge (Hwang et al., 2005; Street et al., 2008) and human activities that increase nearshore nutrient concentrations above natural levels (Vitousek et al., 1997). All the aforementioned processes can singularly be the sole mechanism responsible for a local increase of the NPP around small islands or act concurrently. This review focuses on the oceanic physical processes linked to the IME. A local cooling of SST is considered an indicator of enhanced vertical exchanges in the upper column of the ocean and is used in this work to differentiate between IME-inducing dynamical and biogeochemical mechanisms.
As mentioned, the oceanic and atmospheric processes linked to the enhancement of primary productivity have been thoroughly investigated around some islands and archipelagos, but several of the smaller and/or remoter islands have never been studied. The complex spatial and temporal variability of these processes, the wide spectrum of disciplines involved -from physics to biology and chemistry- and the paucity of in-situ measurements with sufficient resolution, contribute to the lack of a synthesis of possible mechanisms involved under different conditions (Hasegawa et al., 2009).
Anthropogenic climate change-induced oceanographic and biogeochemical changes have occurred in the last 50 years and will continue over the next decades. The IME is of key to sustain thriving ecosystems, and changes in its driving mechanisms would affect the local biodiversity and the socio-economic well being of the local population relying on the marine ecosystem services. In order to predict the extent of these alterations we need to understand the unique combination of processes behind each island IME. Such a task constitutes an incredible challenge: not only we lack adequate instrumental data, but also the implemented modelling studies are sparse and uncoordinated. We thus aim to develop a method that helps identifying the prevailing mechanisms from satellite data.
Here, we present such a method, together with a synthesis of the physical processes involved using sea surface temperature (SST) and net primary productivity (NPP) data from remote sensing as guidance, as well as currents and surface winds from oceanic and atmospheric reanalysis. Surface patterns are linked to the physical processes at play, both for well studied archipelagos and for remote and less investigated areas. The analysis of data from 19 small islands across the tropics shows that two different SST patterns emerge, depending on the size and altitude of the island. The first pattern is characterized by warm/cold anomalies at the two opposite sides of the island and the second by a local, sometimes almost symmetric, cooling. This review is organized as follows: in section 2 we introduce the data and methodologies used in our analysis, while the physical processes responsible for these patterns are presented in section 3. Conclusions follow, focusing on the general lessons learned from this exercise. A detailed list of specific features observed in each area is collected in the Supplementary Materials (Table S1).
2 Data and Methods
With the aim of identifying the physical processes that enhance vertical exchanges, we have analysed 19 islands (see Figure 1 and Table S1), mainly located in the tropical band. Tropical weather exhibits smaller day-to-day variability compared to higher latitudes, allowing us to analyze mechanisms using monthly data. Furthermore, light availability is not a limiting factor in this band, and phytoplankton blooms are typically associated with an enhanced nutrient input. For archipelagos located in areas affected by the monsoons, for example, the variability can be significant month-to-month, but is negligible at daily time scales. We include islands in many different geographical locations, in all the different oceans, and we focus on isolated islands and archipelagos to minimize the effects due to island to island interactions and spurious SST and NPP signals due to advection from nearby sites. Finally, we group islands based on their topographic features, comparing islands and archipelagos with similar geometrical characteristics to identify and explain common processes as well as exceptions. In the remaining of this work, atmospheric and oceanographic conditions are analysed and discussed using annual and monthly means for 2013, an El Niño Southern Oscillation (ENSO) neutral year.
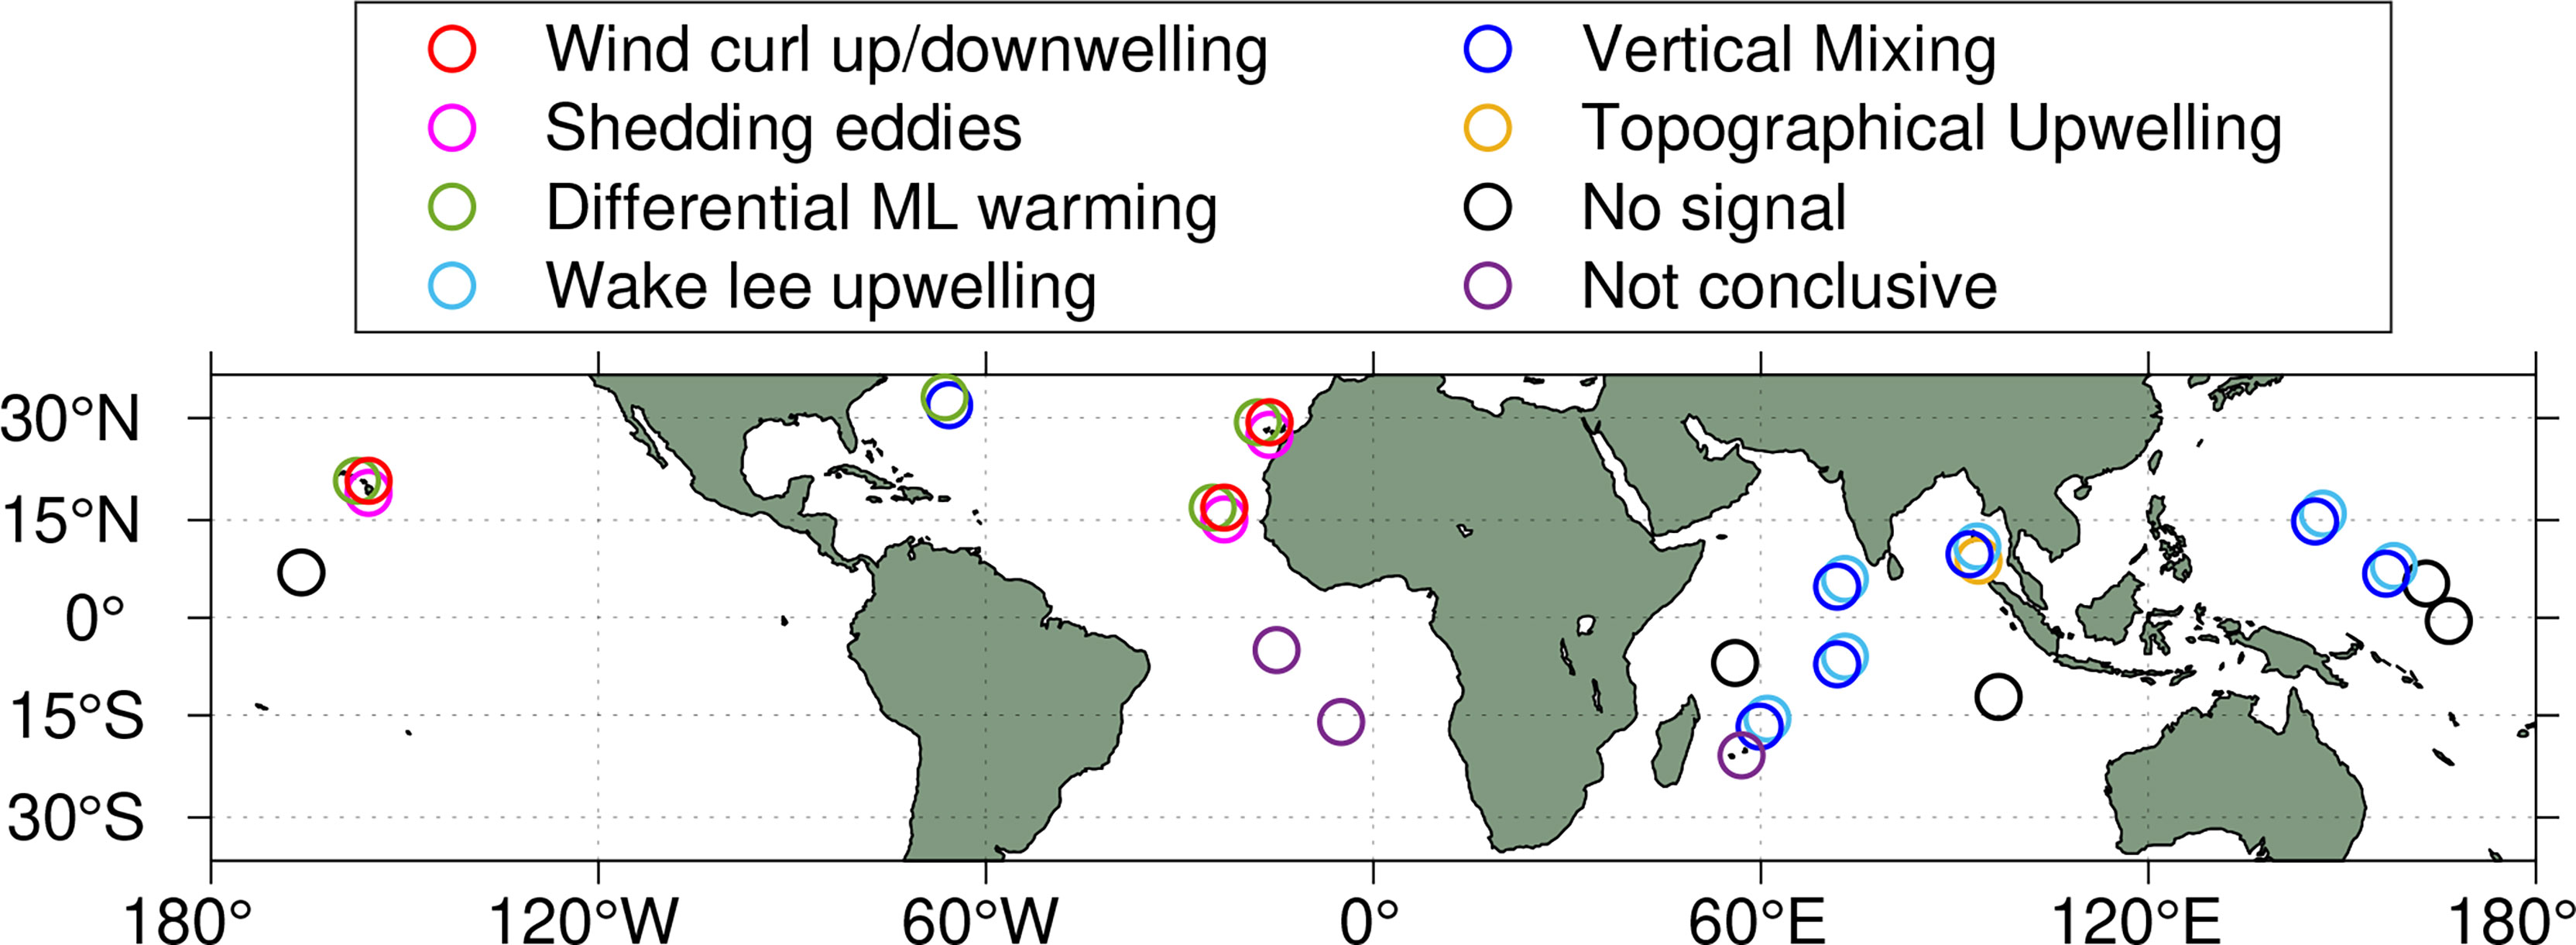
Figure 1 Analysed islands and archipelagos and prevailing physical processes that enhance vertical exchanges in the surrounding waters.
The observational SST dataset of choice is the Group for High Resolution Sea Surface Temperature (GHRSST) Level 4 (UK Met Office, 2005), available from April 2006, with daily temporal and 0.054° spatial resolution. It is based on SST measured by multiple sensors, including the Advanced Very High Resolution Radiometers (AVHRR), the Advanced Along Track Scanning Radiometer (AATSR), the Spinning Enhanced Visible and Infrared Imager (SEVIRI), the Advanced Microwave Scanning Radiometer-EOS (AMSRE) and the Tropical Rainfall Measuring Mission Microwave Imager (TMI). The satellite data were blended with in-situ observations, ships, and buoys (both drifters and moorings).
The atmospheric and the oceanic reanalysis used in this work are ERA5 and SODA3, respectively. ERA5 is the latest climate reanalysis produced by ECMWF (European Centre for Medium-Range Weather Forecasts), providing data on many atmospheric, land-surface, and sea-state parameters together with estimates of uncertainty. In this work, we use monthly 10m winds, total precipitation and radiation. The data are available in the Climate Data Store on regular latitude-longitude grids at 0.25° x 0.25° resolution.
The Simple Ocean Data Assimilation (SODA) (Carton et al., 2018) reanalysis version 3 relies on the ocean component of the NOAA Modular Ocean Model MOM5, the model is eddy permitting. A scheme to reduce the bias in surface fluxes has been implemented. The version chosen is SODA3.7.2, forced with JRA-55 (Japan Meteorological Agency, Japan, 2013). For this work, it provides monthly surface currents. It has been shown that SODA3 sea surface height, a proxy for geostrophic surface currents not assimilated in the reanalysis, well correlates with remotely sensed SSH (correlation coefficient over 0.8 in the Indian Ocean and Tropical Pacific, Carton et al. (2018)), and 40% of the observed annual variance is accounted for in the reanalysis data. We also opted to use surface currents from OSCAR (ESR, 2009) dataset, that derived from satellite retrieved SST and SSH products, averaged in the upper 30 meters of the water column and merged with 10m winds from ERA5, using quasi linear and steady flow equations (Bonjean and Lagerloef, 2002). Despite being provided on a grid of 1/4°spacing, the effective resolution of the OSCAR product is lower, and only the largest geostrophic eddies are represented (see Ballarotta et al. (2019) for an in-depth description of the issue and Figure S18). In some cases, for relatively large islands, the two current datasets (SODA3 and OSCAR) are used, but in general this study mostly relies on SODA3 which is dynamically consistent and depends on less strict assumptions than OSCAR. A full comparison between the products goes beyond the scope of this paper.
The NPP fields are obtained from http://sites.science.oregonstate.edu/ocean.productivity, with a resolution of 0.0833°, and estimated according to the Vertically Generalized Production Model (VGPM) algorithm from (Behrenfeld and Falkowski, 1997). The VGPM is a “chlorophyll-based” model that retrieves net primary production from chlorophyll using a temperature-dependent description of chlorophyll-specific photosynthetic efficiency. In VGPM, the NPP is therefore a function of chlorophyll, available light, and photosynthetic efficiency. The product is based on MODIS (NASA Goddard Space Flight Center, Ocean Ecology Laboratory, Ocean Biology Processing Group, 2014) chlorophyll and temperature data. The available light is represented by the depth of the euphotic zone, which is estimated from a model developed by Morel and Berthon (1989). Over shallow bathymetry, NPP estimates can be contaminated by bottom reflectance, sediment run-off and resuspension (Boss and Zaneveld, 2003; Gove et al., 2016). The presence of correlations between cool anomalies and increased NPP at monthly time scale in regions over shallow bathymetry (i.e see Figure S19) suggests that the data might contained reliable signals. However, we adopted a conservative approach and removed from subsequent analysis NPP data in grid points over shallow bathymetry (isobaths less than 30m). This was not done in the Bermudas as no data would be retained inside the caldera, but, as discussed below, we caution about the weaker reliability of the data in that area. With regard to the reliability of NPP data, it is worth mentioning that the retrieval algorithm is based on satellite measurements of surface chlorophyll-a. However, the peak of chlorophyll-a concentration is not always located near the surface (subsurface maxima are not uncommon in the tropical oceans (Cullen, 1982)) and could remain undetected. Deep chlorophyll maxima (DCM) are usually associated with peak of phytoplankton and primary productivity as well (Moeller et al., 2019). Upward motions in the ocean can passively advect a DCM closer to the surface, resulting in an apparent bloom without any real PP enhancement (Hasegawa et al., 2009). Nevertheless, increased vertical velocities would also inject nutrients in the euphotic layer, leading to phytoplankton growth (Hasegawa et al., 2009).
Local variations in temperature near islands and archipelagos are identified using the time averaged Laplacian (the second horizontal derivative) of the SST:
Even though the Laplacian operator does not identify minima and maxima of temperature, its extremes enhance small scale structures: strong positive (negative) Laplacian values correspond to areas of large negative (positive) curvature in the temperature field, such as in regions surrounding a local cold (warm) anomaly with respect to the large scale field. In some cases, for example when the fields only vary at a specific spatial scale (see e.g. the sinusoidal function used in Figure 2C), local variations can be clearly identified without the use of the Laplacian, and extremes in the SST corresponds to extremes in the SST Laplacian. However, in the presence of an overlapping background signal at larger scales (e.g. Figure 2D), small scale variations that can be hard to notice in the SST field are more easily identified through the Laplacian operator. The metric highlights small-scale patterns, reducing the signature of large-scale variations. Figures 2A, B compares the 2013 annual SST and its mean Laplacian around Hawaii and is a clear example of how advantageous this technique can be. In the following, we apply the Laplacian operator to the SST field to highlight the small scale variations, potentially associated with the small scale dynamics surrounding an island, in a field that has a lot of large scale variations (such as, for instance, the latitudinal patterns). We do not apply the Laplacian operator to the NPP field, as the ecosystem dynamics generates spatial variations at scales that are small compared to those of the ocean dynamics investigated in this work: for NPP the Laplacian operator would actually mask the signal associated with the oceanic patterns (see the example given in Figure 2E, where the sinusoidal pattern represents the ocean processes affecting NPP and the small scale noise represents the fluctuation associated with ecosystem dynamics). For clarity purposes, in the figures in sections 3-4, the SST Laplacian are spatially smoothed using a (cubic) smoothing spline of fall-off value λ=0.2 , as shown in Figure S20.
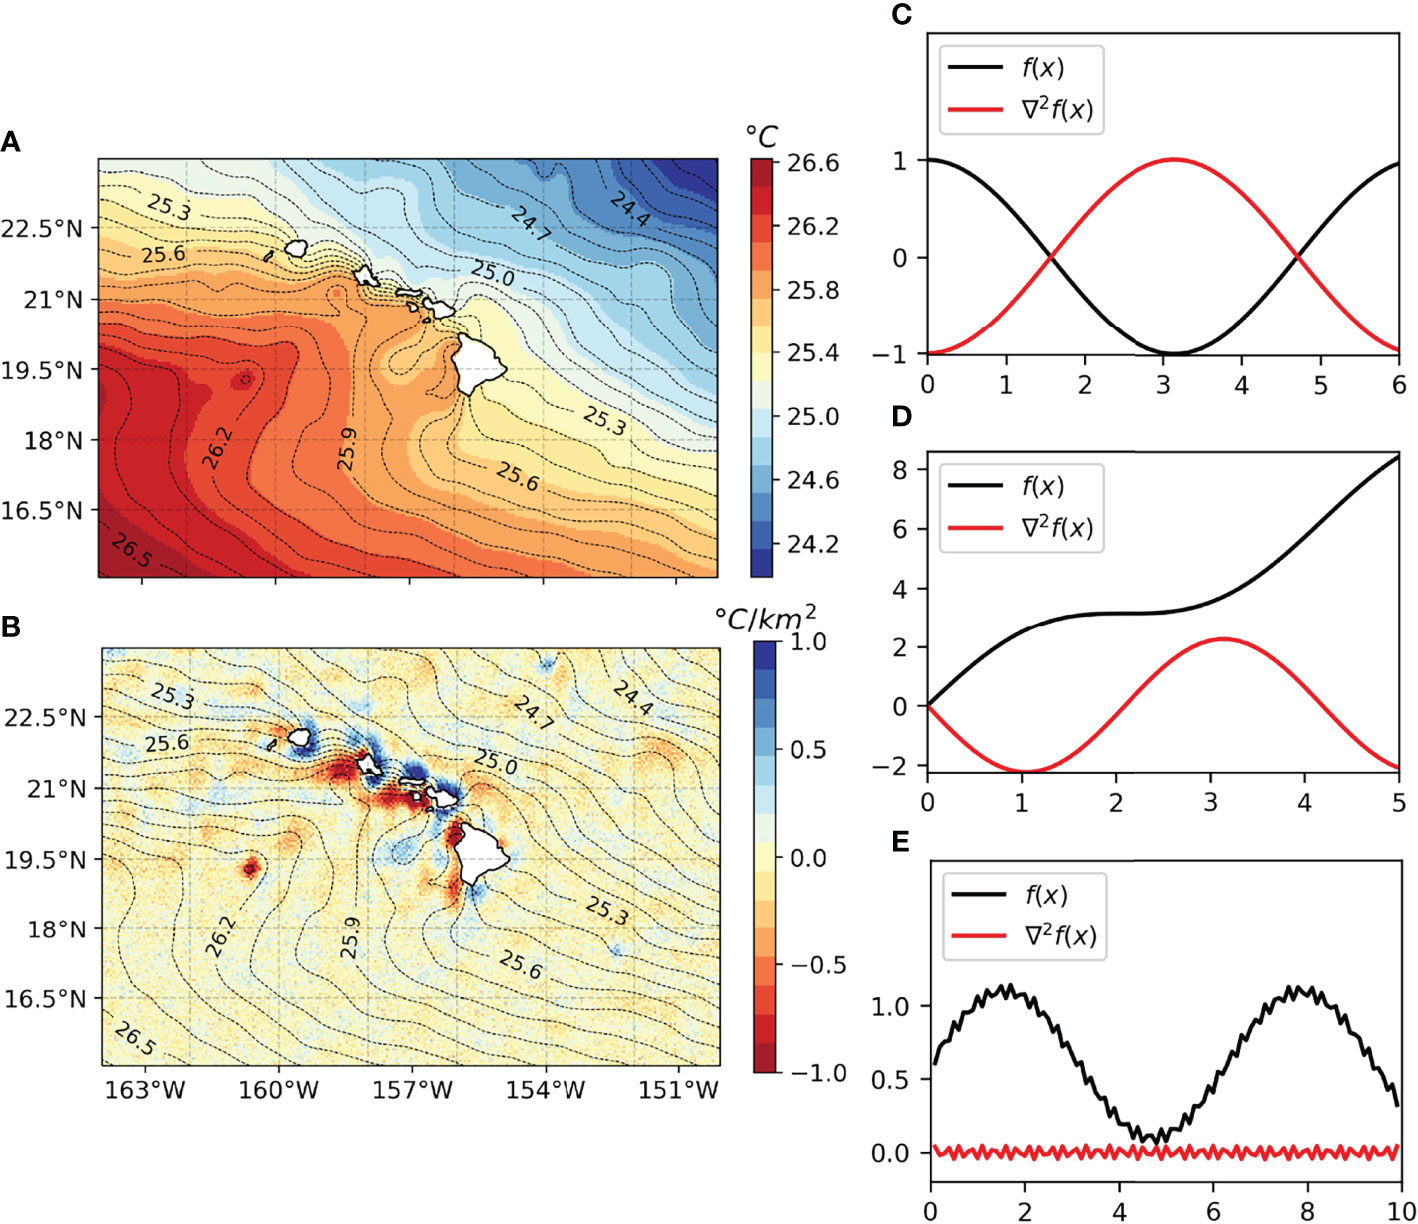
Figure 2 (A) 2013 annual mean SST; (B) corresponding SST Laplacian (shading) overlaid over the isothermal contours for region surrounding the Hawaii; (C–E) Example 1D functions and their Laplacians. (C)f(x)=cos(x) , (D)f(x)=sin(1.5x)+1.5x, (E)f(x)=0.5sin(x)+0.1cos(100x)+0.6 . It can be noticed that Laplacian extrema are associated with extrema in the high pass filtered original signal, and large scale variations are not detectable.
SSTs are influenced by several processes with a wide range of spatial and temporal scales. As described, SST Laplacian helps to identify local temperature patterns, albeit it does not provide information about the physical mechanisms generating them. Analyzed together with the NPP field, it is useful to identify localized areas of enhanced vertical mixing or upwelling: regions of both increased productivity and local colder temperatures can be linked - with reasonable certainty - to an intensified input of nutrient rich waters from below the mixed layer.
In the following, we identify as IME due to enhanced vertical exchanges the NPP increase and SST cooling around the islands that are simultaneous during the same month and pertain to the same area.
3 Physical Processes
The main physical processes responsible for the IME are grouped based on four main themes: current-island interactions, wind-island interactions, ocean-atmosphere coupled processes and interactions, and, finally, vertical ocean mixing.
3.1 Current-Island Interactions
The presence of an island perturbs the oceanic flow, and this perturbation can result in locally enhanced vertical transport (i.e., Bowman et al. (1996); Dietrich et al. (1996); Dong et al. (2007); Hasegawa et al. (2009); Teinturier et al. (2010); Chang et al. (2013); Stegner (2014)). The disturbance of the incoming currents due to the island has been often referred to as topographic forcing (Sangrà, 2015), and the resulting circulation relates to the classical problem of a cylindrical obstacle in a horizontal fluid (Batchelor, 2000; Cushman-Roisin and Beckers, 2011) where frictional effects inject vorticity into the system. In the simplest case of uniform density and a non-rotating frame the resulting flow is well characterized by the Reynolds number:
where Uo is the incoming current speed, D the diameter of the obstacle and AH, the horizontal eddy viscosity coefficient. Figure 3 schematically represents the characteristics of the ocean circulation perturbed by a cylindrical obstacle in function of the Reynolds number.
For values of Re up to few tens, which in the ocean are relevant for weak incoming currents and/or very small islands compared to the local Rossby deformation radius (the length scale for which buoyancy forces are as important as the Coriolis force, , with g being gravity, f Coriolis parameter and h the water depth) the oceanic flow away from the obstacle is laminar and lateral friction generates two stationary eddies with opposite sign just behind the obstacle (Figure 3A) (Heywood et al., 1990; Barton, 2001). This is valid for islands surrounded by deep waters and far away from coastal areas and estuaries, which are the main focus of this review. In shallow waters, the main source of vorticity is bottom drag and eddies are generated through different mechanisms (Tomczak, 1988; Dong et al., 2018).
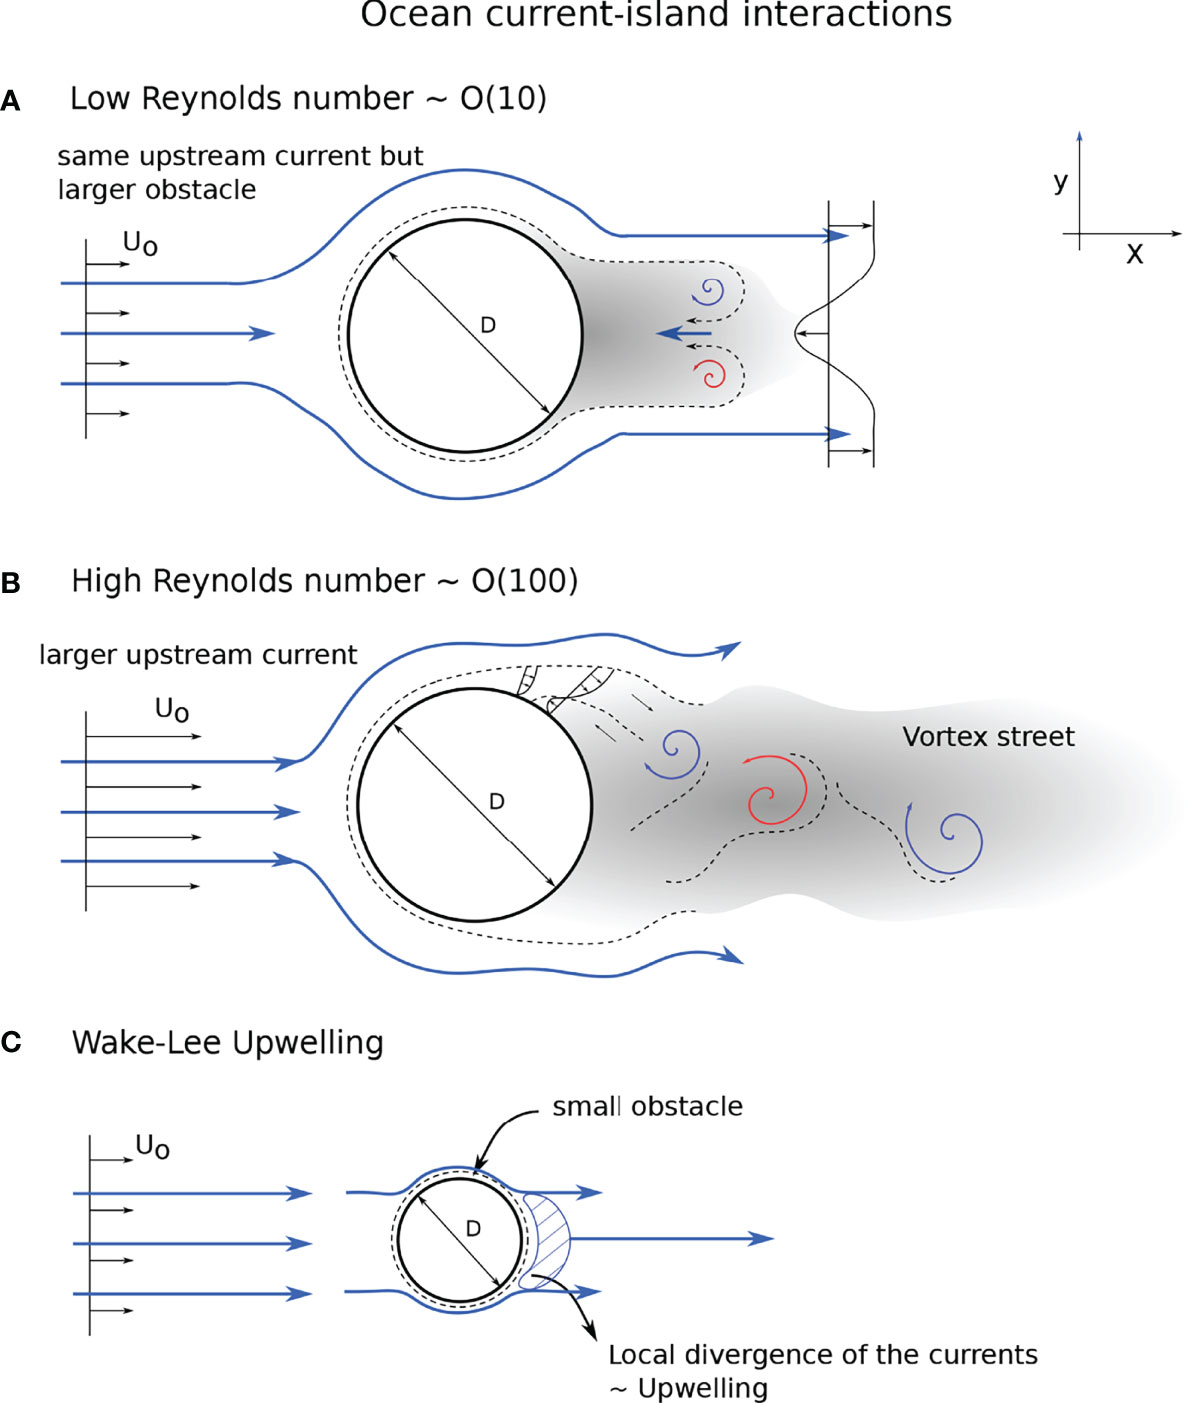
Figure 3 Sketch of the ocean circulation in the wake of a circular island for Reynolds number of (A)O(10) , (B)O(100) and (C) wake-lee upwelling. Positive and negative vorticity in the ocean upper layer are represented with red and blue spirals, respectively. They lead to subsequent vertical velocities in the ocean. The upstream currents are uniform and represented by arrows Uo on the left side of the obstacle of a diameter D . Blue arrows represent the streamlines of the flow.
For higher values of Reo - about 50-60 and greater (Dong et al., 2007; Chang et al., 2013; Sangrà, 2015) - the wake becomes unstable and eddies shed from the flanks of the island, generating a Kármán vortex streetdownstream (see Figure 3B). The size of the eddies is of the order of the size of the island (Dong et al., 2007). An example of these eddies can be observed shedding downstream of the northern and smaller islands of the Hawaii in March (Figure 8).
Baroclinic instabilities are favored when the diameter of the island is larger than the Rossby deformation radius (Dong et al., 2007). In this case, the size of the vortices is close to the value of the local Rd (Sangrà, 2015), or slightly higher in the case D>>Rd (Dong et al., 2007). For eddies of the order of or larger than the Rossby deformation radius the rotation of the Earth is important. Planetary rotation generates a Coriolis force orthogonal to the current direction that favors divergence in a cyclonic vortex and convergence in an anticyclonic one. The local divergence/convergence leads to upwelling/downwelling in their core, usually associated with cold/warm anomalies and nutrient enriched/deprived waters (Sangrà et al., 2007; Chang et al., 2017). For instance, a train of those eddies can be observed propagating downstream of the Canary Island in July (Figure 4).

Figure 4 Canary Islands (A) Topography, (B) NPP, (C) SST Laplacian, (D) Wind Speed, (E) OSCAR currents, July 2013. Black dashed line represents the 100 m depth isoline. Annotations: E indicates propagating eddies, U/D upwelling/downwelling due to static eddies.
The paradigm of mesoscale cyclonic eddies being traditionally associated with colder and nutrient enriched waters, and vice versa for anticyclonic eddies (McGillicuddy and Robinson, 1997; Sangrà et al., 2007), has been challenged in recent years. Cold-core anticyclonic eddies and warm-core cyclonic eddies have been observed in several instances (Martin and Richards, 2001; Li et al., 2014; Gaube et al., 2015; Schütte et al., 2016), pointing toward the importance of other mechanisms. In particular, the interaction between the surface stress and the vorticity gradient of the eddy currents might induce upwelling/downwelling in the centre of anticyclones/cyclones (Martin and Richards, 2001; McGillicuddy et al., 2007; Gaube et al., 2013; Gaube et al., 2015; McGillicuddy, 2016). Indeed, Ekman transport depends on wind stress, which is determined by the relative velocity between surface wind and surface ocean current. The latter varies significantly in the eddy, changing sign on the opposite sides (while air speed can be considered fairly homogeneous, e.g., see Figure 5 of Renault et al. (2016)). The resulting Ekman transport differs on the opposite sides of the eddy and can result in a reversal of the classic convergence/divergence pattern and expected downwelling/upwelling motion. Moreover, ageostrophic submesoscale processes can modify the vertical velocity at the eddy periphery and in its core with perturbations approaching ∼100 m/day to reverse the geostrophic prediction, generating strong local upwelling also in anticyclones (Mahadevan et al., 2008; Zhong et al., 2017; Liu et al., 2021). Finally, the downwelling in anticyclonic eddies inhibits the formation of a strongly stratified upper layer in summer, resulting, in turn, in a deeper mixed layer in fall and winter with respect to what happens in cyclones. This deep mixed layer in winter (which can be deeper than the nutricline) favors the injection of more nutrients into the euphotic layer and can result in enhanced blooms and relatively colder cores in anticyclones (Dufois et al., 2016).
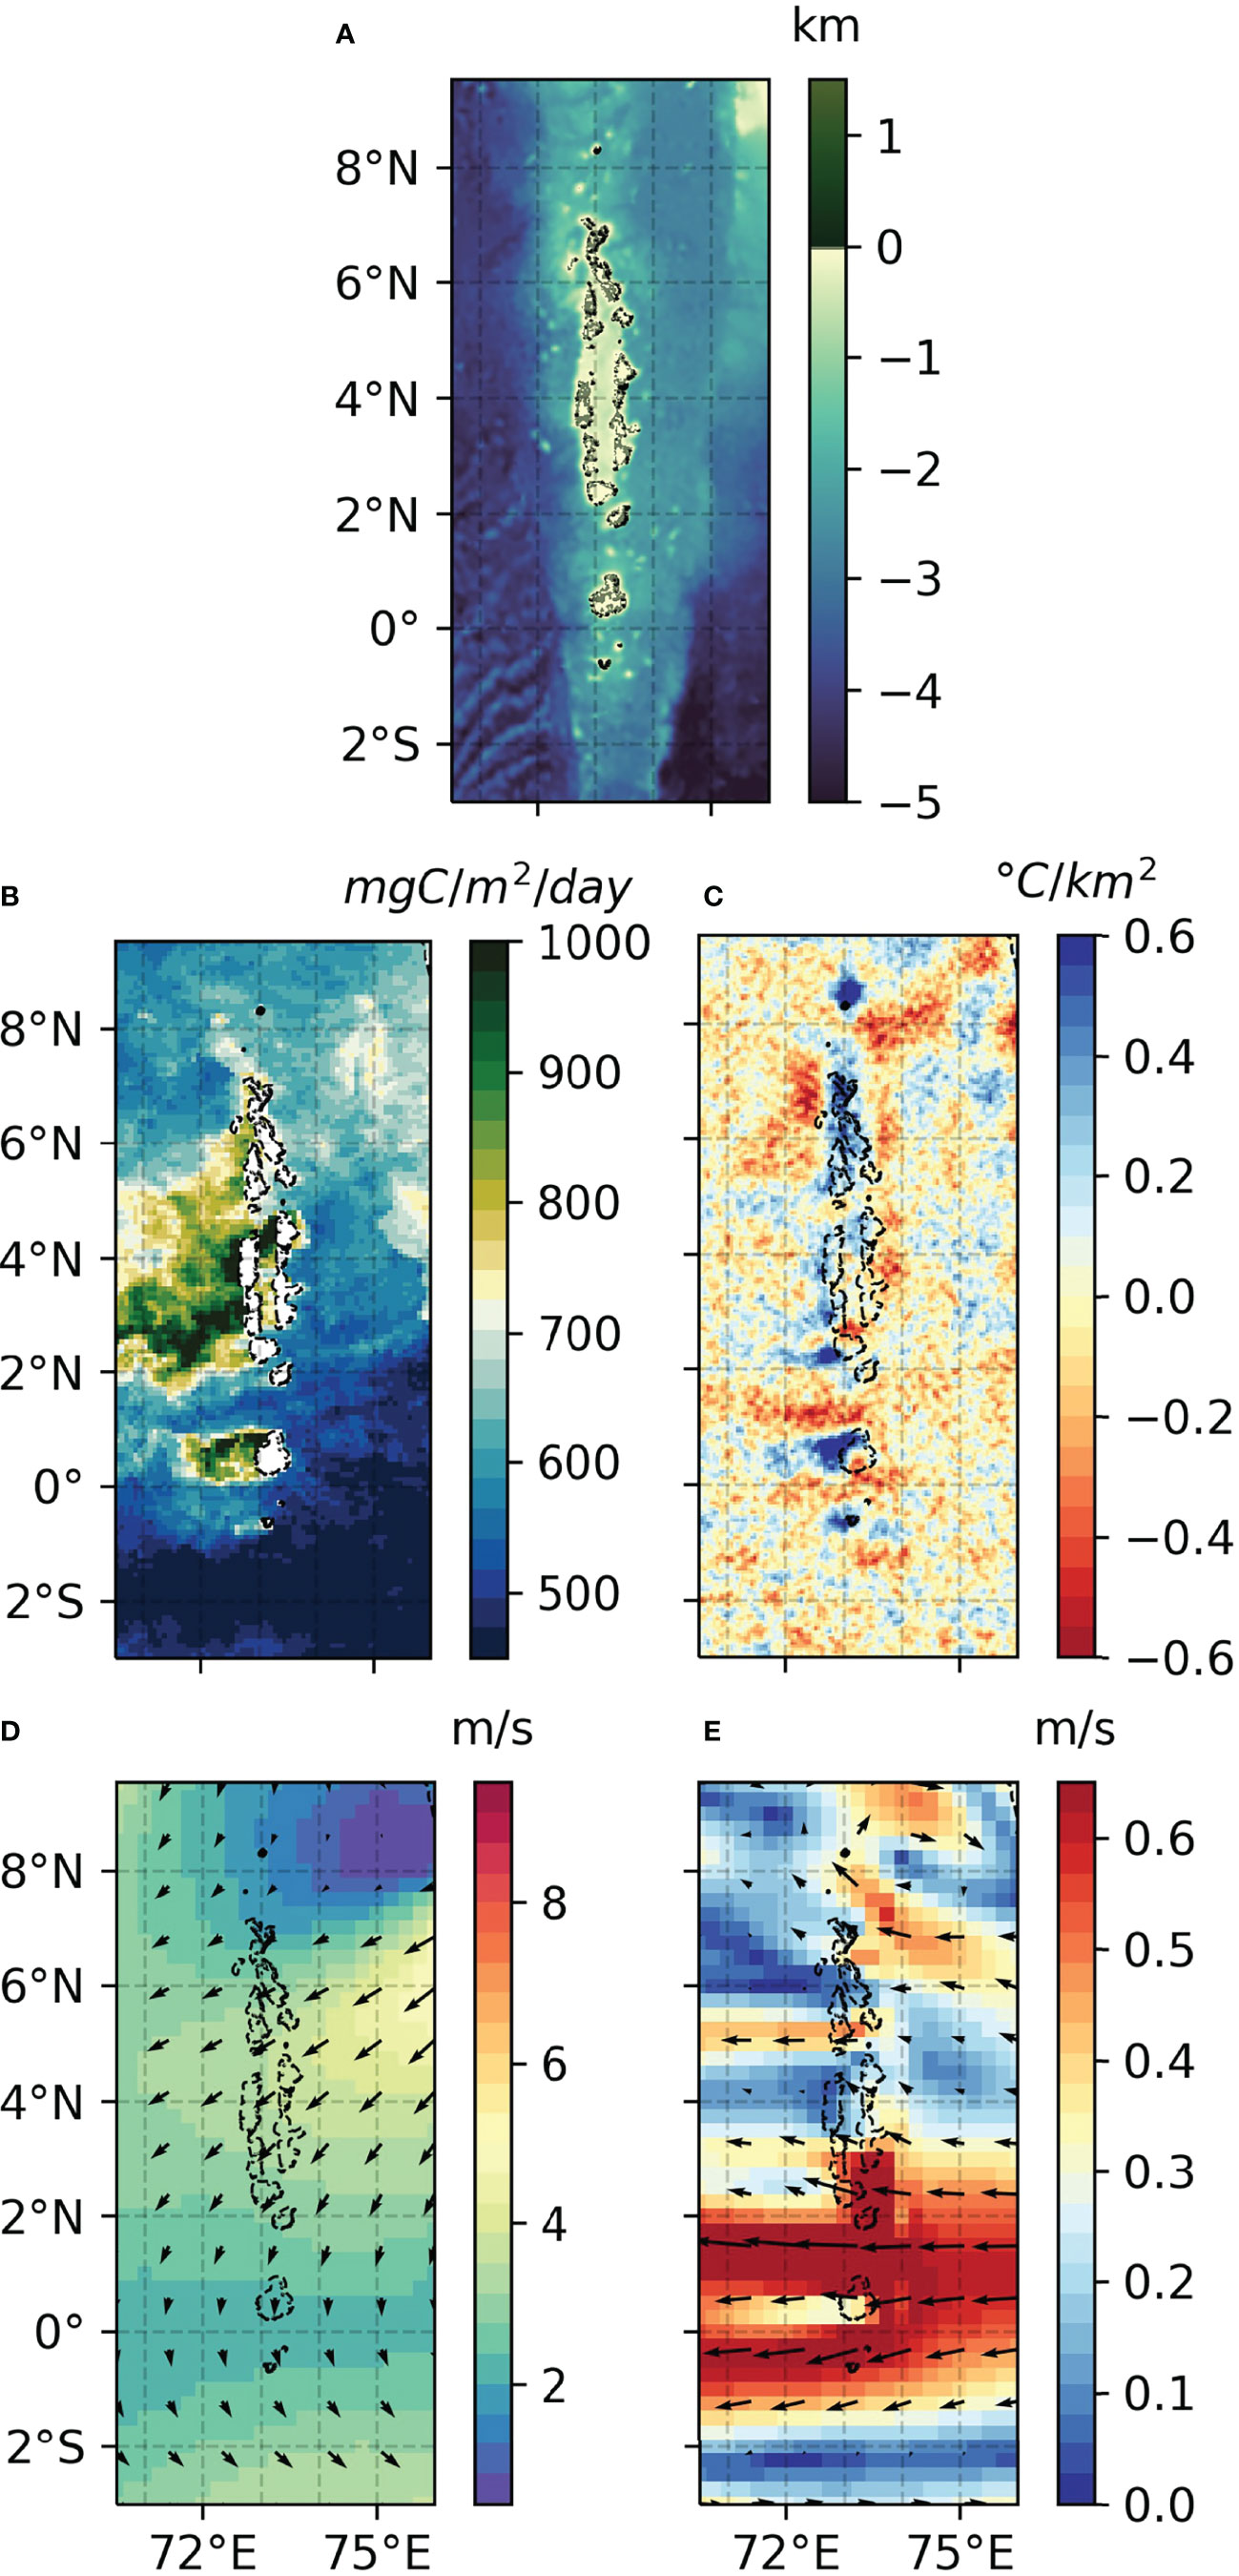
Figure 5 Maldives (A) Topography, (B) NPP, (C) SST Laplacian, (D) Wind Speed, (E) SODA3 currents, February 2013. Black dashed line represents the 100 m depth isoline.
As a result, anticyclonic eddies with increased chlorophyll-a both in the centre and/or in the periphery have been documented around the world (McGillicuddy and Robinson, 1997; Martin and Richards, 2001; Gaube et al., 2013; Chang et al., 2017), sometimes with alternating periods of upwelling and downwelling modes.
The island induced flow separation can also give rise to localized upwelling. There is a considerable difference in speed between the currents that accelerate around the flanks of the island and the lee, where the velocity is smaller, sometimes almost close to zero. The strong horizontal divergence is compensated by upward vertical velocities, given that the total velocity divergence has to be zero for an incompressible flow. The pair of horizontal surface jets behind the island entrains water from the lee side and causes surface divergence in the wake fed by a deeper returning current (Hasegawa et al., 2004). The vertical velocity (w) for a given ocean layer of uniform density, in our case the mixed-layer of depth ML, relates to the horizontal velocity (u, v) divergence field according to:
where z=0 represents the surface and z=-h is the base of the mixed layer. The upwelling velocity is, therefore, proportional to the current speed variation and inversely proportional to the distance over which the change occurs, which is associated to the diameter of the island. Sometimes, for small enough islands, the Reynolds number is small despite the considerable speed of the oceanic flow, while the horizontal shear is large. The interaction between the incoming currents and the island gives rise to wake-like signals (as shown in Figure 3C). This occurs around the majority of small, low-lying, islands where the monsoon regime is the main seasonal changing pattern, such as the Maldives and the Andaman and Nicobar Islands in the Indian Ocean and in parts of Micronesia. Here, during the monsoon months, strong winds force intense surface currents (i.e. Figures 5, S3B–E,S4F–I,S7B–E,6B–E). The wake-lee upwelling is secondary around wider islands, where the horizontal divergence is smaller and the Reynolds number is typically larger: in this case the turbulent fluctuations favor the generation of eddies, that become the dominant mechanism for vertical exchanges. For example, let us consider two islands of considerably different diameters, 1km (as some of the islands of the Atolls States) and 50km (as the size of Gran Canaria), and meridional currents (v) of 1m/s. Assuming AH=100m2/s (Sangrà, 2015), Reo would be 10 and 50, respectively, reaching turbulent scales only in the second case; the surface horizontal divergence (that we can approximate as Δv/Δy , where Δy is the radius of the island) would be 50 times smaller for the bigger islands, giving in that case only a small contribution to the vertical flow.
Finally, the interactions between currents and islands differ in substantial ways from those described above when the bathymetry cannot be approximated by a cylindrical obstacle. A strong and relatively deep current impinging on a gentle slope, for instance, can be lifted by it, forcing colder and nutrient-rich water into the euphotic layer, as in the case of the Equatorial Undercurrent hitting the Galapagos west coastline (Liu et al., 2014). This mechanism induces cooling upstream of the islands. The signal can propagate offshore if surface currents have a different direction than the subsurface flow, or, otherwise, can remain confined in close proximity of the islands (i.e Andaman and Nicobar Islands, Figure 6). Furthermore, a complex bathymetry can lead to currents impinging on the island with the same speed but from different angles, giving rise to different kind of wakes depending on the asymmetries in the shape of the topographic obstacle (Barton, 2001).
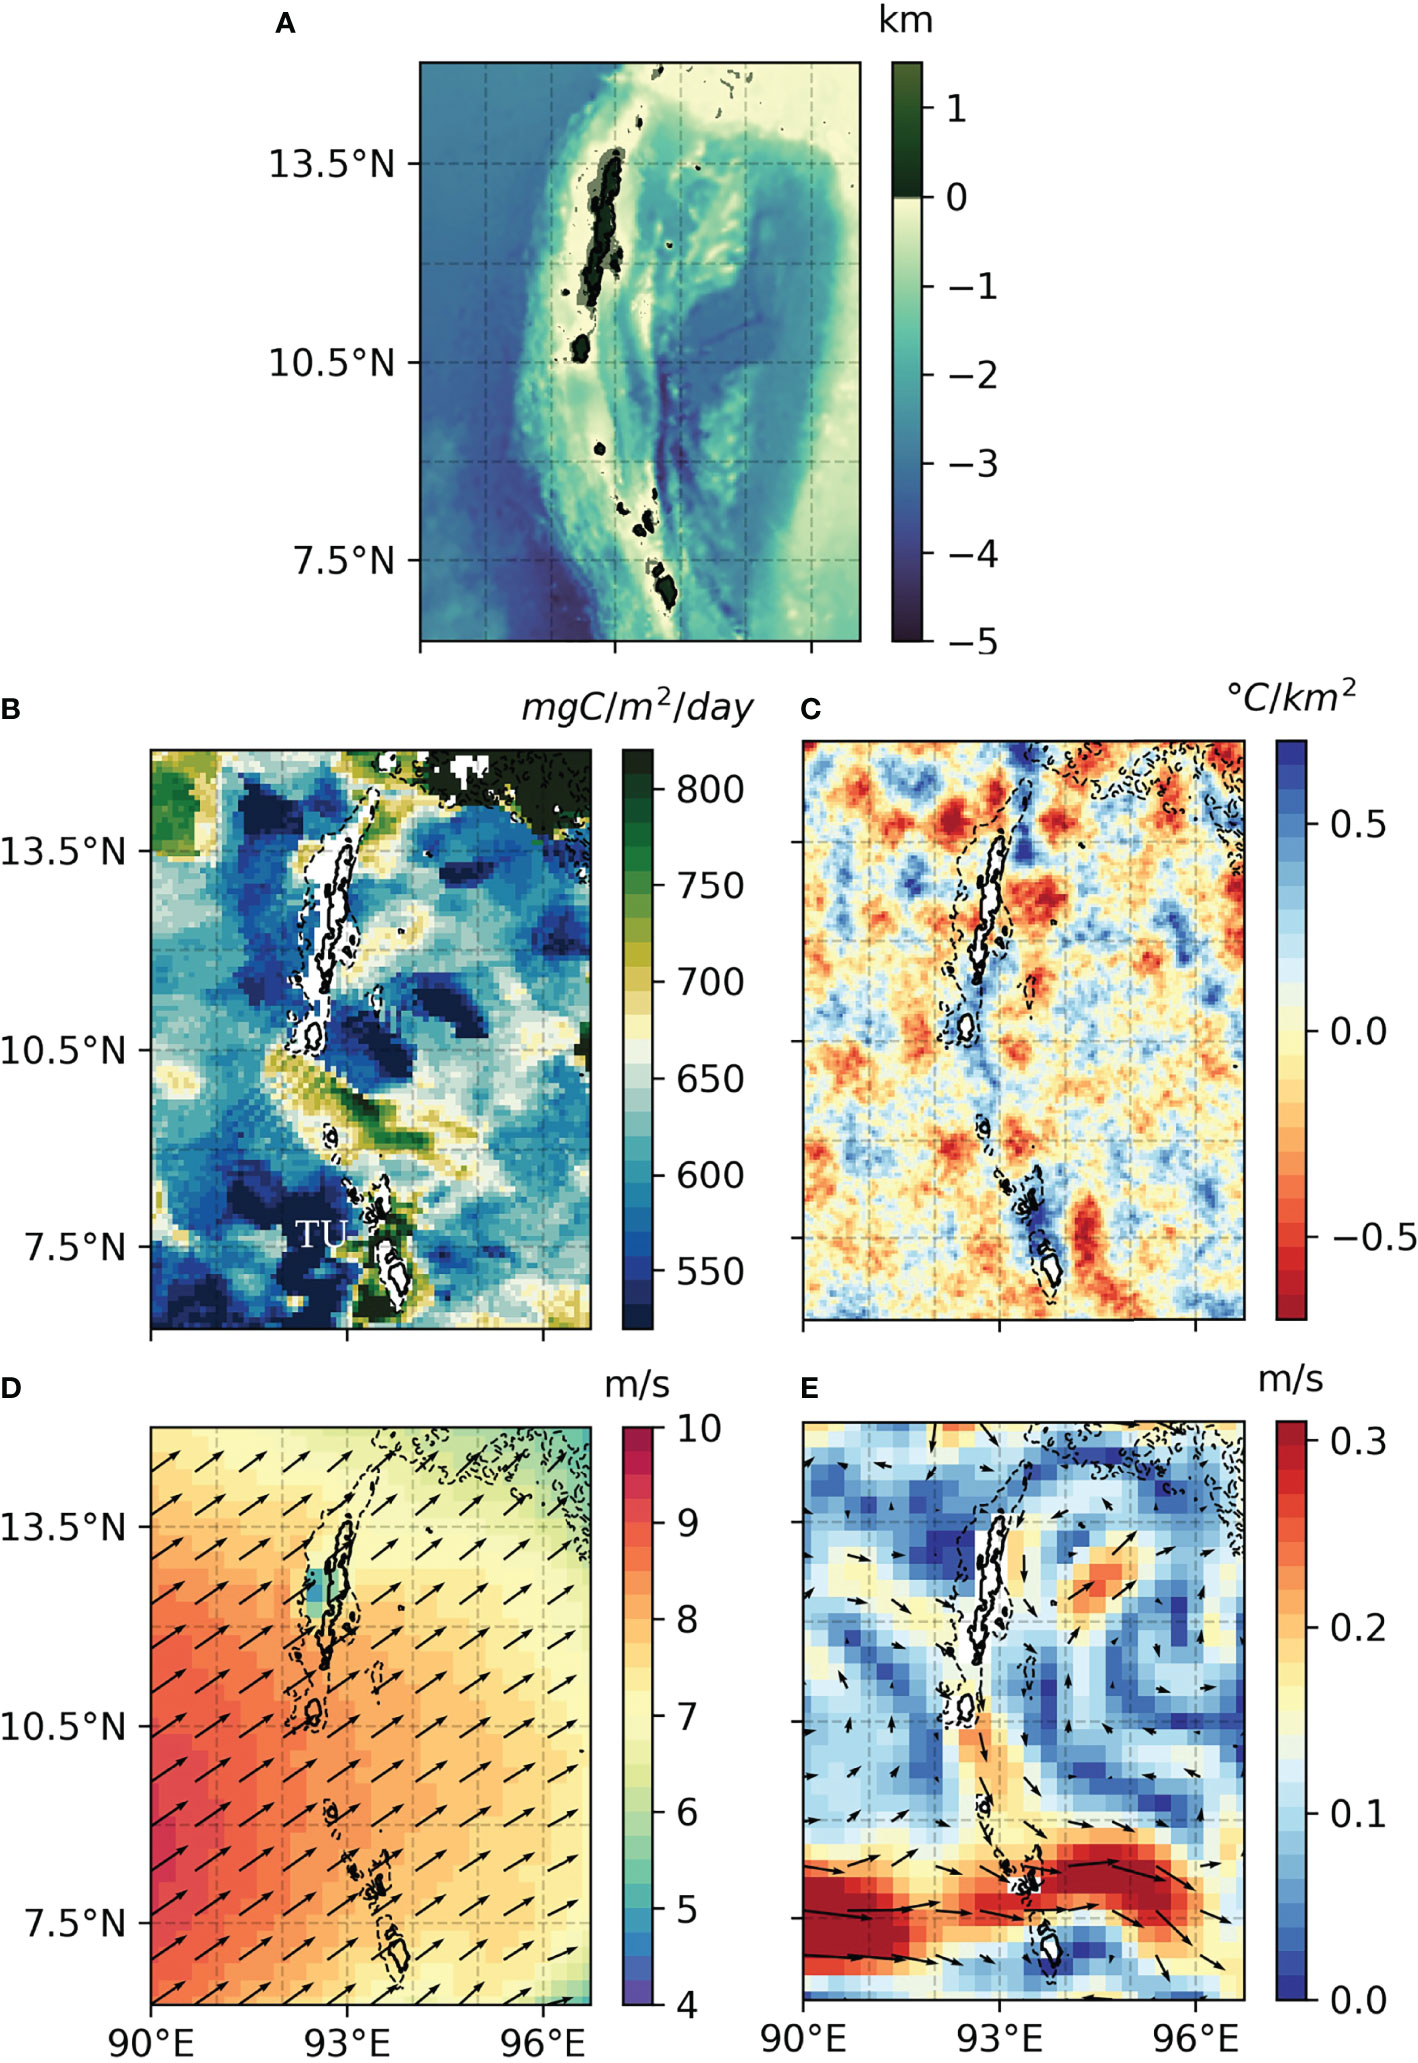
Figure 6 Andaman and Nicobar islands (A) Topography, (B) NPP, (C) SST Laplacian, (D) Wind Speed, (E) OSCAR currents, June 2013. Black dashed line represents the 100 m depth isoline. TU stand for Topographic Upwelling.
3.2 Wind-Island Interactions
The interactions between low-level winds and isolated islands with important orographic features have been investigated for their weather-related consequences given that the resulting terrain-induced circulations affect precipitation and clouds on the windward and lee sides of the mountains. Indeed, the physical barrier constrains the flow to circulate around or above the mountain, which induces instabilities and other related processes upstream and downstream (e.g., Yang and Chen (2008) for a discussion of these processes around the Hawaiian archipelago). There is here, noticeably, a nice correspondence with the ocean circulation around a cylinder described above. However, contrary to the ocean part, the atmosphere is almost always in a high Reynolds number regime, notably due to the upstream velocity of the fluid which is two orders of magnitude greater than the oceanic one (see equation 2; note that for water the eddy viscosity is smaller by one order of magnitude than for air, e.g. Vallis (2017)). Other parameters are needed to characterize the mountain-induced circulation, accounting for the height of the obstacle and the stability of the upstream flow. Indeed, idealized numerical studies show that the Froude number (Fr , or the dimensionless mountain height ) is the control parameter which qualifies the flow in the wake of a bell-shaped island (Smolarkiewicz and Rotunno, 1989; Schär and Durran, 1997):
where UMABL is the upstream wind averaged within the Marine Atmospheric Boundary Layer (MABL), where h is the height of the mountain, and N is the Brunt-Väisälä frequency - a measure of the stratification:
where g is the acceleration of gravity and ρ the potential density.
Figure 7 sketches the circulation and cloud patterns induced by the presence of a bell-shaped mountain for Fr∼0.5 (A), Fr∼1 (B) and higher Froude number (C), all for high Reynolds number. It has been shown that, for a stratified airflow, frictionless motion and no diabiatic heating, a low Froude number (∼0.5 ) leads to the creation of two large counter-rotating vortices on the lee sides of the mountain (Smolarkiewicz and Rotunno, 1989), even at high Reynolds number. These vortices are stationary, and the resulting circulation is similar to the ocean one at low Reynolds number in the wake of a cylindrical barrier (Figure 3A). These processes often give rise to surface temperature dipoles and cold/warm anomalieson the right/left side (when facing downstream) of several islands, mainly of volcanic origin and with a considerable altitude. This mountain-induced circulation has been verified by adding surface forcing (both thermal and friction) (Miglietta and Buzzi, 2004) and in realistic simulations such as the case of the circulation around Big Island in Hawaii (Yang and Chen, 2008). The latter is particularly interesting since the two volcanoes are higher than the inversion level, which in that case identifies the top of the atmospheric boundary layer (as sketched in Figure 7A) and the upstream flow is relatively weak (trade winds). This configuration (i.e., weak upstream winds and high mountain) favors the recirculation in the wake of the Island. Indeed, the flow is constrained to travel around the barrier and the disturbance is then trapped in the boundary layer (Barton et al., 2000; Hafner and Xie, 2003). For example, in March and August 2013 downwind of Hawaii Big Island, around 19.5°N and 158°W, the surface temperature decreases, NPP peaks and OSCAR currents patterns bear consistency with the surface signal of a mesoscale eddy (Figures 8, 9).
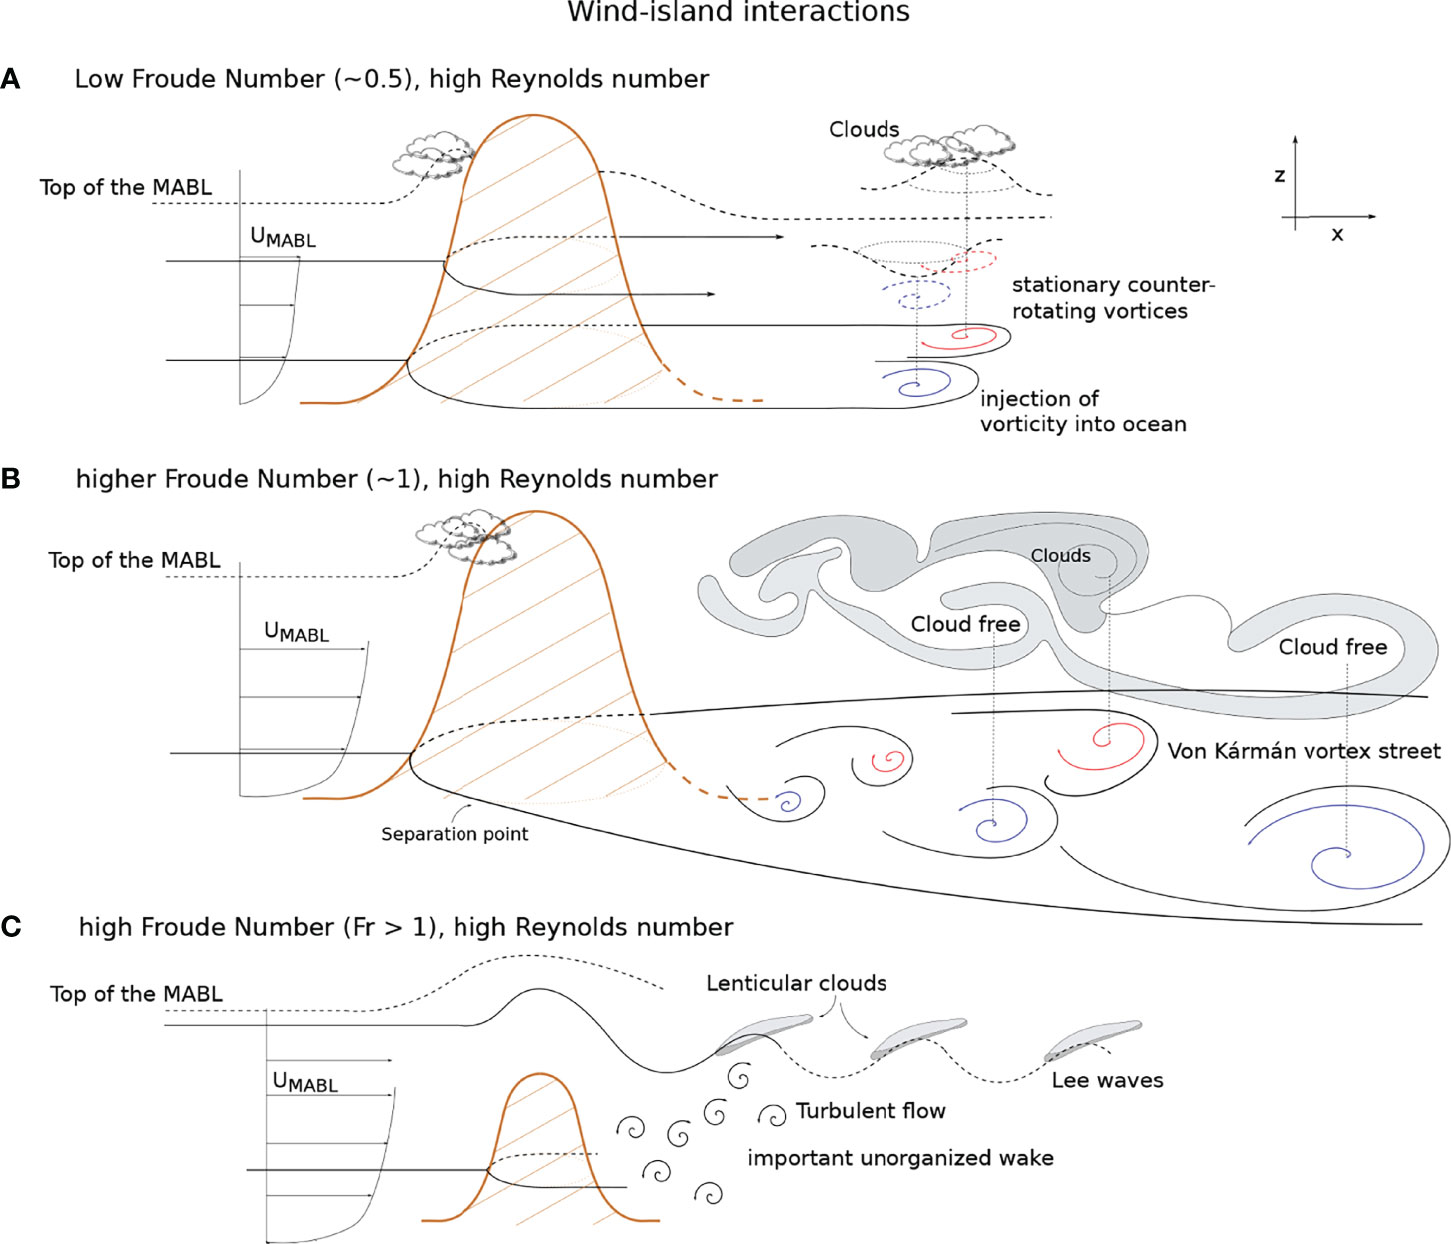
Figure 7 Sketch of the atmospheric circulation in the wake of a bell-shaped mountain for high Reynolds number and (A)Fr∼0.5, (B)Fr∼1 and (C) higher Froude number. Positive and negative vortices are represented with red and blue spirals,respectively. They lead to subsequent vertical velocities in the air column modifying the height of the bonduary layer (dashed line) and cloud organization. The upstream flow is represented by arrows UMABL on the left side of the mountain.
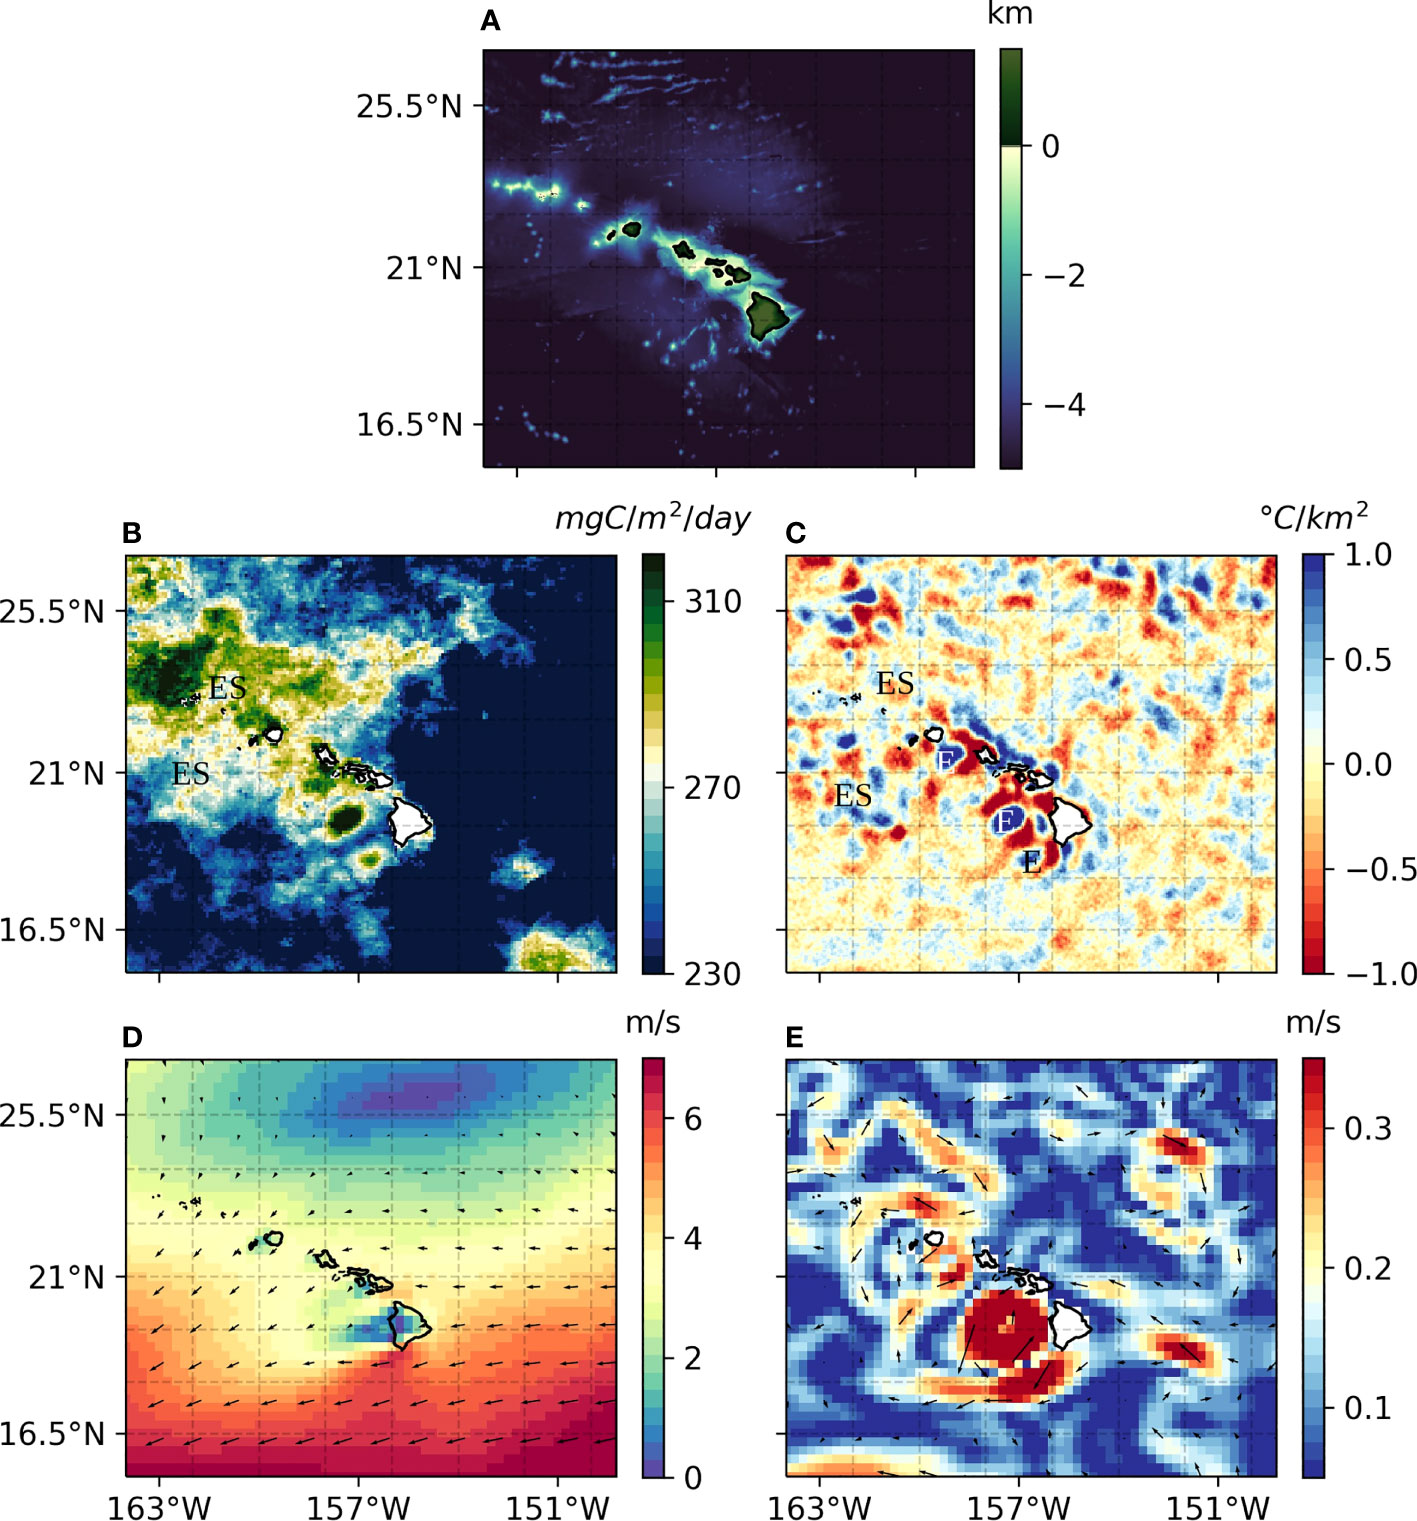
Figure 8 Hawaii (A) Topography, (B) NPP, (C) SST Laplacian, (D) Wind Speed, (E) OSCAR currents, March 2013. Black dashed line represents the 100 m depth isoline. Annotations: E indicates static eddies and ES eddies shedding.
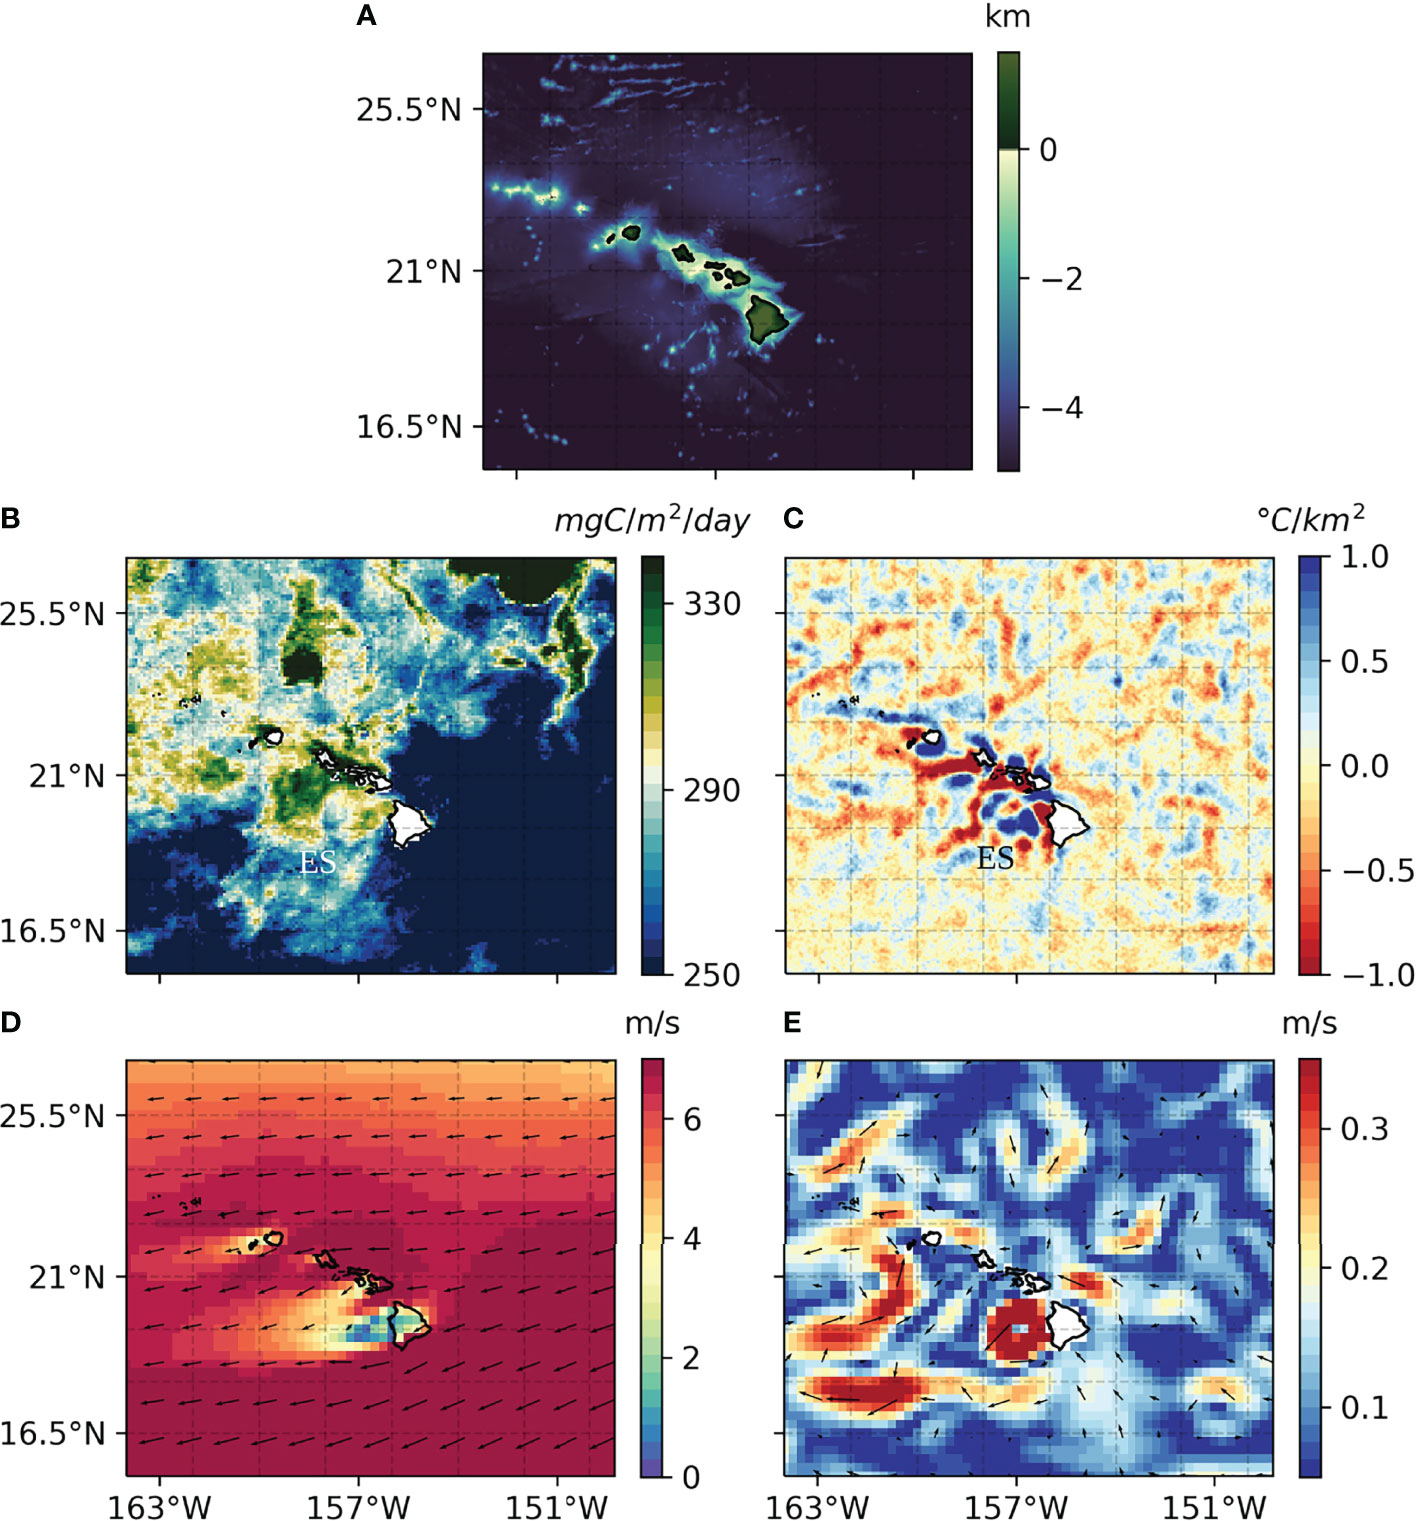
Figure 9 Hawaii (A) Topography, (B) NPP, (C) SST Laplacian, (D) Wind Speed, (E) OSCAR currents, August 2013. Black dashed line represents the 100 m depth isoline. Annotations: E indicates static eddies and ES eddies shedding.
For a slightly higher Froude number (Fr∼1 ), that can result from a more intense upstream wind, as indicated in Figure 7B, or from a shorter mountain (see equation 4), the wake is larger and more turbulent. The flow goes around the mountain and detaches from it; this creates large shear in the wind subject to Kelvin Helmoltz instability, and vortices of opposite sign over the two sectors of the mountain which propagate along the lee axis. A von Kármán vortex street is then formed, visible in the resulting stratocumulus cloud structure (Figure 7B). In August, when the winds are intense, a signal indicative of a vortex street can be observed in NPP and SST downstream of Hawaii Big Island. The pattern of the vortex street depends on the prevailing wind intensity (noted UMABL in Figure 7), which can change seasonally, adjusting direction and structure of the vortices. This process echoes the ocean circulation around a cylinder for high Reynolds number described above (Figure 3B).
For the last two cases, the island lee side atmospheric circulation is characterized by large atmospheric vortices (two non-oscillating or multiple propating vortices for the Fr∼0.5 - Figure 7A - and Fr∼1 - Figure 7B - cases, respectively) and leads to a specific forcing to the ocean with, firstly, the injection of vorticity in the upper ocean, and, secondly, a short wave radiative forcing due to the corresponding cloud patterns. Finally, for higher Froude number (Fr>1 ), the wake is relatively large compared to the island size and is characterized by a very turbulent flow (Figure 7C). This last case is often leading to the creation of a lee wave in the MABL with multiple both signs vortices of relatively small size which enhance air-column vertical mixing. The resulting momentum and heat forcing in the ocean is then highly variable and unpredictable. For an average wind speed of 4 m/s and assuming N equal to 2·10−3 (Stull, 1988; Wulfmeyer and Janjić, 2005), an island with an elevation of about 2000 m is required for the Froude number to be Fr<1 , and of about 4000 m for Fr<0.5 .
Furthermore, locally, coupled atmosphere-ocean interactions link the depth of the ocean surface mixed layer (ML) and the wind speed. In the lee of the islands, the winds are weaker, and the ML is shallower than along the windward side, so that during the day the heat fluxes are distributed over a thinner surface layer resulting in intense surface warming (Barton, 2001) that further inhibits vertical exchanges. Triangular patches (the shaded area is wider closer to the islands and progressively decrease moving offshore) of warmer water appear in the lee of Hawaii (Figures 9B–E), the Canaries (Figures 4B–E), Vanuatu (Figure S8) and Cabo Verde (Figures S10,S11) and the Marquesas Archipelago (Raapoto et al., 2018). A shallower, strongly stratified mixed layer is usually linked to a decrease in NPP because the surface is isolated from the deep nutrient enriched waters.
3.3 Oceanic and Atmospheric Processes Interactions
Up to this point, we separetely described the interactions between currents and bathymetric features, and how they impact vertical transport, and between winds and topographic features, and how they modify the circulation and the thermodynamic properties of the upper ocean. However, they are highly coupled in most cases, including the previously described Canary islands and Hawaii. As a result, the vorticity injected into the ocean by the atmospheric circulation favors the formation of an oceanic vortex street even for moderate incoming currents and a modest oceanic Reynolds number (Reo >20 , Jiménez et al. (2008)). Pullen et al. (2008), for example, found that near the Philippines strong bursts of monsoon winds can not only generate eddies but also lead to their propagation, even in the absence of a background oceanic flow. The propagation of wind-shear generated eddies at the ocean surface despite weak background currents has been observed around Hawaii as well (i.e., Jia et al. (2011)).
These coupled atmospheric-oceanic processes give rise to surface warm/cold anomalies. Wind vorticity, as explained in the previous section, forces local upwelling/downwelling. These vertical motions perturb the pycnocline position by decreasing/increasing its depth by tens of meter per day and can significantly contribute to the formation of oceanic eddies (Barton, 2001). The signal is particularly evident around the Canaries, Hawaii, and Cabo Verde [(see i.e. Figures 4B–E, 8B–E, S10 and Jiménez et al. (2008)], where the anomalies are correlated with the direction of the incoming winds and currents. Indeed, around these archipelagos the magnitude of the Laplacian of the monthly SST is strongly correlated with the intensity and direction of the trade winds, in a way that depends on the incident angle. The current-bathymetry interactions at small and low Reynolds number (Figures 3A, B) on one hand, and wind-island interactions at different Froude numbers (Figure 7) on the other, act simultaneously and alter each other through thermodynamical adjustment between the two fluids, strengthening or weakening ocean mixing, vertical velocities in the upper ocean and associated primary productivity.
Currents and winds can be oriented along different directions. When this happens, one or the other process might prevail in determining the final ocean surface signal. For example, in the case of Hawaii Big Island, in August the interaction between winds and volcanoes dominates (Figures 9B–E), resulting in a cold anomaly and increased NPP in agreement with wind forced patterns instead of ocean eddies shedding. An example of the oceanic circulation prevailing can be seen around Cabo Verde in November (Figures S11A–D).
3.4 Vertical Mixing in the Upper Ocean
Among the processes intrinsic to the ocean that enhance vertical mixing, internal waves are fundamental to entrain cold and nutrient rich waters in the upper ocean, and to offset bleaching events (Storlazzi et al., 2020; Wyatt et al., 2020). Internal waves propagate at the interface between layers of different density, at the base of the mixed layer, or of the main pycnocline, traveling long distances (Klemas, 2012). In the interior of the ocean, in the absence of, or for weak, atmospheric forcing, i.e. weak wind and heat fluxes, the breaking of internal gravity waves is one of the main sources of vertical mixing (Alford et al., 2011). Three main mechanisms can perturb the interface and generate internal waves: fluctuating wind stress over the ocean surface, tidal forcing over rough topography, or quasi-steady currents over rough topography (MacKinnon, 2013). This last two mechanisms can be referred to as internal tides and lee waves, respectively (MacKinnon, 2013; Nikurashin and Ferrari, 2013). Their ability to propagate inshore is related to the topographic slope (Merrifield and Holloway, 2002): a gradual slope favors internal wave propagation toward shallower waters, whereas a steep topography reflects them offshore (Gove et al., 2016). Moving to shallow waters, internal waves become steeper and eventually break, generating vertical mixing. A simple sketch is given in Figure 10A. Interestingly, a gradually sloping bathymetry is generally correlated to a stronger IME (Gove et al., 2016).
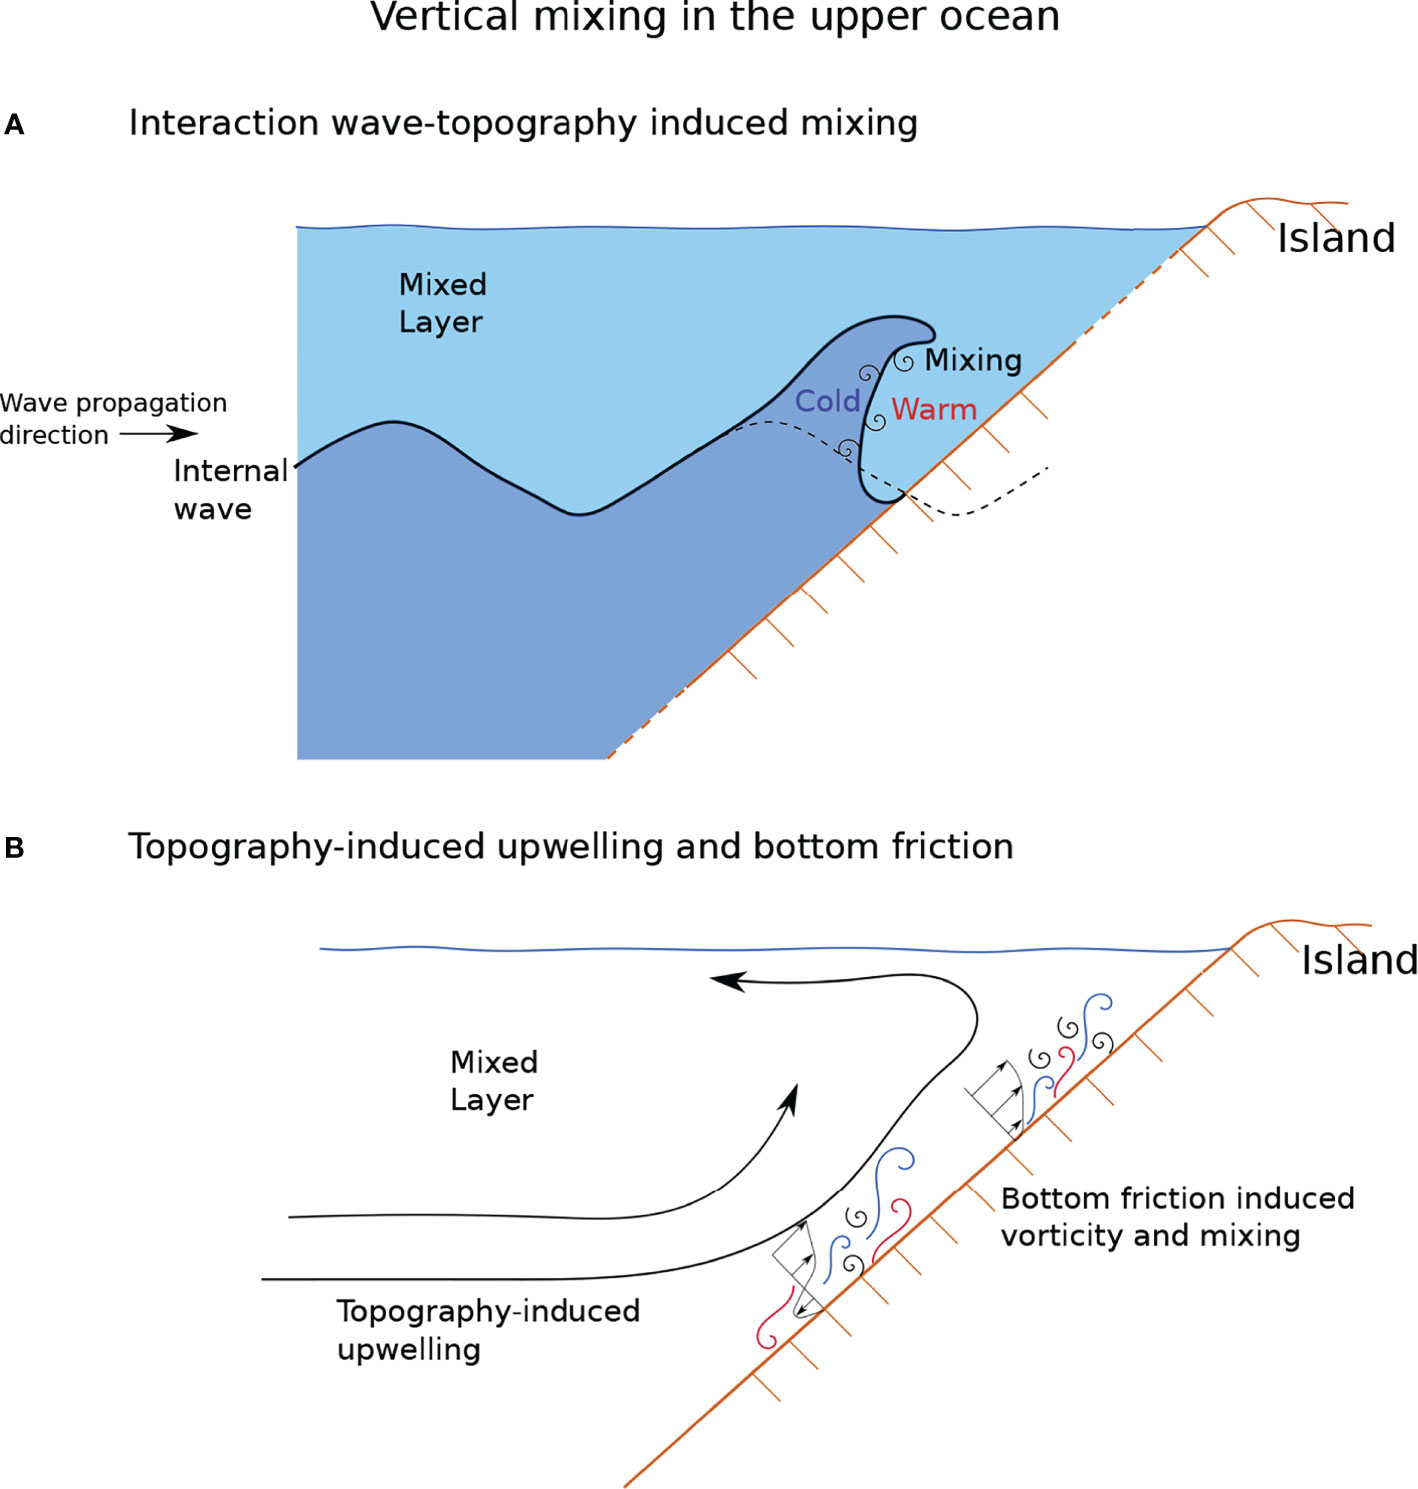
Figure 10 Sketch representing the interactions between ocean dynamics and continental slope which generate ocean mixing: (A) an internal wave propagating towards the continental slope becomes steeper and eventually breaks, generating vertical mixing; (B) simple sketch of a topography-induced upwelling and bottom friction-induced mixing and vorticity.
Vertical mixing can also occur in the case of bottom friction on a relatively shallow bathymetry. In this case, the friction strongly reduces (surface intensified) horizontal currents, leading to strong vertical shear. When the destabilizing influence of the vertical shear overcomes the stabilizing effect of the stratification, vertical mixing arises (Stevens and Crum, 2003). The ratio between these two quantities is described by the Richardson number (Vallis, 2017):
where N as above, is the Brunt–Väisälä frequency, and du/dz is the current vertical shear. Strong shear can lead to unstable flows and enhance vertical mixing, thus causing entrainment of deep cold water in the mixed layer (De Falco et al., 2020).
Vertical mixing enhancement, due to internal waves or interaction with the bathymetry, gives rise to an almost symmetric imprint, at times just slightly stronger on the side of the incoming currents. This effect is observed around nearly every island, and it is generally present year-round. It is confined to a thin region around the islands and can be masked by some of the previously described mechanisms. This is clearly visible and dominant, for example, around the Maldives, where a symmetric cold anomaly can be observed in spring (Figure 11), when winds and currents are weak and the mixed layer shallower than in other seasons (Figure 5). Several low-altitude islands display similar patterns, including Chagos (Figures S3F–I), the Andaman and Nicobar Islands (Figures S2A–D), the Seychelles (Figure S4B–E).
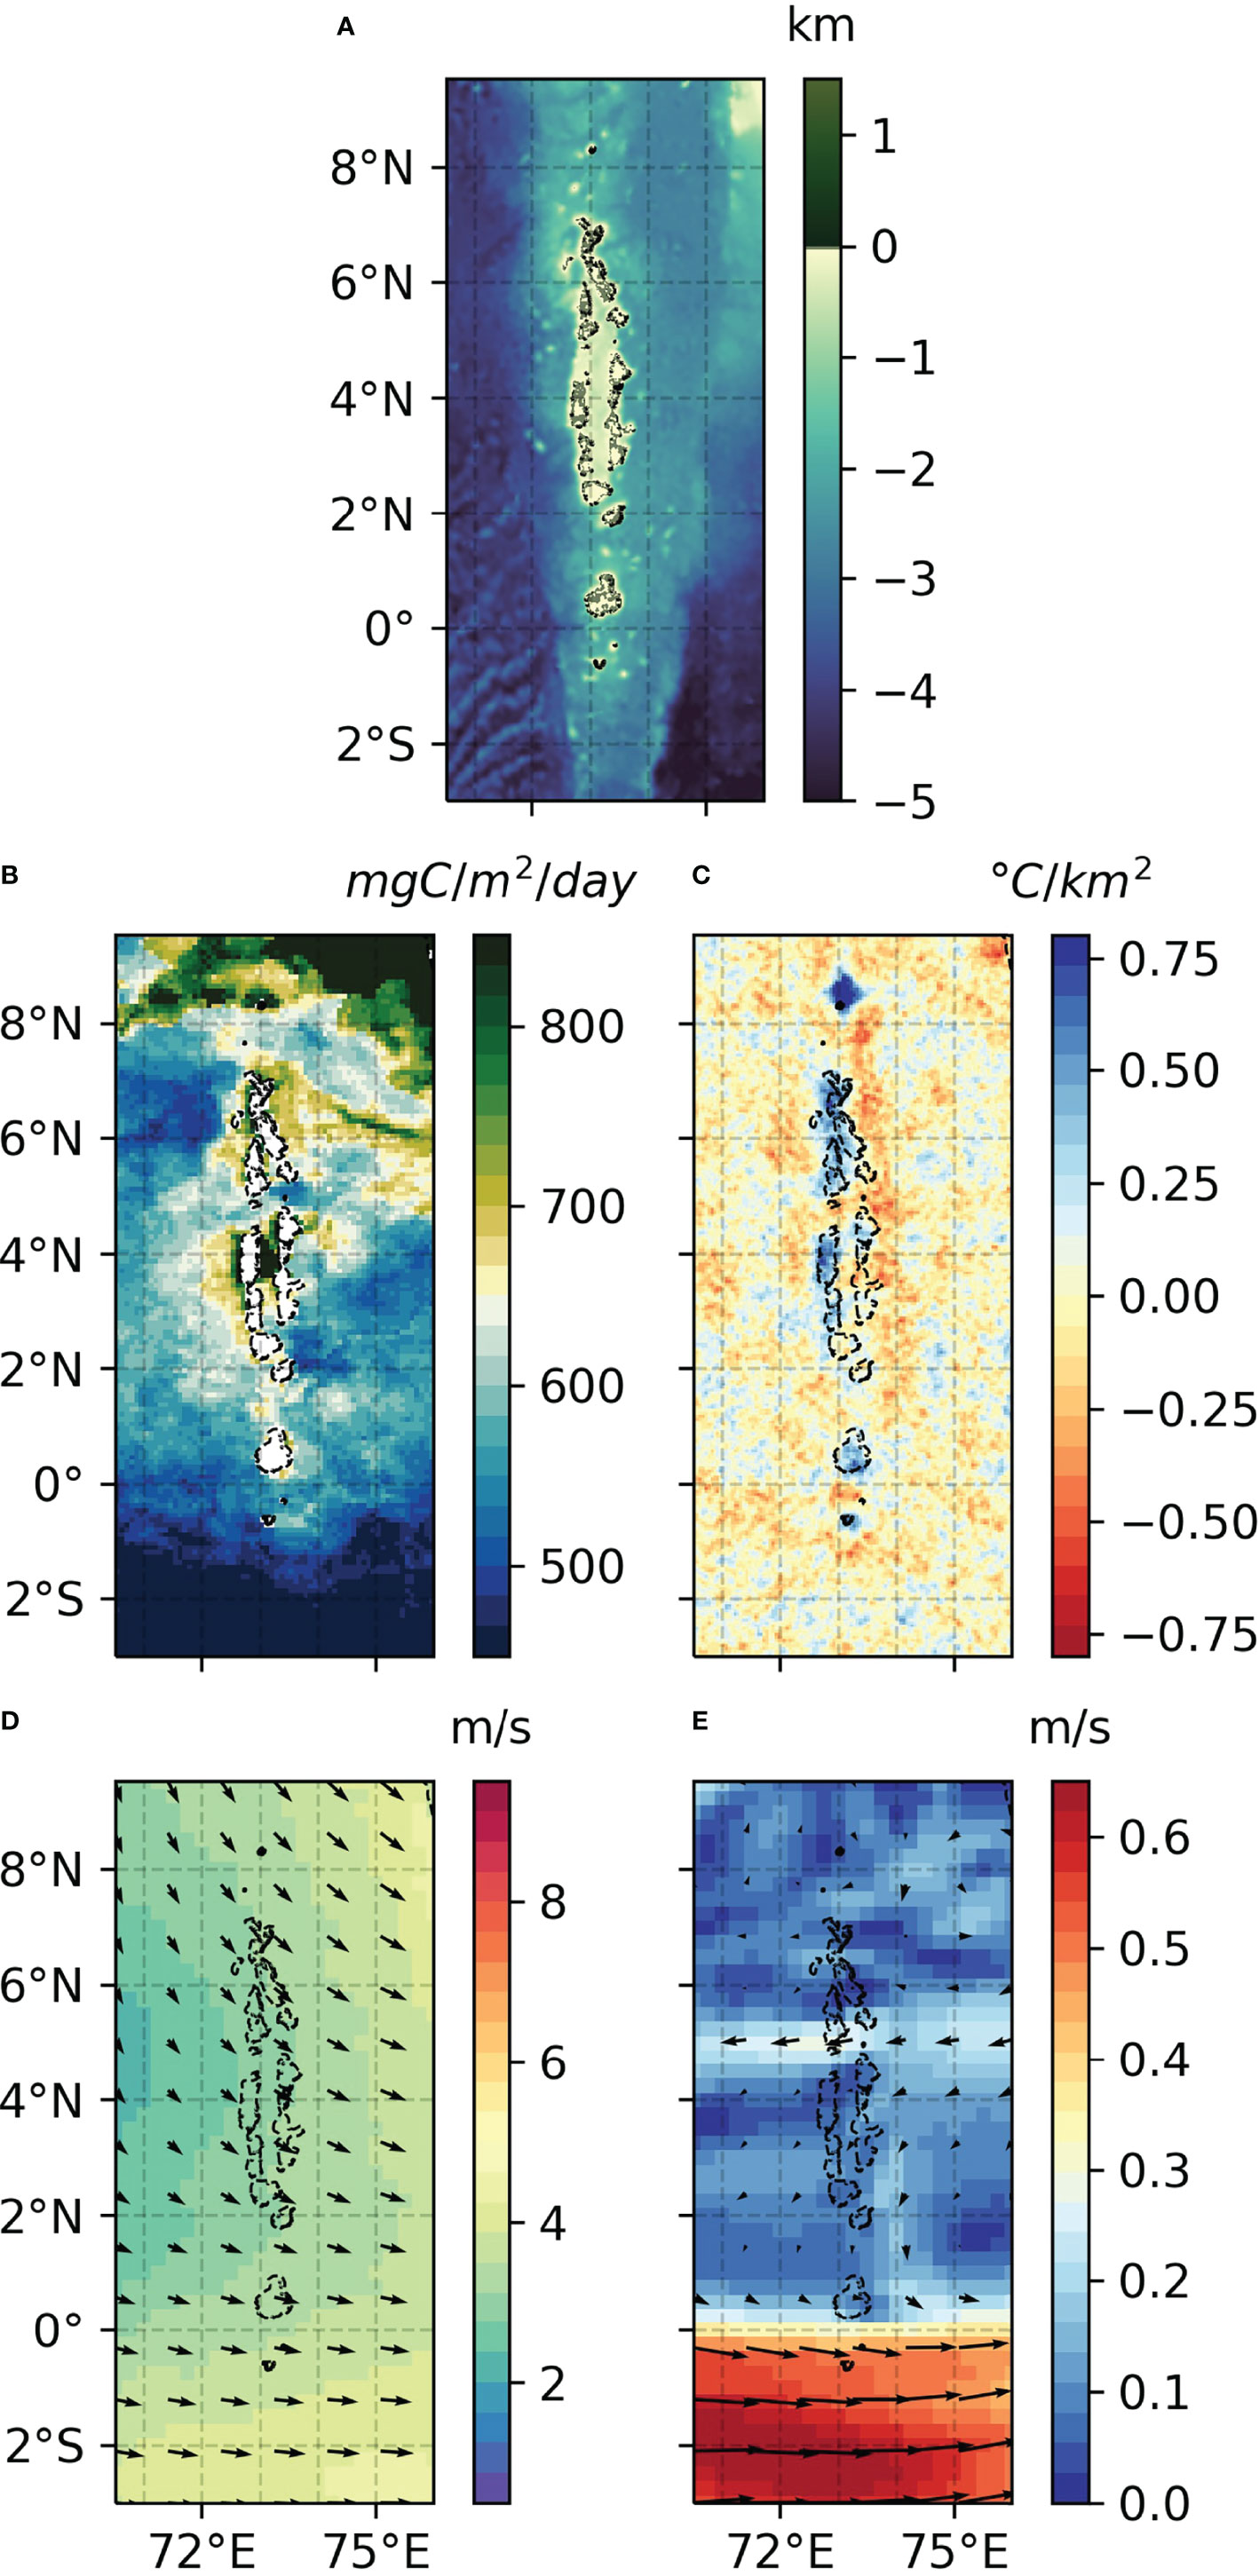
Figure 11 Maldives (A) Topography, (B) NPP, (C) SST Laplacian, (D) Wind Speed, (E) SODA3 currents, April 2013. Black dashed line represents the 100 m depth isoline.
When accounting for the seasonality, the imprint of wake upwelling and vertical mixing on the SST and NPP fields is recovered around almost all analysed archipelagos, including the Hawaii (Figures 8B–E), Cabo Verde (Figures S10B–E) and Vanuatu (Figures S8F–I). Associated vertical mixing intensity and impact on vertical transport is weaker compared to the other processes described in this work, and its signal often obfuscated. It emerges when both currents and winds subside. On the other hand, it is a nearly ubiquitous feature that provides a key contribution to enhance vertical exchanges all year-round.
4 Discussion
In this paper, we described the different physical processes resulting in the so-called Island Mass Effect (IME). The multiplicity of those processes and the convolution of their interactions highlight the complexity of the physical forcing on the NPP patterns and the uniqueness of each island. Here we attempted to provide a reliable catalog of physical processes responsible for the IME around islands worldwide. Processes have been determined with the joint analysis of satellite-derived SST and NPP and atmospheric and oceanic reanalyses.
Two different SST patterns can be distinguished, depending on the altitude, the extension and the structure of the islands. Around islands with considerable altitude, both warm and cold temperature anomalies arise, while around smaller islands without major topographic peaks only local anomalies of one sign (warm or cold) are generally found. The results of this analysis are summarised in Table 1.
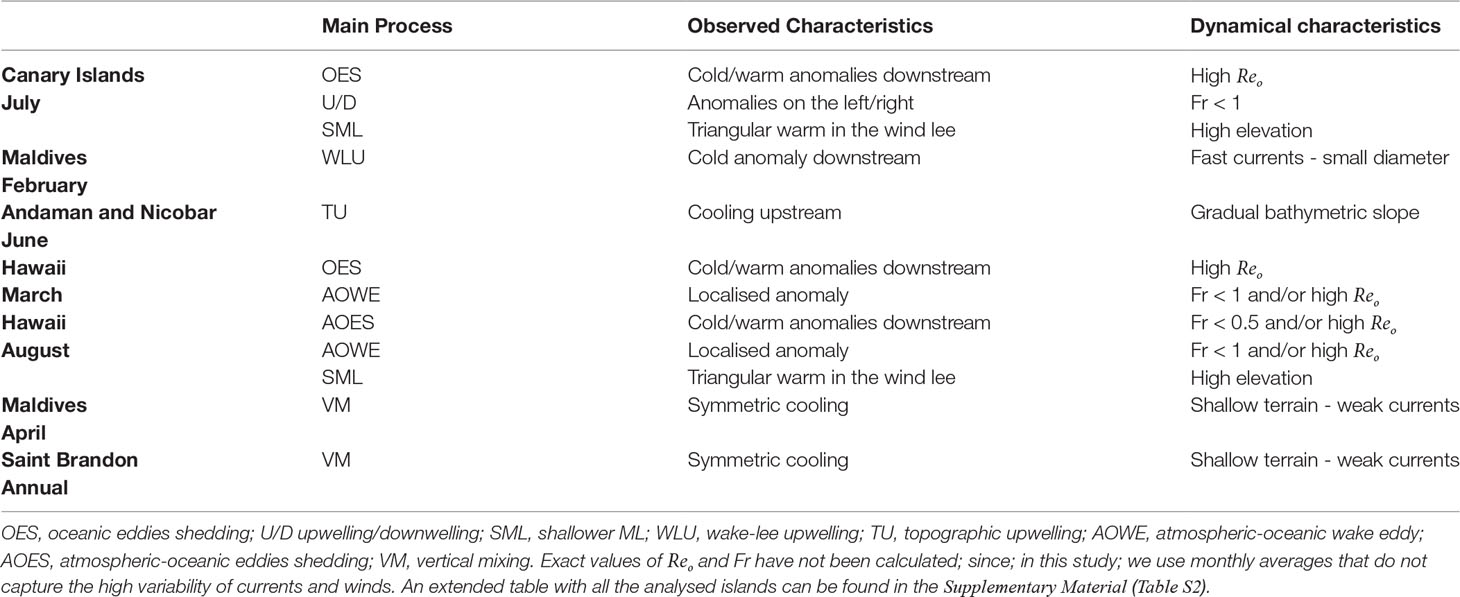
Table 1 List of the islands considered in the analysis, prevailing processes and surface imprint characteristics.
The first signal can be mainly ascribed to oceanic and atmospheric forced eddies and wind-curl forced upwelling/downwelling. Variations in the depth of the wind-forced mixed layer and heat fluxes into the ocean also play a role. Usually, when the SST and NPP display a strong asymmetry, temperature cooling and increased productivity are associated with increased eddy production and upwelling in the lee of a wake, due to the interaction between surface topography and the oceanic circulation. The last two mechanisms tend to give rise to symmetric patterns for the most common geomorphological profiles of the islands. Peaks in productivity can be observed also upstream of the islands, due to currents impinging on a slope, increased shear or internal waves. More than one process might coexist, the prevailing one varying along the year and depending on the strength and direction of the incoming atmospheric and oceanic flow.
The imprint of those fluid-island interactions are visible around most of the islands across the oceans. It is interesting to note that the ocean dynamics affects not only islands but also shallow/small seamounts and sand banks. Their SST and NPP signatures can be seen, for example, in the Micronesia Archipelago (Figure S6) and Saint Brandon islands (Mauritius). The latter rises from a limestone plateau (∼ 20m) and while it is too small to be resolved, the nutrient-enriched cold waters are clearly shaped by the underlying topography (see Figures 12A–E).
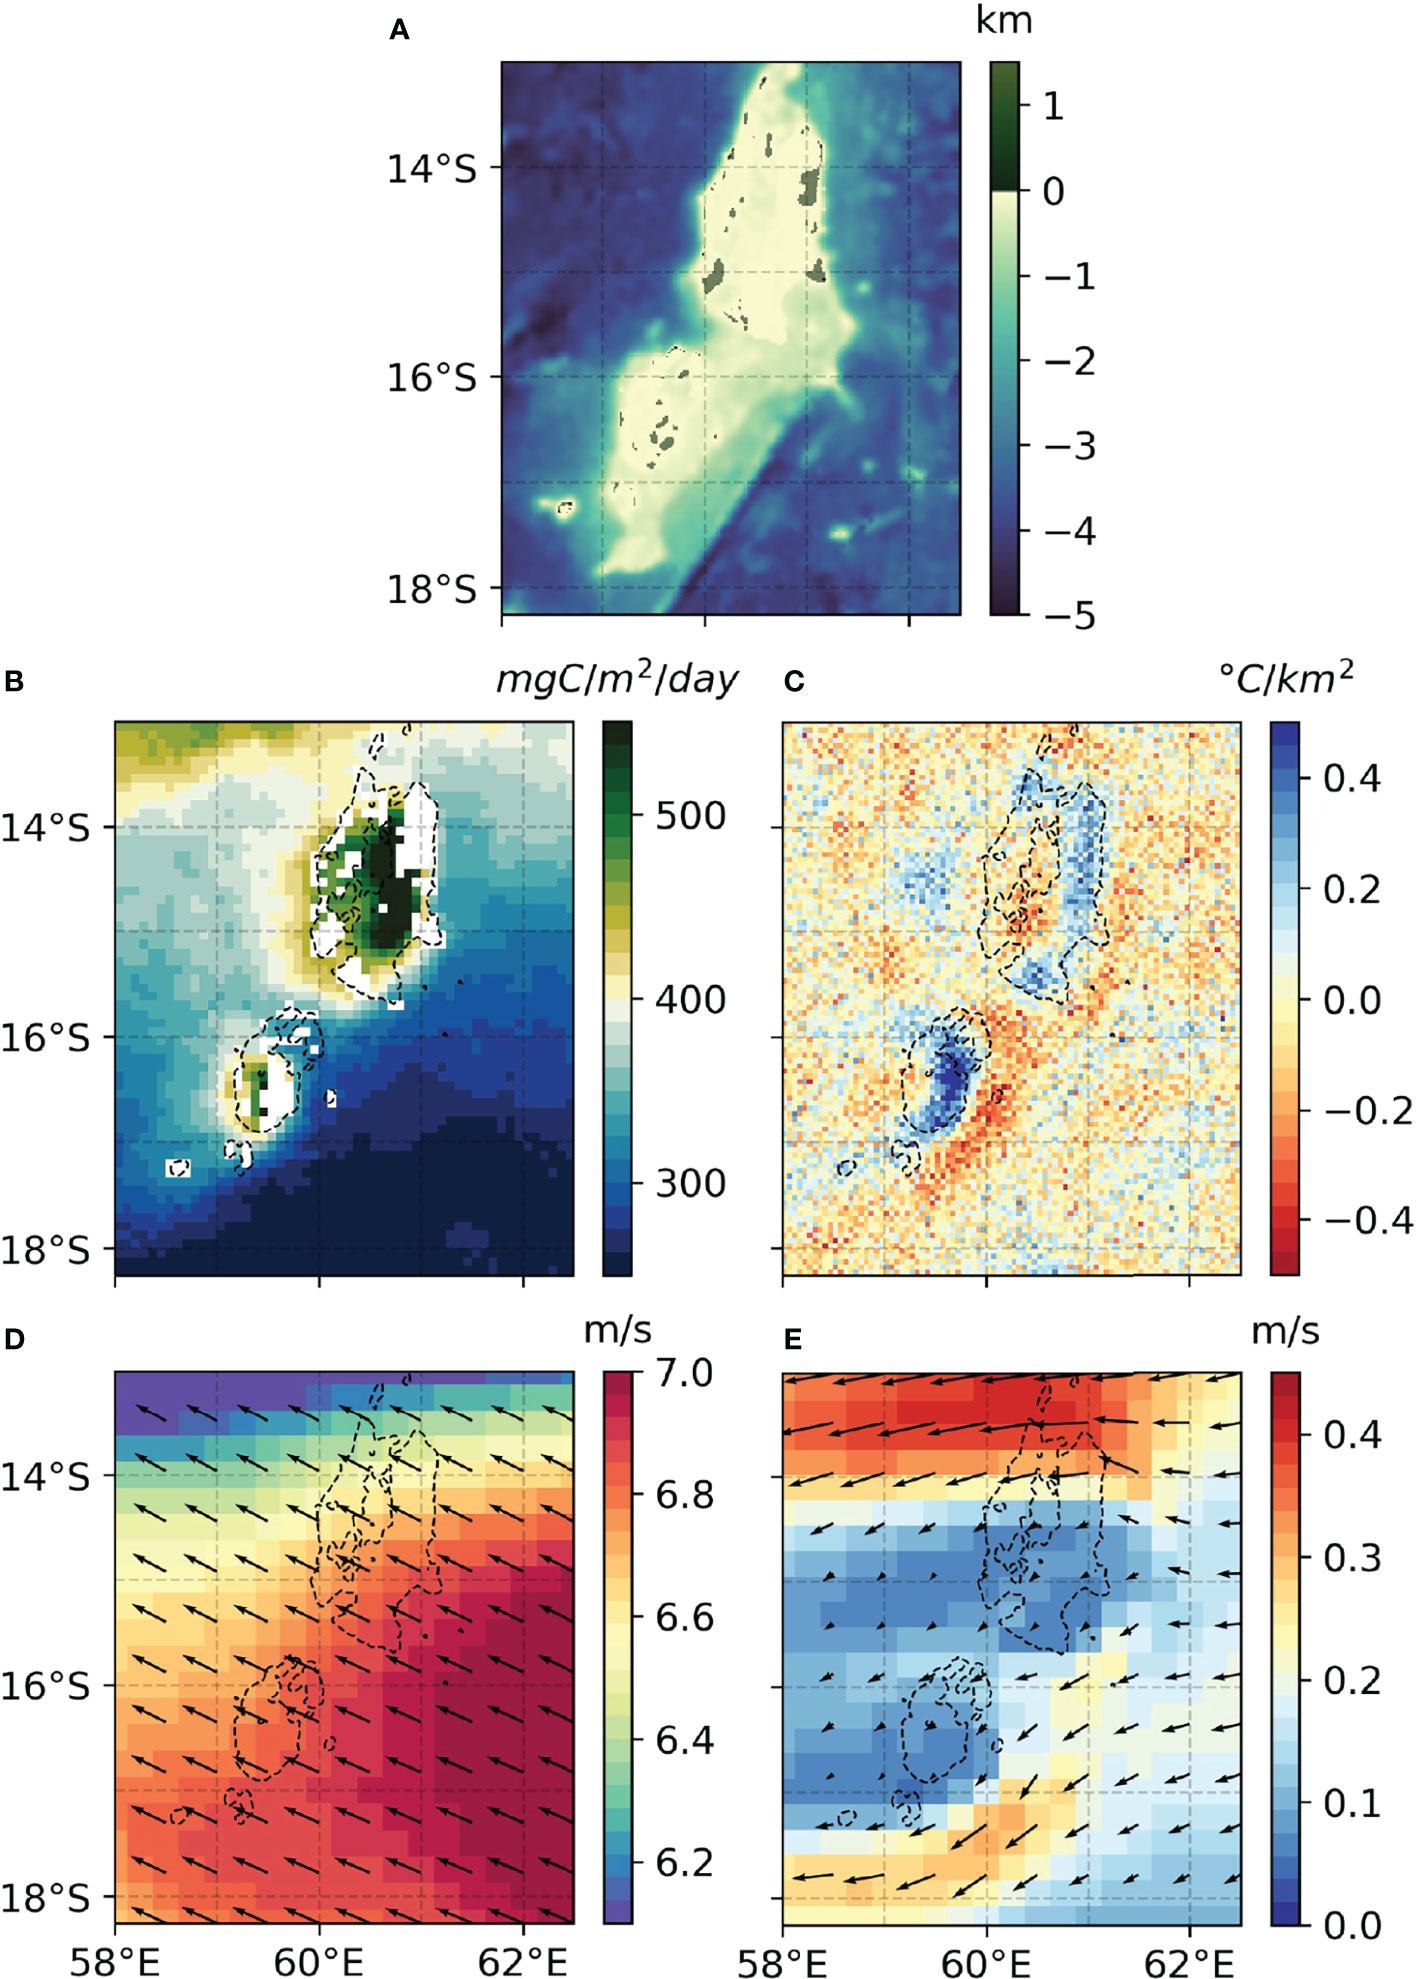
Figure 12 Saint Brandon Islands (Mauritius), (A) Topography, (B) NPP, (C) SST Laplacian, (D) Wind Speed, (E) Currents, annual average 2013. Black dashed line represents the 100 m depth isoline.
In some cases, NPP increase and SST anomalies are not observed. This is in particular - but not exclusively - the case of sparse coral islands of low altitude. Few examples are Tromelin (Mauritius, Figure S9), Nauru (Figure 10), the Marshall Islands (Figure S11), and Kosrae (Micronesia, Figure S12). Similarly, around Cocos Islands, in the Pacific, an increase in the NPP and a SST cooling can be observed in the annual mean (Figure S13) but no clear signal emerges from the monthly analysis despite the island extension being comparable to some of the islands here described. NPP blooms and lower surface temperatures in this case do not co-occur and thus are not linked to each other. Therefore, it is not possible to ascribe the signals to enhanced vertical exchanges. The relationship emerging among the annual mean values is probably an artifact associated with the average of the signals over shorter lasting uncorrelated events.
In general, the lack of surface signals might be due to the fact that the islands are too small to meaningfully interact with the large-scale ocean and atmosphere dynamics. The other possibility is that the surface variations in temperature and productivity have a magnitude and extension too small to be resolved by satellite data.
In few cases, the SST and NPP signals are decoupled and most likely influenced by different processes. Sometimes the surface imprint is only visible in the SST, e.g around Tristan da Cunha Archipelago, in the south Atlantic Ocean (Figure 13). This behavior may result from a photic zone deeper than the mixed layer, or, in other words, a nutricline deeper than the thermocline, so that upwelled waters from below the mixed layer base can be colder than surface ones but still nutrient depleted. Further observations and analysis would be needed to confirm this hypothesis. Additionally, the signal is not present in the SST Laplacian around Saint Helena, in the Atlantic Ocean, despite its considerable altitude, but only in the NPP, where it is mainly due to a specific event in fall (Figure S14).
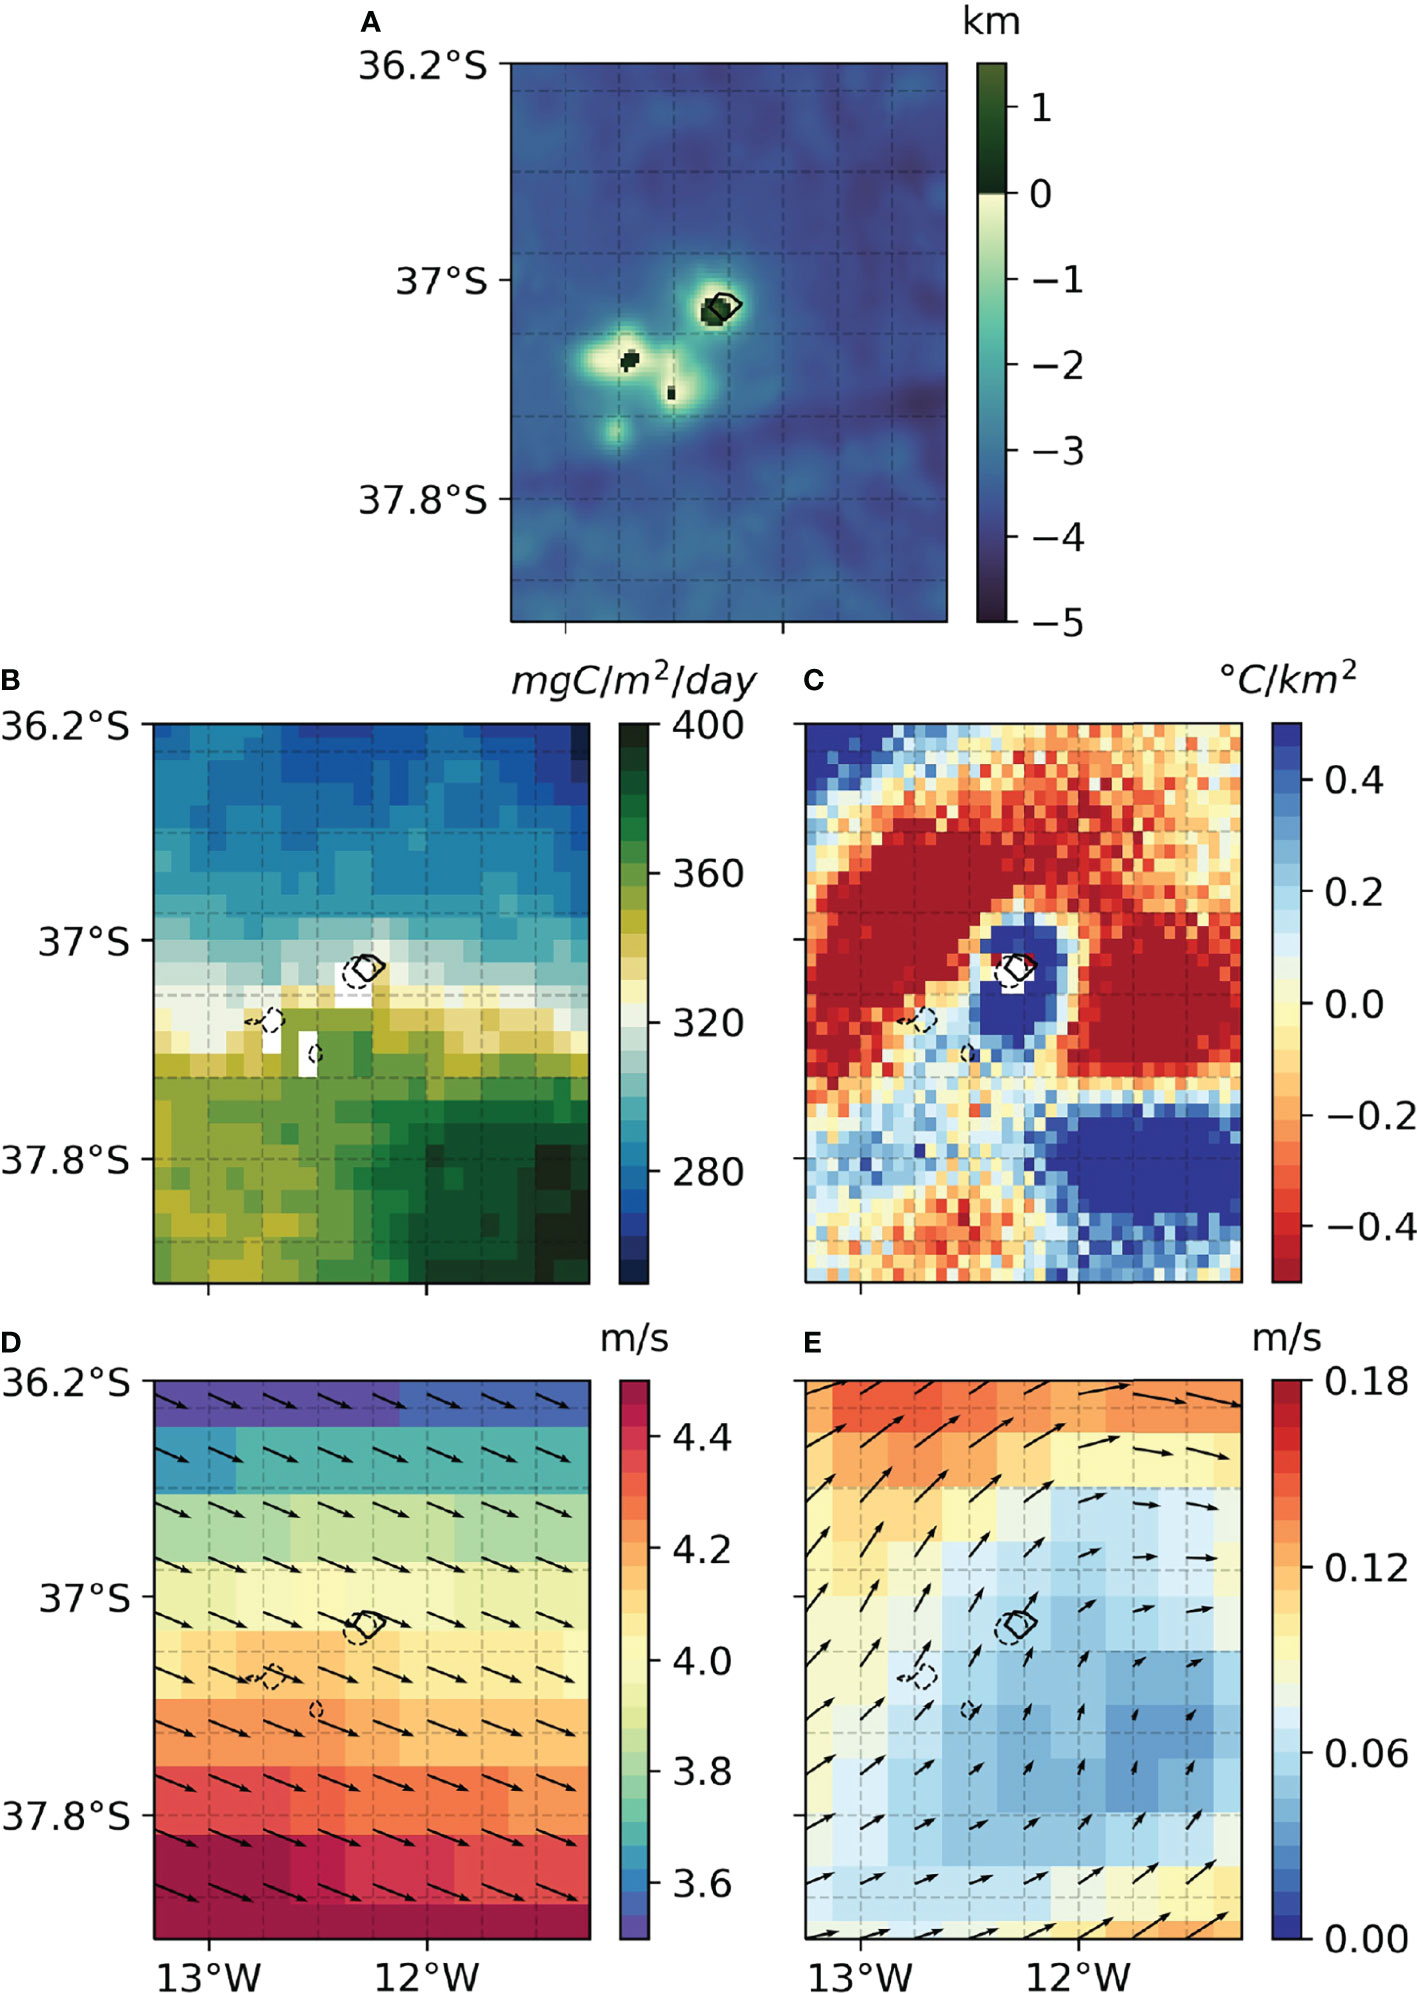
Figure 13 Tristan da Cunha, (A) Topography, (B) NPP, (C) SST Laplacian, (D) Wind Speed, (E) Currents, annual average 2013. Black dashed line represents the 100 m depth isoline.
In other cases NPP and SST display different seasonal behaviours. At Bermudas, over the shallow (∼ 20 m) caldera of the extinct volcano, NPP is elevated all year around, but the local SSTs are strongly coupled with the heat fluxes that vary with the seasonal cycle. The differential heating of shallower water over the old caldera makes the SST seasonal cycle more pronounced there if compared to the deeper surrounding waters. Therefore, the SST Laplacian displays a negative anomaly in June, when the downward radiation reaches its maximum, and a positive anomaly in November when it is at its minimum (Figure 14). Primary productivity, on the other hand, is higher than that of surrounding waters all year-round. The SST does not reflect the water mass characteristics of the underlying water but it is modulated by the seasonal cycle of the heat fluxes that are able to uniformly warm or cool the shallow lagoon. It should be noted that data inside the caldera have been retained despite the shallow bathymetry and that Chl-a estimates in this region might be contaminated.
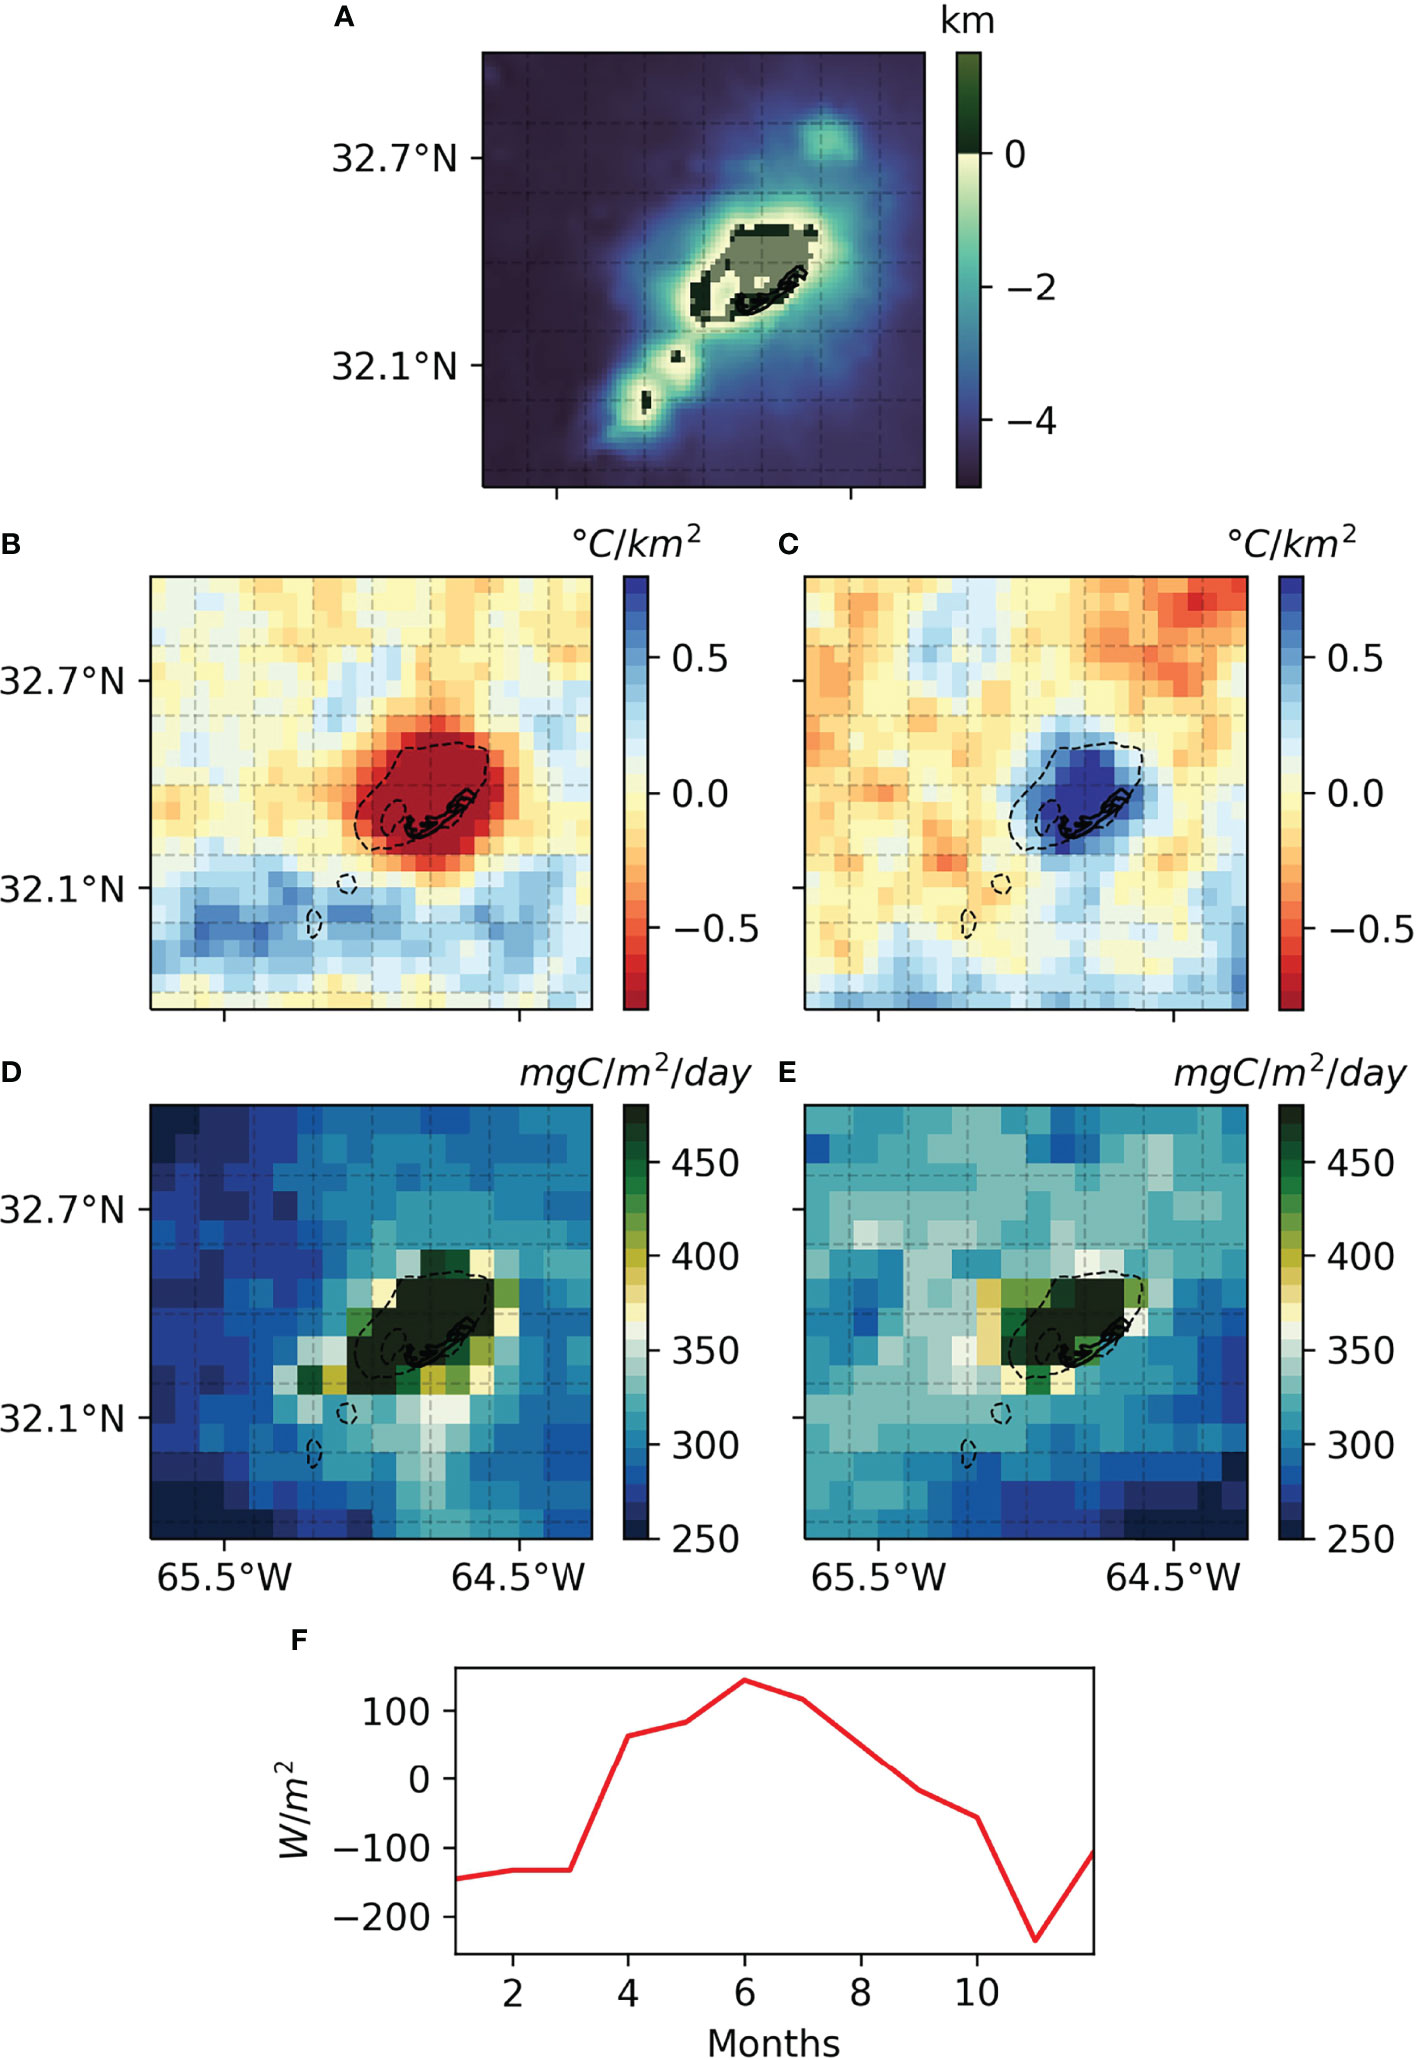
Figure 14 Bermudas (A) Topography, (B, C) SST Laplacian, (D, E) Original NPP without masking shallow grid points, (F) Spatial average of surface heat fluxes. (B, D) June, (C, E) November 2013. The black dashed line is the 100 m depth isoline.
One important question refers to how the IME may change in the future, in response to changes in its physical forcing. Climate models cannot provide detailed answers due to their limited resolution, but a combination of model results and observations can hint to likely behaviors. Ocean stratification has increased in the past half century and it is projected to increase even more in the future (IPCC, 2013; Guancheng et al., 2020). A more stable water column effectively inhibits mixing, compromising vertical exchanges and decreasing the input of nutrient in the euphotic layer. This has been consistently shown in earth system model projections (Bopp et al., 2001; Cabré et al., 2015; Fu et al., 2016). The magnitude of these changes remains uncertain (Bopp et al., 2013; Krumhardt et al., 2017; Kwiatkowski et al., 2020) but, in most cases, will induce a reduction of primary productivity, particularly at low latitudes (Steinacher et al., 2010; Bopp et al., 2013; Moore et al., 2018). However, in situ observations from local stations, in the North Pacific and North Atlantic, have measured positive trends in both nutrients and chlorophyll concentrations (Hoegh-Guldberg et al., 2014), hinting that local processes might counterbalance the increased stratification.
The water cycle is projected to amplify. Areas with an already high moisture content will likely experience a further increase, while the opposite will occur in dry zones (Durack et al., 2012; Skliris et al., 2016). Furthermore, in terms of atmospheric forcing, several studies point towards a weakening of both the monsoon and the Walker circulation (Tanaka et al., 2005; Ueda et al., 2006; Vecchi et al., 2006; Krishnan et al., 2012; Hsu, 2016). This would not only lead to the decrease of atmospheric forced vertical exchanges but also of wind-driven currents and, therefore, the magnitude of the current-island interactions would decline. On the other hand, westerlies winds are projected to intensify with increasing greenhouse gas concentrations (McInnes et al., 2011; Collins et al., 2013). The vertical nutrients input around islands located in different latitudinal bands could be subjected to different trends.
It is worth mentioning finally that the above description is based on remote sensing and reanalysis datasets which both suffer from their relatively low effective resolution compared to the processes involved. The effective resolution may be about 4 times coarser than the native resolution, and is limited by the numerical dissipation range, which is a function of the filters, data processing methods and schemes used (Soufflet et al., 2016). Fine scale patterns of SST or NPP have been omitted in this paper, especially around tiny island or sand banks for which the associated IME might be undetectable with the products used. The systematic analyses performed in this study and the categorization of physical processes affecting worldwide islands provide reliable background knowledge which needs further investigation, notably for the quantification of the role of small-scale processes. High-resolution modeling efforts may provide a useful tool to extend and complete this study.
Author Contributions
All authors designed the study. CF performed the conducted analyses. CF, FD, AB and CP drafted the manuscript and contributed to discussions, interpretations and writing. All the authors read and approved the submitted version.
Funding
This work is an outcome of the project MIUR - Dipartimenti di Eccellenza 2018-2022. FD has partially been supported by Piano Operativo Nazionale "Ricerca e Innovazione", Italian Ministry of University and Research (RTDAPON-150). AB was partially supported by the National Science Foundation [OCE-1658174].
Conflict of Interest
The authors declare that the research was conducted in the absence of any commercial or financial relationships that could be construed as a potential conflict of interest.
Publisher’s Note
All claims expressed in this article are solely those of the authors and do not necessarily represent those of their affiliated organizations, or those of the publisher, the editors and the reviewers. Any product that may be evaluated in this article, or claim that may be made by its manufacturer, is not guaranteed or endorsed by the publisher.
Acknowledgments
This study has been conducted using the Group for High Resolution Sea Surface Temperature (GHRSST), Simple Ocean Data Assimilation version 3 (SODA3), ECMWF Reanalysis v5 (ERA5), Ocean Surface Current Analyses Real-time (OSCAR) and Ocean Productivity NPP data sets. The authors wish to thank the reviewers, Monique Messié and Xiaohui Xie for their insightful and constructive comments.
Supplementary Material
The Supplementary Material for this article can be found online at: https://www.frontiersin.org/articles/10.3389/fmars.2022.894860/full#supplementary-material
References
Alford M. H., MacKinnon J. A., Nash J. D., Simmons H., Pickering A., Klymak J. M., et al. (2011). Energy Flux and Dissipation in Luzon Strait: Two Tales of Two Ridges. J. Phys. Oceanogr. 41, 2211–2222. doi: 10.1175/JPO-D-11-073.1
Andrade I., Sangrà P., Hormazabal S., Correa-Ramirez M. (2014). Island Mass Effect in the Juan Fernández Archipelago (33°S), Southeastern Pacific. Deep. Sea. Res. Part I: Oceanogr. Res. 84, 86–99. doi: 10.1016/j.dsr.2013.10.009
Ballarotta M., Ubelmann C., Pujol M.-I., Taburet G., Fournier F., Legeais J.-F., et al. (2019). On the Resolutions of Ocean Altimetry Maps. Ocean. Sci. 15, 1091–1109. doi: 10.5194/os-15-1091-2019
Barton E. (2001). Island Wakes. In Encyclopedia of Ocean Sciences (Second Edition). 2nd ed. Ed. Steele J. H. (Oxford: Academic Press), 343–348. doi: 10.1016/B978-012374473-9.00140-5
Barton E. D., Basterretxea G., Flament P., Mitchelson-Jacob E. G., Jones B., Arístegui J., et al. (2000). Lee Region of Gran Canaria. J. Geophys. Res.: Oceans 105, 17173–17193. doi: 10.1029/2000JC900010
Batchelor G. K. (2000). “An Introduction to Fluid Dynamics,” in Cambridge Mathematical Library (Cambridge: Cambridge University Press). doi: 10.1017/CBO9780511800955
Behrenfeld M. J., Falkowski P. G. (1997). Photosynthetic Rates Derived From Satellite-Based Chlorophyll Concentration. Limnol. Oceanogr. 42, 1–20. doi: 10.4319/lo.1997.42.1.0001
Bell P. (1992). Eutrophication and Coral Reefs-Some Examples in the Great Barrier Reef Lagoon. Water Res. 26, 553–568. doi: 10.1016/0043-1354(92)90228-V
Bonjean F., Lagerloef G. S. E. (2002). Diagnostic Model and Analysis of the Surface Currents in the Tropical Pacific Ocean. J. Phys. Oceanogr. 32, 2938–2954. doi: 10.1175/1520-0485(2002)032<2938:DMAAOT>2.0.CO;2
Bopp L., Monfray P., Aumont O., Dufresne J.-L., Le Treut H., Madec G., et al. (2001). Potential Impact of Climate Change on Marine Export Production. Global Biogeochem. Cycles 15, 81–99. doi: 10.1029/1999GB001256
Bopp L., Resplandy L., Orr J. C., Doney S. C., Dunne J. P., Gehlen M., et al. (2013). Multiple Stressors of Ocean Ecosystems in the 21st Century: Projections With Cmip5 Models. Biogeosciences 10, 6225–6245. doi: 10.5194/bg-10-6225-2013
Boss E., Zaneveld J. R. V. (2003). The Effect of Bottom Substrate on Inherent Optical Properties: Evidence of Biogeochemical Processes. Limnol. Oceanogr. 48, 346–354. doi: 10.4319/lo.2003.48.1_part_2.0346
Bowman M. J., Dietrich D. E., Lin C. A. (1996). Observations and Modeling of Mesoscale Ocean Circulation Near a Small Island[Washington, D.C.: American Geophysical Union (AGU)], Chap. 2. 18–35. doi: 10.1029/CE051p0018
Cabré A., Marinov I., Leung S. (2015). Consistent Global Responses of Marine Ecosystems to Future Climate Change Across the IPCC AR5 Earth System Models. Climate Dynamics 45, 1253–1280. doi: 10.1007/s00382-014-2374-3
Carton J., Chepurin G., Chen L. (2018). SODA3: A New Ocean Climate Reanalysis. J. Climate 31, 6967–6983. doi: 10.1175/JCLI-D-18-0149.1
Chang Y.-L., Miyazawa Y., Oey L.-Y., Kodaira T., Huang S. (2017). The Formation Processes of Phytoplankton Growth and Decline in Mesoscale Eddies in the Western North Pacific Ocean. J. Geophys. Res.: Oceans 122, 4444–4455. doi: 10.1002/2017JC012722
Chang M.-H., Tang T. Y., Ho C.-R., Chao S.-Y. (2013). Kuroshio-Induced Wake in the Lee of Green Island Off Taiwan. J. Geophys. Res.: Oceans 118, 1508–1519. doi: 10.1002/jgrc.20151
Collins M., Knutti R., Arblaster J., Dufresne J.-L., Fichefet T., Friedlingstein P., et al. (2013). “Long-Term Climate Change: Projections, Commitments and Irreversibility,” in Climate Change 2013: The Physical Science Basis. Contribution of Working Group I to the Fifth Assessment Report of the Intergovernmental Panel on Climate Change. Eds. Stocker T. F., Qin D., Plattner G., Tignor M., Allen S. K., Doschung J., Nauels A., Xia Y., Bex V., Midgley P. M. (Cambridge, UK: Cambridge University Press), 1029–1136. doi: 10.1017/CBO9781107415324.024
Coutis P., Middleton J. (2002). The Physical and Biological Impact of a Small Island Wake in the Deep Ocean. Deep. Sea. Res. Part I: Oceanogr. Res. Papers 49, 1341–1361. doi: 10.1016/S0967-0637(02)00029-8
Cullen J. J. (1982). The Deep Chlorophyll Maximum: Comparing Vertical Profiles of Chlorophyll a. Can. J. Fish. Aquat. Sci. 39, 791–803. doi: 10.1139/f82-108
Cushman-Roisin B., Beckers J.-M. (2011). Introduction to Geophysical Fluid Dynamics: Physical and Numerical Aspects. 2 edn (Cambridge: Academic Press).
De Falco C., Bracco A., Pasquero C. (2020). Climatic and Oceanographic Controls on Coral Bleaching Conditions in the Maldivian Region. Front. Mar. Sci. 7. doi: 10.3389/fmars.2020.539869
Dietrich D. E., Bowman M. J., Lin C. A., Mestas-Nunez A. (1996). Numerical Studies of Small Island Wakes in the Ocean. Geophys. Astrophys. Fluid Dynamics 83, 195–231. doi: 10.1080/03091929608208966
Dong C., McWilliams J. C., Shchepetkin A. F. (2007). Island Wakes in Deep Water. J. Phys. Oceanogr. 37, 962–981. doi: 10.1175/JPO3047.1
Dong C., Yuhan C., McWilliams J. (2018). Island Wakes in Shallow Water. Atmosphere-Ocean56, 1–8. doi: 10.1080/07055900.2018.1448750
Doty M. S., Oguri M. (1956). The Island Mass Effect. ICES J. Mar. Sci. 22, 33–37. doi: 10.1093/icesjms/22.1.33
Dufois F., Hardman-Mountford N., Greenwood J., Richardson A., Feng M., Matear R. (2016). Anticyclonic Eddies are More Productive Than Cyclonic Eddies in Subtropical Gyres Because of Winter Mixing. Sci. Adv. 2, e1600282. doi: 10.1126/sciadv.1600282
Durack P., Wijffels S., Matear R. (2012). Ocean Salinities Reveal Strong Global Water Cycle Intensification During 1950 to 2000. Science 336, 455–458. doi: 10.1126/science.1212222
Fu W., Randerson J. T., Moore J. K. (2016). Climate Change Impacts on Net Primary Production (Npp) and Export Production (Ep) Regulated by Increasing Stratification and Phytoplankton Community Structure in the Cmip5 Models. Biogeosciences 13, 5151–5170. doi: 10.5194/bg-13-5151-2016
Gaube P., Chelton D. B., Samelson R. M., Schlax M. G., O’Neill L. W. (2015). Satellite Observations of Mesoscale Eddy-Induced Ekman Pumping. J. Phys. Oceanogr. 45, 104–132. doi: 10.1175/JPO-D-14-0032.1
Gaube P., Chelton D. B., Strutton P. G., Behrenfeld M. J. (2013). Satellite Observations of Chlorophyll, Phytoplankton Biomass, and Ekman Pumping in Nonlinear Mesoscale Eddies. J. Geophys. Res.: Oceans 118, 6349–6370. doi: 10.1002/2013JC009027
Gove J., McManus M., Neuheimer A., Polovina J., Drazen J., Smith C., et al. (2016). Near-Island Biological Hotspots in Barren Ocean Basins. Nat. Commun. 7, 10581. doi: 10.1038/ncomms10581
Gove J. M., Merrifield M. A., Brainard R. E. (2006). Temporal Variability of Current-Driven Upwelling at Jarvis Island. J. Geophys. Res.: Oceans 111, C12011. doi: 10.1029/2005JC003161
Guancheng L., Cheng L., Zhu J., Trenberth K., Mann M., Abraham J. (2020). Increasing Ocean Stratification Over the Past Half-Century. Nat. Climate Change 10, 1–8. doi: 10.1038/s41558-020-00918-2
Hafner J., Xie S.-P. (2003). Far-Field Simulation of the Hawaiian Wake: Sea Surface Temperature and Orographic Effects. J. Atmosph. Sci. 60, 3021–3032. doi: 10.1175/1520-0469(2003)060<3021:FSOTHW>2.0.CO;2
Hamner W. M., Hauri I. R. (1981). Effects of Island Mass: Water Flow and Plankton Pattern Around a Reef in the Great Barrier Reef Lagoon, Australia. Limnol. Oceanogr. 26, 1084–1102. doi: 10.4319/lo.1981.26.6.1084
Hasegawa D., Lewis M. R., Gangopadhyay A. (2009). How Islands Cause Phytoplankton to Bloom in Their Wakes. Geophys. Res. Lett. 36, L20605. doi: 10.1029/2009GL039743
Hasegawa D., Yamazaki H., Lueck R. G., Seuront L. (2004). How Islands Stir and Fertilize the Upper Ocean. Geophys. Res. Lett. 31, L16303. doi: 10.1029/2004GL020143
Heywood K., Barton E., Simpson J. (1990). The effects of flow disturbance by an oceanic island. J. Mar. Res. 48, 55–73. doi: 10.1357/002224090784984623
Hoegh-Guldberg O., Cai R., Poloczanska E., Brewer P., Sundby S., Hilmi K., et al. (2014). “The Ocean - Supplementary Material,” in Climate Change 2014: Impacts, Adaptation, and Vulnerability. Part B: Regional Aspects. Contribution of Working Group II to the Fifth Assessment Report of the Intergovernmental Panel on Climate Change. Eds. Barros V., Field C., Dokken D., Mastrandrea M., Mach K., Bilir T., Chatterjee M., Ebi K., Estrada Y., Genova R., Girma B., Kissel E., Levy A., MacCracken S., Mastrandrea P., White L. (Cambridge, UK and New York, NY, USA: Cambridge University Press), 1655–1731. doi: 10.1017/CBO9781107415324.024
Hsu P.-C. (2016). “Global Monsoon in a Changing Climate,” in The Monsoons and Climate Change: Observations and Modeling. Eds. de Carvalho L. M. V., Jones C. (Cham: Springer International Publishing), 7–24. doi: 10.1007/978-3-319-21650-8_2
Hwang D.-W., Lee Y.-W., Kim G. (2005). Large Submarine Groundwater Discharge and Benthic Eutrophication in Bangdu Bay on Volcanic Jeju Island, Korea. Limnol. Oceanogr. 50, 1393–1403. doi: 10.4319/lo.2005.50.5.1393
IPCC (2013). Climate Change 2013: The Physical Science Basis. Contribution of Working Group I to the Fifth Assessment Report of the Intergovernmental Panel on Climate Change (Cambridge, United Kingdom and New York, NY, USA: Cambridge University Press). doi: 10.1017/CBO9781107415324
Japan Meteorological Agency, Japan (2013). JRA-55: Japanese 55-Year Reanalysis, Daily 3-Hourly and 6-Hourly Data JRA-55.
Jia Y., Calil P. H. R., Chassignet E. P., Metzger E. J., Potemra J. T., Richards K. J., et al. (2011). Generation of Mesoscale Eddies in the Lee of the Hawaiian Islands. J. Geophys. Res.: Oceans 116, C11009. doi: 10.1029/2011JC007305
Jiménez B., Sangrà P., Mason E. (2008). A Numerical Study of the Relative Importance of Wind and Topographic Forcing on Oceanic Eddy Shedding by Tall, Deep Water Islands. Ocean. Model. 22, 146–157. doi: 10.1016/j.ocemod.2008.02.004
Klemas V. (2012). Remote Sensing of Ocean Internal Waves: An Overview. J. Coast. Res. 28, 540–546. doi: 10.2112/JCOASTRES-D-11-00156.1
Krishnan R., Sabin T. P., Ayantika D. C., Kitoh A., Sugi M., Murakami H., et al. (2012). Will the South Asian Monsoon Overturning Circulation Stabilize Any Further? Climate Dynamics 40, 187–211. doi: 10.1007/s00382-012-1317-0
Krumhardt K. M., Lovenduski N. S., Long M. C., Lindsay K. (2017). Avoidable Impacts of Ocean Warming on Marine Primary Production: Insights From the Cesm Ensembles. Global Biogeochem. Cycles 31, 114–133. doi: 10.1002/2016GB005528
Kwiatkowski L., Torres O., Bopp L., Aumont O., Chamberlain M., Christian J. R., et al. (2020). Twenty-First Century Ocean Warming, Acidification, Deoxygenation, and Upper-Ocean Nutrient and Primary Production Decline From Cmip6 Model Projections. Biogeosciences 17, 3439–3470. doi: 10.5194/bg-17-3439-2020
Li J., Qi Y., Jing Z., Wang J. (2014). Enhancement of Eddy-Ekman Pumping Inside Anticyclonic Eddies With Wind-Parallel Extension: Satellite Observations and Numerical Studies in the South China Sea. J. Mar. Syst. 132, 150–161. doi: 10.1016/j.jmarsys.2014.02.002
Liu G., Bracco A., Sitar A. (2021). Submesoscale Mixing Across the Mixed Layer in the Gulf of Mexico. Front. Mar. Sci. 8, 231. doi: 10.3389/fmars.2021.615066
Liu Y., Xie L., Morrison J., Kamykowski D., Sweet W. (2014). Ocean Circulation and Water Mass Characteristics Around the Galápagos Archipelago Simulated by a Multiscale Nested Ocean Circulation Model. Int. J. Oceanogr. 2014, 1–16. doi: 10.1155/2014/198686
Mahadevan A., Thomas L. N., Tandon A. (2008). Comment on “Eddy/Wind Interactions Stimulate Extraordinary Mid-Ocean Plankton Blooms”. Science 320, 448–448. doi: 10.1126/science.1152111
Martin A. P., Richards K. J. (2001). Mechanisms for Vertical Nutrient Transport Within a North Atlantic Mesoscale Eddy. Deep. Sea. Res. Part II: Topical Stud. Oceanogr. 48, 757–773. doi: 10.1016/S0967-0645(00)00096-5. Biological Oceanography of the north-east Atlantic-the PRIME study.
McGillicuddy D. J. (2016). Mechanisms of Physical-Biological-Biogeochemical Interaction at the Oceanic Mesoscale. Annu. Rev. Mar. Sci. 8, 125–159. doi: 10.1146/annurev-marine-010814-015606
McGillicuddy D. J., Anderson L. A., Bates N. R., Bibby T., Buesseler K. O., Carlson C. A., et al. (2007). Eddy/wind Interactions Stimulate Extraordinary Mid-Ocean Plankton Blooms. Science 316, 1021–1026. doi: 10.1126/science.1136256
McGillicuddy D., Robinson A. (1997). Eddy-Induced Nutrient Supply and New Production in the Sargasso Sea. Deep. Sea. Res. Part I: Oceanogr. Res. Papers 44, 1427–1450. doi: 10.1016/S0967-0637(97)00024-1
McInnes K. L., Erwin T. A., Bathols J. M. (2011). Global Climate Model Projected Changes in 10 M Wind Speed and Direction Due to Anthropogenic Climate Change. Atmosph. Sci. Lett. 12, 325–333. doi: 10.1002/asl.341
Merrifield M. A., Holloway P. E. (2002). Model Estimates of M2 Internal Tide Energetics at the Hawaiian Ridge. J. Geophys. Res.: Oceans 107, 5–12. doi: 10.1029/2001JC000996
Miglietta M., Buzzi A. (2004). A Numerical Study of Moist Stratified Flow Regimes Over Isolated Topography. Q. J. R. Meteorolog. Soc.: A J. Atmospher. Sciences Appl. Meteorol. Phys. Oceanogr. 130, 1749–1770. doi: 10.1256/qj.02.225
Moeller H. V., Laufkötter C., Sweeney E. M., Johnson M. D. (2019). Light-Dependent Grazing can Drive Formation and Deepening of Deep Chlorophyll Maxima. Nat. Commun. 10, 1978–1986. doi: 10.1038/s41467-019-09591-2
Moore J. K., Fu W., Primeau F., Britten G. L., Lindsay K., Long M., et al. (2018). Sustained Climate Warming Drives Declining Marine Biological Productivity. Science 359, 1139–1143. doi: 10.1126/science.aao6379
Morel A., Berthon J.-F. (1989). Surface Pigments, Algal Biomass Profiles, and Potential Production of the Euphotic Layer: Relationships Reinvestigated in View of Remote-Sensing Applications. Limnol. Oceanogr. 34, 1545–1562. doi: 10.4319/lo.1989.34.8.1545
NASA Goddard Space Flight Center, Ocean Ecology Laboratory, Ocean Biology Processing Group (2014). MODIS-Aqua Ocean Color Data. doi: 10.5067/AQUA/MODIS_OC.2014.0
Nikurashin M., Ferrari R. (2013). Overturning Circulation Driven by Breaking Internal Waves in the Deep Ocean. Geophys. Res. Lett. 40, 3133–3137. doi: 10.1002/grl.50542
Pullen J., Doyle J. D., May P., Chavanne C., Flament P., Arnone R. A. (2008). Monsoon Surges Trigger Oceanic Eddy Formation and Propagation in the Lee of the Philippine Islands. Geophys. Res. Lett. 35, L07604. doi: 10.1029/2007GL033109
Raapoto H., Martinez E., Petrenko A., Doglioli A. M., Maes C. (2018). Modeling the Wake of the Marquesas Archipelago. J. Geophys. Res.: Oceans 123, 1213–1228. doi: 10.1002/2017JC013285
Renault L., Molemaker M. J., McWilliams J. C., Shchepetkin A. F., Lemarié F., Chelton D., et al. (2016). Modulation of Wind Work by Oceanic Current Interaction With the Atmosphere. J. Phys. Oceanogr. 46, 1685–1704. doi: 10.1175/JPO-D-15-0232.1
Sangrà P. (2015). “Canary Islands Eddies and Coastal Upwelling Filaments Off North-West Africa,” in Oceanographic and Biological Features in the Canary Current Large Marine Ecosystem, vol. 115 . Eds. Valdés L., Déniz- González I. (Paris: IOC-UNESCO), 105–114.
Sangrà P., Auladell M., Marrero-Díaz A., Pelegrí J., Fraile-Nuez E., Rodríguez-Santana A., et al. (2007). On the Nature of Oceanic Eddies Shed by the Island of Gran Canaria. Deep. Sea. Res. Part I: Oceanogr. Res. Papers 54, 687–709. doi: 10.1016/j.dsr.2007.02.004
Sasamal S. K. (2006). Island Mass Effect Around the Maldives During the Winter Months of 2003 and 2004. Int. J. Remote Sens. 27, 5087–5093. doi: 10.1080/01431160500177562
Schär C., Durran D. R. (1997). Vortex Formation and Vortex Shedding in Continuously Stratified Flows Past Isolated Topography. J. atmospher. Sci. 54, 534–554. doi: 10.1175/1520-0469(1997)054<0534:VFAVSI>2.0.CO;2
Schütte F., Brandt P., Karstensen J. (2016). Occurrence and Characteristics of Mesoscale Eddies in the Tropical Northeastern Atlantic Ocean. Ocean. Sci. 12, 663–685. doi: 10.5194/os-12-663-2016
Skliris N., Zika J., Nurser G., Josey S., Marsh R. (2016). Global Water Cycle Amplifying at Less Than the Clausius-Clapeyron Rate. Sci. Rep. 6, 38752. doi: 10.1038/srep38752
Smolarkiewicz P. K., Rotunno R. (1989). Low Froude Number Flow Past Three-Dimensional Obstacles. Part I: Baroclinically Generated Lee Vortices. J. Atmosph. Sci. 46, 1154–1164. doi: 10.1175/1520-0469(1989)046<1154:LFNFPT>2.0.CO;2
Soufflet Y., Marchesiello P., Lemarié F., Jouanno J., Capet X., Debreu L., et al. (2016). On Effective Resolution in Ocean Models. Ocean. Model. 98, 36–50. doi: 10.1016/j.ocemod.2015.12.004
Stegner A. (2014). “Oceanic Island Wake Flows in the Laboratory,” in Modeling Atmospheric and Oceanic Flows[Washington, D.C.: American Geophysical Union (AGU)], 265–276. doi: 10.1002/9781118856024.ch14
Steinacher M., Joos F., Frölicher T. L., Bopp L., Cadule P., Cocco V., et al. (2010). Projected 21st Century Decrease in Marine Productivity: A Multi-Model Analysis. Biogeosciences 7, 979–1005. doi: 10.5194/bg-7-979-2010
Stevens D. E., Crum F. X. (2003). “Meteorology, Dynamic (Troposphere),” in Encyclopedia of Physical Science and Technology (Third Edition), 3rd ed. Ed. Meyers R. A. (New York: Academic Press), 629–659. doi: 10.1016/B0-12-227410-5/00436-1
Storlazzi C., Cheriton O., van Hooidonk R., Zhao Z., Brainard R. (2020). Internal Tides can Provide Thermal Refugia That Will Buffer Some Coral Reefs From Future Global Warming. Sci. Rep. 10, 13435. doi: 10.1038/s41598-020-70372-9
Street J. H., Knee K. L., Grossman E. E., Paytan A. (2008). Submarine Groundwater Discharge and Nutrient Addition to the Coastal Zone and Coral Reefs of Leeward Hawai’i. Mar. Chem. 109, 355–376. doi: 10.1016/j.marchem.2007.08.009
Stull R. B. (1988). An Introduction to Boundary Layer Meteorology Vol. vol. 13 (Dordrecht: Springer Science & Business Media).
Tanaka H., Ishizaki N., Nohara D. (2005). Intercomparison of the Intensities and Trends of Hadley, Walker and Monsoon Circulations in the Global Warming Projections. Sola 1, 77–80. doi: 10.2151/sola.2005-021
Teinturier S., Stegner A., Didelle H., Viboud S. (2010). Small-Scale Instabilities of an Island Wake Flow in a Rotating Shallow-Water Layer. Dynamics Atmosph. Oceans 49, 1–24. doi: 10.1016/j.dynatmoce.2008.10.006
Tomczak M. (1988). Island Wakes in Deep and Shallow Water. J. Geophys. Res.: Oceans 93, 5153–5154. doi: 10.1029/JC093iC05p05153
Ueda H., Iwai A., Kuwako K., Hori M. (2006). Impact of Anthropogenic Forcing on the Asian Summer Monsoon as Simulated by Eight Gcms. Geophys. Res. Lett. 33, L06703. doi: 10.1029/2005GL025336
UK Met Office (2005) GHRSST Level 4 OSTIA Global Foundation Sea Surface Temperature Analysis. Ver. 1.0. PO.DAAC, CA, USA (Accessed 12 February 2020).
Vallis G. K. (2017). Atmospheric and Oceanic Fluid Dynamics: Fundamentals and Large-Scale Circulation. 2 edn (Cambridge: Cambridge University Press). doi: 10.1017/9781107588417
Vecchi G., Soden B., Wittenberg A., Held I., Leetmaa A., Harrison M. (2006). Weakening of Tropical Pacific Atmospheric Circulation Due to Anthropogenic Forcing. Nature 441, 73–76. doi: 10.1038/nature04744
Vitousek P. M., Mooney H. A., Lubchenco J.,, Melillo J. M. (1997). Human Domination of Earth’s Ecosystems. Hum. Domination Earth’s Ecosyst. Sci. 277, 494–499. doi: 10.1126/science.277.5325.494
Wulfmeyer V, Janjić T (2005) Twenty-Four-Hour Observations of the Marine Boundary Layer Using Shipborne NOAA High-Resolution Doppler Lidar. J. Appl. Meteorol. 44, 17231744. doi: 10.1175/JAM2296.1
Wyatt A., Leichter J., Toth L., Miyajima T., Aronson R., Nagata T. (2020). Heat Accumulation on Coral Reefs Mitigated by Internal Waves. Nat. Geosci. 13, 1–7. doi: 10.1038/s41561-019-0486-4
Yang Y., Chen Y.-L. (2008). Effects of Terrain Heights and Sizes on Island-Scale Circulations and Rainfall for the Island of Hawaii During Harp. Monthly Weather Rev. 136, 120–146. doi: 10.1175/2007MWR1984.1
Zeiden K. L., Rudnick D. L., MacKinnon J. A. (2019). Glider Observations of a Mesoscale Oceanic Island Wake. J. Phys. Oceanogr. 49, 2217–2235. doi: 10.1175/JPO-D-18-0233.1
Keywords: Island Mass Effect, Primary Productivity, SST, vertical exchanges, upper ocean mixing, island-current interactions
Citation: De Falco C, Desbiolles F, Bracco A and Pasquero C (2022) Island Mass Effect: A Review of Oceanic Physical Processes. Front. Mar. Sci. 9:894860. doi: 10.3389/fmars.2022.894860
Received: 12 March 2022; Accepted: 17 June 2022;
Published: 22 July 2022.
Edited by:
Zhiyu Liu, Xiamen University, ChinaReviewed by:
Monique Messié, Monterey Bay Aquarium Research Institute (MBARI), United StatesXiaohui Xie, Ministry of Natural Resources, China
Copyright © 2022 De Falco, Desbiolles, Bracco and Pasquero. This is an open-access article distributed under the terms of the Creative Commons Attribution License (CC BY). The use, distribution or reproduction in other forums is permitted, provided the original author(s) and the copyright owner(s) are credited and that the original publication in this journal is cited, in accordance with accepted academic practice. No use, distribution or reproduction is permitted which does not comply with these terms.
*Correspondence: Chiara De Falco, chde@norceresearch.no