An Observation-Based Study of Gulf Stream Meander Kinematics Offshore of Cape Hatteras
 Mike Muglia
 Harvey Seim
 John Bane2
 - 1East Carolina University, Coastal Studies Institute, Wanchese, NC, United States
- 2Earth, Marine, and Environmental Sciences, University of North Carolina, Chapel Hill, NC, United States
Gulf Stream (GS) meander structure and propagation offshore of Cape Hatteras are investigated by integrating current measurements from a bottom-moored Acoustic Doppler Current Profiler (ADCP) with high-frequency radar (HFR) surface current measurements and satellite Sea Surface Temperature (SST) images during November 2014. The ADCP measurements provide well-resolved current observations throughout most of the water column, while hourly surface current measurements from HF radars and available satellite SST images provide spatial context to the GS orientation, meander propagation, circulation, and shear structure in the region of the ADCP mooring. The observations provide new insights about meander propagation and evolution in this important transition region. ADCP measurements observed that the increase and deepening intervals of the downstream current with approaching meander crests were typically longer than those for the decrease and shoaling of downstream current, consistent with prominent skewed crests near the surface. The transition time from trough to crest is much greater than that from crest to trough, reflecting the asymmetry in the downstream velocity structure. Vertical shears in the downstream and cross-stream velocity components are indicative of a cold dome centered downslope and offshore of the ADCP. Local maxima in downstream current and bottom temperature at the ADCP occur simultaneously, are accompanied by large vertical velocities, and are led by offshore currents in the upper water column. The mean meander phase speed estimated with HFRs is 48 km/day. Meander periods during the month are about 5-6 days. Where the maxima are seen in the water column, downstream currents reach 2.5 m/s, with current reversals sometimes in excess of 0.5 m/s. Downstream currents occupy an increasing portion of the water column as a crest approaches, and a decreasing fraction as a trough approaches. The deepening increase in downstream velocities with approaching crests is often accompanied by an increase in upstream velocities near the bottom.
1 Introduction
The propagation and evolution of Gulf Stream (GS) meanders have been studied extensively both north and south of Cape Hatteras, with less attention given to the meander transition region near the cape. As a result, meander propagation past Cape Hatteras (Figure 1), and potential linkages between the two very different biogeophysical meander regimes to the south and north are not well understood. For example, meander decay downstream of the Charleston Bump may leave nutrient-rich upwelled water in meander troughs stranded south of Cape Hatteras (Savidge, 2004). Recent potential changes in the GS system make understanding these connections increasingly important. For example, indications of a recent westward shift of the GS destabilization point after it leaves the continental margin suggests enhanced exchange between the GS and the Slope Sea and increased high salinity warm water intrusions onto the Mid-Atlantic Bight (MAB) shelf and upper slope (Gawarkiewicz et al., 2012; Zhang and Gawarkiewicz, 2015; Andres, 2016). It has also been suggested that shifts in the GS destabilization point may influence coastal water levels (Ezer, 2019).
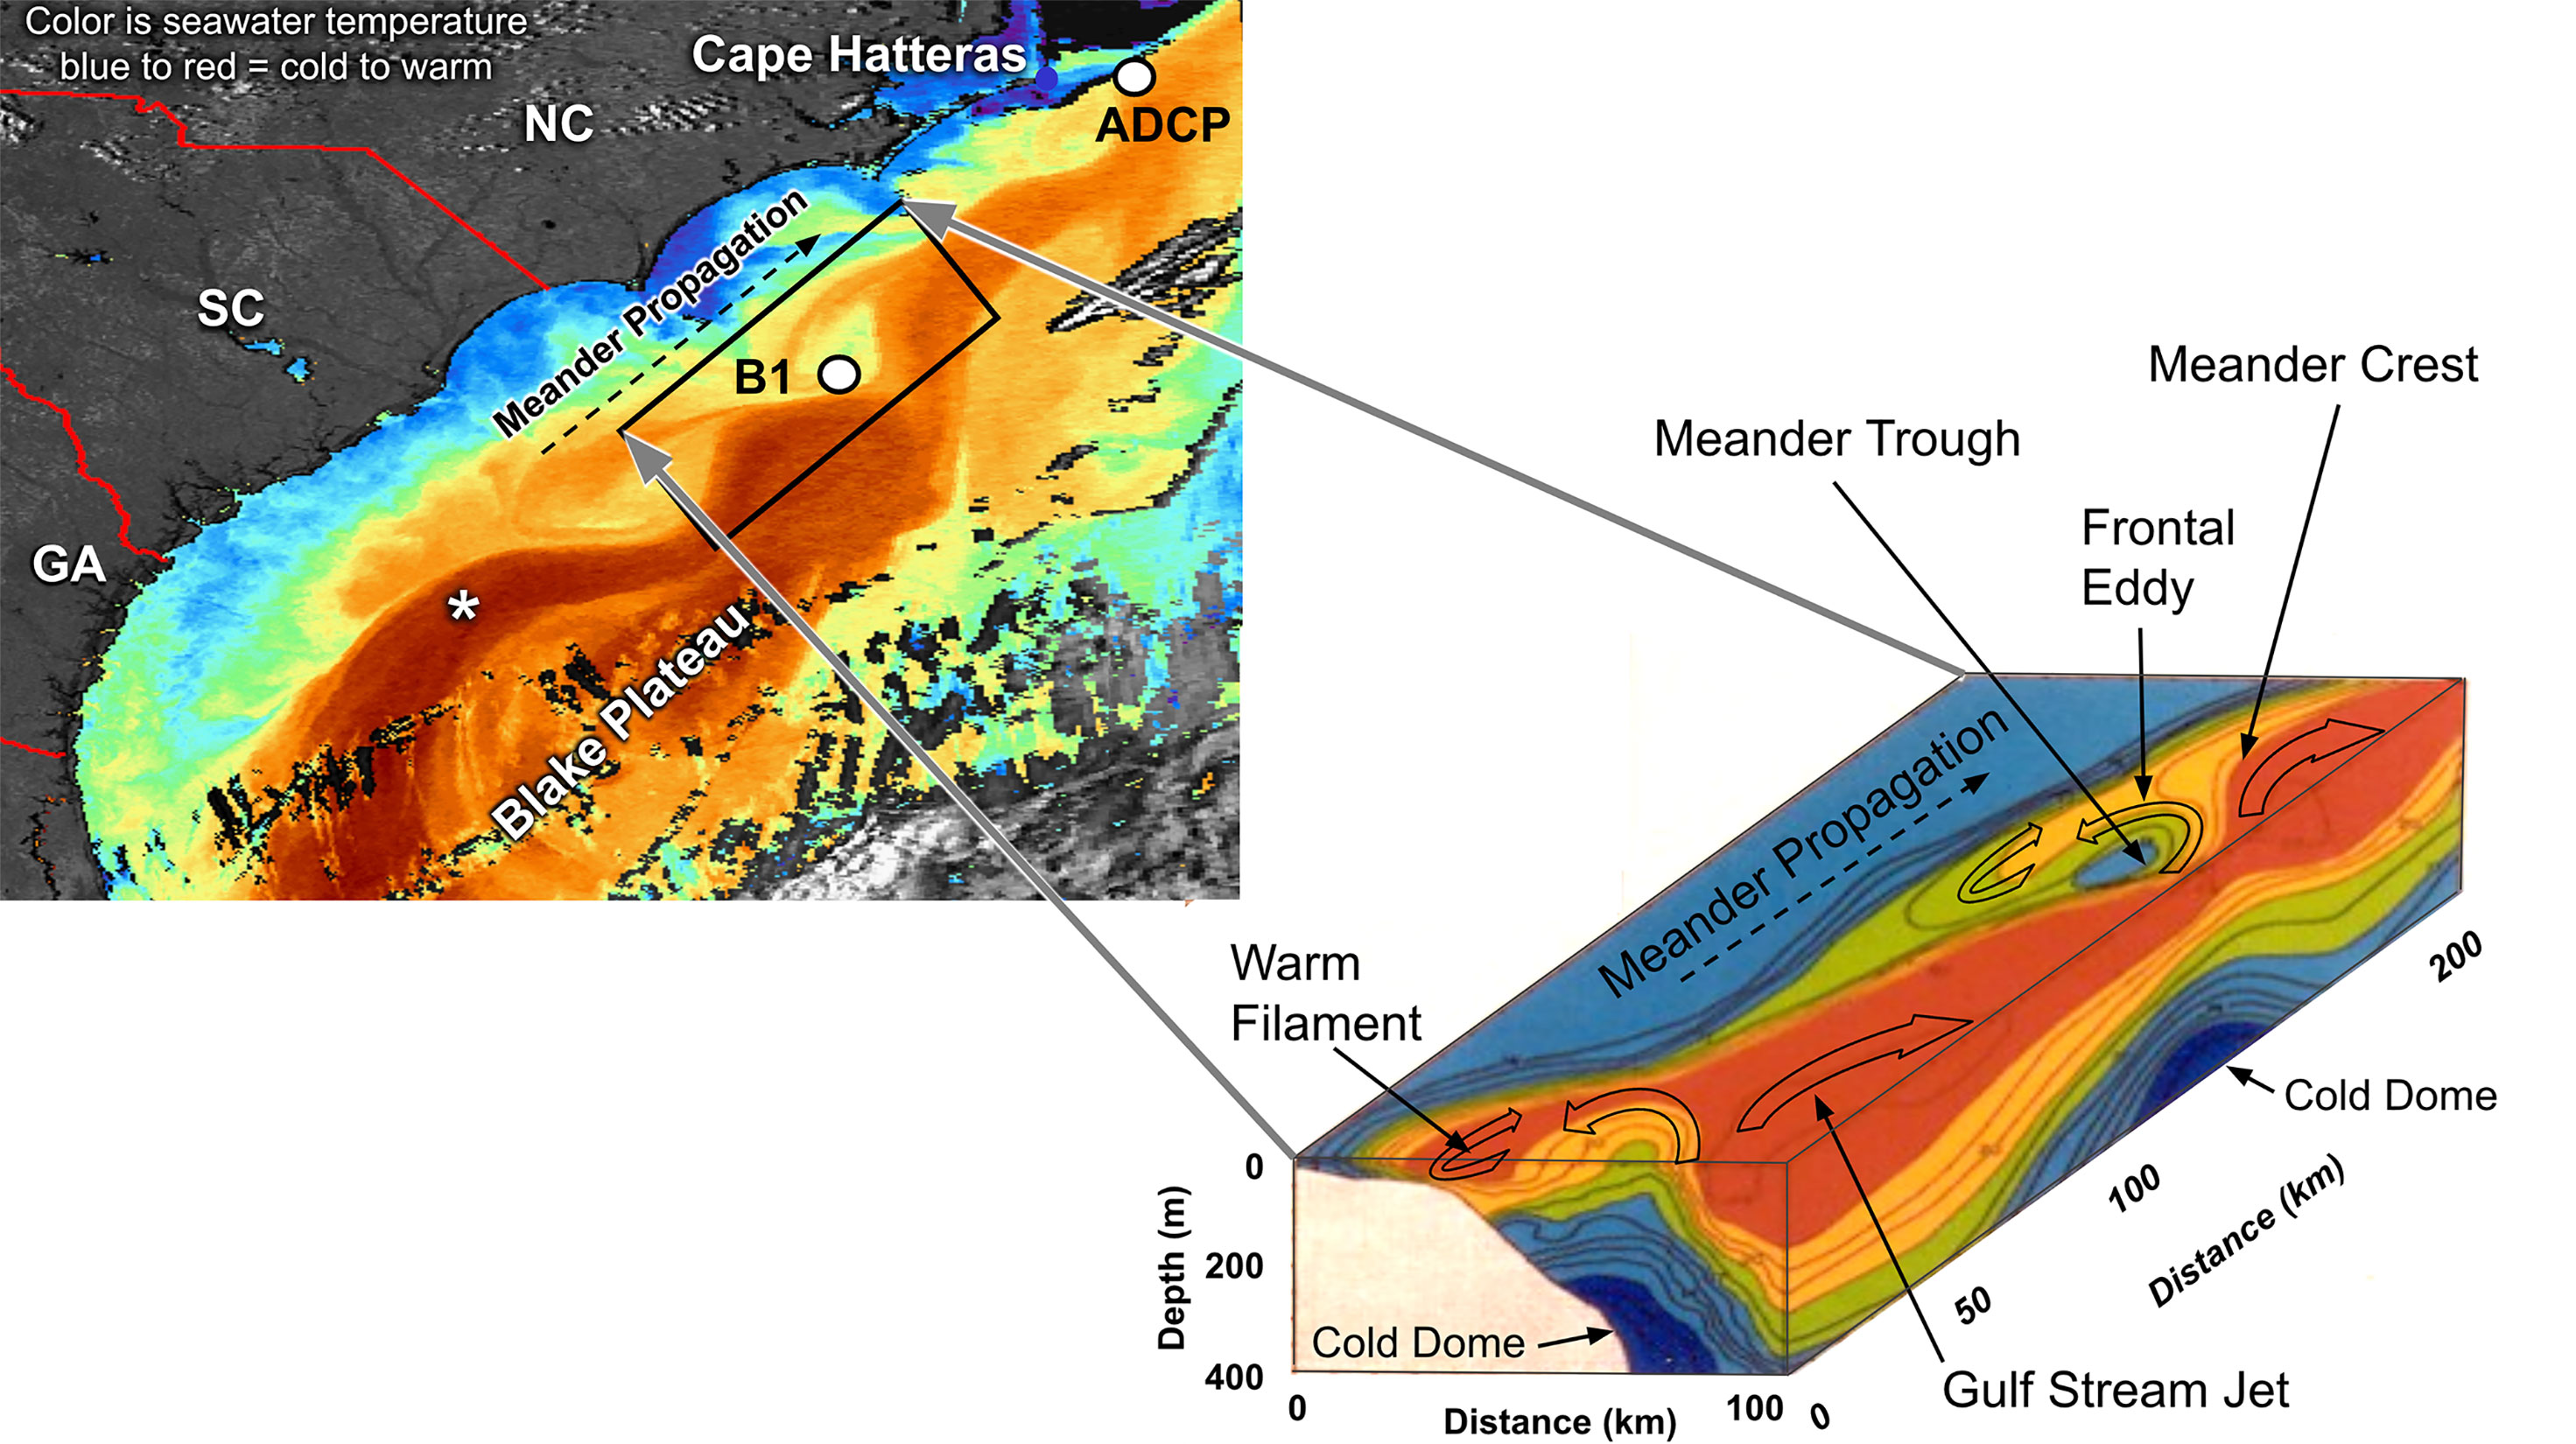
Figure 1 Gulf Stream meander SST image (upper left) and associated 3-D volume view of meander features annotated (lower right). The location of mooring B1 (from Bane et al, 1981) is shown. Observed temperature and velocity time series from this mooring are shown schematically in Figure 2. The white asterisk shows the center of the area known at The Charleston Bump. The Blake plateau is the relatively level bathymetric region beneath and offshore of the Gulf Stream, and extending from the lower frame of this image northward to just offshore of Cape Hatteras.
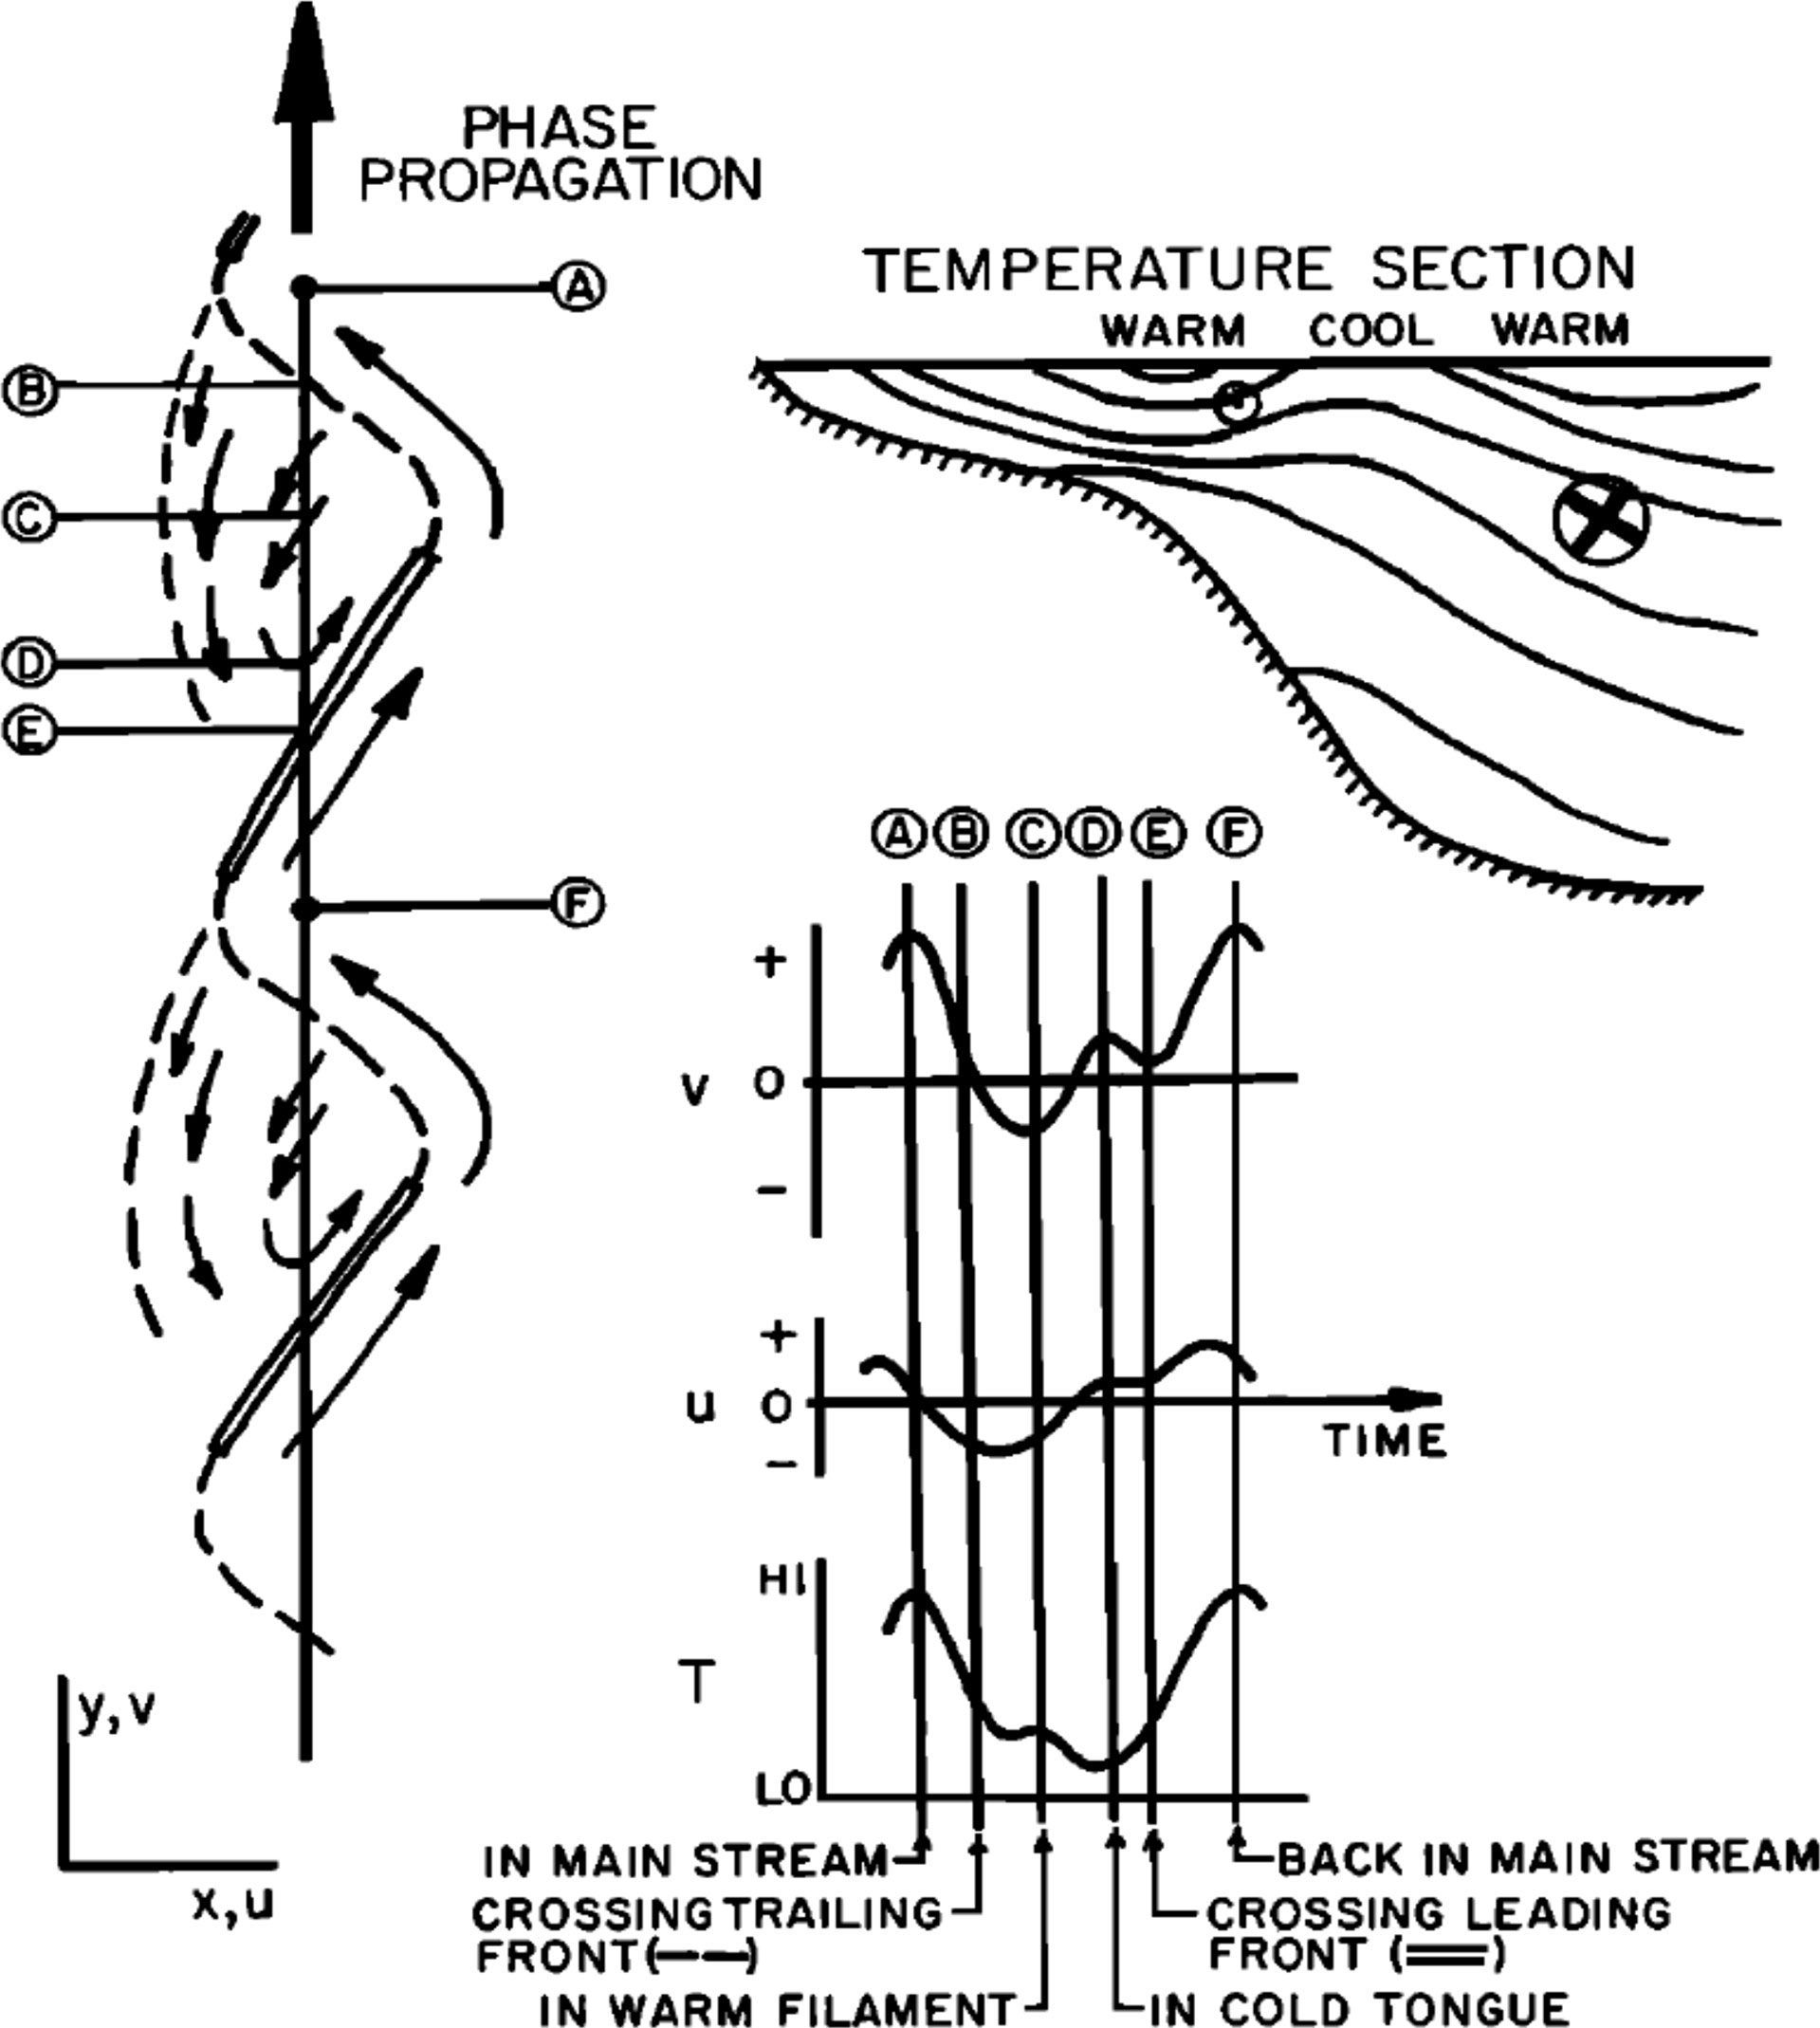
Figure 2 Schematic meander structure and currents based on measurements made at location B1 shown in Figure 1 and reported by Bane et al. (1981). The time series show alongstream (v) and cross-stream (u) velocity components and temperature (T) as a meander passes location B1.
This paper presents observations that investigate GS meander properties and propagation offshore of Cape Hatteras by combining current measurements from a moored Acoustic Doppler Current Profiler (ADCP) with high frequency radar (HFR) surface current measurements and satellite Sea Surface Temperature images (SSTs) during November 2014. The ADCP measurements provide well-resolved current observations throughout most of the water column, while hourly surface current measurements from HF radars and available satellite SSTs provide spatial context to the GS orientation, meander propagation, and circulation in the region of the ADCP mooring. Together, these observations provide new insights about meander propagation and evolution in this important transition region.
2 Background
Investigation of GS meander propagation has a rich history, with GS variability being recognized as far back as the sixteenth century (see Brooks and Bane, 1983). Meander evolution has been studied extensively both north and south of Cape Hatteras (Savidge, 2004). Upstream of Cape Hatteras, the GS is deflected seaward between 31° and 32 ° N latitude by the Charleston Bump (Brooks and Bane, 1978), a prominent topographic high on the Blake Plateau where water depth decreases from more than 700 m to less than 375 m (Figure 1) (Sedberry, 2010). Previous investigations have shown the deflection is bimodal, with both strongly and weakly deflected states typically occurring in the Fall/Winter and Spring/Summer, respectively. Both have been shown to have a significant downstream impact on Gulf Stream variability. Meanders when the GS is strongly deflected have periods between 14 and 20 days, with weakly deflected meanders having 4-8 day periods (Bane and Dewar, 1988). Meander lateral amplitudes are typically greatest (~50 km) at the initial deflection, and decrease downstream to a minimum of about 10 km at Cape Hatteras (Miller, 1994). Typical meander wavelengths are 100-250 km, with propagation speeds of 20-60 km/day (Brooks and Bane, 1981; Bane and Dewar, 1988). Both baroclinic (Oey et al., 1992) and barotropic processes contribute to meander growth and decay (Luther and Bane, 1985; Dewar and Bane, 1985; Gula et al., 2014), with energy exchanged between meanders and the mean flow (Kang and Curchitser, 2015) and lost by internal wave formation and near-bottom mixing (Todd, 2017).
Near Cape Hatteras, the GS leaves the continental margin and transitions from a topographically steered western boundary current to a free jet flowing in water depths that increase from 2000 m to 4500 m between 73° and 68° W. Some meanders increase in lateral amplitude to 100 km or more, and have periods of ~100 days. Propagation rates increase from about 14 km/d for longer periods and wavelengths of about 33 days and 460 km, to 45 km/d for shorter 4-day 180 km meanders (Tracey and Watts, 1986). In the region offshore of Cape Hatteras, the Deep Western Boundary Current (DWBC) passes beneath the GS, potentially contributing to meander growth (Dewar and Bane, 1989).
A depiction of 3-D meander structure along the Carolina coastline, derived from aircraft-launched expendable bathythermographs, is shown in Figure 1 (adapted from Bane et al., 1981). Note the asymmetry of the meander crests and the associated skewness in the deepening of the warm isotherms as the meander crest propagates to the northeast. The deepening of the isotherms is analogous to the deepening of higher current speeds that also accompany the meander propagation.
The cool water in the meander trough, the “cold dome”, is indicative of the upwelling that occurs in frontal eddies that form there and highlights the biogeochemical importance of these “nutrient pumps” (Yoder et al., 1983; Glenn and Ebbesmeyer, 1994a). A GS filament, which can form at a meander crest and is typically less than 100 m deep (Bane et al., 1981), is one mechanism for warm saline GS water to be advected onto the continental shelf.
Previous studies suggest GS variability upstream should affect downstream variability (Vazquez and Watts, 1985). Frontal eddies upstream of Cape Hatteras have been shown to propagate intact through this transition region by Glenn and Ebbesmeyer (1994b), without explicitly demonstrating the same for their accompanying meanders. The observations presented here provide evidence for meander propagation past Cape Hatteras, and thus suggest the importance of understanding their contribution to downstream variability.
3 Observation Methods
Three types of observations made during November 2014 were used to observe GS meander evolution in the focus region (Figure 3): ADCP current measurements from a bottom mooring east of Cape Hatteras, HFR surface currents from the land based Southeast Coastal Ocean Observing Regional Association (SECOORA) network, and satellite SST images from the Rutgers University Coastal Ocean Observing Lab. ADCP and HFR data were quality controlled to Integrated Ocean Observing System (IOOS) standards (Integrated Ocean Observing System, 2021).
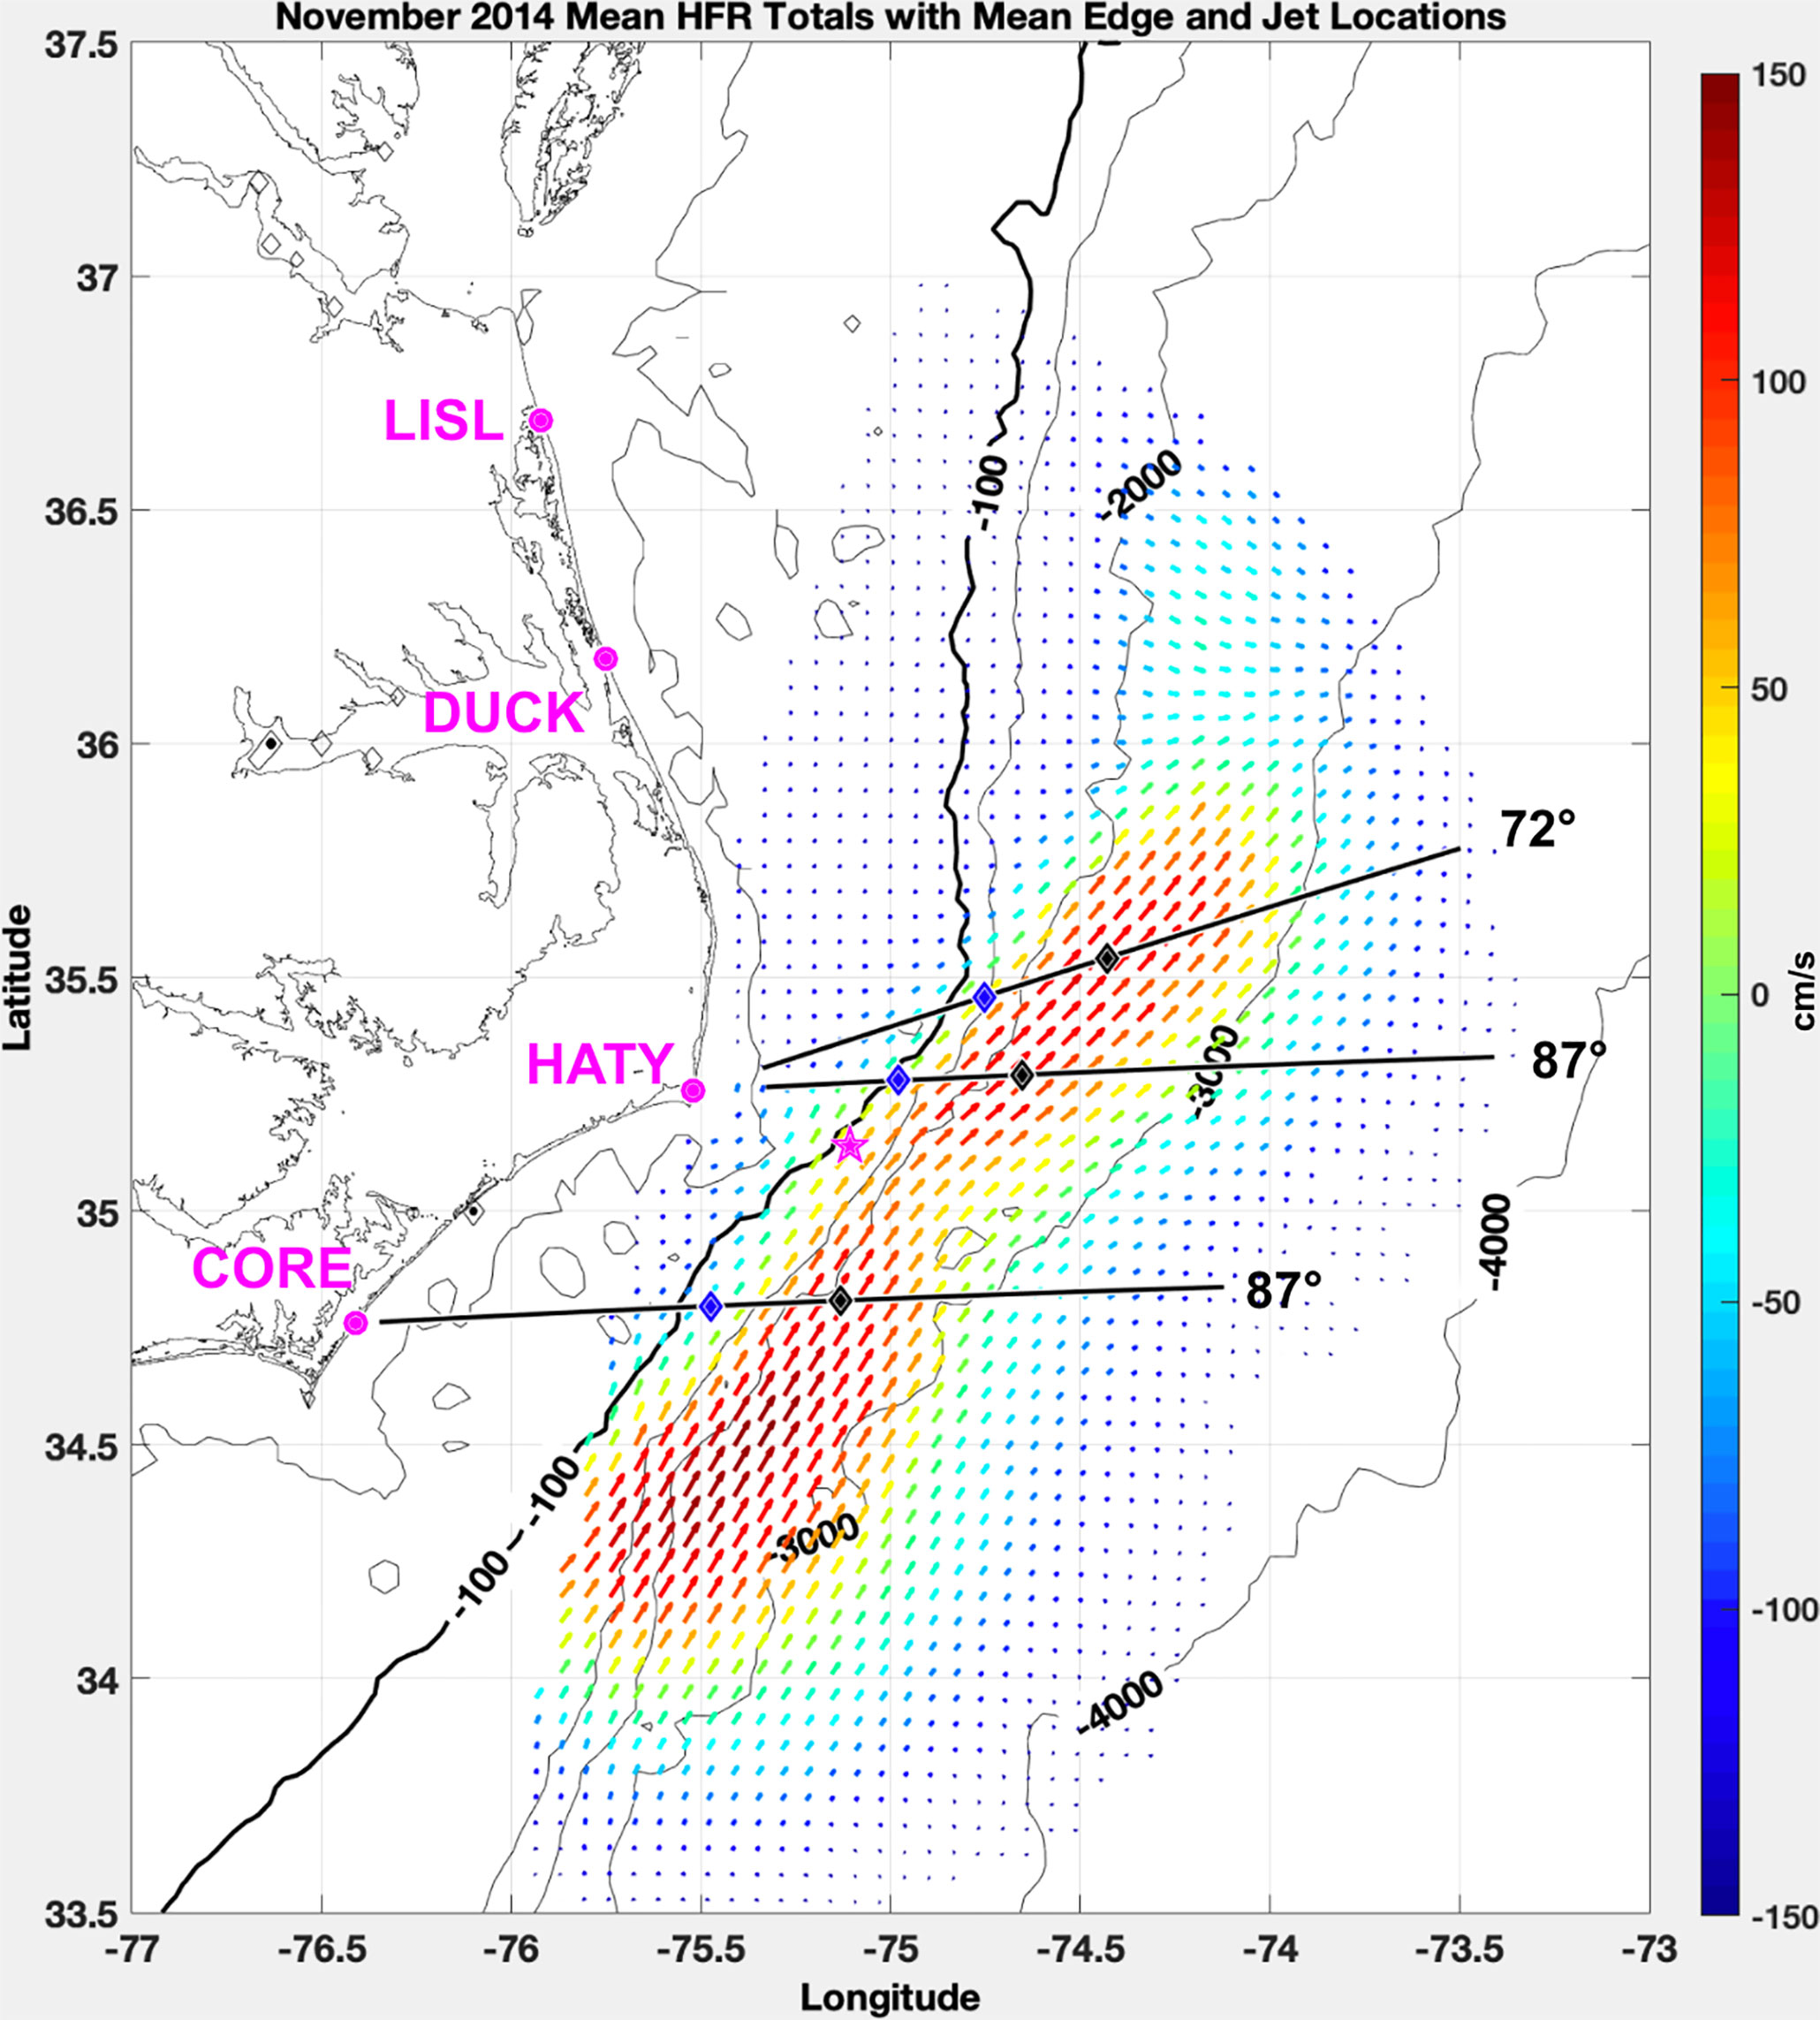
Figure 3 A map of the study focus region. ADCP mooring is the pink star just offshore of the 100 m bold isobath. Land-based HF radars are located at the pink dots with their 4-letter identifiers. Mean GS edge and jet positions at blue diamonds and black diamonds respectively, along select HFR bearings from CORE and HATY for November 2014. The colored vector field shows the mean total surface current speeds from the radar network for November 2014.
The ADCP mooring was maintained on the upper continental slope east of Cape Hatteras at 35.2°N and 75.1°W in a water depth of 260 m. The mooring contained a 150 kHz Teledyne Sentinel ADCP. The ADCP measures currents with 4-m vertical resolution over most of the water column every ten minutes, excluding only the bottom 8 m, and top ~28 m. The 10-minute measurements were hourly averaged. The ADCP currents were rotated into a streamwise coordinate system such that the downstream direction was the depth-averaged and time-averaged velocity direction over the entire monthly record: 40°clockwise from True North in this case. The positive cross-stream direction (90°clockwise from the downstream direction) is nearly cross-isobath and offshore. Details of the mooring are further discussed in Muglia et al. (2020).
Hourly surface current measurements in the top 2.7 m of the water column, made from a land-based HFR network of 5 MHz Codar Ocean Sensors radars, were used to provide more frequent observations over a greater spatial region, thereby giving more context for surface processes than was available by satellite SST imagery alone (Roarty et al., 2010). Total surface currents are vector sums of radial surface current observations from four HFRs located on the Virginia and North Carolina coast. These consistently measure surface currents along the NC coast and provide measures of the GS as it transitions from a topographically-steered boundary current to a free jet. HFRs in the IOOS are given four letter identifiers: LISL is located in Little Island Park in Sandbridge VA, DUCK is at the Field Research Facility in Duck NC, HATY is located in Buxton NC on the north side of Cape Hatteras, and CORE is on the Core Banks of NC north of Cape Lookout at the National Parks Service’s Great Island Campground. This study uses the HFRs to determine (1) GS position and width and orientation of the GS surface jet with individual radars, and (2) total surface currents from the combined HFR network on a 5.85 x 5.85 km grid. Radar and algorithm details are provided in Muglia et al. (2022). The method identifies hourly and mean locations of the GS edge and jet axis relative to the ADCP using radial velocities from individual monostatic HFRs HATY and CORE (Figure 3). The method was also used to estimate meander phase speed from several of the HFR currents over the entire time series. This average was derived by selecting the same prominent meander features in HFR currents six hours apart, and measuring distances between them on November: 7th from 12:00 to 18:00, 20th from 12:00 to 18:00, 27th from 00:00-06:00, and 30th 12:00-18:00. Estimates were 25.4 km/day, 55.2 km/day, 85.4 km/day, and 37.0 km/day, respectively. The reader is referred to Muglia et al. (2022) for a detailed explanation.
Satellite SSTs were provided courtesy of the Rutgers University Coastal Ocean Observing Lab (Rutgers Coastal Ocean Observing Lab, 2021). Products used for this work include the satellite sea surface temperature imagery collected from the National Oceanic and Atmospheric Association (NOAA) Advanced Very High Resolution Radiometer (AVHRR) and Terra Moderate Resolution Imaging Spectroradiometer (MODIS).
4 Results
4.1 November 2014 Overview
The hourly HFR and ADCP current measurements provide consistent characterization of the current environment off Cape Hatteras during November 2014. This month was chosen because of the concurrent availability of the observations presented and the higher quality of the HFR surface currents and GS estimates from them. It is informative to first characterize the GS environment during the month by exploring mean monthly surface currents, algorithm estimates of GS position and variability, and frequency and nature of GS meander events. With that foundation, the character of specific meander passages is determined by integrating available SST’s, HFR surface currents, and ADCP current measurements throughout the water column.
HFRs provide consistent estimates of GS position and orientation, meander propagation, and circulation in the region of the ADCP mooring. Figure 3 shows the November 2014 mean positions of the GS edge and jet axis along the three bearings closest to the ADCP mooring – one from CORE and two from HATY. The GS method selects the GS edge at the largest gradient in radial velocity, and the jet axis at the location of the maximum radial velocity along selected bearings. The CORE 72° bearing estimates are not included because of their high uncertainty caused by the estimates being made at great distance from the radar. Note that the ADCP, the red star offshore of the bold 100 m isobath in Figure 3, lies approximately along the same isobath as the upstream HFR mean GS edge locations where lateral shear in the cyclonic shear zone of the GS is greatest.
Monthly mean surface currents measured by the radar at the location of the ADCP are 0.8-0.9 m/s due to frequent GS incursions over the mooring (Figure 3).
The distribution of the algorithm’s GS edge and jet axis picks (Figure 4) relative to the ADCP demonstrate the variability caused by frequent meander passages at the mooring. The frequent incursions of the GS edge landward of the 100 m isobath (Figure 4) along the HATY 87° bearing may explain the large mean current speeds near the ADCP (Figure 3).
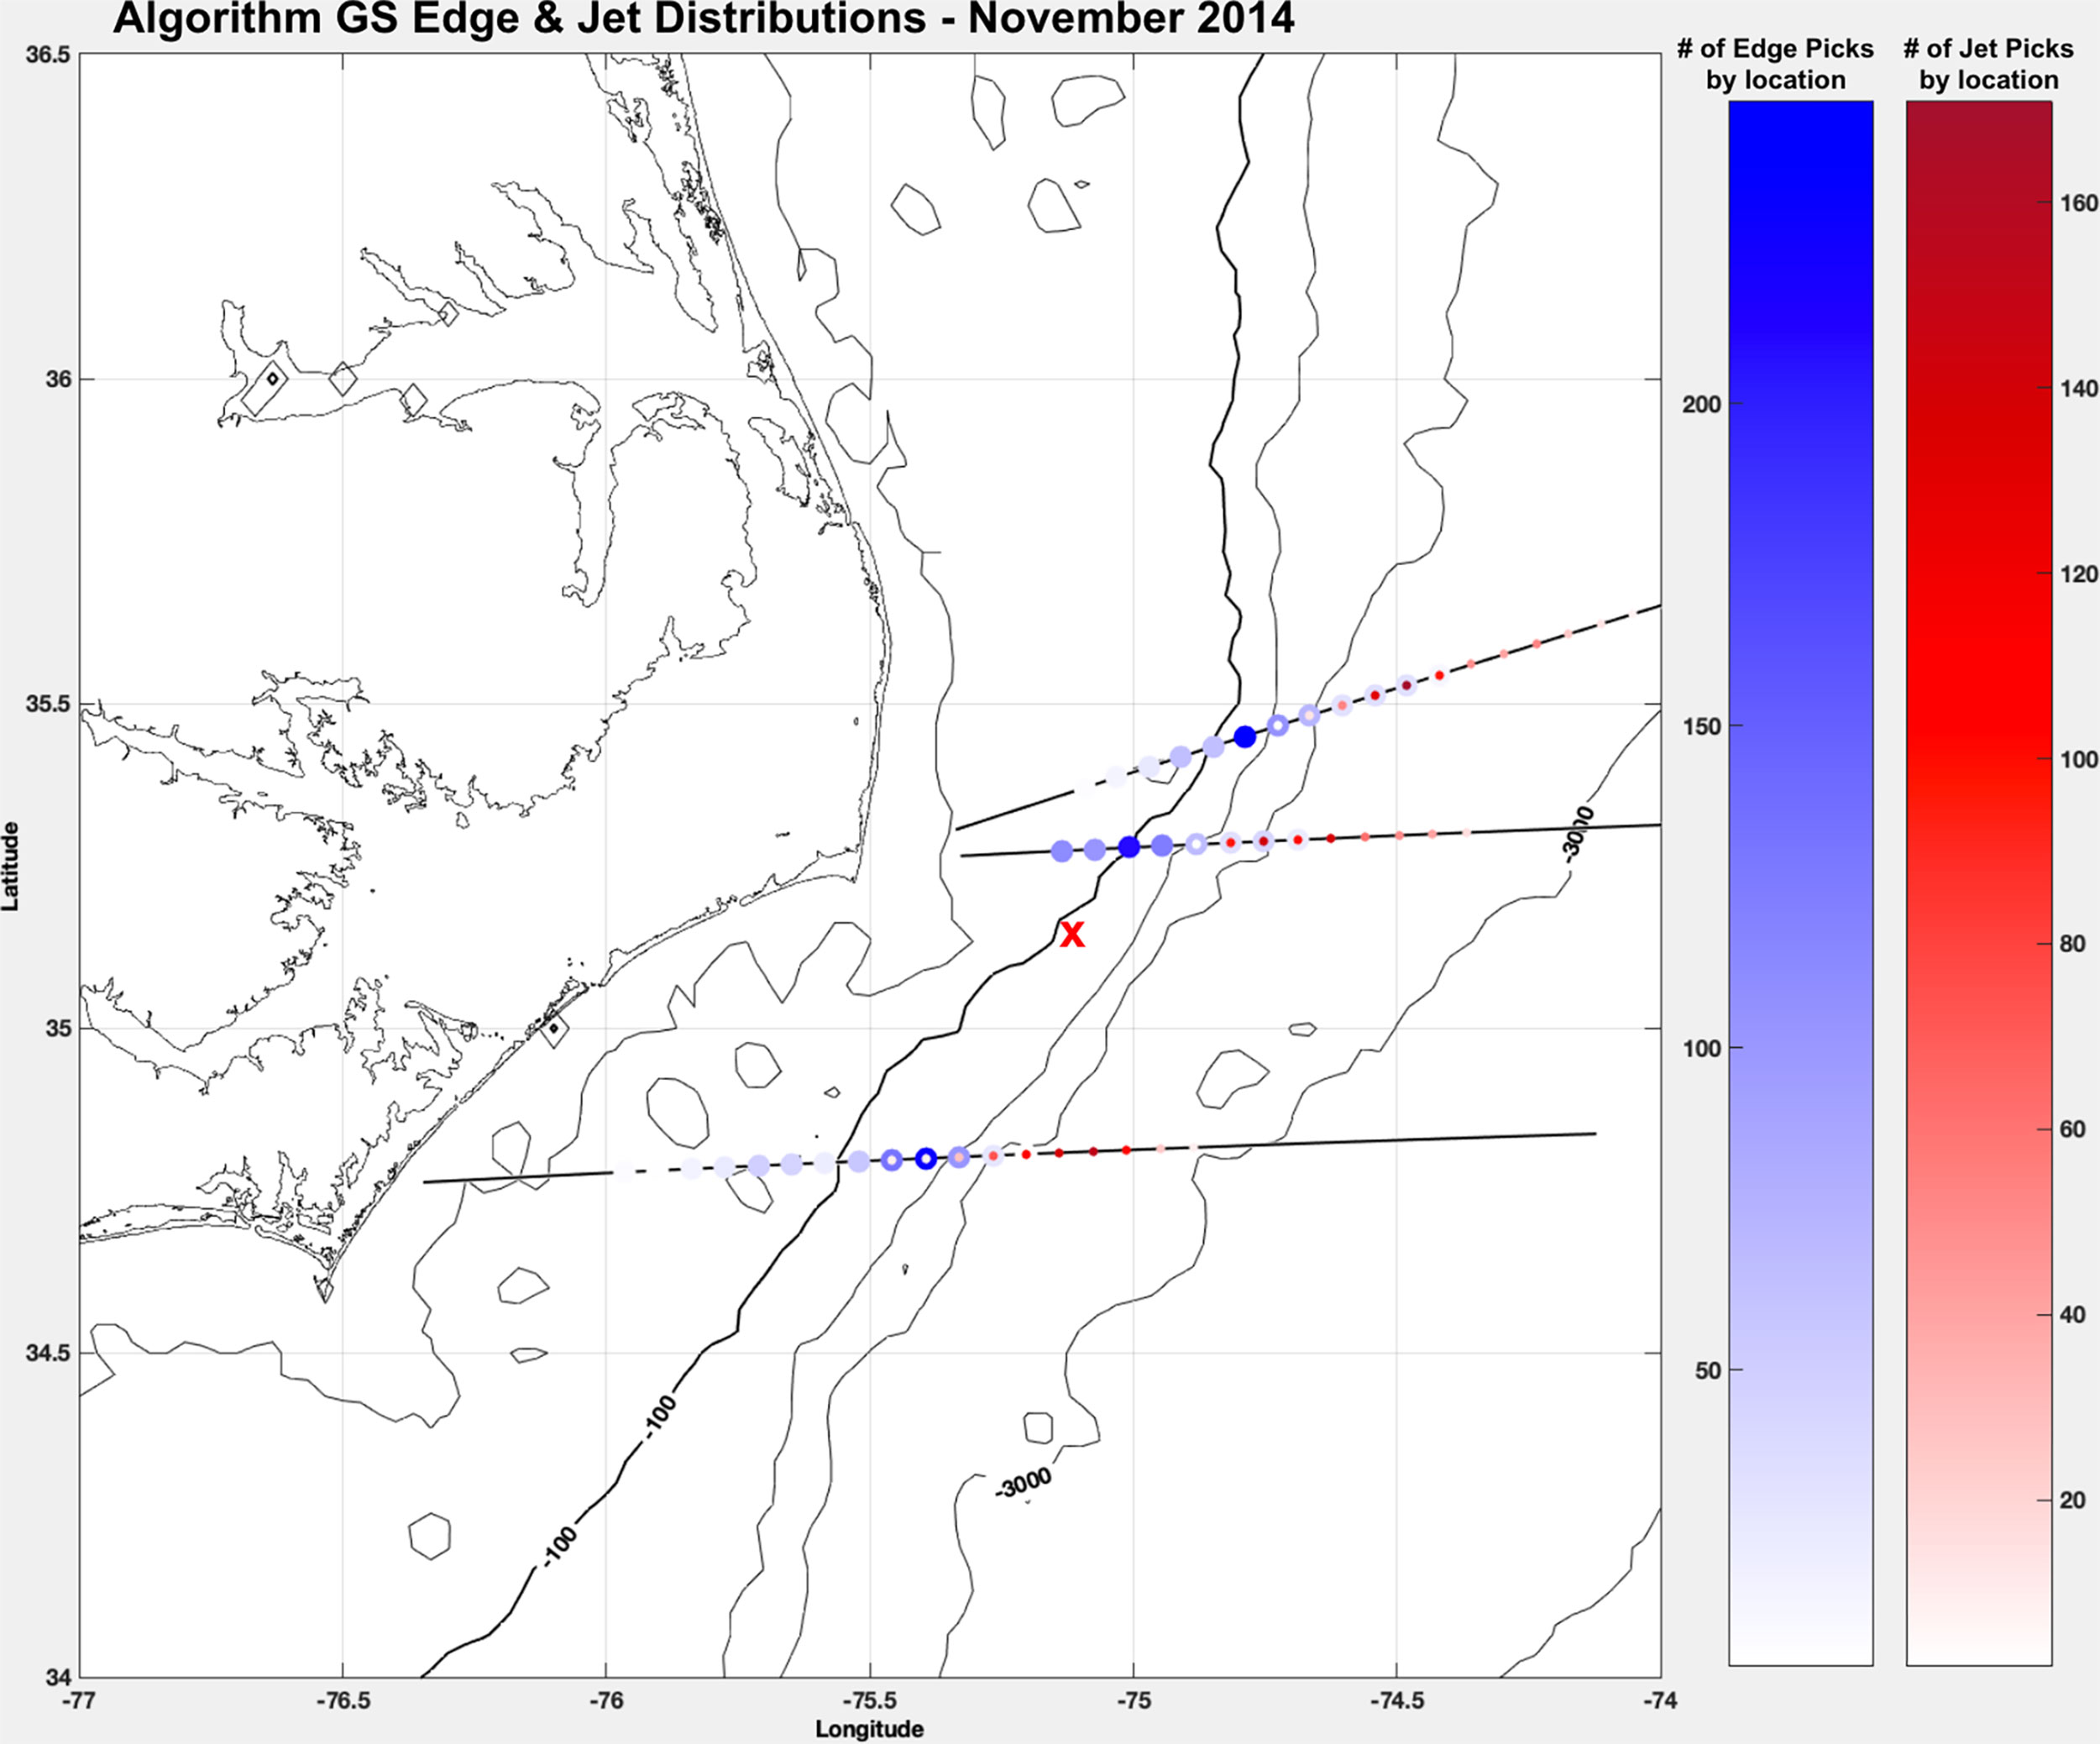
Figure 4 The GS edge and jet location distributions from the algorithm for select CORE and HATY bearings during November 2014. The edge (jet) distributions are shown with blue (red) colorscale. The ADCP is located at the red ‘x’.
Meander passages, identified as variations in GS edge and jet positions from the radar data near the ADCP, are apparent in the monthly time series of the ADCP downstream currents (Figure 5). Meander propagation over the mooring is recognizable in the alternating current increases, decreases, and occasional reversals. Deepening rapid downstream current in the water column indicates the approach of a meander crest, while decrease in downstream current indicates an approaching trough. Upstream-directed currents are the likely result of frontal eddy circulation in meander troughs (Bane et al., 1981; Glenn and Ebbesmeyer, 1994b). The skewness mentioned previously in the analogous deepening of warm isotherms with the meander passage in Figure 1 can now be seen in the deepening of higher downstream current velocities measured by the ADCP over the time period of a meander passage. Indeed, several meander events in Figure 5 are Eulerian depictions of a meander like that in Figure 1 propagating past the mooring.
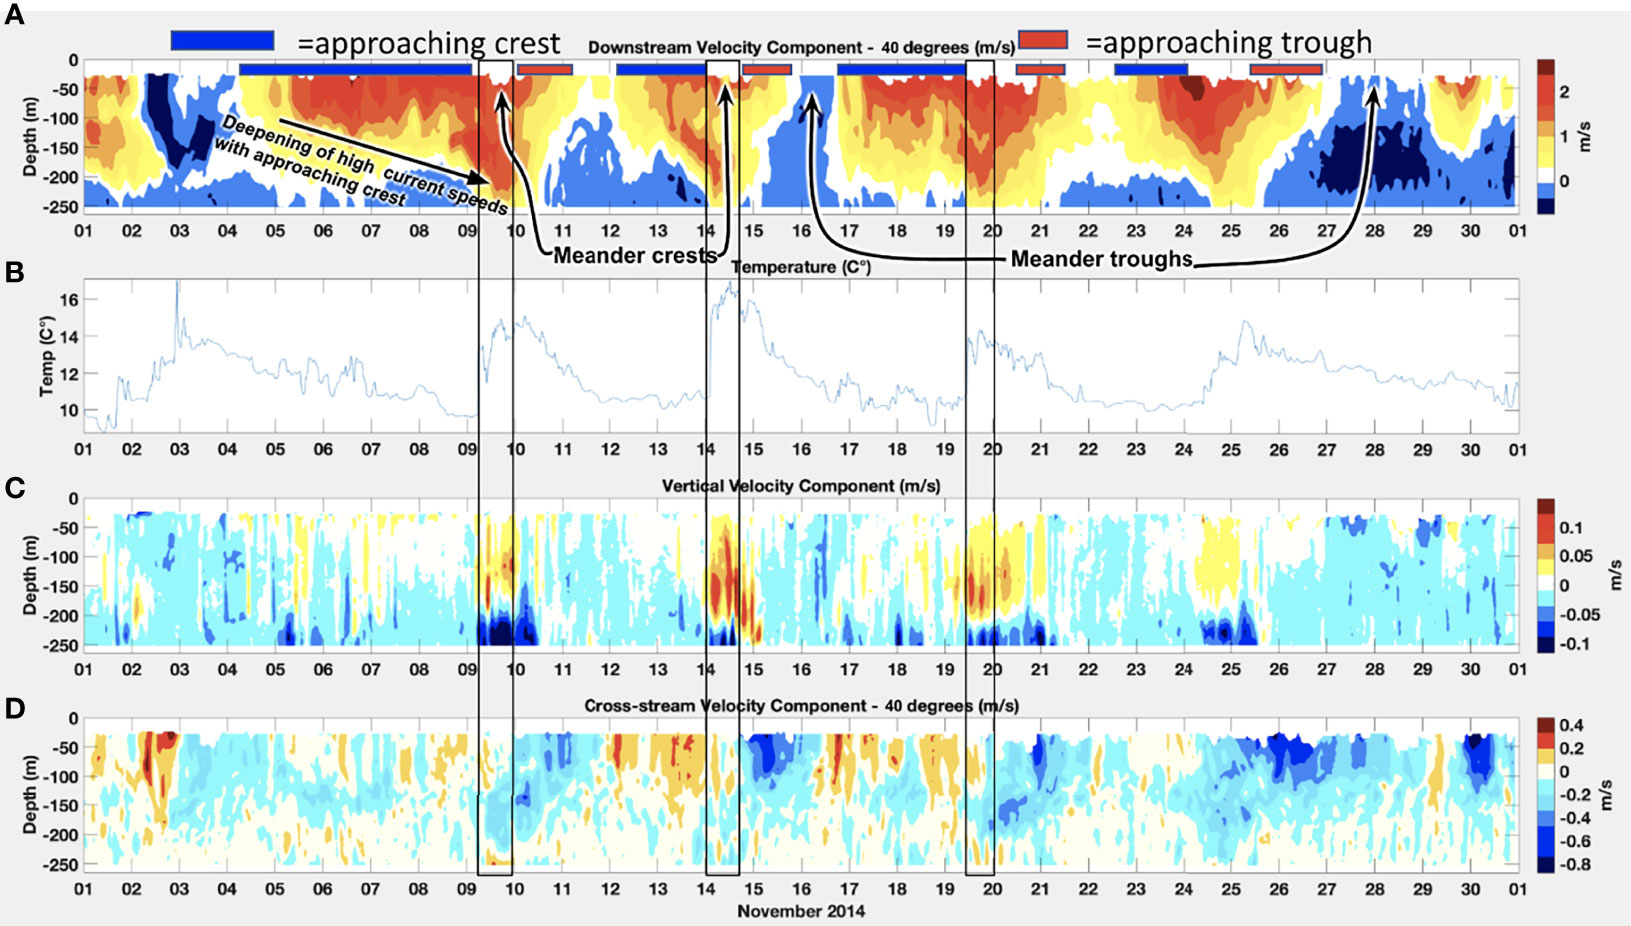
Figure 5 ADCP measurements range limited to ~40 meters below the surface: downstream (A), bottom temperature in °C (B), vertical (C) and cross-stream (D) velocities in m/s. Three meander crests with similar characteristics are boxed. Positive downstream (cross-stream) velocity is northeastward (southeastward, or offshore).
The downstream current time-series from the ADCP contains five or six meander passages over the mooring, identified by downstream current increases followed by decreases. There are four prominent meander passages during the month. Meander periods are about 5-6 days. Where the downstream-velocity maxima are seen in the water column, currents reach 2.5 m/s, with current reversals sometimes in excess of 0.5 m/s (Figure 5).
4.2 Current Structure From the ADCP
The measured currents are well resolved over most of the water column and provide rich current and shear structure detail in the downstream, cross-stream and vertical directions. It is useful to examine these current components with corresponding bottom temperature variations at the mooring to gain understanding of meander evolution and identify similarities and differences between events (Figure 5). Examining the velocity components’ variability first is helpful to discern the more complicated associated shear profiles (Figure 6).
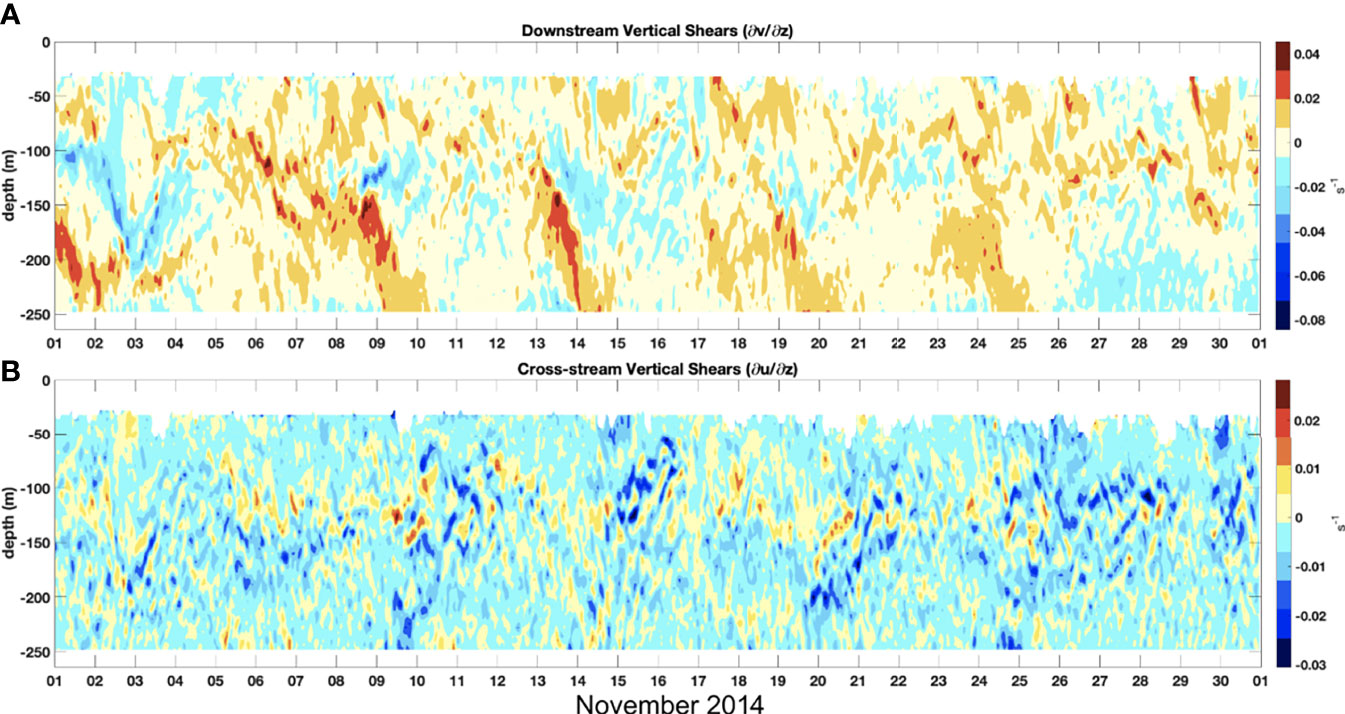
Figure 6 ADCP downstream  v/z) (A) and cross-stream (u/z) (B) vertical shears, with zero current/shear contours in black.
Several attributes appear repeatedly due to the alternating presence of meander crests and troughs over the ADCP. It is useful to explore the events that begin around November 5, 13 and 17 first. The changes that occur in the velocity components during these three events are consistent in character, and with the meanders depicted in Figure 1.
The transition time from trough to crest is greater than that from crest to trough, resulting in an asymmetry in the downstream velocity structure. Strong downstream currents occupy an increasing portion of the water column as a crest approaches, and a decreasing fraction as a trough approaches. The deepening of strengthening downstream velocities with approaching crests is often accompanied by an increase in upstream velocities near the bottom. The greater downstream velocities with the approaching crest that deepen beyond 100 m bifurcate, causing high currents near the surface, slower flow beneath them, and a second maximum in downstream flow in the lower 100 m around the 9th, 13th, and 19th (Figure 5).
Cross-stream flow is offshore as a crest approaches, and transitions to onshore after a crest passes and a trough approaches. Note that this transition to onshore flow occurs first at depths of ~100-150 m, about ~12-24 hours prior to the change near the surface, and that the onshore flow at depth coincides with the deepening of downstream currents and increase in temperature at the ADCP (Figure 5, events outlined). The increase in upstream currents near the bottom with an approaching crest are often accompanied by onshore currents in the same region. Low bottom temperatures at the mooring, within the base of a cold dome, usually correspond with offshore flow in the top ~100 m of the water column, although offshore flow persists during the large increases in bottom temperature at the mooring that usually lead the transition to onshore flow following the passing trough.
Vertical velocities are generally small (~1 cm/s) except during the passage of a meander crest, when large vertical velocities (~10 cm/s) occur. From the surface to 200 m depth, the vertical currents are upward, while below 200 m they are downward. These large vertical velocities are coincident with the very abrupt arrival of warm (~15 C) water at the bottom, indicating the trailing edge of the cold dome of the frontal eddy is a strong thermal front.
Events at the beginning and end of the month, as well as the approaching crest on the 23rd have several aspects that differ from the three events that begin on the 5th, 13th, and 17th. The event from November 1st-4th is perhaps most dissimilar. Unlike the other crest-to-trough transitions discussed, large downstream currents persist at depth until the 2nd when the strongest upstream velocities occur in the upper 100 m, deepen, then slowly subside in the top 100 m while increasing at depth between 100-200 m. Also in stark contrast are the deepening upstream currents that coincide with the highest spike in temperature at the instrument. The bottom temperature increase is more gradual and vertical currents are limited. And, just before November 3rd the highest offshore currents of the time series, about 40 cm/s, coincide with the largest upstream velocities (Figure 5).
The increase and deepening in downstream current on November 23rd are accompanied by an increase in temperature at the mooring like the other events, but the depth profile of the high downstream currents is more symmetric over time. The switch to onshore currents occurs earlier during this event, coinciding with the increase in downstream flow, and like the other three events leads at depth before occurring in the top 100 m. Warming of bottom temperatures is less abrupt than for the events described earlier, and vertical currents are present but weaker than in the other events. The increase and deepening of the large downstream current on the 30th are much shallower, and thus results in little temperature increase at the mooring and no strong vertical currents. Rather than meander propagation along isobaths, the crest may be moving somewhat offshore in this instance.
4.3 Vertical Current Shear Structure From the ADCP
Having described the vertical structure of the current, it is informative to examine the shear profiles that result, in particular, the vertical shear of the downstream current v/z, called downstream shear) and the vertical shear of the cross-stream current (u/z called cross-stream shear). Again, it is helpful to begin by considering the three similar events that begin on the 5th, 13th, and 17th, prior to exploring the events that differ. In all three, the deepening of the higher velocity current that occupies a greater portion of the water column during the meander crest approach is accompanied by deepening positive downstream shear from November 5th-10th, 12th-15th, and 17th-21st. The previously mentioned bifurcation in the deepening higher velocities causes associated positive shears near the surface that approach 0.02 s-1. These then change to negative shears of the same magnitude beneath them, and return to positive shears below 100 m, sometimes reaching magnitudes of 0.04 s-1 (Figure 6). The largest shears observed during the time series accompany these events, and are all deeper than 100 m. The corresponding cross-stream shears also alternate from close to zero or negative near the surface, to positive, and back to negative again at about the same depth as the alternating downstream shears. The positive cross-stream shears near the middle of the water column are some of the highest during the time series, often approaching 0.02 s-1. Although there is an apparent deepening of the positive cross-stream shear that accompanies the deepening downstream current with an approaching crest, the shear structure is often intricate, with shear profiles that can alternate from positive to negative up to six times over the water column as was the case on the 14th.
Decreases in downstream velocities, occasional reversals, and increasing onshore cross-stream currents that coincide with approaching troughs typically exhibit an increase in the proportion of the water column with negative shears. The troughs on November 11-12th, 16th, and 22-23rd are examples. The flow reversal on November 16th results in negative downstream shear over much of the water column. The shoreward velocity on the 16th produces more negative cross-stream shears over much of the water column that are still interleaved with positive shears (Figure 6).
The event at the beginning of the month, from November 1st-4th, that differs from the others has a shear profile that is nearly opposite that of an approaching meander crest. The deepening of the upstream currents from November 2nd to the 3rd from the surface to depths of 100 m are accompanied by negative downstream shear along their leading edge. Between November 3rd and 4th, when downstream velocities are slightly positive in the top 100 m, and upstream between about 100-200 m, the downstream shear profile is negative at the surface, positive near 100 m, negative between ~125-200 m, and positive again near the bottom. Cross-stream velocities switch from offshore to onshore over most of the water column between November 2nd and 3rd, with a switch from positive to negative cross-stream shears over much of the water column happening on the 3rd (Figure 6).
4.3.1 ADCP and HFR: Meander Event 1
Exploring the meander propagation from November 4-11, henceforth Event 1 (Supplemental Material E1), the longest in duration of the three events with similar characteristics, within the spatial context of the HFR surface currents provides a broader understanding of the event. Unfortunately, high quality SSTs are not available during this period. E1 provides HFR surface current snapshots at 20:00 Greenwich Mean Time (GMT) each day, with the ADCP location appearing as a pink dot on the left image. The radar times were chosen to reduce nighttime ionospheric interference that tends to limit range (Menelle et al., 2008). Beginning November 2nd, the end of daylight savings time, the local time was GMT-5, or 1500 Eastern Standard Time (EST). The ADCP surface current speeds are included in the HFR image title, and the associated downstream ADCP current time series figure on the right contains a green vertical line at the time corresponding to the HFR figure. On November 4th near-surface current speed at the ADCP is 0.92 m/s, and an approaching crest is apparent in the ADCP downstream currents (Figure 5) but isn’t obvious in the HFR currents (E1). On November 5th, stronger downstream currents reach the ADCP, with surface currents increasing to 2.10 m/s, and deepening of the strong downstream currents in the water column. The meander crest becomes more apparent upstream of the ADCP in the surface current image (E1), but cross-stream currents are still small at the surface with offshore flow strongest at about 100 meters (Figure 5). On November 6th, strong downstream currents deepen with corresponding positive downstream shears at the velocity gradient and deepening onshore flow in the same region beneath 100 m (Figure 6). The meander crest is not prominent in the HFR image (E1), but ADCP near-surface speeds reach 2.10 m/s. The meander crest asymmetry is more visible in the radar currents on November 7th (E1). The ADCP near-surface speed is about 1.99 m/s, and strong positive shears are pervasive throughout the entire water column. Offshore flow exists in the region of strong downstream flow in the upper 100 m, with positive cross-stream shear at the base of the strong surface flow (Figure 6). On November 8th, again the crest is less prominent in the HFR surface currents (Figure 7 and E1). The upstream flow indicative of the approaching crest develops near the bottom. Late on November 9th, the deepest downstream currents approach the bottom, ADCP surface currents are 1.79 m/s, and the meander crest is more pronounced in the HFR surface currents (E1). Offshore flow at the surface continues almost until November 10th, but onshore flow indicative of the approaching trough begins beneath 100 m. Strong positive downstream shears deepen to the bottom of the ADCP coverage along the edge of the strong downstream flow associated with the crest, and some of the strongest shears of the time series appear around 100 m.
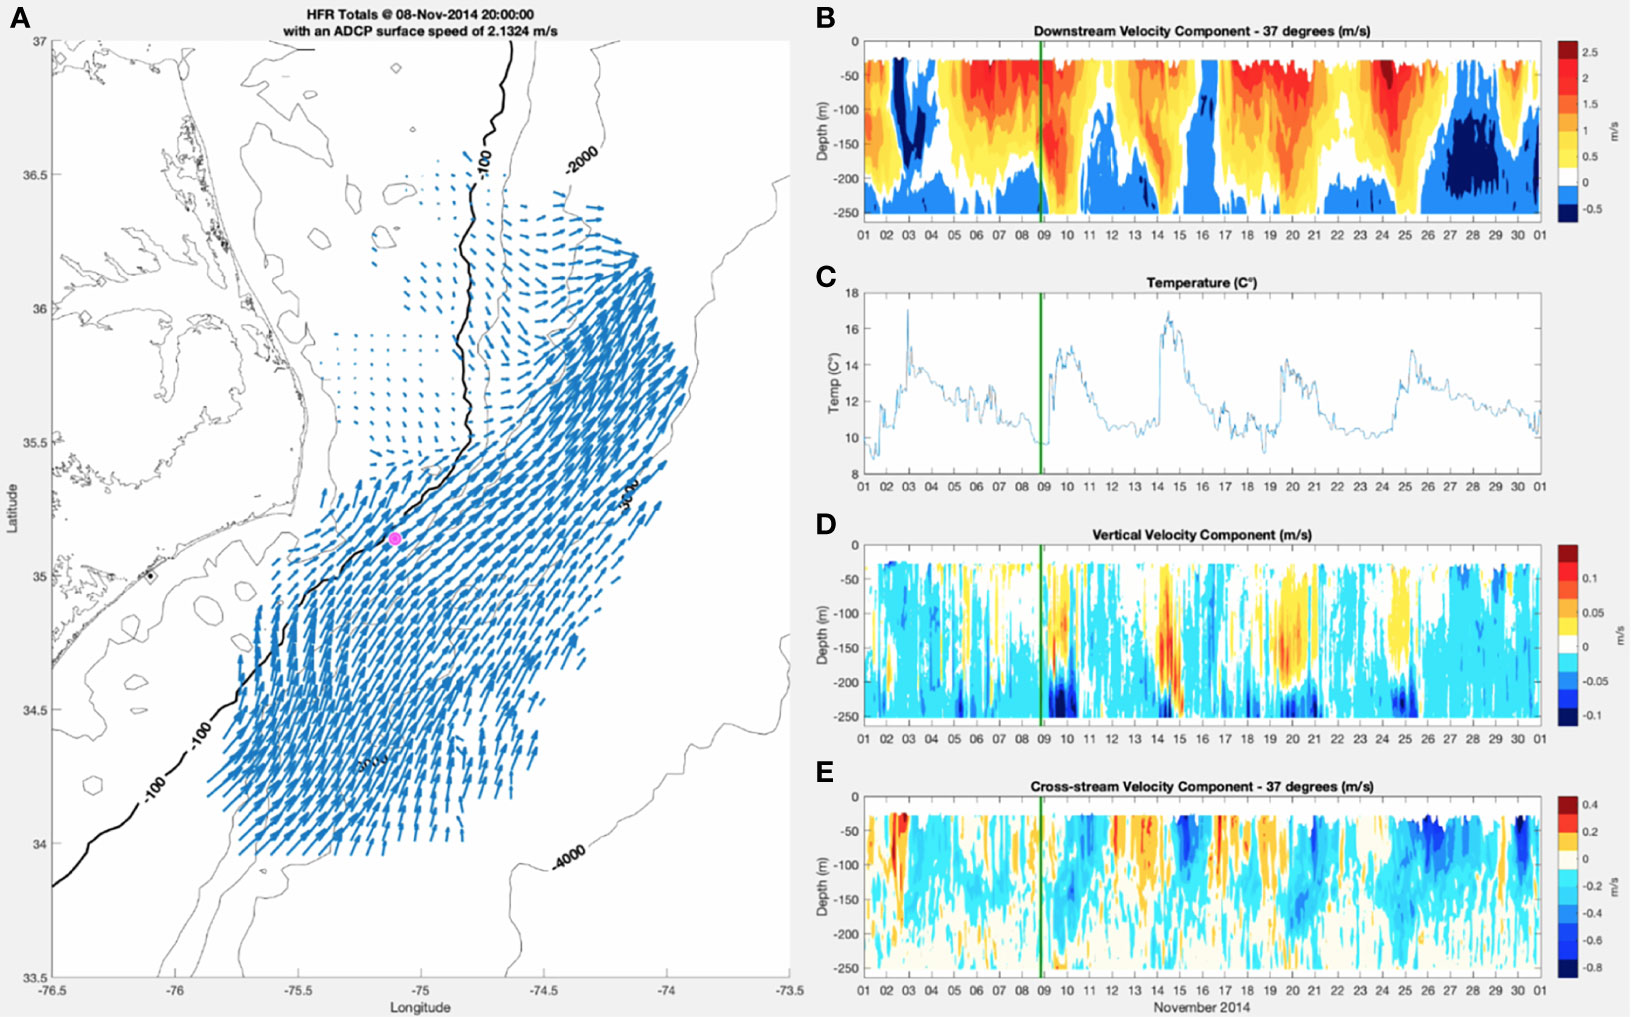
Figure 7 Left: HFR surface currents (A) on November 8 at 20:00 GMT, with ADCP location at red asterisk, Right: ADCP downstream velocity contour (B), bottom temperature (C), vertical velocity contour (D), and cross-stream velocity contour (E), with green vertical line at November 8 at 20:00 GMT. See Event_1_.m4v for movie of meander passage from November 4 at 20:00 GMT to November 11 at 20:00 GMT.
On November 10th (E1) onshore currents shoal throughout the top 100 m and mark the passage of the meander crest over the mooring. Surface currents are still 0.99 m/s but are subsiding. Finally, on November 11th (E1), the trough with accompanying strong onshore currents in the upper 100 m is over the mooring. Although the trough is prominent in the radar surface currents, there isn’t reversal of the downstream flow in this case. Thus, either the center of the frontal eddy is onshore of the ADCP location or the frontal eddy is too weak to reverse the flow direction. Currents in the surface ADCP bin subside to about 0.76 m/s.
4.3.2 ADCP, HFR, and SST: Meander Event 2
What appears as a less developed meander event at the end of the month, November 26-30 at 18:00 GMT daily, henceforth Event 2 (Supplemental Material E2) in the downstream ADCP velocities is compelling to examine because all three types of observations are available. It includes pronounced cyclonic circulation and significant convergence in the HFR surface currents, and quality SST images on two of the days.
The spatial context provided by the SSTs and HFR currents provide insight not available from the ADCP observations alone. Beginning on November 26th, with the end of the meander crest passage at the ADCP, a large trough appears in the HFR currents southwest of the mooring with strong convergence at the southwest edge of the trough apparent in the surface currents near the 100 m isobath (Figure 8 and E2). There is well established onshore flow, positive downstream shears, and negative cross-stream shears throughout most of the water column at the mooring (Figure 6). On November 27th, upstream currents begin to increase from the bottom to about 100 m below the surface. Shoreward flow over the entire water column is indicative of the approaching trough over the ADCP as seen in the HFR currents (E2). On November 28th, the trough is much less prevalent in the radar currents (E2). Strong shears develop at about 100 m in both the downstream and cross-stream velocities, where some shoaling of small offshore currents meet onshore flow there (Figure 6). The HFR currents from November 27th-29th appear to show the mooring at the edge of a trough which subsides as a couple of small wavelength features propagate past it, such that on November 29th the mooring is again on a crest edge (E2). The deepening in downstream currents on November 29th, and switch to offshore currents throughout much of the water column are also indicative of a crest over the ADCP as discussed in the other meander events (Figure 6). On November 30th, the crest appears to propagate downstream in all observations. Onshore currents appear at the ADCP late on November 29th at depth, and surface and increase on the 30th. Upstream currents begin to shoal from below (Figure 6). HFR currents (E2) indicate an approaching trough, and two SST images 3.5 hours apart (Figure 11) show downstream motion of the meander crest that brings the trough over the ADCP at 21:27 GMT.
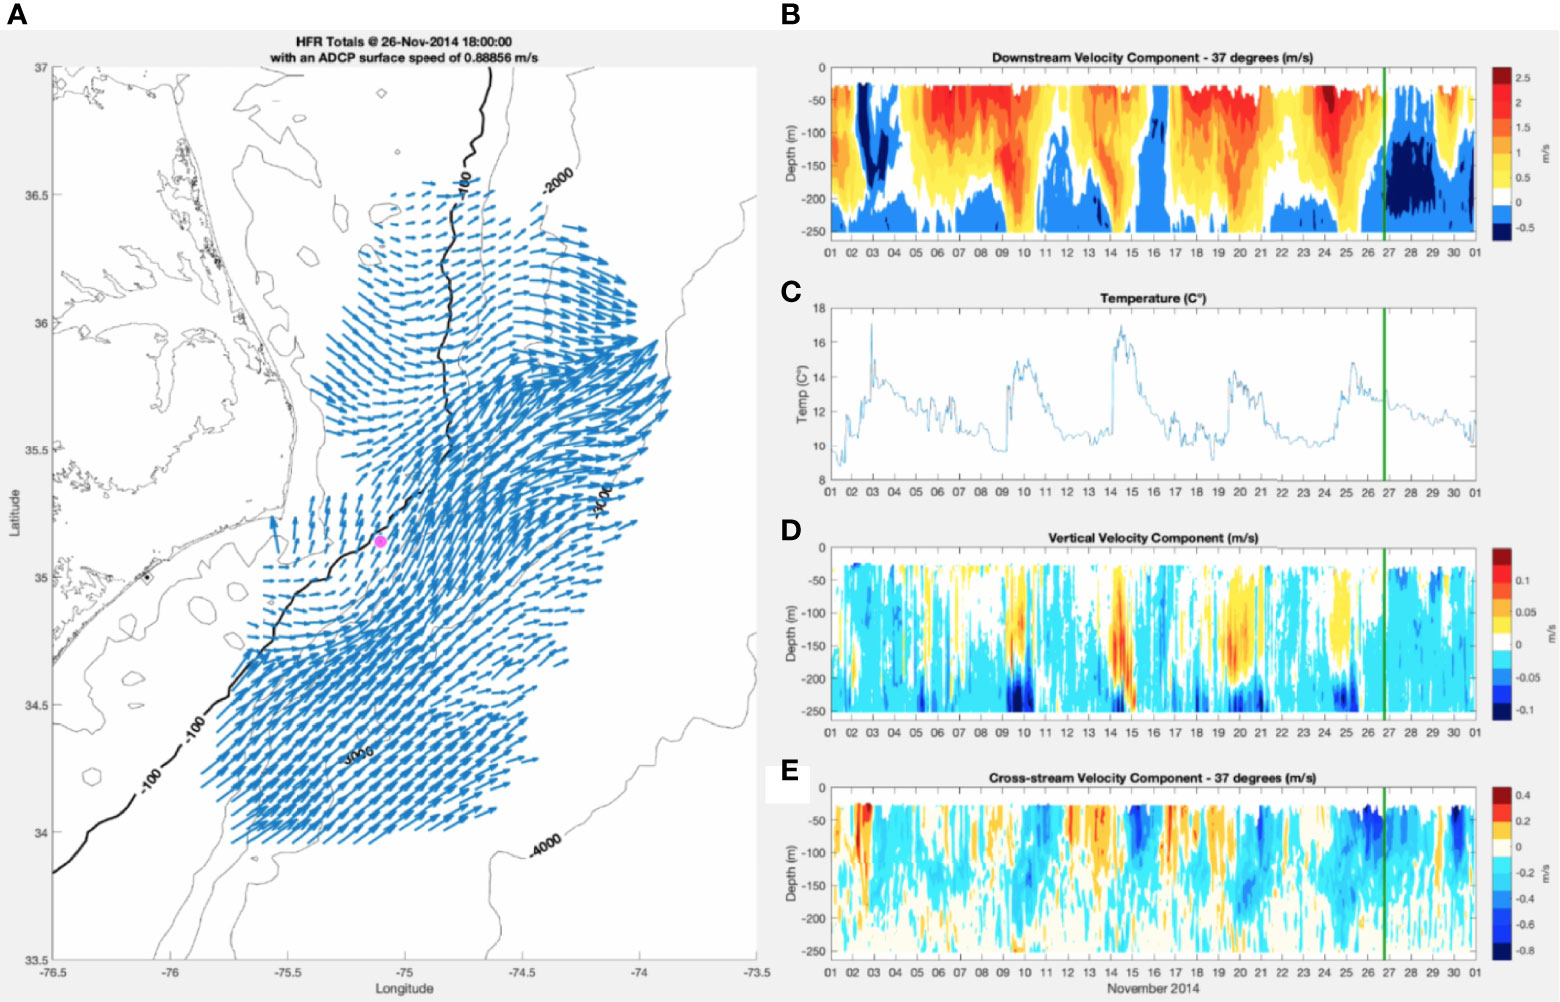
Figure 8 Left: HFR surface currents (A) on November 26 at 18:00 GMT, with ADCP location at red asterisk. Right: ADCP downstream velocity contour (B), bottom temperature (C), vertical velocity contour (D), and cross-stream velocity contour (E), with green vertical line at November 26 at 18:00 GMT.
The spatial context provided by the HFR currents over November 26th-30th contain some intriguing meander fluctuations that suggest a frontal eddy may be offshore of the ADCP causing a reversal in downstream currents. The meander crest and trough almost appear to shift temporarily upstream before propagating downstream at the end of the time series - in E2 on November 27th, the ADCP appears to be on the edge of the trough, but on November 29th in E2 it appears to be again on the edge of the crest. More likely, the ADCP is on the edge of two separate troughs over the period as the ADCP record suggests, with significant daily evolution in the meander pattern. For example, the meander crest and trough are well defined in several of the HFR surface current snapshots, but much less so on November 28th. The surface currents on November 27th and 29th have well defined troughs. Meanders may evolve over short time periods, relaxing and re-intensifying here. The Muglia et al., 2022 algorithm estimated averaged meander speeds of 48 km/day.
5 Discussion
Observations off Cape Hatteras during November 2014 have both confirmed meander evolution characteristics seen in previous studies and revealed new details in this less studied GS meander transition region. Several meander attributes identified in these observations that agree with previous studies are as follows. At a fixed location, the time for an increase and deepening of the downstream current with an approaching crest is usually longer than that for the decrease and shoaling of the current after a crest passage, resulting in a skewed crest with the leading portion being longer than the trailing portion. Local maxima in current and temperature at the mooring occur simultaneously, are followed closely by remarkably strong vertical currents, and are usually led by offshore currents in the upper water column much like that presented by Bane et al. (1981) in their Figure 15, reproduced here in Figure 1. The average meander phase speed of ~48 km/day estimated from the HFR currents is slightly faster in this region than the 30-40 km/day seen earlier in Onslow Bay off southern North Carolina (Brooks and Bane, 1981), and is consistent with the 46-50 km/day observed for a frontal eddy propagating past Cape Hatteras by Glenn and Ebbesmeyer (1994a), the 40-55 km/day meander propagation reported by Savidge (2004), and the 40-70 km/day reported by Andres (2021).
Good agreement is found between the HFR-observed surface current pattern and modeled surface currents described by Miller and Lee (1995) and Gula et al. (2016). Moving upstream-to-downstream in Figure 9, note the offshore-then-onshore curving of the main GS jet (strongest current speeds) in each panel. This is the crest-trough-crest meander pattern. Adjacent to the main jet on the shoreward side is the cyclonic circulation of the frontal eddy that is located within the meander trough. Note the interesting area of near-zero flow along the shoreward side of the frontal eddy, which is due to the addition of the downstream propagation speed of the eddy with the upstream-directed cyclonic circulation, roughly adding together to be near zero.
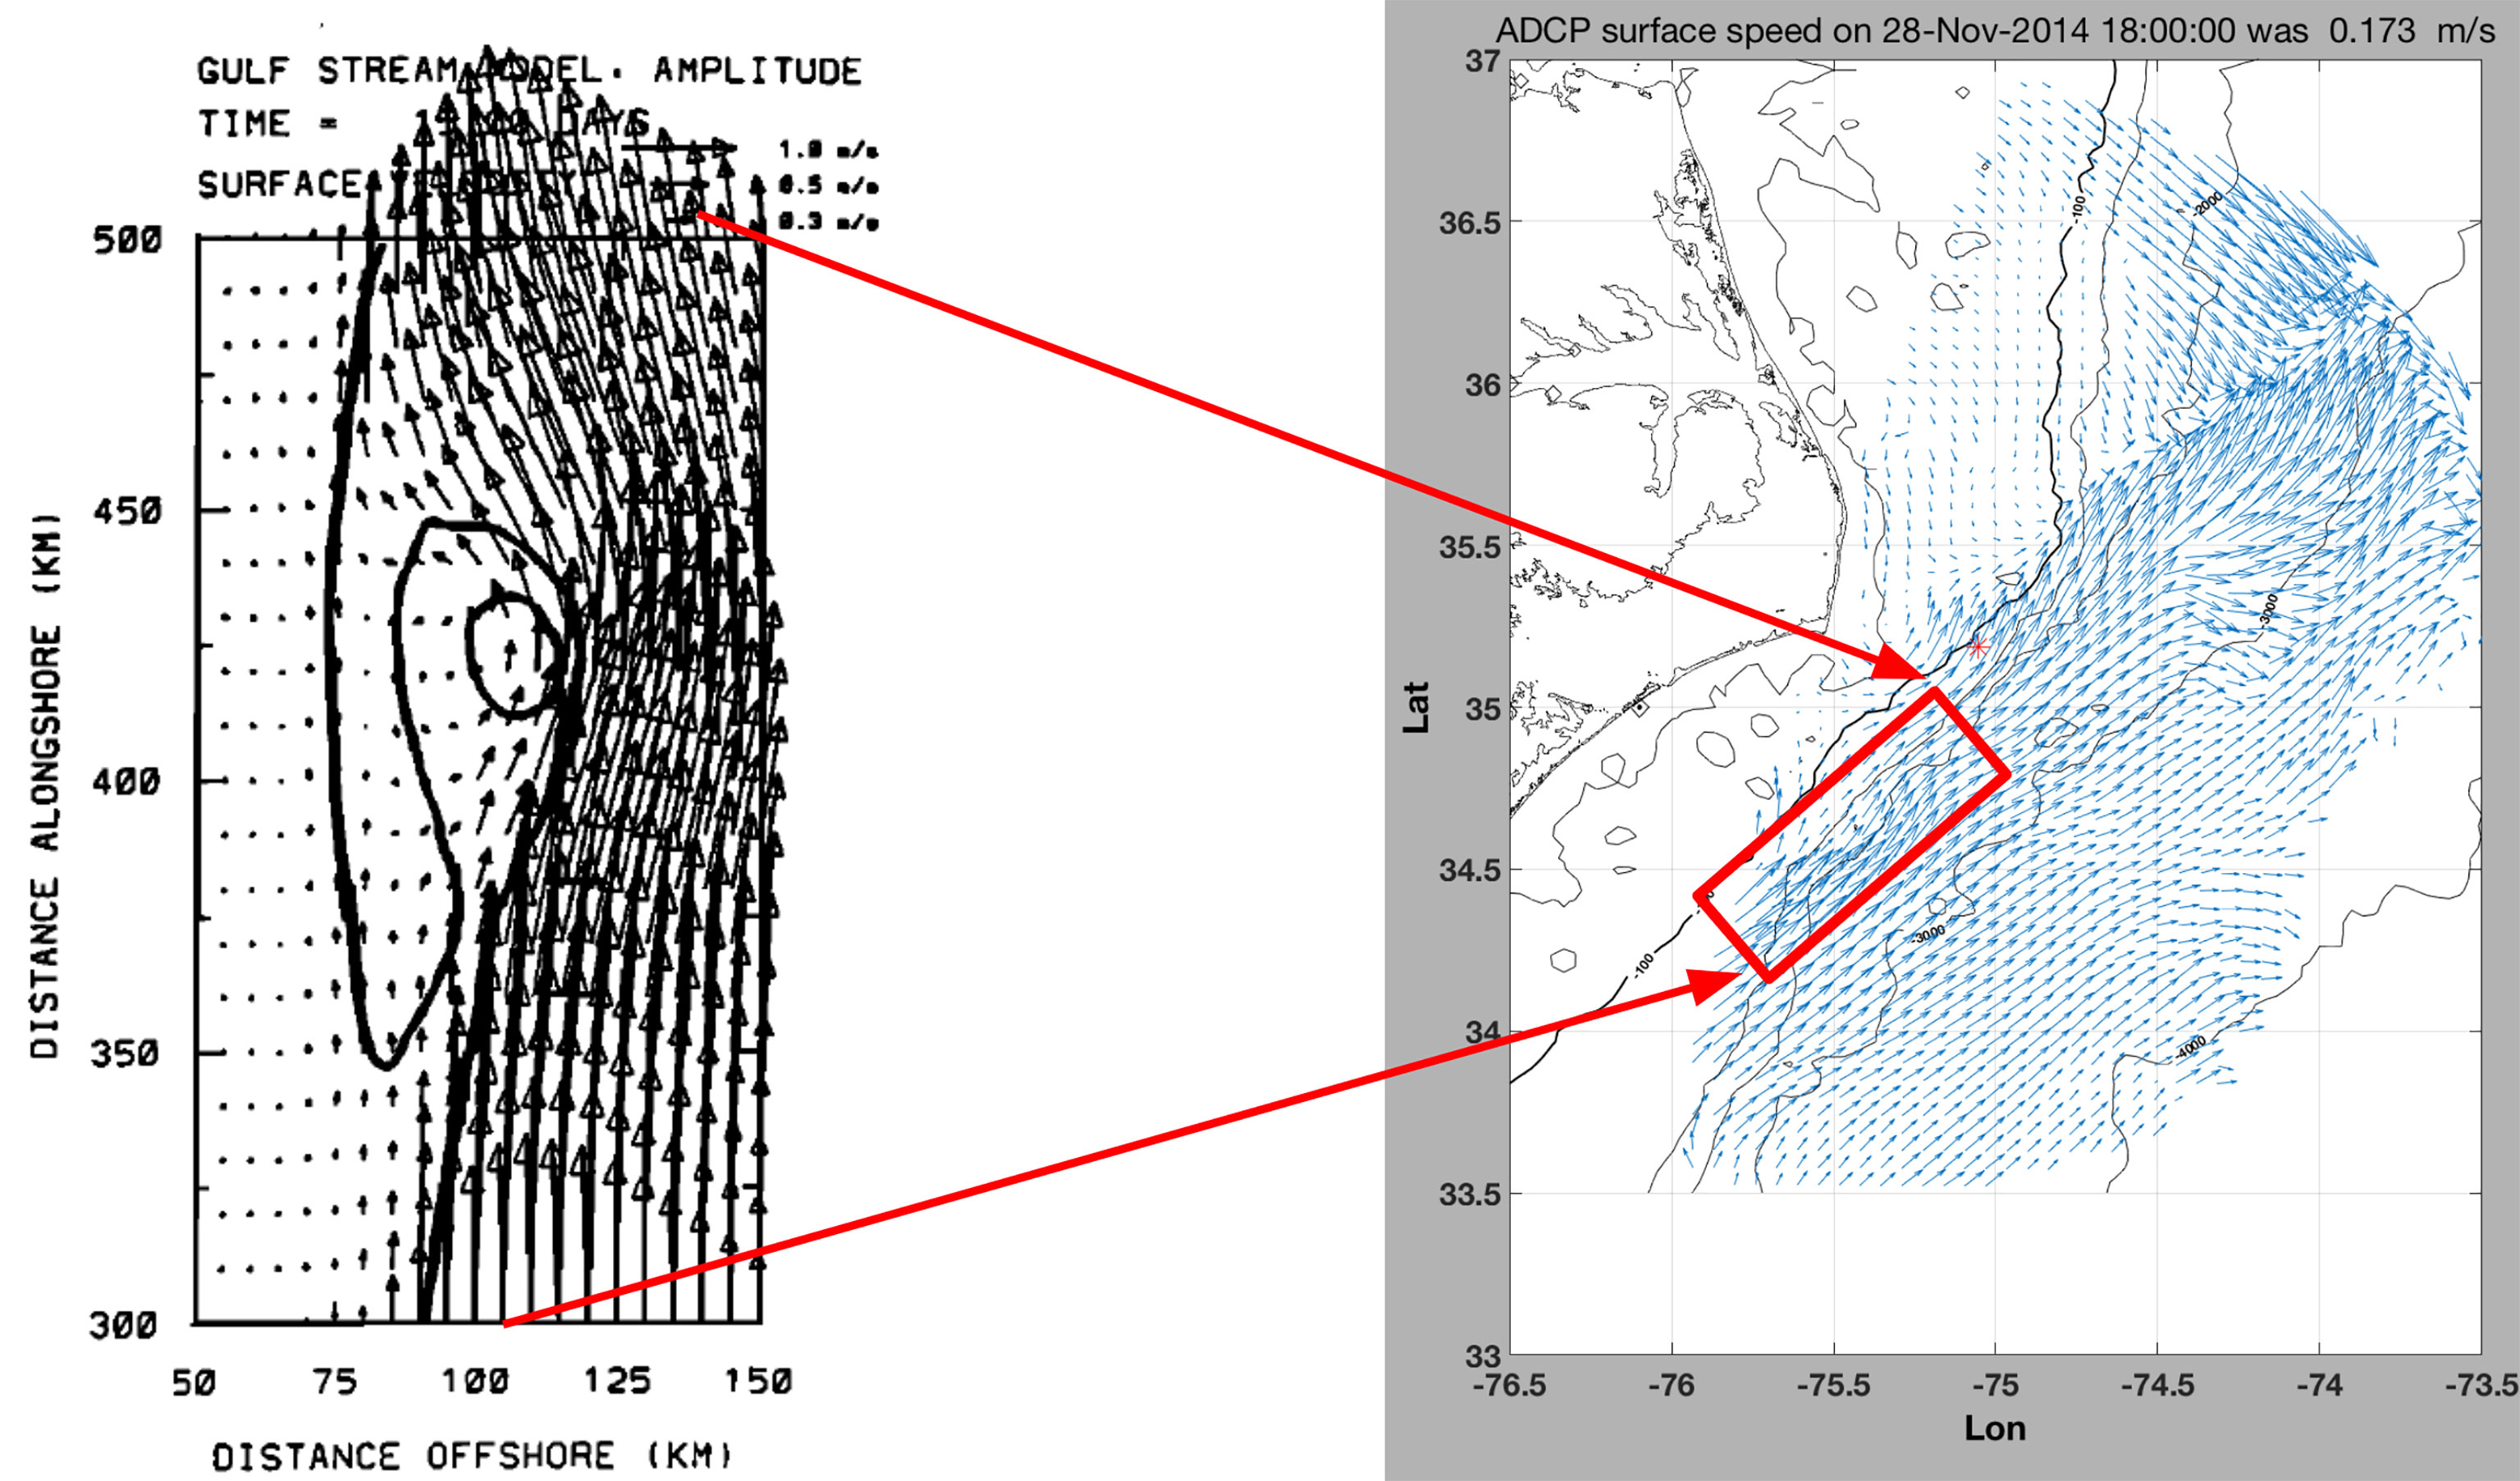
Figure 9 Similar surface current circulation around a meander trough between modeled (left) and HFR observed currents (right). (Left is from Miller and Lee, 1995).
Potential causes for the strong HFR surface-current convergence along the southwestern edge of the meander trough/frontal eddy in the November 26-30 event (Figure 10) have been discussed by other authors. On the frontal-eddy scale, there is generally upwelling (downwelling) within the leading (trailing) portion of a frontal eddy (Osgood et al, 1987; Bane et al, 2001). On the sub-mesoscale, Bower (1989); Thomas and Joyce (2010) and Gula et al. (2016) have shown that frontal jets tend to be confluent (diffluent) on the upstream (downstream) side of a meander trough. An additional contribution may come from shelf water export in the vicinity (Han et al., 2021). During the event, the wind at Diamond Shoals increased to 13 m/s out of the south, then swung more from the west/northwest on November 26th by about 18:00 GMT. It then subsided on November 27th before increasing again from the NW on November 28th. It blew from the NW at 10-12 m/s most of the day, then subsided again to less than 10 m/s on the 29th for the rest of the time period (US Dept. of Commerce, 2019). The increasing southerly winds shifting to northerly from the passage of a cold front, and the warm GS filament flooding Raleigh Bay may have caused convergence and export of shelf water that enhanced the strong convergence at the meander trough (Churchill and Gawarkiewicz, 2012 and Han et al., 2021). Notable pulses of water from the shelf offshore, seen in the HFR currents, appear to contribute to the convergence at the trailing edge of the trough on the 26th (Figure 10), 27th (E2), and 29th (Figure 11 and E2).

Figure 10 HFR surface currents (A) on November 29th at 18:00 GMT with shelf water pulse, meander, and convergence, and location of wind measurements highlighted. Wind speed and direction timeseries (B) at the location noted in (A) from November 25th through November 30th.
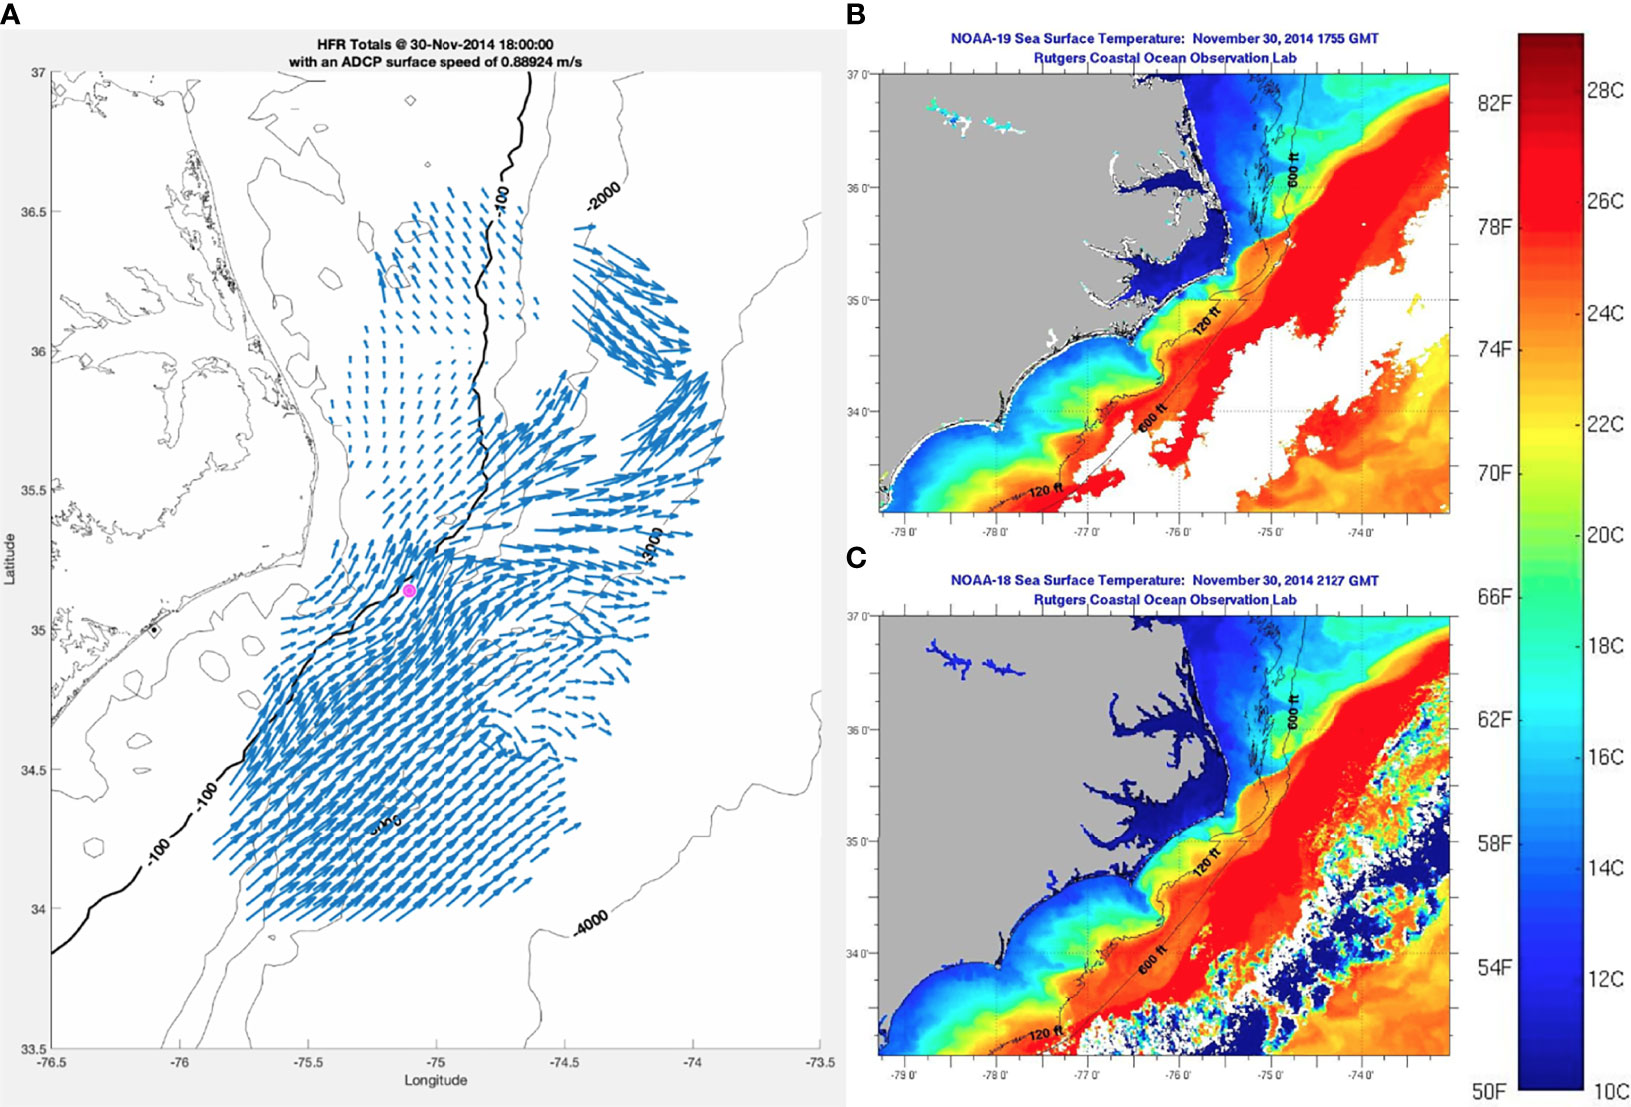
Figure 11 (A): HFR surface currents on November 30 at 18:00 GMT, with ADCP location at pink dot. (B) SST image on November 30th at 17:55 GMT. (C) SST image on November 30th at 21:27 GMT.
The combination of the well-resolved currents over the water column from the ADCP and higher frequency consistent spatial context from the HFR currents provide powerful tools to identify new details of the meander evolution here as well. The downstream current component from the ADCP exhibits much more exaggerated skewness in the upper 100 m of the water column during the November 5-11 and 17-22 events (Figure 5) than that established in Bane et al. (1981) (Figure 2). The increase in downstream currents in the top 100 m leads that at depth by several days in multiple instances, while crests depart at depth about a day before downstream currents subside at the surface. Onshore currents that precede troughs often begin just below 100 m prior to increasing at the surface. Also, the abrupt temperature increases and strong vertical currents at the mooring on November 9th, 14th, and 19th are unlike the gradual increase that coincides with increasing v in Figure 2, while the simultaneous occurrence of maxima in v and T are consistent.
Although three similar meander events occurred during the month, all were different in several ways including event duration, times for crest and trough approaches that defines the degree of skewness, amount of temperature increase at the mooring, depth and magnitude of downstream and cross-stream velocity and associated shears. The degree to which the GS, particularly the center of the frontal eddy, is onshore or offshore of the mooring may contribute significantly to the differences. An example of the influence of GS position relative to the mooring is evident in the unique November 1-4 event. The GS position algorithm (Muglia et al., 2022) shows the GS moving offshore during this period along the HATY 87° bearing closest to the mooring. The strong upstream currents near the surface observed by the ADCP between November 2nd and 3rd coincide with the largest change in GS position along the 87° bearing (Figure 12). Quality SST’s late on the 3rd and 4th (Figure 13) following the strong upstream flow near the surface on the ADCP, show a large filament pulling away from the ADCP that was possibly spawned by a strong frontal eddy, and contributed to the temperature spike at the mooring. Although, previous studies suggest filaments, or “shingles” (Von Arx et al., 1955), are surface-trapped features that don’t extend downward to the mooring depth of 260 m (Bane et al., 1981).
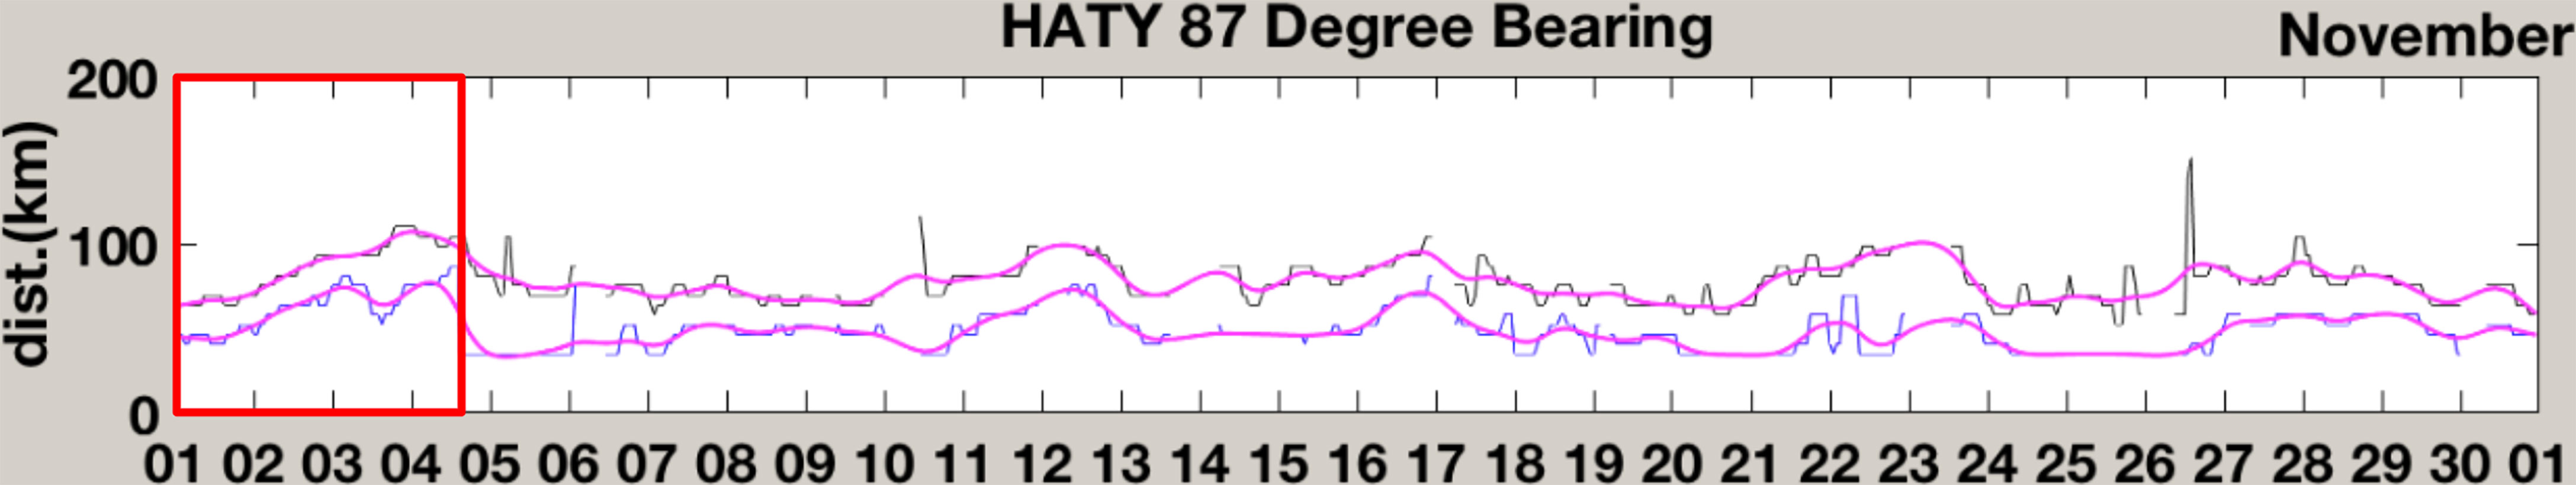
Figure 12 Estimates of the range from the HATY HFR on the 87 degree bearing to the GS edge (blue) and jet (black), with magenta 28.5 hour low-pass cubic spline smoothing of all estimates.
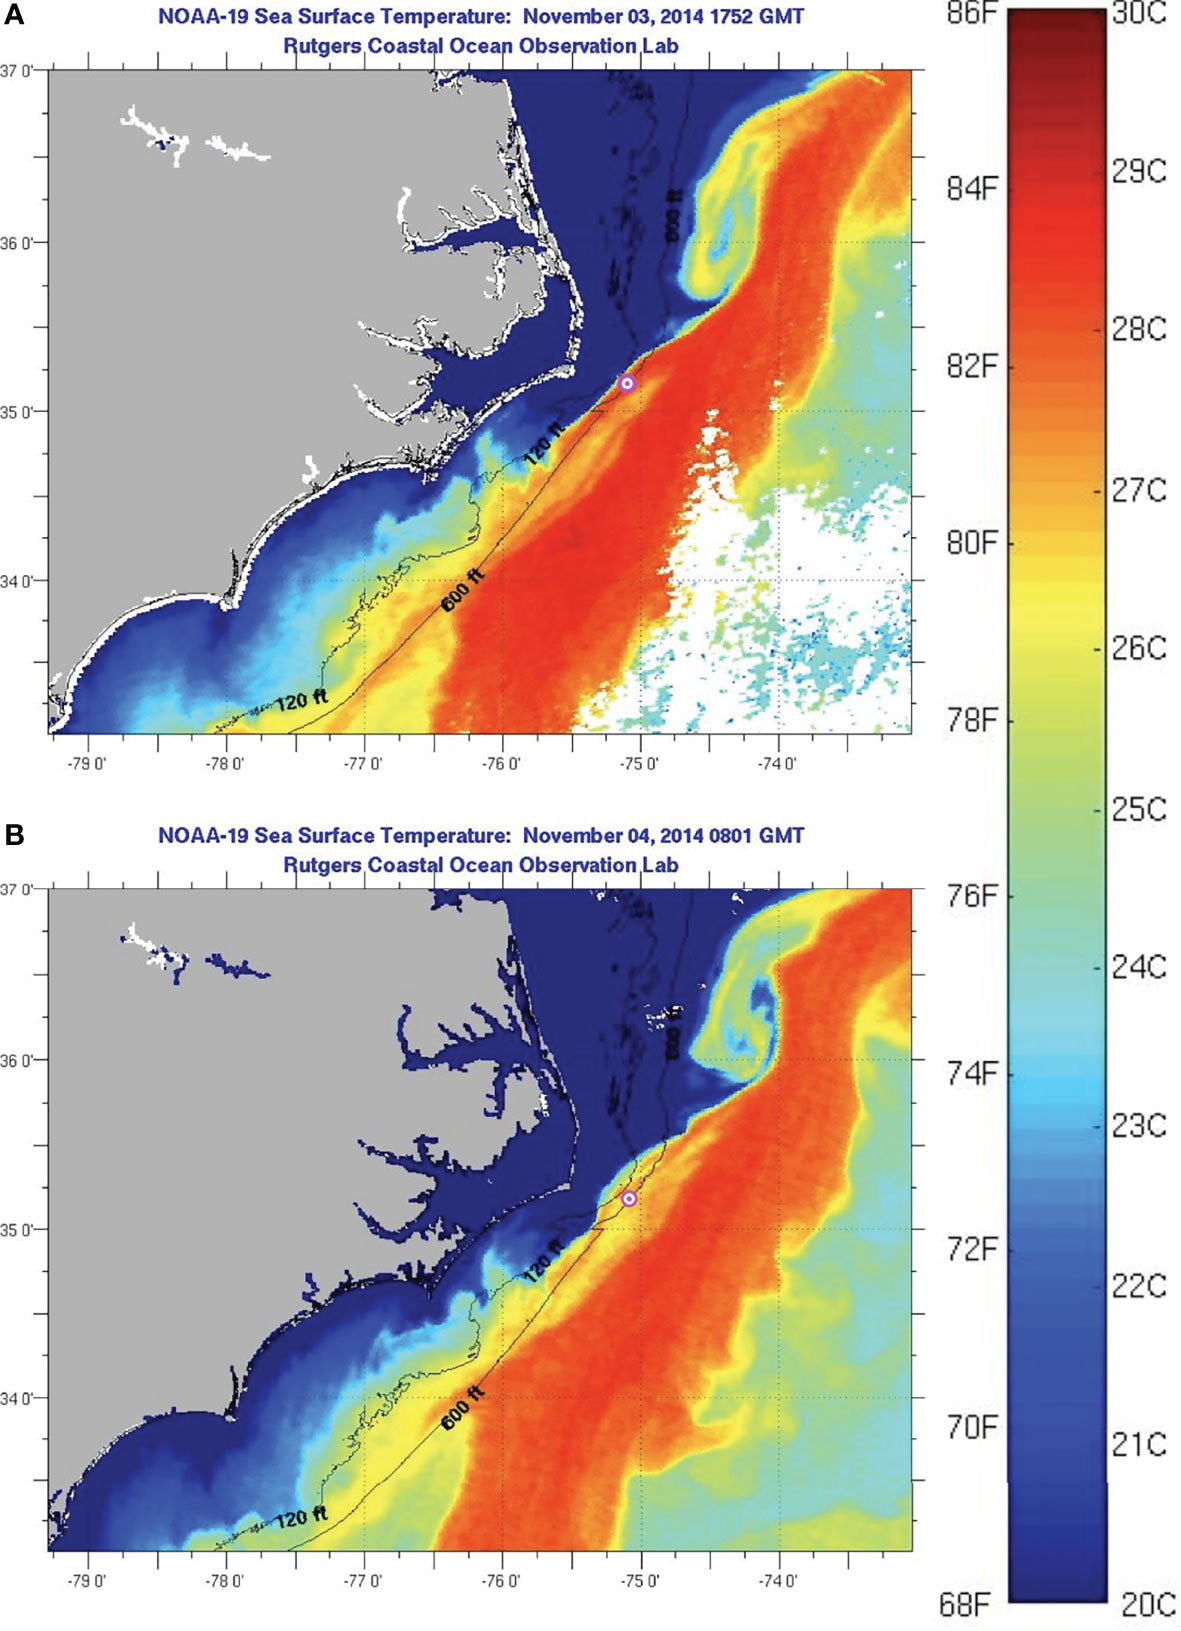
Figure 13 SST image on November 3rd at 17:52 GMT and a day later on November 4th at 18:01 GMT. The ADCP location is marked with a pink dot.
The downstream and cross-stream shears also provide new information about the dynamics in this energetic region. Maxima in the vertical shear of the downstream velocity are nearly an order of magnitude greater than those observed in the stream just to the northeast after it parts from the continental margin (Whitt et al., 2018). The greatest shear magnitudes are often found well below the velocity gradient beneath the GS jet axis (Muglia et al., 2020) and often persist to the bottom in the downstream direction (Figure 6). The bifurcation in the deepening increase in downstream velocity produces strong shears that alternate in sign, not consistent with the monotonic shoaling of the thermocline in typical depictions of the GS. The authors hypothesize that the center of a cold dome was downslope of the mooring causing the cross-slope density gradient to reverse sign for some portion of the water column inshore of the dome center. (A cold dome with this relative positioning was observed in November 1979 and reported by Brooks and Bane, 1983.) This may explain the unusual pattern in the downstream shears. It could also explain the second maximum in downstream velocity at depth. The slowdown below the second velocity maximum towards the seafloor is likely associated with a frictional bottom boundary layer. The presence of a cold-core frontal eddy offshore of the ADCP would cause isopycnals to slope in the opposite direction from the landward GS edge. Note the vertical shears in the cross-stream velocity are even more intricate, often changing sign more than four times throughout the water column.
Our interpretation is that the ADCP is in a region where departing crests have GS jet water flowing upward as the current flows toward the shelfbreak. When this occurs, the GS downstream velocity component is greater than the meander propagation speed in the upper portion of the water column, and water is moving upward along the GS’s sloping thermocline as it makes its way northeastward. The water column is squashing, w/z<0, in the upper ~200 m and the vorticity is becoming more anti-cyclonic as water parcels flow through the curving meander crest, towards shore and then away from shore. Trough passages have associated cold domes (Figure 14), in which there are relatively smaller horizontal and vertical velocities, because the cooler water has less momentum than the faster and warmer GS jet water.
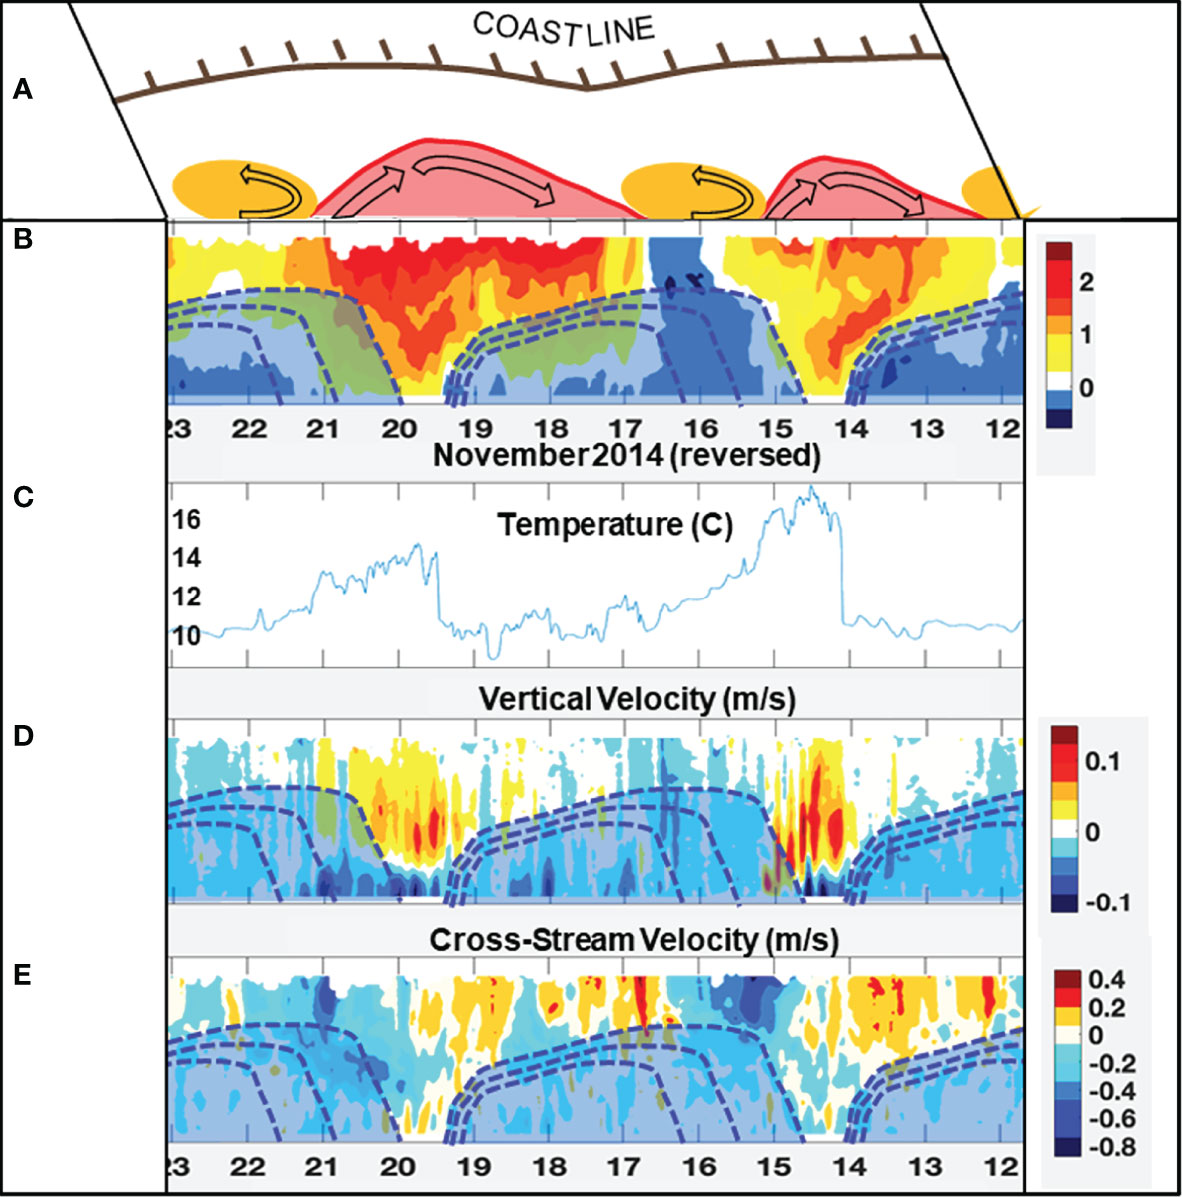
Figure 14 A 3-D view of meander spatial structure, utilizing the ADCP time series from November 12 to 23. The time series have been reversed (right to left) to allow the data to be plotted as a function of downstream distance, assuming a constant downstream propagation speed. Two warm Gulf Stream meander crests and three cool cyclonic frontal eddies are shown schematically on the top horizontal surface (A). Panel (B) is the downstream velocity component (positive to the right), (C) is bottom temperature (at the ADCP), (D) is the vertical velocity component, and E is the cross-stream velocity component (positive into the page, which is towards the coast). Three schematic cold domes in the meander troughs have been added (shaded light blue). The dashed contours are assumed isotherms.
6 Conclusions and Future Work
The observations presented herein provide rich new information about meander structure and dynamics off Cape Hatteras. While they provide new understanding of meander evolution, they also expound upon the complexity and challenge of understanding the connections between the dynamics north and south of the cape in this important transition region. The observations suggest that meanders can persist through this transition region, may evolve substantially here, and contribute to meander evolution downstream after the GS leaves the continental margin (Andres, 2021). There are several factors that may contribute to this evolution. The large degree of skewness in several of the observed meander crests implies energy transfer from the meander to the mean flow (Bane et al., 1981). The steepening bottom slope tends to enhance the conversion of eddy kinetic energy back into the mean flow (Gula et al., 2016). The degree of this evolution, and its effect on GS meander evolution downstream is not well understood (Savidge, 2004).
Recent studies provide evidence of a significant velocity increase as the GS leaves the continental margin. Several cross-stream vessel transects measuring GS velocity both up and downstream of Cape Hatteras measured accelerations in near-surface velocities from 1.4 m/s at the southernmost transect to 2.5 m/s northeast of Cape Hatteras (Muglia et al., 2020 and Andres et al., 2018). Additional evidence for acceleration is provided by the HFR surface currents (Haines et al., 2017) and in their long-term means (Updyke, 2017), but whether meander evolution and decay here substantially contribute has not been quantified. Future work will utilize longer time series of the observations to attempt to quantify the connections up- and down-stream evident in Andres, 2021, and contributions to the mean flow.
Data Availability Statement
The raw data supporting the conclusions of this article will be made available by the authors, without undue reservation.
Author Contributions
MM wrote the initial manuscript. HS: advisor to MM, manuscript editor and science contributor. JB: committee for MM, manuscript editor and science contributor. PT: Research Scientist provided data collection, analysis, science contributions, and figure wizardry. All authors contributed to the article and approved the submitted version.
Funding
NC Renewable Ocean Energy Program funding is provided by: General Assembly of North Carolina. An Act To Modify The Current Operations And Capital Improvements Appropriations Act of 2009 And For Other Purposes. Session Law 2010-31, Senate Bill 897. Session 2009. H. Rept. 131, pt. 1. Washington: GPO, 2001. The Library of Congress. Thomas. Web. 12 January 2012. Funding for operation of the HFR was provided as an award from the Southeast Coastal Ocean Observing Regional Association, which received funding from the Integrated Ocean Observing System under NOAA-NA11NOA0120033.
Conflict of Interest
The authors declare that the research was conducted in the absence of any commercial or financial relationships that could be construed as a potential conflict of interest.
Publisher’s Note
All claims expressed in this article are solely those of the authors and do not necessarily represent those of their affiliated organizations, or those of the publisher, the editors and the reviewers. Any product that may be evaluated in this article, or claim that may be made by its manufacturer, is not guaranteed or endorsed by the publisher.
Acknowledgments
The authors thank the North Carolina Renewable Ocean Energy Program, Southeast Atlantic Coastal Ocean Regional Association for funding and providing the observations used for this study, and Rutgers Coastal Ocean Observing Lab access to SST images. We are also grateful to our Processes driving Exchange At Cape Hatteras (PEACH) colleagues for providing the most recent insights and references relevant to the Cape Hatteras region and this study.
Supplementary Material
The Supplementary Material for this article can be found online at: https://www.frontiersin.org/articles/10.3389/fmars.2022.867439/full#supplementary-material
References
Andres M. (2016). On the Recent Destabilization of the Gulf Stream Path Downstream of Cape Hatteras. Geophys. Res. Lett. 43 (18), 9836–9842. doi: 10.1002/2016GL069966
Andres M. (2021). Spatial and Temporal Variability of the Gulf Stream Near Cape Hatteras. J. Geophys. Re.: Oceans 126 (9). doi: 10.1029/2021JC017579
Andres M., Muglia M., Bahr F., Bane J. (2018). Continuous Flow of Upper Labrador Sea Water Around Cape Hatteras. Sci. Rep. 8 (1), 1–8. doi: 10.1038/s41598-018-22758-z
Bane J. M., Atkinson L. P., Brooks D. A. (2001). “Gulf Stream Physical Oceanography at the Charleston Bump: Deflection, Bimodality, Meanders and Upwelling,” in Island in the Stream: Oceanography and Fisheries of the Charleston Bump. Ed. Sedberry G. R. (American Fisheries Soc.), 25–36.
Bane J. M., Brooks D. A., Lorenson K. R. (1981). Synoptic Observations of the Three-Dimensional Structure and Propagation of Gulf Stream Meanders Along the Carolina Continental Margin. J. Geophysic. Research: Oceans 86 (C7), 6411–6425. doi: 10.1029/JC086iC07p06411
Bane J. M., Dewar W. K. (1988). Gulf Stream Bimodality and Variability Downstream of the Charleston Bump. J. Geophysic. Research: Oceans 93 (C6), 6695–6710. doi: 10.1029/JC093iC06p06695
Bower A. S. (1989). Potential Vorticity Balances and Horizontal Divergence Along Particle Trajectories in Gulf Stream Meanders East of Cape Hatteras. J. Phys. Oceanog. 19 (11), 1669–1681. doi: 10.1175/1520-0485(1989)019<1669:PVBAHD>2.0.CO;2
Brooks D. A., Bane J. M. (1978). Gulf Stream Deflection by a Bottom Feature Off Charleston, South Carolina. Science 201 (4362), 1225–1226. doi: 10.1126/science.201.4362.1225
Brooks D. A., Bane J. M. (1981). Gulf Stream Fluctuations and Meanders Over the Onslow Bay Upper Continental Slope. J. Phys. Oceanog. 11 (2), 247–256. doi: 10.1175/1520-0485(1981)011<0247:GSFAMO>2.0.CO;2
Brooks D. A., Bane J. M. (1983). Gulf Stream Meanders Off North Carolina During Winter and Summer 1979. J. Geophys Res.: Oceans 88 (C8), 4633–4650. doi: 10.1029/JC088iC08p04633
Churchill J. H., Gawarkiewicz G. G. (2012). Pathways of Shelf Water Export From the Hatteras Shelf and Slope. J. Geophysic. Research: Oceans 117 (C8), 133–145. doi: 10.1029/2012JC007995
Dewar W. K., Bane J. M. (1985). Subsurface Energetics of the Gulf Stream Near the Charleston Bump. J. Phys. oceanog. 15 (12), 1771–1789. doi: 10.1175/1520-0485(1985)015<1771:SEOTGS>2.0.CO;2
Dewar W. K., Bane J. M. (1989). Gulf Stream Dynamics. Pad II: Eddy Energetics at 73° W. J. Phys. Oceanog. 19 (10), 1574–1587. doi: 10.1175/1520-0485(1989)019<1574:GSDPIE>2.0.CO;2
Ezer T. (2019). Regional Differences in Sea Level Rise Between the Mid-Atlantic Bight and the South Atlantic Bight: Is the Gulf Stream to Blame? Earth's Future 7 (7), 771–783. doi: 10.1029/2019EF001174
Gawarkiewicz G. G., Todd R. E., Plueddemann A. J., Andres M., Manning J. P. (2012). Direct Interaction Between the Gulf Stream and the Shelfbreak South of New England. Sci. Rep. 2, 553. doi: 10.1038/srep00553
Glenn S. M., Ebbesmeyer C. C. (1994a). Observations of Gulf Stream Frontal Eddies in the Vicinity of Cape Hatteras. J. Geophysic. Research: Oceans 99 (C3), 5047–5055. doi: 10.1029/93JC02787
Glenn S. M., Ebbesmeyer C. C. (1994b). The Structure and Propagation of a Gulf Stream Frontal Eddy Along the North Carolina Shelf Break. J. Geophysic. Research: Oceans 99 (C3), 5029–5046. doi: 10.1029/93JC02786
Gula J., Molemaker M. J., McWilliams J. C. (2014). Submesoscale Cold Filaments in the Gulf Stream. J. Phys. Oceanog. 44 (10), 2617–2643. doi: 10.1175/JPO-D-14-0029.1
Gula J., Molemaker M. J., McWilliams J. C. (2016). Submesoscale Dynamics of a Gulf Stream Frontal Eddy in the South Atlantic Bight. J. Phys. Oceanog. 46 (1), 305–325. doi: 10.1175/JPO-D-14-0258.1
Haines S., Seim H., Muglia M. (2017). Implementing Quality Control of High-Frequency Radar Estimates and Application to Gulf Stream Surface Currents. J. Atmospheric Oceanic Technol. 34.6, 1207–1224. doi: 10.1175/JTECH-D-16-0203.1
Han L., Seim H., Bane J., Todd R. E., Muglia M. (2021). A Shelf Water Cascading Event Near Cape Hatteras. J. Phys. Oceanogr. 51 (6), 2021–2033. doi: 10.1175/JPO-D-20-0156.1
Integrated Ocean Observing System (2021) Quality Assurance/Quality Control of Real-Time Oceanographic Data. Available at: https://ioos.noaa.gov/project/qartod/ (Accessed December 27, 2021).
Kang D., Curchitser E. N. (2015). Energetics of Eddy–Mean Flow Interactions in the Gulf Stream Region. J. Phys. Oceanog. 45 (4), 1103–1120. doi: 10.1175/JPO-D-14-0200.1
Luther M. E., Bane J. M. (1985). Mixed Instabilities in the Gulf Stream Over the Continental Slope. J. Phys. oceanog. 15 (1), 3–23. doi: 10.1175/1520-0485(1985)015<0003:MIITGS>2.0.CO;2
Menelle M., Auffray G., Jangal F. (2008). Full Digital High Frequency Surface Wave Radar: French Trials in the Biscay Bay. In 2008 International Conference on RADAR (pp. 224–229). IEEE. doi: 10.1109/RADAR.2008.4653922
Miller J. L. (1994). Fluctuations of Gulf Stream Frontal Position Between Cape Hatteras and the Straits of Florida. J. Geophysic. Research: Oceans 99 (C3), 5057–5064. doi: 10.1029/93JC03484
Miller J. L., Lee T. N. (1995). Gulf Stream Meanders in the South Atlantic Bight: 1. Scaling and Energetics. J. Geophysic. Research: Oceans 100 (C4), 6687–6704. doi: 10.1029/94JC02542
Muglia M., Seim H., Taylor P. (2020). Gulf Stream Marine Hydrokinetic Energy Off Cape Hatteras, North Carolina. Mar. Tech. Soc J. 54 (6), 24–36. doi: 10.4031/MTSJ.54.6.4
Muglia M., Seim H., Taylor P. (2022). Gulf Stream Position, Width, and Orientation Estimated From HF Radar Radial Velocity Maps Off Cape Hatteras, NC. J. Atmospheric Oceanic Tech. 39 (5), 689–705. doi: 10.1175/JTECH-D-21-0098.1
Oey L. Y., Ezer T., Mellor G. L., Chen P. (1992). A Model Study of “Bump” Induced Western Boundary Current Variabilities. J. Mar. Syst. 3 (4-5), 321–342. doi: 10.1016/0924-7963(92)90009-W
Osgood K., Bane J. M., Dewar W. K. (1987). Vertical Velocities and Dynamical Balances in Gulf Stream Meanders. J. Geophys. Res. 92 (C12), 13,029–13,040. doi: 10.1029/JC092iC12p13029
Roarty H., Glenn S., Kohut J., Gong D., Handel E., Rivera E., et al. (2010). Operation and Application of a Regional High-Frequency Radar Network in the Mid-Atlantic Bight. Mar. Technol. Soc. J. 44 (6), 133–145. doi: 10.4031/MTSJ.44.6.5
Rutgers Coastal Ocean Oberving Lab (2019) Satellite Imagery Seas Surface Temperature of East Coast. Available at: https://marine.rutgers.edu/cool/sat_data/?product=sst®ion=eastcoast¬humbs=0 (Accessed December 27, 2021).
Savidge D. K. (2004). Gulf Stream Meander Propagation Past Cape Hatteras. J. Phys. Oceanogr. 34 (9), 2073–2085. doi: 10.1175/1520-0485(2004)034<2073:GSMPPC>2.0.CO;2
Sedberry G. R. (2010) A Profile of the Charleston Bump. Available at: https://oceanexplorer.noaa.gov/explorations/islands01/background/islands/sup11_bump.html (Accessed June 9th, 2019).
Thomas L. N., Joyce T. M. (2010). Subduction on the Northern and Southern Flanks of the Gulf Stream. J. Phys. oceanog. 40 (2), 429–438. doi: 10.1175/2009JPO4187.1
Todd R. E. (2017). High-Frequency Internal Waves and Thick Bottom Mixed Layers Observed by Gliders in the Gulf Stream. Geophysic. Res. Lett. 44 (12), 6316–6325. doi: 10.1002/2017GL072580
Tracey K. L., Watts D. R. (1986). On Gulf Stream Meander Characteristics Near Cape Hatteras. J. Geophysic. Research: Oceans 91 (C6), 7587–7602. doi: 10.1029/JC091iC06p07587
Updyke T. (2017). “An Update on Recent Work Involving HF Radar Data in the Mid-Atlantic,” in 44th Mid Atlantic Bight Physical Oceanography and Meteorology meeting, September 27th-29th (Wanchese, NC: Coastal Studies Institute, 850 NC 345).
US Department of Commerce, National Oceanic and Atmospheric Administration, National Weather Service, and National Data Buoy Center (1996) NDBC Station Page. Available at: https://www.ndbc.noaa.gov/station_page.php?station=41025 (Accessed June 4, 2019).
Vazquez J., Watts D. R. (1985). Observations on the Propagation, Growth, and Predictability of Gulf Stream Meanders. J. Geophysic. Research: Oceans 90 (C4), 7143–7151. doi: 10.1029/JC090iC04p07143
Von Arx W. S., Bumpus D. F., Richardson W. S. (1955). On the Fine-Structure of the Gulf Stream Front. Deep Sea Res. (1953) 3 (1), 46–65. doi: 10.1016/0146-6313(55)90035-6
Whitt D. B., Thomas L. N., Klymak J. M., Lee C. M., D’Asaro E. A. (2018). Interaction of Superinertial Waves With Submesoscale Cyclonic Filaments in the North Wall of the Gulf Stream. J. Phys. Oceanog. 48 (1), 81–99. doi: 10.1175/JPO-D-17-0079.1
Yoder J. A., Atkinson L. P., Bishop S. S., Hofmann E. E., Lee T. N. (1983). Effect of Upwelling on Phytoplankton Productivity of the Outer Southeastern United States Continental Shelf. Cont. Shelf Res. 1 (4), 385–404. doi: 10.1016/0278-4343(83)90004-3
Keywords: Gulf Stream, Cape Hatteras, meanders, western boundary current, observations
Citation: Muglia M, Seim H, Bane J and Taylor P (2022) An Observation-Based Study of Gulf Stream Meander Kinematics Offshore of Cape Hatteras. Front. Mar. Sci. 9:867439. doi: 10.3389/fmars.2022.867439
Received: 01 February 2022; Accepted: 23 May 2022;
Published: 23 June 2022.
Edited by:
Alejandro Jose Souza, Center for Research and Advanced Studies - Mérida Unit, MexicoReviewed by:
Shin-ichi Ito, The University of Tokyo, JapanTal Ezer, Old Dominion University, United States
Copyright © 2022 Muglia, Seim, Bane and Taylor. This is an open-access article distributed under the terms of the Creative Commons Attribution License (CC BY). The use, distribution or reproduction in other forums is permitted, provided the original author(s) and the copyright owner(s) are credited and that the original publication in this journal is cited, in accordance with accepted academic practice. No use, distribution or reproduction is permitted which does not comply with these terms.
*Correspondence: Mike Muglia, muglia@gmail.com