Assessing Important Conservation Areas for Colonial Species From Individual Tracking Data: An Evaluation of the Effects of Colony Structure and Temporal Heterogeneity in Movement Patterns
 Jennifer Morinay1,2*†
  Federico De Pascalis1,3†
  Carlo Catoni4† Andrea Benvenuti4† Simona Imperio1†
  Diego Rubolini3,5† Jacopo G. Cecere1†
- 1Area Avifauna Migratrice, Istituto Superiore per la Protezione e la Ricerca Ambientale (ISPRA), Ozzano Emilia, Italy
- 2Centre for Biodiversity Dynamics, Institutt for Biologi, Norwegian University of Science and Technology (NTNU), Trondheim, Norway
- 3Dipartimento di Scienze e Politiche Ambientali, Università degli Studi di Milano, Milano, Italy
- 4Ornis italica, Rome, Italy
- 5Consiglio Nazionale delle Ricerche – Istituto di Ricerca sulle Acque (CNR-IRSA), Brugherio, (MB), Italy
Sensitivity of marine ecosystems to human disturbance leads to an increasing need to devise effective conservation initiatives. One key conservation leverage tool is the establishment of marine protected areas, which can be derived by inspecting where marine sentinel species forage in their most sensitive life cycle phase (reproduction). Depending on their biological and legislative framework, important conservation areas (hereafter, ICAs) can correspond to Important Bird and biodiversity Areas, Key Biodiversity Areas, Marine Protected Areas, etc. Statistical methods allow for standardized assessment of ICAs based on GPS tracking data. However, several biological processes should be accounted for to provide reliable ICAs. In colonial seabirds and sea mammals, individuals breeding in different parts of a colony often spatially segregate while foraging at sea. Besides, environmental conditions may affect the location of foraging areas across years. To what extent relying on data collected in only one part of a colony or in a single breeding season may affect the location and size of ICAs remains unexplored. Here we aimed at 1) highlighting intra-colony and inter-annual heterogeneity of exploited marine areas during reproduction in a colonial seabird, the Scopoli’s shearwaters Calonectris diomedea; and 2) providing guidelines on how to methodologically best account for such spatio-temporal heterogeneity when deriving ICAs. We relied on 397 foraging trips performed by 73 individuals breeding in two distinct areas within the same colony (hereafter, sub-colonies) over 3 years. We showed that areas exploited by shearwaters breeding in two nearby sub-colonies were clearly segregated and differed between years. Relying on only one sub-colony or a single breeding season led to drastically smaller ICAs, biased either east- or west-ward depending on the sub-colony considered. We proposed to account for such heterogeneity by merging the different ICAs obtained for each sub-colony and year, instead of pooling tracking data and deriving a single ICA. Our method led to much larger ICAs, which were less affected by differences in sample sizes across sub-colonies or years, than when ignoring the spatio-temporal heterogeneity. Recently developed standardized statistical procedures and a careful consideration of population spatial structure and temporal heterogeneity will foster robust conservation actions for colonial marine species.
Introduction
Current environmental changes pose dramatic threats to biodiversity and wildlife (Acevedo-Whitehouse and Duffus, 2009; Hautier et al., 2015). Based on the IUCN Red List, 28% of the species are globally threatened (currently assessed species, IUCN, 2021), a percentage that will likely increase greatly in the near future due to climatic changes (Thomas et al., 2004). In response, the establishment of conservation areas proved to be an effective tool to locally protect species and ecosystems (Pimm et al., 2001; Eken et al., 2004). Various types of important conservation areas exist, each with their own specific applications (ecosystem or taxa) and regulations (see Eken et al., 2004). There is a particular and long-lasting interest in marine ecosystems conservation due to the multi-scale threats marine communities are facing: overfishing and bycatch (Jackson et al., 2001; Davies et al., 2009), water acidification (Doney et al., 2009), increased temperature (Johansen and Jones, 2011), and pollution (Cole et al., 2011; Wilcox et al., 2015). Since the 1970’s, Marine Protected Areas have been implemented worldwide in marine ecosystems (Caveen et al., 2013). The following decade, more quantitative and criteria-driven approaches for conservation areas emerged, with Important Bird and biodiversity Areas (IBAs) used since then by BirdLife International (Eken et al., 2004; Lascelles et al., 2016). This standardized approach was then taken to a more taxonomic-general framework with the definition of Key Biodiversity Areas (KBAs, Eken et al., 2004). For simplicity and generalism, we refer hereafter to important conservation areas (ICAs), as simply any area of importance for the conservation of a target species, without refering to any specific regulatory or legislative framework as implied in MPAs, IBAs or KBAs.
Given their key functional role in marine ecosystems, marine megafauna species are often considered as sentinels of marine environmental conditions. Hence, their at-sea distribution, especially during the reproductive period, was used to reliably identify local ICAs (Karpouzi et al., 2007; Nelms et al., 2021). In the last 50 years, we witnessed a great improvement in tracking technologies allowing to record the movement of marine megafauna, especially seabirds (Wilmers et al., 2015). In parallel, statistical tools were proposed for a standardized identification of ICAs: Lascelles et al. (2016) introduced a standard methodological approach further developed and improved with the recent R package track2KBA (Beal et al., 2021b). While this statistical procedure offers exciting possibilities for data-driven conservation planning, it still awaits to be thoroughly tested in real-world settings considering different aspects of species’ ecology and the characteristics of available tracking data.
Some inherent biological processes affecting at-sea distribution of marine megafauna may limit the efficacy of ICAs if not appropriately accounted for. In particular, most seabird species breed in colonies (over 95% of species, Schreiber and Burger, 2001), and competition for food resources often leads to colony-specific segregated foraging areas (Cairns, 1989; in 79% of studied seabird populations, Bolton et al., 2019). Relying on a non-random sample of individuals (e.g. only one -part of a-colony) could lead to giving more weight to certain phenotypes in the final assessment of the population foraging areas (Aarts et al., 2008). A common practise when implementing large-scale conservation actions consists in relying on at-sea distribution of different colonies (e.g. Fort et al., 2013). However, colonies (i.e., assemblage of individuals breeding at close sites and having physically access to the same foraging areas) rarely form continuous spatial arrangements of breeders and are instead often divided in more or less discrete and isolated sub-groups (hereafter sub-colonies), which may also forage in distinct areas around the colony despite having access to the same areas (e.g., Waggitt et al., 2014; Pereira et al., 2022). Similarly to what has been observed between colonies, there is now a growing body of literature showing between-sub-colony spatial segregation of foraging grounds (in seabirds: Hipfner et al., 2007; Bogdanova et al., 2014; Ceia et al., 2015; Sánchez et al., 2018; Ito et al., 2020; Pereira et al., 2022; sea mammals: Kuhn et al., 2014; and a terrestrial colonial bird, Morinay et al., 2022), suggesting that such within-colony segregation could be widespread, and thus impact a population-wide representative definition of ICAs if overlooked. How to best account for such small-scale spatial segregation when deriving ICAs still remains an open question that we aimed to answer here with our methodological and empirical approach.
Another important aspect to consider for the establishment of efficient ICAs is the temporal change in habitat use. Indeed, locations of visited areas within a specific time-window (e.g. few days, a week, a year) may not be representative of the population habitat use over longer term, for instance if the resource itself moved or if individuals decided to visit other patches (e.g. nearer to the colony or further away). Sampling over short term may not be meaningful for deriving efficient long-term conservation actions. Challenges due to short term changes in habitat use (within hours, days) can be overcome by collecting several independent foraging trips, ideally over different reproductive stages, or, if not possible, when individuals are most constrained and likely less plastic in their foraging activity, defining then the area exploited during the most critical period (usually during the nestling provisioning stage; Cecere et al., 2013). Dealing with longer term changes in habitat use require collecting data over enough breeding seasons (Bogdanova et al., 2014), which can be also technically and financially challenging. Some studies already documented among-year differences in some seabirds (Bogdanova et al., 2014; Cecere et al., 2014; Courbin et al., 2018) and their prey distributions (Saraux et al., 2014). It is thus crucial, when aiming at deriving ICA, to detect temporal heterogeneity in movement patterns, and ensure that data collected over different years cover the population extent of foraging range (see Bogdanova et al., 2014 for a worked exampe based on 15 years of data). Yet, when only few years are available, as it may be the case for many conservation plans, ignoring yearly-variation in habitat use and weighting equally data from the different years (with possibly different sample sizes and representativeness level) may strongly affect the inferences on habitat use (Schooley, 1994). Appropriately accounting for such temporal heterogeneity in spatial data remains a practical challenge.
To what extent spatial segregation of exploited areas among individuals from different sub-colonies and among-year differences in exploited areas may affect the location and size of ICAs remains to be assessed. To address this issue, we first analysed how the spatial extent of ICAs was affected by ignoring such spatial (among sub-colonies) and temporal (among years) heterogeneity in the data. Secondly, we provide guidelines on how to account for these sources of heterogeneity with the statistical tools already in place in order to identify the most ecologically appropriate ICAs. To achieve these goals, we used spatial data of Scopoli’s shearwaters Calonectris diomedea breeding in Mediterranean Sea colonies. Through its apex role in the marine ecosystem and its sensitivity to environmental changes (Jenouvrier et al., 2009) and anthropogenic threats (Codina-García et al., 2013), this marine top predator is a good candidate as a sentinel species for marine ecosystems (Hazen et al., 2019), making it especially appropriate to study for the establishment of ICAs. Besides, even though Scopoli’s shearwaters are considered as ‘least concern’ by the IUCN, they are of conservation concern in Europe (listed in Annex I of Bird Directive 2009/147/EC) as they are subject to multiple threats like predation by invasive species (Ozella et al., 2016), light pollution (Rodríguez et al., 2015), but also deadly interactions with fisheries (Afán et al., 2019) and plastic ingestion (Codina-García et al., 2013), which call for protected areas not only on land but also at sea for this species. We focused on the chick-rearing period, which is the most constraining period for breeding central place foragers as they must combine self-maintenance and offspring provisioning. Using the track2KBA package (Beal et al., 2021b) and relying on 397 foraging trips performed by chick-rearing Scopoli’s shearwaters from two separated islands of a same archipelago (i.e. two sub-colonies) across three breeding seasons, we aimed to detect the effect of spatial segregation between sub-colonies and year differences in habitat use in the delineation of ICAs. To achieve this goal, we compared ICAs derived when considering or ignoring such spatial and temporal heterogeneity and propose a method to derive a single and reliable ICA using tracking data from several sub-colonies and years.
Material and Methods
Studies Species and Site
The study was conducted between July and August in 2013, 2018 and 2019, in the Parco Nazionale dell’Arcipelago di La Maddalena (Italy) located between Sardinia and Corsica, and hosting 200-500 breeding pairs of Scopoli’s shearwaters (from our surveys) distributed in about 12 islands. This archipelago is at minimum 7 km far from Lavezzi islands (France), hosting 350-400 pairs (Péron et al., 2018). We sampled individuals breeding on two small islets of this archipelago and located only 7 km apart, a very close distance for such a wide-ranging species (Figure 1). These two sub-colonies, Barrettini (41°17’3.59’’N, 9°24’5.96’’E) and Spargiotto (41°14’59.93’’N, 9°19’25.01’’E), host the higher number of pairs of Scopoli’s shearwaters per island in the archipelago, namely 40-50 and 60-80 pairs respectively. Barrettini and Spargiotto are besides the most eastern and western sub-colonies in this archipelago, respectively (among the ones with more than 10 breeding pairs). There, shearwaters breed in relatively easily accessible burrows, enabling the capture and identification of many breeding individuals (between 24 and 37 each year on each islet), as well as the recapture of individuals equipped with GPS devices. Scopoli’s shearwaters typically mate in late April, lay eggs in late May, and incubate them for about 55 days. They feed mostly on plankton and small pelagic fish (Grémillet et al., 2014) but they can also exploit discards from fishing vessels (Cecere et al., 2015; Cianchetti-Benedetti et al., 2018). During incubation, both partners undertake long lasting foraging trips (1-18 days, 7 days on average; Cecere et al., 2013), while upon chick-rearing (in July – October), they alternate few long trips lasting 6-20 days with shorter trips (1-4 days; Cecere et al., 2014).
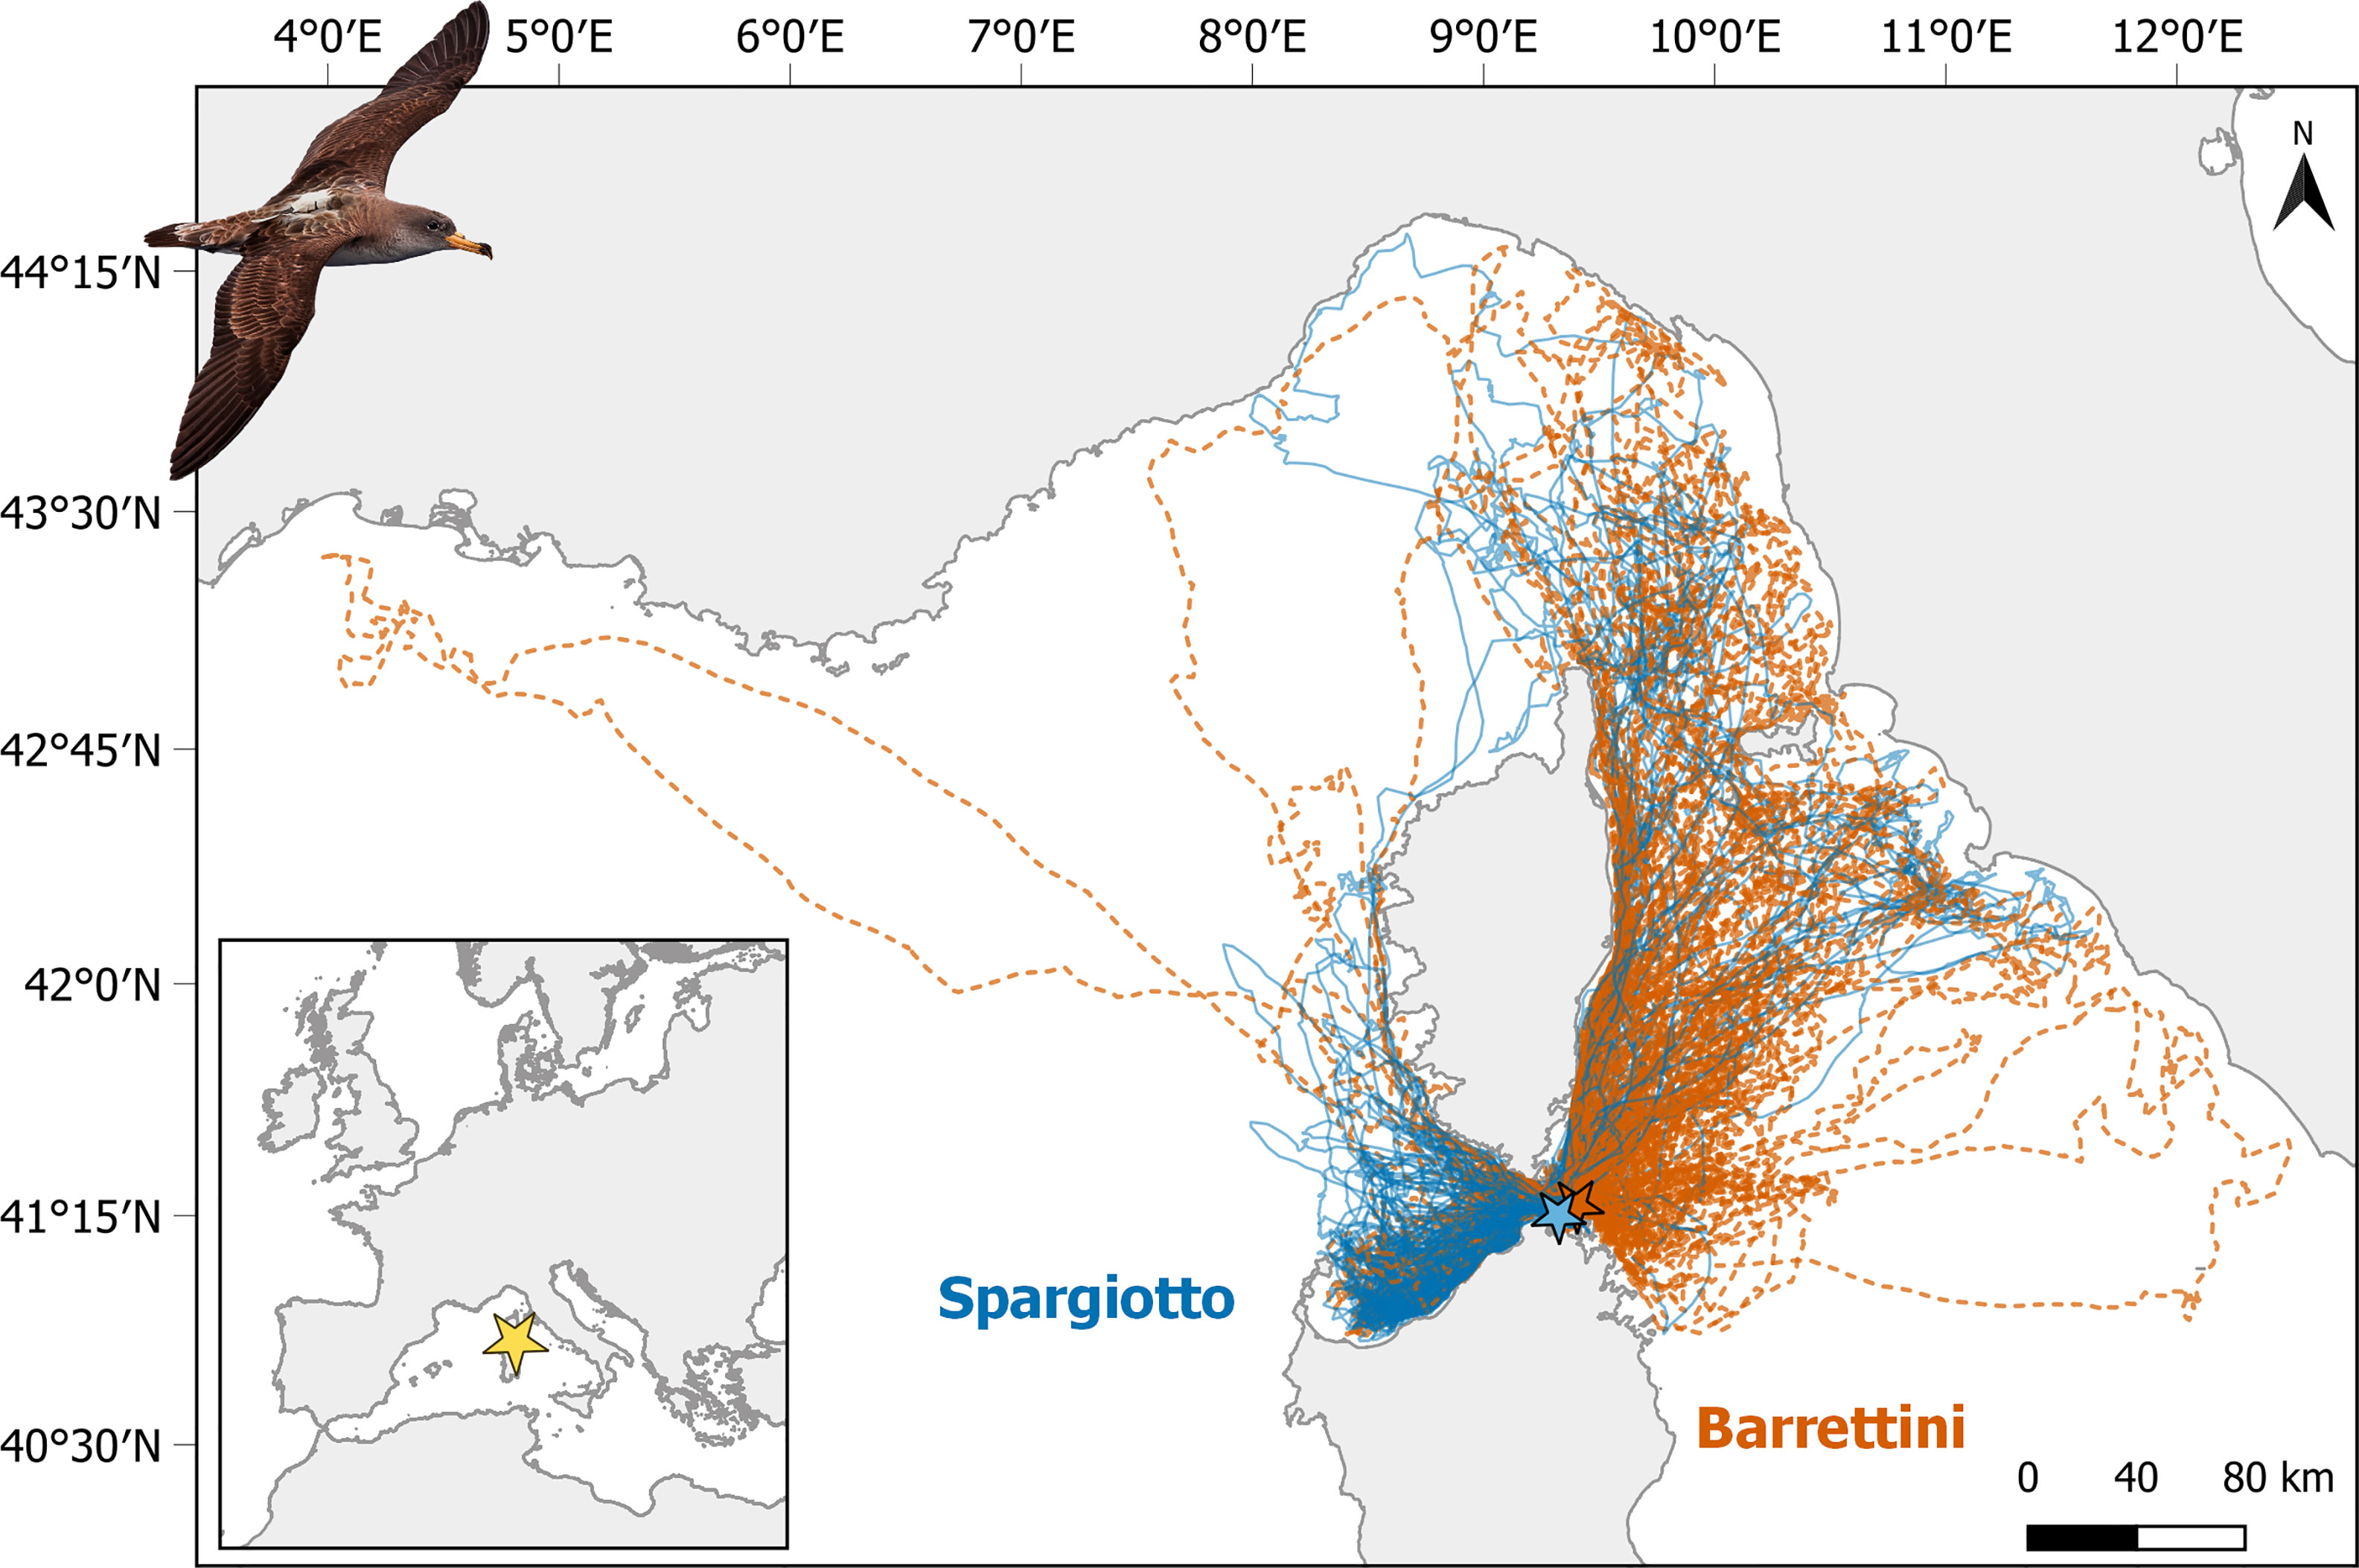
Figure 1 Tracks of foraging trips performed by Scopoli’s shearwaters breeding in Spargiotto (solid blue lines) and Barrettini (dashed orange lines) islets in La Maddalena archipelago (Sardinia) in 2013, 2018 and 2019. See Figure S6 for the separation of trips by year. Picture of tagged Scopoli’s shearwater courtesy by Mirko Ugo.
GPS Deployment
During early chick-rearing period, the parent attending the nest was captured during night-time directly in its nest, ringed with a metal ring or identified if already ringed, and equipped with a GPS logger attached on the back feathers (see De Pascalis et al., 2020 for more details). The GPS loggers were set to record a position every 10 min. Similarly to De Pascalis et al. (2020), we removed positions within 5 km from the sub-colony. We relied on manual foraging trip identification for 2013 (from Cecere et al., 2014), considering a foraging trip as an at-sea excursion lasting more than five hours, starting and ending at the colony. For 2018 and 2019, we followed the same method as in De Pascalis et al. (2020), and automatically identified foraging trips following Lascelles et al. (2016) and its tripSplit function, considering only trips lasting at least 5 hours, with inner-and outer buffers of 5 and 20 km respectively. We ensured the correct discrimination by visually inspecting each foraging trip in QGIS (v.3.16.10, QGIS.org, 2022). Overall, we relied on data from 32 individuals tagged in 2013, 44 in 2018, and 15 in 2019; 16 individuals were tracked in two years and one individual in three years. Sex-ratio (proportion of females) was well balanced in all years and sub-colonies (0.50 on average, range: 0.41-0.63). See Table S1 for a detailed description of sample size per year, sex, and sub-colony.
Computation of Home Ranges and Selection of Foraging Trips
The entire statistical procedure is described in detail in Figures S1, S2. The first step consisted in deriving Kernel Density Estimates (KDEs), as this allowed then (1) to test whether individuals are site-faithful across trips and years and thus for us to retain only independent trips, (2) to test whether there is spatial and temporal heterogeneity in the spatial data, (3) to derive ICAs, i.e., delineate areas within the KDEs that most of the tracked population uses and so is deemed important for the whole population. All analyses were performed in R v4.1.0 (R Development Core Team, 2021), with functions from the R package track2KBA (Beal et al., 2021b).
For all subsequent analyses, we considered both 50% and 75% Kernel Density Estimates (KDEs). The choice of 50% KDEs (i.e., the smallest area on which the probability of finding an individual is 50%) was driven by the fact that this level best represents the core areas of activities for our population of Scopoli’s shearwaters (see Figure S3, following BirdLife International, 2009) and is the usual level used when proposing conservation areas (Beal et al., 2021b). However, we also used 75% KDE as this may lead to more unified (i.e., less divided) ICAs than 50% KDEs (see Discussion), and it might be advisable to focus not only on the core areas of activities (typically related to foraging areas) but also areas used for travelling back-and-forth from the colony and those used for rafting. All KDEs were derived at the trip level, with the smoothing factor href (determined using the tripSummary and findScale functions; see Table S2 for the values href found for each sub-sample), and a resolution of 0.75 km. As already discussed in (Beal et al. 2021b), the choice of smoothing factor and resolution is crucial as these will affect the size and the precision of the KDEs and ICAs. It is thus important to select them based on the biology of the species and the aim of the conservation actions. Here, we chose href (instead of the mag value provided by the findScale function for instance) because our aim was to derive ICAs encompassing not solely foraging sites, but any important area used by shearwaters for foraging, resting, and travelling. This is also why we retained all sampled locations (and not only the ones corresponding to foraging behaviour; except locations within 5 km of the colony, to release some of the emphasis on the colony for this central place forager). We chose a resolution of 0.75 km based on preliminary analyses and graphical assessment (see Figure S4): this resolution precisely enough fit shearwaters’ movements here, while limiting computational time.
We initially relied on 397 foraging trips performed by 73 individuals. We first tested if, for a given year and sub-colony, individuals were faithful to foraging sites as this would lead to autocorrelation among consecutive foraging trips of a same individual (function indEffectTest). In all but two combinations of years and sub-colonies, individuals showed site fidelity across foraging trips (p > 0.1 for Barrettini in 2013 and 2019, with both 50% and 75% KDEs; p < 0.003 for all other cases). We thus down-sampled trips until site fidelity was no longer significant: we retained either all trips (Barrettini in 2013 and 2019), every second trip (Spargiotto in 2019), every third trip (Barrettini in 2018), every fourth trip (Spargiotto in 2018), or only one trip per individual (Spargiotto in 2013). Since some individuals were tracked in more than one breeding season, we ensured that individuals were not site faithful across years. To do so, we followed the same principle as the one proposed in the indEffectsTest function. We estimated, separately for each individual sampled several years (N=17), the overlap between its KDEs derived at the trip level and differentiated between and within year overlaps. We then combined the overlap values of all 17 individuals and compared between and within year overlaps with a bootstrap Kolmogorov-Smirnov test (1000 iterations, p > 0.07). This allowed us to consider the foraging trips performed in different years as independent. In the end, we analysed 199 foraging trips, performed by 91 unique individual-year entities.
Detecting Spatial and Temporal Heterogeneity
To detect spatial heterogeneity, we tested whether individuals breeding in the two sub-colonies spatially segregated while foraging at sea, to assess the need of implementing the rest of the analyses at the sub-colony level. We used the function indEffectTest to test whether within- and between-sub-colony overlaps of individual KDEs were different. We expected here the within-sub-colony overlaps to be significantly greater than between-sub-colony ones, which would indicate that the area used by individuals (i.e., KDEs) from the same sub-colony were more similar than areas used by individuals from different sub-colonies. We performed this test for each year separately. To detect temporal heterogeneity, we used the same method and tested whether within- and between-year overlaps of individual KDEs were different. We performed this test for each sub-colony separately.
Deriving ICAs
We identified ICAs following the methodology initially developed by Lascelles et al. (2016), and recently improved by Beal et al. (2021b). This approach implied three steps (see Figures S1, S2 for a graphical summary). First, based on this restricted dataset (i.e., with down-sampled independent trips) we aimed to identify KDEs at the foraging trip level (function estSpaceUse). Second, we ensured that sampled individuals were representative enough of their sub-colony by assessing the representativeness of the samples from each year and each sub-colony separately using the function repAssess and the KDEs (with 600 iterations, because the stability of estimates was reached from this number onwards for the smallest sample size, see Figure S5). Third, we identified ICAs with the findSite function, which delineates areas that are used by a certain percentage (at least 10%) of the tracked individuals given the location of the KDEs, and so are deemed important for the whole population. This percentage is given by the argument ‘thresh’ in the findSite function. Here, we retained the default value for ‘thresh’, which adapts the percentage threshold depending on the representativeness of the sample (20% threshold for 70-80% representativeness, 12.5% threshold for 80-90% representativeness, and 10% for representativeness above 90%; see Appendix S1 in Lascelles et al., 2016; Beal et al., 2021b). We chose not to provide a total population size for the function findSite, as this parameter is only used for visualizing the number of individuals in the entire population predicted to use the identified ICA (instead of the default percentage of the tracked population). In other terms, the choice of population size does not affect in any way the contour of the ICA itself, which was the object of focus here. We could then extract the contour of the ICAs (Figure S2). This 3-step procedure – deriving KDEs, assessing representativeness, and deriving ICAs – was applied for each year and each sub-colony separately given the presence of spatial and temporal heterogeneity in foraging areas (see previous paragraph and results).
Comparing ICAs Across Sub-Colonies and Years
The function indEffectTest applied to individual KDEs (paragraph 2.5) allowed to test for the presence of spatial and temporal heterogeneity in foraging sites. Yet, whether these differences in overlaps of KDE within and between sub-colonies or years (see results) cascade to actual low overlap of ICAs (i.e., the parts of the KDEs supposedly used by the majority of the population), between sub-colonies or years, remained to be explored. Our first aim was then to quantify potential differences in ICAs resulting from accounting for a single sub-colony (spatial heterogeneity) or a single year (temporal heterogeneity). To quantify differences due to spatial heterogeneity, we estimated, for a given year, the overlaps between ICAs of both sub-colonies (e.g., Barrettini vs. Spargiotto in 2013). To quantify differences due to temporal heterogeneity, we estimated, for a given sub-colony, the overlap between ICAs obtained for different years (e.g. 2013 vs. 2018 for Barrettini). The proportion of overlap Overlapi,j between pairs of ICAs (i, j) was estimated as:
A referring to the areas of the ICAs of i or j, their intersection (i∩j), and their union (i∪j).
Does Appropriately Accounting for Spatial and Temporal Heterogeneity Really Make a Difference?
Our second aim was to propose a method to derive a single and reliable ICA while accounting for the spatial and temporal heterogeneities in the data (method A) and show why this is better than ignoring these heterogeneities (method B). Once one has sampled several years and/or multiple sub-colonies, one can identify a global ICA by either (A) merging the areas found for each year and sub-colony separately, or (B) directly identifying an ICA from the larger dataset comprising all years and sub-colonies (i.e., not accounting for possible temporal or spatial heterogeneity). We compared then the differences in total areas and the overlap between the ICAs obtained with these two (A, B) alternative approaches, 1) for each year, pooling both sub-colonies, 2) for each sub-colony, pooling the three years, and 3) for the three years and both sub-colonies pooled.
Results
Spatial and Temporal Heterogeneity
Considering the tracks of each foraging trip (Figures 1 and S6), there was a clear segregation of used areas between individuals breeding in the two sub-colonies: individuals from Spargiotto moved mostly south-west of the colony, while individuals from Barrettini moved towards north-east. Accordingly, overlap of KDEs was greater within than among sub-colonies (p < 0.001 for each year and both for 50% and 75% KDEs). In other words, individuals breeding in the same sub-colony used more similar areas during foraging trips than individuals breeding in different sub-colonies. Overlap of KDEs was also greater within than among years for individuals breeding in Spargiotto (at least for core areas: p < 0.001 for 50% KDE, and marginally for larger areas: p = 0.07 for 75% KDE). Yet, this was not the case for individuals breeding in Barrettini (p > 0.5 for both 50% and 75% KDEs). Given this spatial and (partially) temporal heterogeneity in the spatial data, we implemented the rest of the analyses for each sub-colony and year separately.
Samples’ Representativeness for ICA Derivation
Representativeness was generally high (Table S3), and above 72% for all the year- and sub-colony specific sub-samples, except Spargiotto in 2019 when considering 50% KDEs. This latter sample, which was the smallest of all years and sub-colony combinations (Table S1), reached only 45.9% of representativeness and was thus discarded for the subsequent corresponding ICA estimations. Foraging trips from Spargiotto in 2019 were still considered for ICAs estimation based on 75% KDE (with a representativeness of 72.8%).
Comparing ICAs Across Sub-Colonies and Years
In accordance with the significant spatial and temporal heterogeneity found in section 3.1, the overlap between ICAs from different sub-colonies or years was rather low (below 0.5; Figure 3). In particular, the overlap between ICAs of the two sub-colonies was low each of the three years, whether considering ICAs based on 75% KDE (Figures 2, 3) or ICAs based on 50% KDE (Figures S7 and 3). ICAs’ shape and location were rather different for each of the three years of the study, and this was particularly striking for 2019 compared to the other years (Figures 2 and S7). Accordingly, the overlap between ICAs from different years were relatively low (Figure 3): from 0.16 to 0.49 for ICAs based on 75% KDE, and from 0.01 to 0.40 for ICAs based on 50% KDE.
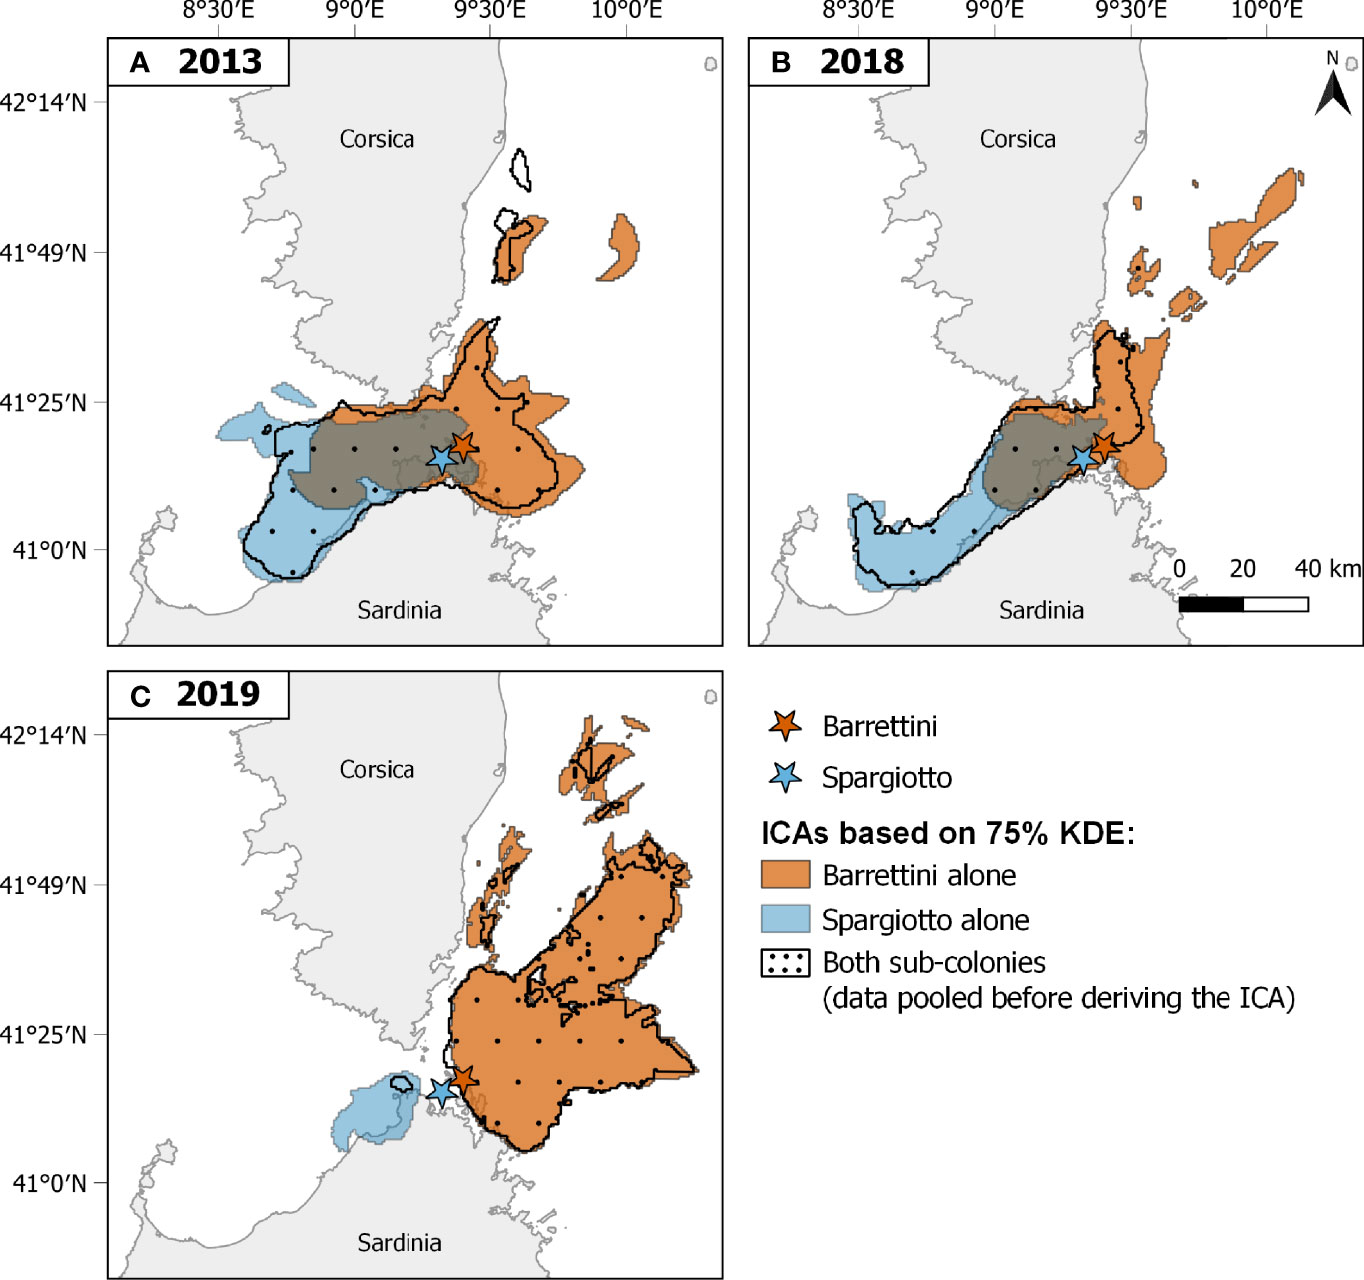
Figure 2 Important Conservation Areas (ICAs) identified for both sub-colonies and years separately (A: 2013, B: 2018, C: 2019). ICAs correspond to areas, within the trip-level 75% Kernel Density Estimates, that are used by a certain percentage of the tracked population, and so are deemed important for the whole population (see main text). ICAs are represented by blue areas for Spargiotto, orange areas for Barrettini, and black-dotted areas when ignoring within-colony spatial heterogeneity (i.e., combining data from both sub-colonies before deriving ICAs). Colored stars indicate locations of the corresponding sub-colonies. Sample size of foraging trips considered: Spargiotto: 17 in 2013, 48 in 2018, 10 in 2019; Barrettini: 21 in 2013, 39 in 2018, 64 in 2019.
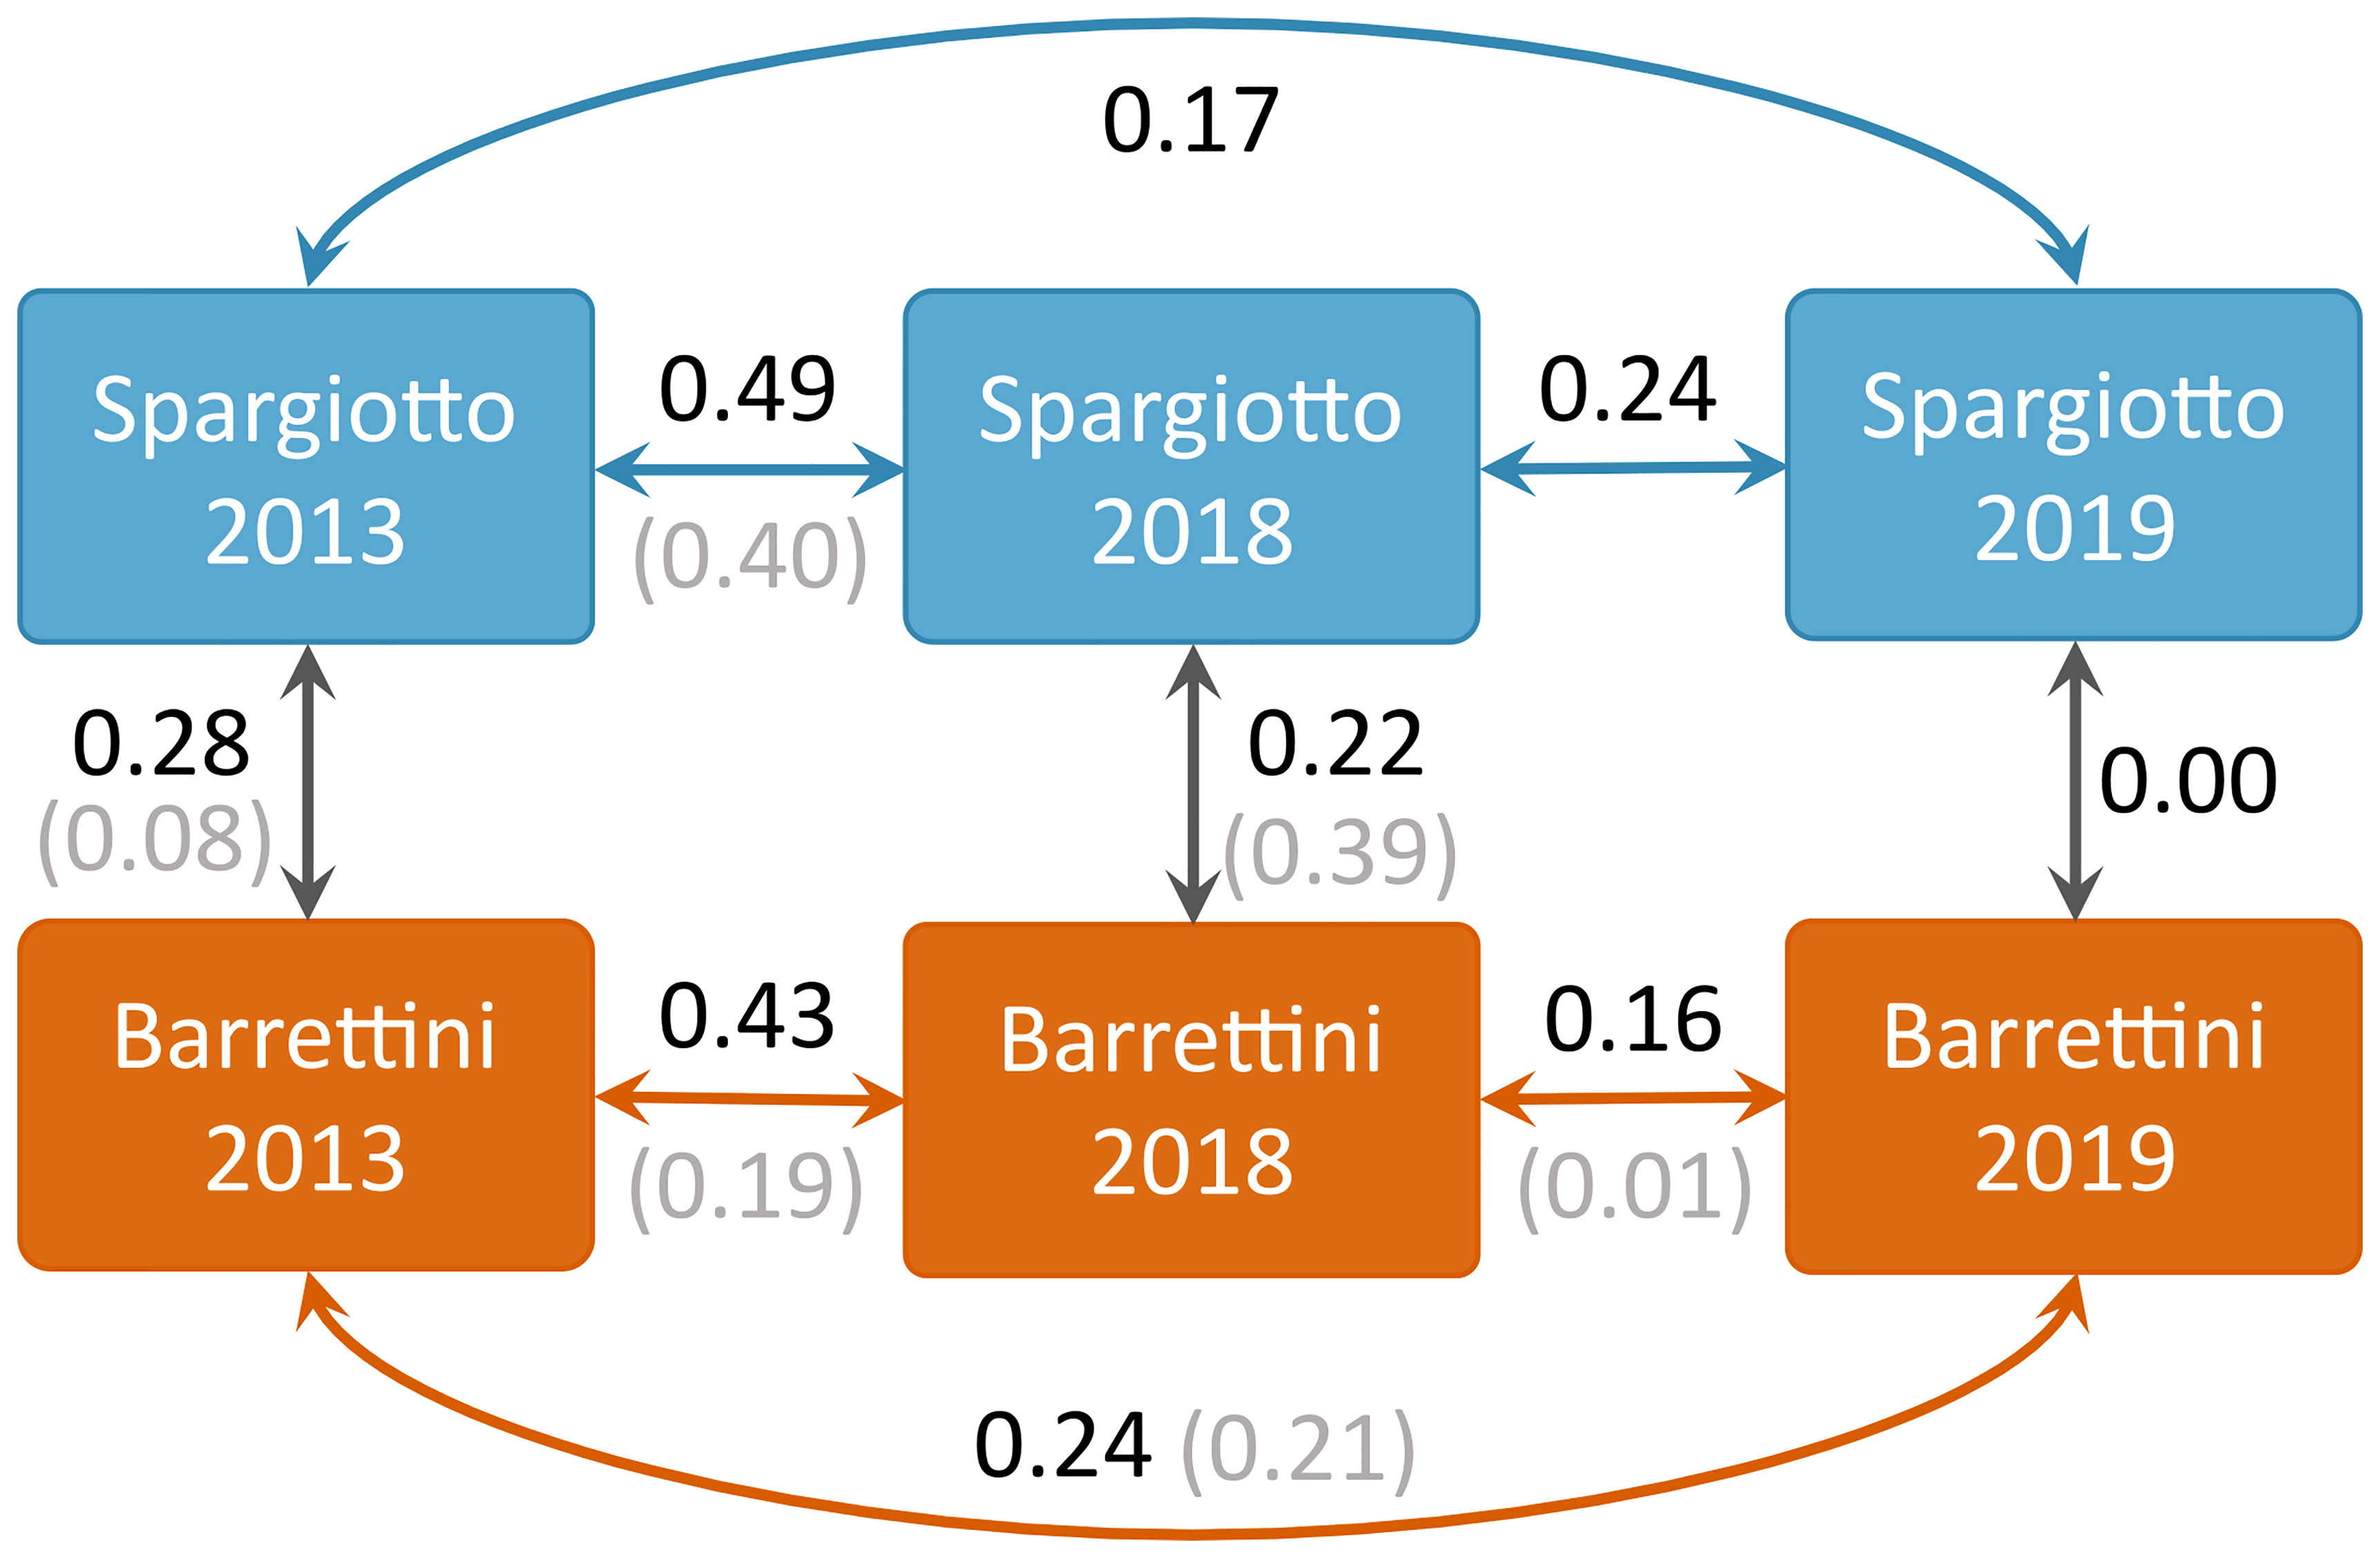
Figure 3 Overlap values between ICAs derived for different sub-colonies and years. Values in black correspond to ICAs based on 75% KDEs, while values in grey (in parentheses) correspond to ICAs based on 50% KDEs.
Does Appropriately Accounting for Sub-Colony- and Year-Related Heterogeneity Really Make a Difference?
Combining data from different sub-colonies and/or years before deriving ICAs (method B) usually led to smaller ICAs than when merging the ICAs obtained for these years and/or sub-colonies (method A; Table 1; Figures 2, 4, S7 and S8). These differences were particularly striking when ignoring both the spatial and temporal heterogeneity: pooling data from both sub-colonies and all years led to ICAs that were more than 70% smaller than when merging the ICAs from each of the sub-colonies each year (Figures 4C, S8C and Table 1). One exception was the comparison of ICAs based on 50% KDEs for both sub-colonies in 2013: the area obtained by merging the ICAs of Barrettini and Spargiotto was 16% smaller than the ICA obtained by pooling initial data (Table 1). Yet, this peculiarity did not hold for ICAs based on 75% KDEs (Table 1). In 2019, the number of foraging trips from individuals of Spargiotto was so low compared to Barrettini (10 versus 64 trips) that the potential ICA derived from data of Spargiotto only was almost not represented at all when combining both sub-colonies (Figure 4C).
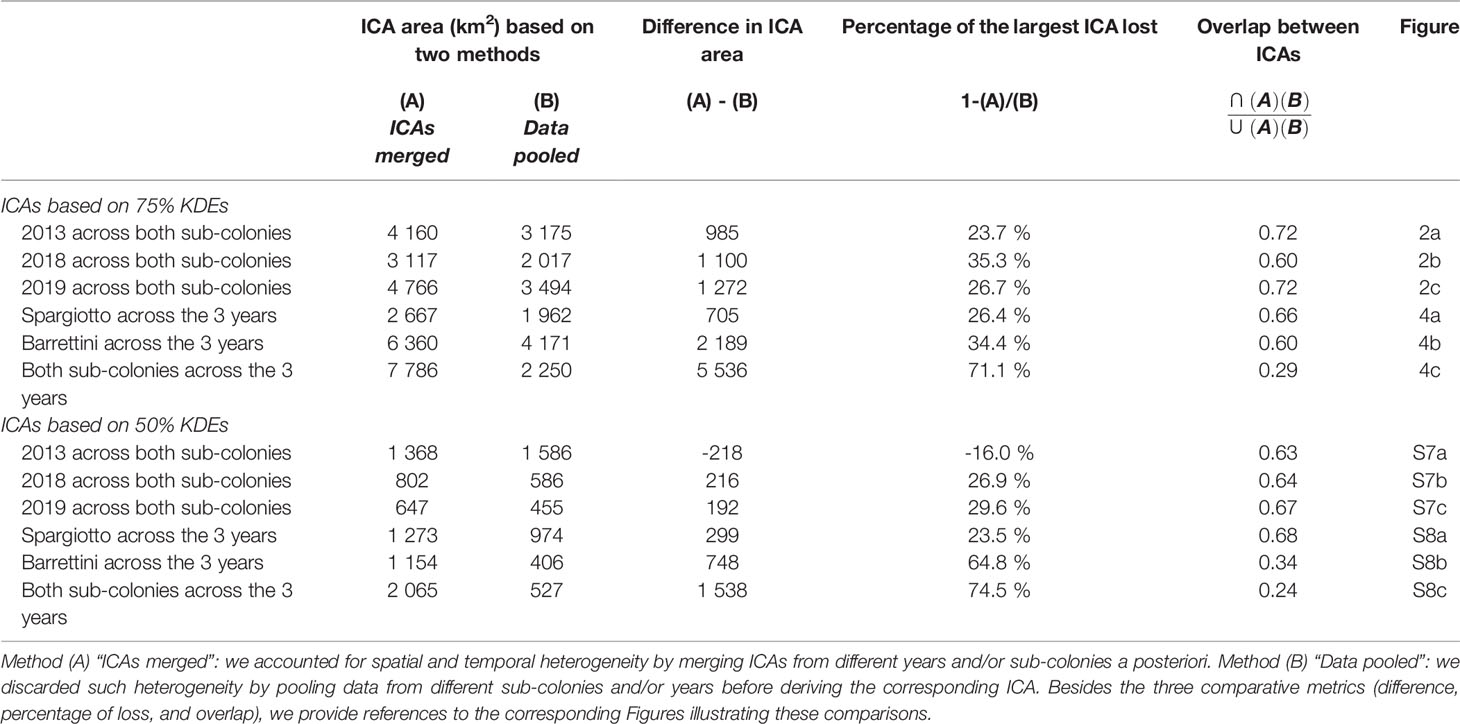
Table 1 Comparison of ICAs when accounting or not for spatial and temporal heterogeneity in the dataset.
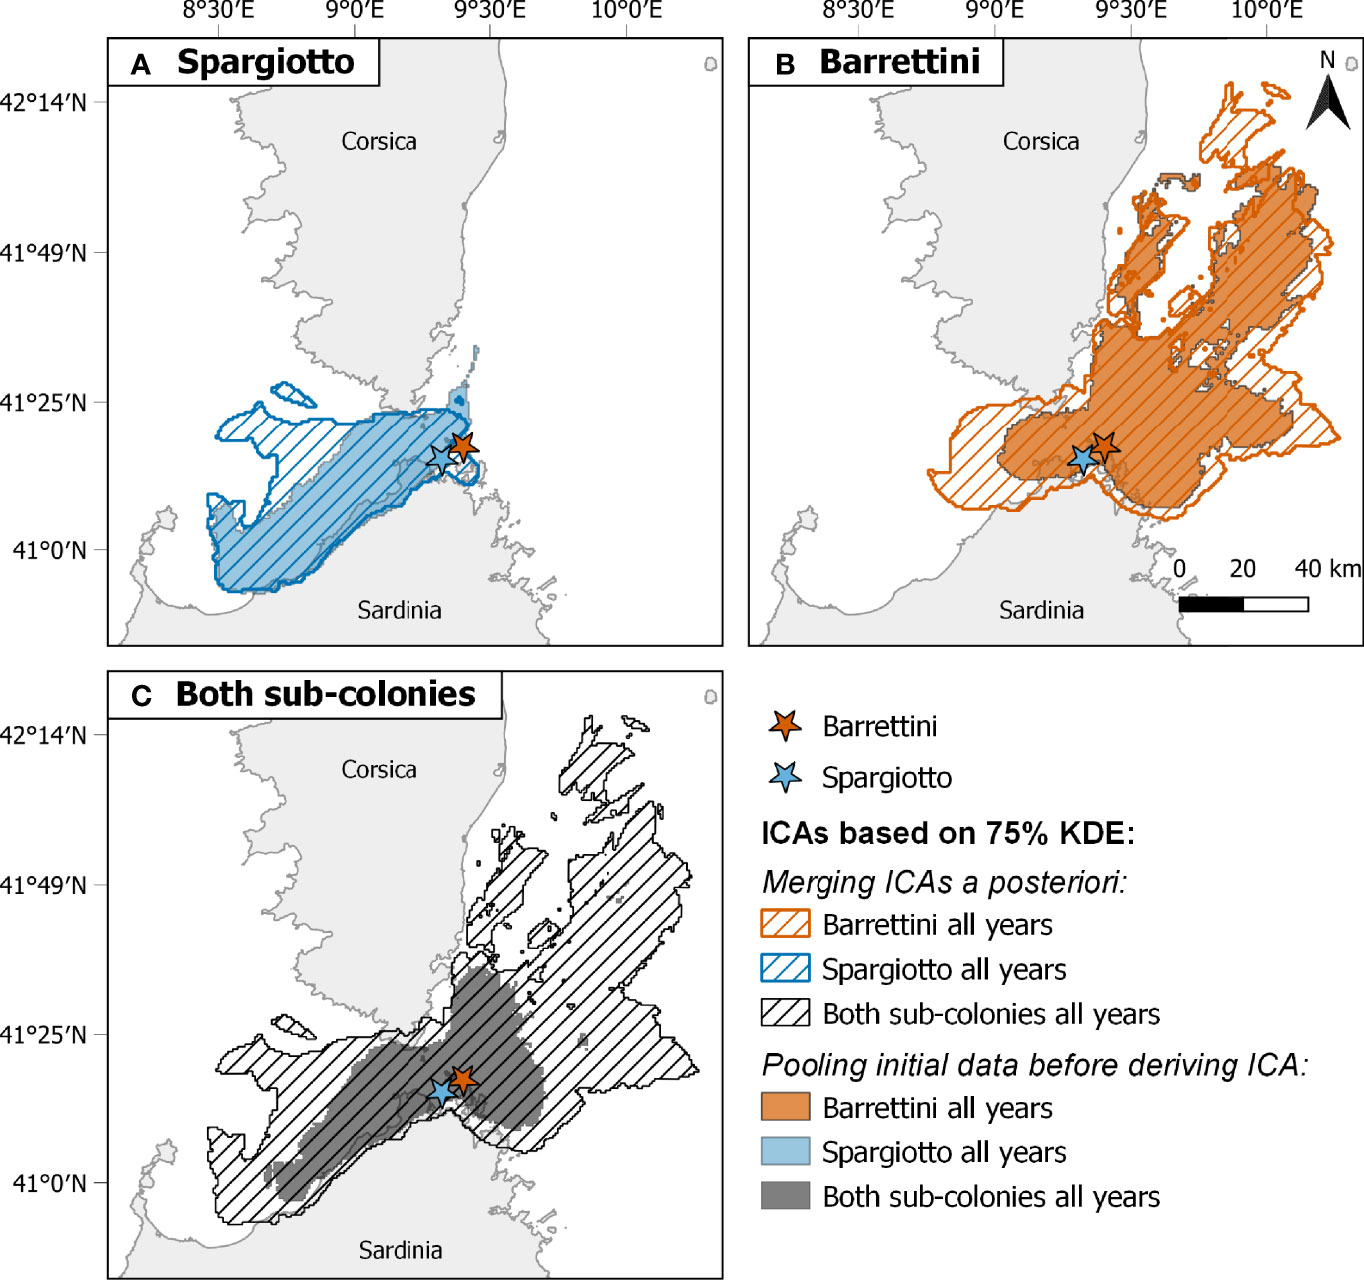
Figure 4 Comparison of among-year and between-sub-colony Important Conservation Areas identified with two different methods: merging a posteriori ICAs derived from different years and/or sub-colonies (dashed areas) or pooling data before deriving a single corresponding ICA (filled areas). Comparisons are shown for (A) Spargiotto, (B) Barrettini, and (C) both sub-colonies. ICAs are based here on 75% Kernel Density Estimates. Sample size of trips considered: 75 for Spargiotto, 124 for Barrettini.
Discussion
The main challenge when deriving ICAs from tracking data is to obtain individual at-sea distributions that are representative, both in time and space, of the rest of the population. This implies to collect data over multiple time-steps (to account for temporal heterogeneity in at-sea distribution, here across years) and, for colonial breeders, which tend to spatially segregate in response to intraspecific competition, to collect data from individuals breeding in different parts of the colony. While spatial and temporal heterogeneity in at-sea distribution received recent attention, to what extent they may affect the location and size of ICAs and how to appropriately account for these effects remained to be explored. Here, we found that Scopoli’s shearwaters breeding in two neighbouring islets spatially segregated while foraging at sea: those breeding in the western most islet foraged mostly south-west of it, while individuals breeding in the eastern islet foraged mostly towards north and east. This segregation of foraging grounds at a small spatial scale (few kilometres, while these birds forage hundreds of kilometres away from their nest) complements the growing body of literature showing similar patterns (Hipfner et al., 2007; Masello et al., 2010; Bogdanova et al., 2014; Kuhn et al., 2014; Waggitt et al., 2014; Ceia et al., 2015; Sánchez et al., 2018; Ito et al., 2020; Pereira et al., 2022). The areas used (as measured by KDEs) by members of one sub-colony differed across years. As a result, the overlaps between ICAs implemented per year and sub-colony were relatively low (from 0 to 0.49 overlap). We also highlighted that merging ICAs obtained for each year and sub-colonies (method A) resulted in larger ICAs than when ignoring such spatial and temporal heterogeneities in the tracking dataset (method B). We discuss the importance to dynamically account for these and other sources of heterogeneity in tracking data when aiming at deriving sound conservation areas in a changing world.
Obtaining Robust ICAs
We showed that sampling only one year, only one sub-colony, or simply not accounting for spatial and temporal heterogeneity in large multi-scale datasets led to a very partial representation of ICAs, especially so when sample sizes greatly differed across groups. For example, in 2019, we obtained only 10 foraging trips for Spargiotto and 64 for Barrettini after accounting for foraging site fidelity and removing correlated trips. These 10 and 64 foraging trips were representative enough of their sub-colony to derive ICAs (72.8% and 94.3% representativeness respectively when considering 75% KDE). When ignoring the spatial heterogeneity and deriving an ICA on the 2019 dataset (method B), we obtained an ICA (based on 75% KDE) encompassing nearly the entire ICA found for Barrettini alone, and almost none of the ICA found for Spargiotto alone (Figure 2C). In 2013, when sample sizes were more balanced across sub-colonies, we did not find this effect (Figure 2A). When sample sizes differ across groups (sub-colony and year here, but it could be sex for example), we advise to merge ICAs derived for the different groups, as it allows for usually more extended and representative ICAs. Indeed, up to 75% of the ICAs area was lost when not accounting for these sources of heterogeneity, biasing the location of ICAs toward those found in years or sub-colonies with the most foraging trips. In only one occasion, the ICA derived by pooling initial data was larger than the ICA obtained by merging group-specific ICAs (Table 1, Figure S7A). Surprisingly, this larger ICA also included an area just north of Barrettini, which was not included in any of the sub-colony or year-specific ICAs (based on 50% KDE), and in that respect may not be that relevant conservation-wise if only a minority of the tracked breeders used it each year (less than 10%, the chosen minimum threshold for ICA definition here). The methodology we propose, by allowing the derivation of reliable ICAs from unbalanced sample sizes, should be of broad use for most conservation actors, which often do not have access to spatially and temporally balanced samples. Another possibility to account for spatial heterogeneity in the data is to use a predictive modelling approach, when individuals are known to select similar physical habitat features when foraging (e.g., similar bathymetry, Ceia et al., 2015), an hypothesis that would remain to be tested across different sub-colonies.
Testing for within-colony spatial heterogeneity is a fundamental step before planning any conservation action, but this may be far from easy. The main obstacle for such investigation is practical: it can be highly challenging to capture and tag wild animals at their natural breeding sites. For example, not all breeding sites, beaches, or cliffs might be accessible, and/or one might focus on individuals located at the edge of a colony to minimize disturbance to the rest of the group. In that respect, the Scopoli’s shearwater colony studied here is ideal: pairs breed in well separated burrows between rocks on the ground, distant from each other by few meters, in easily accessible islands. As in previous studies (Bogdanova et al., 2014), we advocate whenever possible to collect spatial data from various locations of the colony, to be able to generalize the detected exploited areas. Yet, if collecting spatial data from several parts of a colony is not feasible, we propose several other options. For example, if individuals tend to follow the route taken by conspecifics when departing from the colony or closely located rafts (Weimerskirch et al., 2010; Thiebault et al., 2014), observing the departure and returning angles of individuals from different sub-colonies might inform on the possibility that members of different sub-colonies segregate at sea. If one can only sample one part of a colony but knows its extent, it is possible to use a modelling approach to test for spatial segregation. Indeed, one can test whether the observed distribution corresponds to that of simulated tracks ignoring between-sub-colony competition for example (Ito et al., 2020), or, on the contrary, whether the observed distribution is biased towards one area, away from the rest of the colony (similar to colony-level simulations in Aarts et al., 2021). If spatial segregation of foraging grounds is then suspected, care should be taken when deriving ICAs. The combination of accurate resource availability maps and modelling approaches accounting for competition between- but also within-colonies (e.g. Wakefield et al., 2011; Aarts et al., 2021), with a back-up verification on existing spatial data, may open exciting perspectives for accurately deriving ICAs from partial datasets.
Temporal Heterogeneity: Conservation in a Changing Environment
Our results highlight the importance of dynamic placement of ICAs given that environmental changes affect the distribution of the sentinel species and their prey (Perry et al., 2005; Poloczanska et al., 2016; and see Cashion et al., 2020 for a torough discussion on the importance of dymamic ICAs in marine ecosystems). Indeed, we observed among-year differences in the areas exploited by Scopoli’s shearwaters from La Maddalena Archipelago, which is not surprising given their foraging habits. Scopoli’s shearwater feed mostly on plankton and small pelagic fishes (Grémillet et al., 2014), two resources whose distribution can vary between years (Marty et al., 2002; Saraux et al., 2014). Shearwaters also exploit discards from fishing vessels (Cecere et al., 2015; Cianchetti-Benedetti et al., 2018), whose locations are naturally dynamic and rather stochastic (changing within few minutes or hours) compared to the temporal scale of shearwaters foraging trips (1-20 days, Cecere et al., 2014). Yet, Scopoli’s shearwater breeding in the eastern sub-colony showed no significant difference in used areas (KDE) across the three studied years, unlike individuals breeding in the western sub-colony. One hypothesis could be that resources in the northern and eastern part of the colony were more stable across years than those located west, yet we unfortunately do not have any empirical evidence to formally test that. Other populations of the same species also showed both consistency (Grémillet et al., 2014) and differences (Courbin et al., 2018) in the areas exploited across years, which may suggest either a stochastic effect of the sampled year, or geographical differences in resources availability. Such discrepancies among populations also highlight the importance of testing for temporal and spatial heterogeneities when multi-year or sub-colony data are available, and not solely rely on findings from other populations or years. It is to be noted that we exclusively used data from the chick-rearing stage, and not from the incubation stage, because individuals are more spatially constrained when they must combine self-feeding with regular trip to the colony to provision offspring.
Among-year differences in exploited areas may arise from environmental stochasticity and longer-term environmental changes. Long-term investigation of variation in foraging behaviour in seabirds are still scarce, but one striking example, which also investigates sub-colony segregation, is the 15-year study of European shags in Scotland (Bogdanova et al., 2014). This study also provides a methodological framework enabling to test how many years are necessary to accurately represent the population-wide used areas. Our approach here that complements that previous study, shows how to best account for temporal heterogeneity when one does not have access to enough data to fully and certainly represent the population at-sea distribution (yet with representative enough within-year sub-sample). With three years of data and slightly contrasting sample sizes (Table S1), we cannot exclude that the observed temporal heterogeneity is the results of stochasticity. Yet, longer term datasets will certainly become more common in the coming years and will allow for a thorough assessment of longer-term temporal heterogeneity and account for that when deriving ICAs.
Other Sources of Heterogeneity
Our study focused on the effect of sub-colony and temporal heterogeneity in the implementation of ICAs. Yet, spatial segregation can also occur between sexes (Catry et al., 2006), age classes (Pelletier et al., 2014; Haug et al., 2015; Pettex et al., 2019), or personality types for example (Krüger et al., 2019). Here, the sex-ratio in our sample was well balanced (0.5 on average), and sampling was performed randomly regarding individuals’ age and personality (random selection of individuals among the captured ones). Depending on the population or species, any source of heterogeneity can be accounted for with the same procedure as the one proposed here (see Figure S1 for a summary).
One aspect that should also be considered is the focus of the conservation actions: either on the foraging areas exclusively, or on any exploited areas, even the ones used for travelling between patches or rafting. Here, we chose to rely on any used areas (i.e., all GPS positions obtained, whether they corresponding to foraging, travelling, or resting events), which led to a specific emphasis really close to the colony (Figures 2, 4, emphasis reduced by the withdrawal of locations within 5 km of the colony, see methods). This was motivated by the fact that shearwaters may suffer from disturbance both while foraging and travelling (e.g., Rodríguez et al., 2015; Dierschke et al., 2016; Genovart et al., 2018). Yet, depending on the species and the conservation context, it is possible to select only specific locations (e.g., foraging vs. non-foraging, core-foraging areas vs. home-range). We therefore focused on ICAs based on 75% KDE (larger scale used areas), but nonetheless compared them to ICAs based on 50% KDE (considered as core used areas) which are more classically used. The ICAs based on core used areas (50% KDE) were naturally smaller than ICAs based on larger used areas (75% KDE) but they were also interestingly more divided (see Figure S9 for a graphical representation of these ICAs). ICAs based on larger used areas enabled to integrate corridors of movement between core used areas (as typically seen in Spargiotto in 2018 or Barrettini in 2019, Figure S9). Therefore, for conservation actions aiming at preserving any used sites, 75% KDE might lead to more ecologically relevant ICAs.
Our study system also exemplifies the importance of deriving reliable ICAs in international contexts (here Italy and France, see also for instance Beal et al., 2021a; Davies et al., 2021), which may imply international agreements, and, here, would require a careful assessment of foraging distribution of individuals breeding in the nearby Lavezzi archipelago. Furthermore, we focused here on one species. Yet, using data from other species sharing the same foraging habitats (for instance here Yelkouan shearwaters Puffinus yelkouan) would also constitute a critical step to apply conservation actions benefiting multiple species.
Conclusion
In the context of the current biodiversity crisis, it is crucial to derive efficient tool to protect ecosystems. Yet, individual or population behavioural differences can impair the efficacy of protected areas. To derive sound conservation areas from GPS tracking data, it is essential to account for the fact that the precise individuals we sampled, at that precise moment, might not necessarily be representative of the whole target population. We show here that accounting for within-colony spatial segregation, as well as seasonal differences in foraging site selection, is key to derive ecologically representative ICAs. Besides adding to the growing body of evidence of spatial segregation at the sub-colony level, our study provides a practical and comparative guideline on how to best account for inherent heterogeneity when aiming to derive ICAs. The use of recently developed standardized statistical procedures (Beal et al., 2021b), combined with such careful consideration of the species ecology and population structure, should help improving the conservation of (marine and terrestrial) ecosystems. The growing evidence of small-scale spatial segregation also raise fascinating ecological questions regarding the biological meaning of the distinction between colonies and sub-colonies, as well as the mechanisms behind such small-scale spatial segregation. While beyond the scope of this study, answering these questions will greatly contribute to the understanding of such spatial pattern and thus improve the conservation actions taken to protect colonial species. Considering the human-induced threats posed to the environment, future studies and predictions will be essential to adapt the current tools to rapidly changing ecosystems, in which species, populations, and individuals differ in plasticity and adaptability.
Data Availability Statement
The tracking data are available in the BirdLife Seabird Tracking Database (http://www.seabirdtracking.org/).
Ethics Statement
Capture, handling, ringing and tagging procedures were performed by the Italian Institute for Environmental Protection and Research (ISPRA), under the authorization of Law 157/1992 [Art.4(1) and Art 7(5)], which regulates research on wild bird species. We were granted permission to access and work on the islets by the Parco Nazionale dell’Archipelago di La Maddalena under the agreement made with ISPRA. The authors assert that all procedures contributing to this work comply with the ethical standards of ASAB/ABS guidelines for the fair and ethical treatment of animals in behavioural research.
Author Contributions
JM and JC conceived the presented idea. JM, DR, SI, and JC contributed to conception and design of the study. FP, CC, AB, and JC collected the data. FP, AB, SI, and JC prepared the data and made preliminary analyses. JM performed the statistical analyses, wrote and revised the manuscript. All authors contributed to manuscript revision, read, and approved the submitted version.
Funding
JM was funded by a postdoctoral grant from ISPRA and a Marie Skłodowska-Curie Individual Fellowship from the EU’s Horizon 2020 Research and Innovation Program (grant no. 895904). FP was funded by a PhD scholarship from University of Milan. Funding for Open Access publishing were provided by NTNU and its agreement with Frontiers journals.
Conflict of Interest
The authors declare that the research was conducted in the absence of any commercial or financial relationships that could be construed as a potential conflict of interest.
Publisher’s Note
All claims expressed in this article are solely those of the authors and do not necessarily represent those of their affiliated organizations, or those of the publisher, the editors and the reviewers. Any product that may be evaluated in this article, or claim that may be made by its manufacturer, is not guaranteed or endorsed by the publisher.
Acknowledgments
We are grateful to Alessandro Mazzoleni, Simona Picardi, Antea Portanova, Giulia Masoero, Luca Ilahiane, Federica Ferrario, Simone Pirrello, Elisa Colombo and Stefano Podofillini for help during fieldwork. We thank the Parco Nazionale dell’Arcipelago di La Maddalena and particularly Yuri Donno, Antonella Gaio and Mirko Ugo for the logistic information and support.
Supplementary Material
The Supplementary Material for this article can be found online at: https://www.frontiersin.org/articles/10.3389/fmars.2022.854826/full#supplementary-material
References
Aarts G., MacKenzie M., McConnell B., Fedak M., Matthiopoulos J. (2008). Estimating Space-Use and Habitat Preference From Wildlife Telemetry Data. Ecogr. 31, 140–160. doi: 10.1111/j.2007.0906-7590.05236.x
Aarts G., Mul E., Fieberg J., Brasseur S., Gils J. A., Matthiopoulos J., et al. (2021). Individual-Level Memory Is Sufficient to Create Spatial Segregation Among Neighboring Colonies of Central-Place Foragers. Am. Nat. 198, E37–E52. doi: 10.1086/715014
Acevedo-Whitehouse K., Duffus A. L. J. (2009). Effects of Environmental Change on Wildlife Health. Philos. Trans. R. Soc. B. Biol. Sci. 364, 3429–3438. doi: 10.1098/rstb.2009.0128
Afán I., Navarro J., Grémillet D., Coll M., Forero M. G. (2019). Maiden Voyage Into Death: Are Fisheries Affecting Seabird Juvenile Survival During the First Days at Sea? R. Soc. Open Sci. 6, 0–7. doi: 10.1098/rsos.181151
Beal M., Dias M. P., Phillips R. A., Oppel S., Hazin C., Pearmain E. J., et al. (2021a). Global Political Responsibility for the Conservation of Albatrosses and Large Petrels. Sci. Adv. 7, eabd7225. doi: 10.1126/sciadv.abd7225
Beal M., Oppel S., Handley J., Pearmain E. J., Pujol V. M., Carneiro A. P. B., et al. (2021b). track2KBA: An R Package for Identifying Important Sites for Biodiversity from Tracking Data. Methods Ecol. Evol. 12, 2372–2378. doi: 10.1111/2041-210X.13713
BirdLife International. (2009). “Draft Guidelines for Using Seabird Tracking Data to Inform the Identification of Marine IBAs,” in Results From Using Seabird Satellite Tracking Data to Identify Marine IBAs: A Workshop to Determine How to Achieve This Goal (Chize, France: CNRS).
Bogdanova M. I., Wanless S., Harris M. P., Lindström J., Butler A., Newell M. A., et al. (2014). Among-Year and Within-Population Variation in Foraging Distribution of European Shags Phalacrocorax aristotelis Over Two Decades: Implications for Marine Spatial Planning. Biol. Conserv. 170, 292–299. doi: 10.1016/j.biocon.2013.12.025
Bolton M., Conolly G., Carroll M., Wakefield E. D., Caldow R. (2019). A Review of the Occurrence of Inter-Colony Segregation of Seabird Foraging Areas and the Implications for Marine Environmental Impact Assessment. Ibis. 161, 241–259. doi: 10.1111/ibi.12677
Cairns D. K. (1989). The Regulation of Seabird Colony Size: A Hinterland Model. Am. Nat. 134, 141–146. doi: 10.1086/284970
Cashion T., Nguyen T., Brink T. T., Mook A., Palacios-Abrantes J., Roberts S. M. (2020). Shifting Seas, Shifting Boundaries: Dynamic Marine Protected Area Designs for a Changing Climate. PloS One 15, 1–17. doi: 10.1371/journal.pone.0241771
Catry P., Phillips R. A., Croxall J. P. (2005). “Sexual Segregation in Birds: Patterns, Processes and Implications for Conservation,” in Sexual Segregation in Vertebrates: Ecology of the Two Sexes, eds. Ruckstuhl K. E., Neuhaus P. (Cambridge University Press), 351–378. doi: 10.1017/CBO9780511525629.019
Caveen A. J., Gray T. S., Stead S. M., Polunin N. V. C. (2013). MPA Policy : What Lies Behind the Science? Mar. Policy. 37, 3–10. doi: 10.1016/j.marpol.2012.04.005
Cecere J. G., Catoni C., Gaibani G., Geraldes P., Celada C., Imperio S. (2015). Commercial Fisheries, Inter-Colony Competition and Sea Depth Affect Foraging Location of Breeding Scopoli’s Shearwaters Calonectris diomedea. Ibis. 157, 284–298. doi: 10.1111/ibi.12235
Cecere J. G., Catoni C., Maggini I., Imperio S., Gaibani G. (2013). Movement Patterns and Habitat Use During Incubation and Chick-Rearing of Cory’s Shearwaters (Calonectris diomedea diomedea) (Aves: Vertebrata) From Central Mediterranean: Influence of Seascape and Breeding Stage. Ital. J. Zool. 80, 82–89. doi: 10.1080/11250003.2012.710654
Cecere J. G., Gaibaniv G., Imperio S. (2014). Effects of Environmental Variability and Offspring Growth on the Movement Ecology of Breeding Scopoli’s Shearwater Calonectris Diomedea. Curr. Zool. 60, 622–630. doi: 10.1093/czoolo/60.5.622
Ceia F. R., Paiva V. H., Ceia R. S., Hervías S., Garthe S., Marques J. C., et al. (2015). Spatial Foraging Segregation by Close Neighbours in a Wide-Ranging Seabird. Oecologia 177, 431–440. doi: 10.1007/s00442-014-3109-1
Cianchetti-Benedetti M., Dell’Omo G., Russo T., Catoni C., Quillfeldt P. (2018). Interactions Between Commercial Fishing Vessels and a Pelagic Seabird in the Southern Mediterranean Sea. BMC Ecol. 18, 1–10. doi: 10.1186/s12898-018-0212-x
Codina-García M., Militão T., Moreno J., González-Solís J. (2013). Plastic Debris in Mediterranean Seabirds. Mar. Pollut. Bull. 77, 220–226. doi: 10.1016/j.marpolbul.2013.10.002
Cole M., Lindeque P., Halsband C., Galloway T. S. (2011). Microplastics as Contaminants in the Marine Environment: A Review. Mar. Pollut. Bull. 62, 2588–2597. doi: 10.1016/j.marpolbul.2011.09.025
Courbin N., Besnard A., Péron C., Saraux C., Fort J., Perret S., et al. (2018). Short-Term Prey Field Lability Constrains Individual Specialisation in Resource Selection and Foraging Site Fidelity in a Marine Predator. Ecol. Lett. 21, 1043–1054. doi: 10.1111/ele.12970
Davies T. E., Carneiro A. P. B., Tarzia M., Wakefield E., Hennicke J. C., Frederiksen M., et al. (2021). Multispecies Tracking Reveals a Major Seabird Hotspot in the North Atlantic. Conserv. Lett. 14, 1–14. doi: 10.1111/conl.12824
Davies R. W. D., Cripps S. J., Nickson A., Porter G. (2009). Defining and Estimating Global Marine Fisheries Bycatch. Mar. Policy 33, 661–672. doi: 10.1016/j.marpol.2009.01.003
De Pascalis F., Imperio S., Benvenuti A., Catoni C., Rubolini D., Cecere J. G. (2020). Sex-Specific Foraging Behaviour is Affected by Wind Conditions in a Sexually Size Dimorphic Seabird. Anim. Behav. 166, 207–218. doi: 10.1016/j.anbehav.2020.05.014
Dierschke V., Furness R. W., Garthe S. (2016). Seabirds and Offshore Wind Farms in European Waters: Avoidance and Attraction. Biol. Conserv. 202, 59–68. doi: 10.1016/j.biocon.2016.08.016
Doney S. C., Fabry V. J., Feely R. A., Kleypas J. A. (2009). Ocean Acidification: The Other CO2 Problem. Ann. Rev. Mar. Sci. 1, 169–192. doi: 10.1146/annurev.marine.010908.163834
Eken G., Bennun L., Brooks T. M., Darwall W., Fishpool L. D. C., Foster M., et al. (2004). Key Biodiversity Areas as Site Conservation Targets. Bioscience 54, 1110–1118. doi: 10.1641/0006-3568(2004)054[1110:KBAASC]2.0.CO;2
Fort J., Moe B., Strøm H., Grémillet D., Welcker J., Schultner J., et al. (2013). Multicolony Tracking Reveals Potential Threats to Little Auks Wintering in the North Atlantic From Marine Pollution and Shrinking Sea Ice Cover. Divers. Distrib. 19, 1322–1332. doi: 10.1111/ddi.12105
Genovart M., Bécares J., Igual J. M., Martínez-Abraín A., Escandell R., Sánchez A., et al. (2018). Differential Adult Survival at Close Seabird Colonies: The Importance of Spatial Foraging Segregation and Bycatch Risk During the Breeding Season. Glob. Chang. Biol. 24, 1279–1290. doi: 10.1111/gcb.13997
Grémillet D., Péron C., Pons J. B., Ouni R., Authier M., Thévenet M., et al. (2014). Irreplaceable Area Extends Marine Conservation Hotspot Off Tunisia: Insights From GPS-Tracking Scopoli’s Shearwaters From the Largest Seabird Colony in the Mediterranean. Mar. Biol. 161, 2669–2680. doi: 10.1007/s00227-014-2538-z
Haug F. D., Paiva V. H., Werner A. C., Ramos J. A. (2015). Foraging by Experienced and Inexperienced Cory’s Shearwater Along a 3-Year Period of Ameliorating Foraging Conditions. Mar. Biol. 162, 649–660. doi: 10.1007/s00227-015-2612-1
Hautier Y., Tilman D., Isbell F., Seabloom E. W., Borer E. T., Reich P. B. (2015). Anthropogenic Environmental Changes Affect Ecosystem Stability via Biodiversity. Sci. 348, 336–340. doi: 10.1126/science.aaa1788 Biodiversity
Hazen E. L., Abrahms B., Brodie S., Carroll G., Jacox M. G., Savoca M. S., et al. (2019). Marine Top Predators as Climate and Ecosystem Sentinels. Front. Ecol. Environ. 17, 565–574. doi: 10.1002/fee.2125
Hipfner J. M., Charette M. R., Blackburn G. S. (2007). Subcolony Variation in Breeding Success in the Tufted Puffin (Fratercula cirrhata): Association With Foraging Ecology and Implications. The Auk 124, 1149–1157. doi: 10.1642/0004-8038(2007)124[1149:SVIBSI]2.0.CO;2
Ito K., Watanabe Y. Y., Kokubun N., Takahashi A. (2020). Inter-Colony Foraging Area Segregation Quantified in Small Colonies of Adélie Penguins. Ibis. 163, 90–98. doi: 10.1111/ibi.12837
IUCN. (2021). The IUCN Red List of Threatened Species. Version 2021-3. Available at: https://www.iucnredlist.org.
Jackson J. B. C., Kirby M. X., Berger W. H., Bjorndal K. A., Botsford L. W., Bourque B. J., et al. (2001). Historical Overfishing and the Recent Collapse of Coastal Ecosystems. Sci. 293, 629–637. doi: 10.1126/science.1059199
Jenouvrier S., Thibault J. C., Viallefont A., Vidal P., Ristow D., Mougin J. L., et al. (2009). Global Climate Patterns Explain Range-Wide Synchronicity in Survival of a Migratory Seabird. Glob. Change Biol. 15, 268–279. doi: 10.1111/j.1365-2486.2008.01715.x
Johansen J. L., Jones G. P. (2011). Increasing Ocean Temperature Reduces the Metabolic Performance and Swimming Ability of Coral Reef Damselfishes. Glob. Change Biol. 17, 2971–2979. doi: 10.1111/j.1365-2486.2011.02436.x
Karpouzi V. S., Watson R., Pauly D. (2007). Modelling and Mapping Resource Overlap Between Seabirds and Fisheries on a Global Scale: A Preliminary Assessment. Mar. Ecol. Prog. Ser. 343, 87–99. doi: 10.3354/meps06860
Krüger L., Pereira J. M., Paiva V. H., Ramos J. A. (2019). Personality Influences Foraging of a Seabird Under Contrasting Environmental Conditions. J. Exp. Mar. Bio. Ecol. 516, 123–131. doi: 10.1016/j.jembe.2019.04.003
Kuhn C. E., Ream R. R., Sterling J. T., Thomason J. R., Towell R. G. (2014). Spatial Segregation and the Influence of Habitat on the Foraging Behavior of Northern Fur Seals (Callorhinus ursinus). Can. J. Zool. 92, 861–873. doi: 10.1139/cjz-2014-0087
Lascelles B. G., Taylor P. R., Miller M. G. R., Dias M. P., Oppel S., Torres L., et al. (2016). Applying Global Criteria to Tracking Data to Define Important Areas for Marine Conservation. Divers. Distrib. 22, 422–431. doi: 10.1111/ddi.12411
Marty J. C., Chiavérini J., Pizay M. D., Avril B. (2002). Seasonal and Interannual Dynamics of Nutrients and Phytoplankton Pigments in the Western Mediterranean Sea at the DYFAMED Time-Series Station (1991–1999). Deep. Res. Part II Top. Stud. Oceanogr. 49, 1965–1985. doi: 10.1016/S0967-0645(02)00022-X
Masello J. F., Mundry R., Poisbleau M., Demongin L., Voigt C. C., Wikelski M., et al. (2010). Diving Seabirds Share Foraging Space and Time Within and Among Species. Ecosphere 1, art19. doi: 10.1890/ES10-00103.1
Morinay J., Riotte-Lambert L., Aarts G., De Pascalis F., Imperio S., Morganti M., et al. (2022) Within-Colony Segregation of Foraging Areas: From Patterns to Processes. EcoEvoRxiv, May 18. doi: 10.32942/osf.io/8r7ne
Nelms S. E., Alfaro-Shigueto J., Arnould J. P. Y., Avila I. C., Nash S. B., Campbell E., et al. (2021). Marine Mammal Conservation: Over the Horizon. Endanger. Spec. Res. 44, 291–325. doi: 10.3354/ESR01115
Ozella L., Cecchetti M., Pessani D. (2016). Diet of Feral Cats During the Scopoli’s Shearwater Breeding Season on Linosa Island, Mediterranean Sea. Ital. J. Zool. 83, 589–599. doi: 10.1080/11250003.2016.1237562
Pelletier L., Chiaradia A., Kato A., Ropert-Coudert Y. (2014). Fine-Scale Spatial Age Segregation in the Limited Foraging Area of an Inshore Seabird Species, the Little Penguin. Oecologia 176, 399–408. doi: 10.1007/s00442-014-3018-3
Pereira J. M., Ramos J. A., Almeida N., Araújo P. M., Ceia F. R., Geraldes P., et al (2022). Foraging Costs Drive Within-Colony Spatial Segregation in Shearwaters From Two Contrasting Environments in the North Atlantic Ocean. Oecologia 1–14. doi: 10.1007/s00442-022-05109-8
Péron C., Authier M., Grémillet D. (2018). Testing the Transferability of Track-Based Habitat Models for Sound Marine Spatial Planning. Divers. Distrib. 24, 1772–1787. doi: 10.1111/ddi.12832
Perry A. L., Low P. J., Ellis J. R., Reynolds J. D. (2005). Climate Change and Distribution Shifts in Marine Fishes. Sci. 308, 1912–1915. doi: 10.1126/science.1111322
Pettex E., Lambert C., Fort J., Dorémus G., Ridoux V. (2019). Spatial Segregation Between Immatures and Adults in a Pelagic Seabird Suggests Age-Related Competition. J. Avian Biol. 50, 1–10. doi: 10.1111/jav.01935
Pimm S. L., Ayres M., Balmford A., Branch G., Brandon K., Brooks T., et al. (2001). Can We Defy Nature’s End? Sci. 293, 2207–2208. doi: 10.1126/science.1061626
Poloczanska E. S., Burrows M. T., Brown C. J., Molinos J. G., Halpern B. S., Hoegh-Guldberg O., et al. (2016). Responses of Marine Organisms to Climate Change Across Oceans. Front. Mar. Sci. 3, 62. doi: 10.3389/fmars.2016.00062
QGIS Development Team. (2022). QGIS Geographic Information System (QGIS Association). Available at: http://www.qgis.org.
R Development Core Team (2021). R: A Language and Environment for Statistical Computing. R Foundation for Statistical Computing, Vienna, Austria. Available at: https://www.R-project.org/.
Rodríguez A., García D., Rodríguez B., Cardona E., Parpal L., Pons P. (2015). Artificial Lights and Seabirds: Is Light Pollution a Threat for the Threatened Balearic Petrels? J. Ornithol. 156, 893–902. doi: 10.1007/s10336-015-1232-3
Sánchez S., Reina R. D., Kato A., Ropert-Coudert Y., Cavallo C., Hays G. C., et al. (2018). Within-Colony Spatial Segregation Leads to Foraging Behaviour Variation in a Seabird. Mar. Ecol. Prog. Ser. 606, 215–230. doi: 10.3354/meps12764
Saraux C., Fromentin J. M., Bigot J. L., Bourdeix J. H., Morfin M., Roos D., et al. (2014). Spatial Structure and Distribution of Small Pelagic Fish in the Northwestern Mediterranean Sea. PloS One 9, e111211. doi: 10.1371/journal.pone.0111211
Schooley R. L. (1994). Annual Variation in Habitat Selection : Patterns Concealed by Pooled Data. J. Wildl. Manage. 58, 367–374. doi: 10.2307/3809404
Schreiber E. A., Burger J. (2001). “Seabirds in the Marine Environment,” in Biology of Marine Birds. Eds. Schreiber E. A., Burger J. (CRC Marine Biology Series, CRC Press, Taylor and Francis group), 19–34.
Thiebault A., Mullers R., Pistorius P., Meza-Torres M. A., Dubroca L., Green D., et al. (2014). From Colony to First Patch: Processes of Prey Searching and Social Information in Cape Gannets. The Auk 131, 595–609. doi: 10.1642/AUK-13-209.1
Thomas C. D., Cameron A., Green R. E., Bakkenes M., Beaumont L. J., Collingham Y. C., et al. (2004). Extinction Risk From Climate Change. Nature 427, 145–148. doi: 10.1038/nature02121
Waggitt J. J., Briffa M., Grecian W. J., Newton J., Patrick S. C., Stauss C., et al. (2014). Testing for Sub-Colony Variation in Seabird Foraging Behaviour: Ecological and Methodological Consequences for Understanding Colonial Living. Mar. Ecol. Prog. Ser. 498, 275–285. doi: 10.3354/meps10628
Wakefield E. D., Phillips R. A., Trathan P. N., Arata J., Gales R., Huin N., et al. (2011). Habitat Preference, Accessibility, and Competition Limit the Global Distribution of Breeding Black-Browed Albatrosses. Ecol. Monogr. 81, 141–167. doi: 10.1890/09-0763.1
Weimerskirch H., Bertrand S., Silva J., Marques J. C., Goya E. (2010). Use of Social Information in Seabirds: Compass Rafts Indicate the Heading of Food Patches. PloS One 5, e9928. doi: 10.1371/journal.pone.0009928
Wilcox C., Van Sebille E., Hardesty B. D., Estes J. A. (2015). Threat of Plastic Pollution to Seabirds Is Global, Pervasive, and Increasing. Proc. Natl. Acad. Sci. 112, 11899–11904. doi: 10.1073/pnas.1502108112
Keywords: colonial breeders, foraging, GPS tracking, key biodiversity areas (KBAs), marine conservation, scopoli’s shearwater (Calonectris diomedea), spatial segregation, Important Bird and Biodiversity Areas (IBAs)
Citation: Morinay J, De Pascalis F, Catoni C, Benvenuti A, Imperio S, Rubolini D and Cecere JG (2022) Assessing Important Conservation Areas for Colonial Species From Individual Tracking Data: An Evaluation of the Effects of Colony Structure and Temporal Heterogeneity in Movement Patterns. Front. Mar. Sci. 9:854826. doi: 10.3389/fmars.2022.854826
Received: 14 January 2022; Accepted: 29 April 2022;
Published: 27 May 2022.
Edited by:
Jorge M. Pereira, University of Coimbra, PortugalReviewed by:
Virginia Morera-Pujol, University College Dublin, IrelandAndreas Ravache, Institut de Recherche Pour le Développement (IRD), France
Copyright © 2022 Morinay, De Pascalis, Catoni, Benvenuti, Imperio, Rubolini and Cecere. This is an open-access article distributed under the terms of the Creative Commons Attribution License (CC BY). The use, distribution or reproduction in other forums is permitted, provided the original author(s) and the copyright owner(s) are credited and that the original publication in this journal is cited, in accordance with accepted academic practice. No use, distribution or reproduction is permitted which does not comply with these terms.
*Correspondence: Jennifer Morinay, jennifer.morinay@gmail.com
†ORCID: Jennifer Morinay, orcid.org/0000-0002-7905-9691
Federico De Pascalis, orcid.org/0000-0002-1414-7770
Carlo Catoni, orcid.org/0000-0001-8355-2529
Andrea Benvenuti, orcid.org/0000-0001-8722-6229
Simona Imperio, orcid.org/0000-0002-9982-205X
Diego Rubolini, orcid.org/0000-0003-2703-5783
Jacopo G. Cecere, orcid.org/0000-0002-4925-2730