Applying Tissue Separation and Untargeted Metabolomics to Understanding Lipid Saturation Kinetics of Host Mitochondria and Symbiotic Algae in Corals Under High Temperature Stress
 Andrea Gamba1†
  Daniel Petras2,3
  Mark Little4
  Brandie White4
  Pieter C. Dorrestein2 Forest Rohwer4
  Rachel A. Foster1*
  Aaron C. Hartmann5*
- 1Department of Ecology, Environment and Plant Sciences, Stockholm University, Stockholm, Sweden
- 2Collaborative Mass Spectrometry Innovation Center, Skaggs School of Pharmacy and Pharmaceutical Sciences, University of California,San Diego, La Jolla, CA, United States
- 3CMFI Cluster of Excellence, Interfaculty Institute of Microbiology and Medicine, University of Tuebingen, Tuebingen, Germany
- 4Department of Biology, San Diego State University, San Diego, CA, United States
- 5Department of Organismic and Evolutionary Biology, Harvard University, Cambridge, MA, United States
Untargeted metabolomics is a powerful tool for profiling the biochemical phenotypes of organisms and discovering new metabolites that drive biological function and might be exploited as pharmaceutical leads. Yet, connecting physiological processes to metabolites detected remains a challenge due to the lack of structural and activity annotations and the underlying complexity of mixed samples (e.g., multiple microorganisms, organelles, etc.). To simplify this biological complexity, we separated coral holobionts into host mitochondria and their algal symbionts prior to LC-MS/MS-based untargeted metabolomic analysis followed by molecular networking. We found distinct metabolomic profiles between tissue fractions. Notably, 14% of metabolites detected were only observed in the mitochondria and algal symbionts, not in the holobiont, and thus were masked when the bulk (holobiont) sample was analyzed. The utility of tissue separation for hypothesis testing was assessed using a simple temperature experiment. We tested the hypothesis that membrane lipids of the coral mitochondria and algal symbionts become more saturated at higher temperatures to maintain membrane rigidity. While the holobiont metabolite profiles showed little change in response to elevated temperature, there was a change in lipid saturation of both fractions through time. The fatty acid saturation of both the coral mitochondria and the algal symbionts shifted upon exposure to higher temperatures (1 h) then returned to ambient saturation levels by 4 h, indicating rapid acclimatization to warmer water. Surprisingly, the fractions deviated in opposite directions: during the first hour of the experiment, the mitochondria showed an increase in saturated lipid concentrations, while the algal symbionts showed an increase in unsaturated lipids. Partitioning the holobiont prior to untargeted metabolomic analysis revealed disparate responses to environmental stress that would have gone undetected if only the holobiont/bulk tissue was analyzed. This work illustrates rapid physiological acclimatization to environmental changes in specific host organelles and symbionts, though via different paths.
Introduction
Organisms produce different metabolites to carry out a wide array of physiological processes in response to environmental change (e.g., light, temperature, nutrients, interspecific interactions). Therefore, the repertoire of small molecules that an organism can produce determines its phenotype and whether it can adapt to new conditions. Untargeted metabolomics aims to detect all small molecules in a sample (e.g., tissue sampled) and the resulting metabolome reflects a wide range of the biological processes occurring at the time of sampling, akin to a biochemical phenotype. Given this breadth, untargeted metabolomics has great potential to improve our understanding of an organisms’ capacity to respond to rapid environmental changes (e.g., ability to acclimatize), which represents a timely question given the current pace of climate change. Yet, the application of metabolomics to climate change research is still in its infancy, in part because data analysis techniques lag behind our ability to generate large metabolomic datasets.
The dearth of metabolite annotations from mass spectrometry (MS) data is a major analytical shortfall in untargeted metabolomics (Da Silva et al., 2015). Tools have been developed to expand the information gained from metabolomes, such as applying molecular networking to quantify the chemical reactions occurring between metabolites (Hartmann et al., 2017; Petras et al., 2021). Yet, even when metabolites can be annotated, challenges remain in the interpretation since numerous and often unrelated processes co-occur in samples of mixed tissue types and/or multiple species (e.g., host and symbiont, multiple organelles, seawater bacteria; Garg, 2021). This issue persists despite the development of recent methods that allow metabolomics on single cell (Rappez et al., 2021). Partitioning samples (e.g., organelles, symbionts) prior to untargeted metabolomics may be a useful strategy for testing hypotheses related to specific processes while retaining the ability to detect the full spectrum of molecules present (van der Walt et al., 2021). One example where this approach could be particularly useful is in the study of symbiotic systems, such as the mutualistic symbiosis of corals and dinoflagellate algae.
Most reef-building corals (Order: Scleractinia) form a mutualism with algal endosymbionts of the family Symbiodiniaceae. The photosynthetic algae provide high-energy organic compounds that feed the host, while the coral provides protection and an environment rich in nutrients such as nitrogen and phosphorus for the algal partner (Oswald et al., 2007; Dubinsky and Stambler, 2011). Coral communities have declined in recent decades, largely due to the breakdown of their symbiosis with Symbiodiniaceae (e.g., Gardner et al., 2017). This process, when the host loses its algal symbionts, is commonly called coral bleaching, and typically occurs in response to periods of increased seawater temperatures. The loss of the algal symbiont can lead to host starvation over weeks to months or more rapid mortality on the scale of days (Hughes et al., 2017). The decline of reef-building corals is an imminent problem of global concern because these animals form the foundation of one of the most productive and biodiverse ecosystems on the planet.
Despite decades of focused research attention on coral bleaching, we still have a limited understanding of how host and symbiont physiologies are altered by warming, particularly relating to the dynamic responses of both partners in the earliest hours following the onset of exposure. What is known is that the lipid composition of the thylakoid membrane of chloroplasts plays an important role in the thermal tolerance of the photosynthetic organelle (Gombos et al., 1994). Temperature influences the fluidity of lipid membranes depending on the ratio of saturated to unsaturated fatty acids present, and cells and organelles can adapt their level of membrane lipid saturation to maintain membrane stability (Davy De Virville et al., 2002; Tchernov et al., 2004; Barelli and Antonny, 2016). In coral bleaching, the thylakoid membrane of the algal symbiont’s chloroplasts disform at higher temperatures because of the increased instability of its phospholipid membranes, halting photosynthesis and causing the production of reactive oxygen species (ROS) that harm both partners (Tchernov et al., 2004). Typically, algal symbionts that are tolerant of higher temperatures possess chloroplasts with a lower content of polyunsaturated fatty acids (Tchernov et al., 2004). The resulting higher degree of saturation increases the stability of the thylakoid membranes and reduces the susceptibility of the membranes to breakdown and ROS formation (Tchernov et al., 2004).
To date, there have been no investigations of coral mitochondrial membrane acclimatization in response to thermal stress, which may also play a role in the slow or rapid demise of corals that follows the loss of their algal energy source during bleaching (e.g., starvation). It has been demonstrated that the saturated lipid content increases in mitochondria of other organisms (e.g., fishes, plants) when thermally stressed (Yamauchi et al., 1981; Davy De Virville et al., 2002), suggesting this organelle in some organisms can flexibly alter membrane stability. Here, we used a coral-algal symbiosis to (1) test hypotheses about specific physiological processes while retaining the ability to carry out a metabolome wide analysis using a strategic and stepwise approach: tissue-type separation, untargeted metabolomics, and molecular networking, and (2) improve our understanding of changes in membrane stability in coral hosts and algal symbionts at the onset of thermal stress. In other words, we determined whether untargeted metabolomics may be used to address questions about specific physiological processes, as an alternative to targeted approaches (e.g., fatty acid methyl ester or FAME) and an expansion of the uses for already-valuable untargeted metabolomics datasets.
Materials and Methods
Study Species
Coral fragments of Acropora yongei (hereafter Acropora) were used for this study. The fragments were originally collected in Guam and provided by the Birch Aquarium at Scripps Institution of Oceanography (La Jolla, CA USA). Acropora yongei was selected as the study species because Acropora is the most speciose genus of hard corals, is geographically widespread in the tropics, and is a foundational reef builder in the Pacific and Atlantic Oceans. The corals were acquired in August 2018 and housed in a temperature-controlled aquarium (Poseidon 1000 L) on commercially available 0.2 μm filtered artificial seawater (Coral Pro Salt–Red Sea). The corals were fragmented into 40 individuals of approximate equal sizes (15 cm) to create replicates. The coral fragments were maintained at the following conditions: 23°C, salinity of 33 PSU, pH of 8.18, oxygen level of 6.56 mg/L, and illumination of 205 μmol quanta m-2 s-1 (max peak 958 μmol quanta m-2 s-1; min peak 0 μmol quanta m-2 s-1) on a 14 hour:10 hour light:dark cycle, using the aquarium controller Apex (Apex lite, Neptune Systems, CA USA).
Elevated Temperature Treatment of Coral Fragments
A second experimental tank (18 L) was prepared with the same environmental conditions as the main tank (where the corals had been maintained), however, temperature was increased to 26°C by a commercial heater. An air bubbler was used to maintain consistent oxygen levels during the experiment. Twelve coral fragments were introduced into the experimental tank. Three replicate coral fragments were removed at four time points: 1 hour (h), 2 h, 4 h and 16 h from the start of exposure. After removal, each replicate coral fragment was collected to extract coral mitochondria and the algal symbionts (Symbiodiniaceae) as described below. Removal of coral fragments from the main tank held at ambient temperature served as control samples and were treated the same for extraction. The metabolome of the whole coral was sampled by placing a subsample of one coral fragment from each time point and one from the control tank in 1ml 70% methanol (Hartmann et al., 2017). All samples were stored at -20°C until fractions were partitioned, metabolomes extracted and analyzed, and data were collected and analyzed (Figure 1).
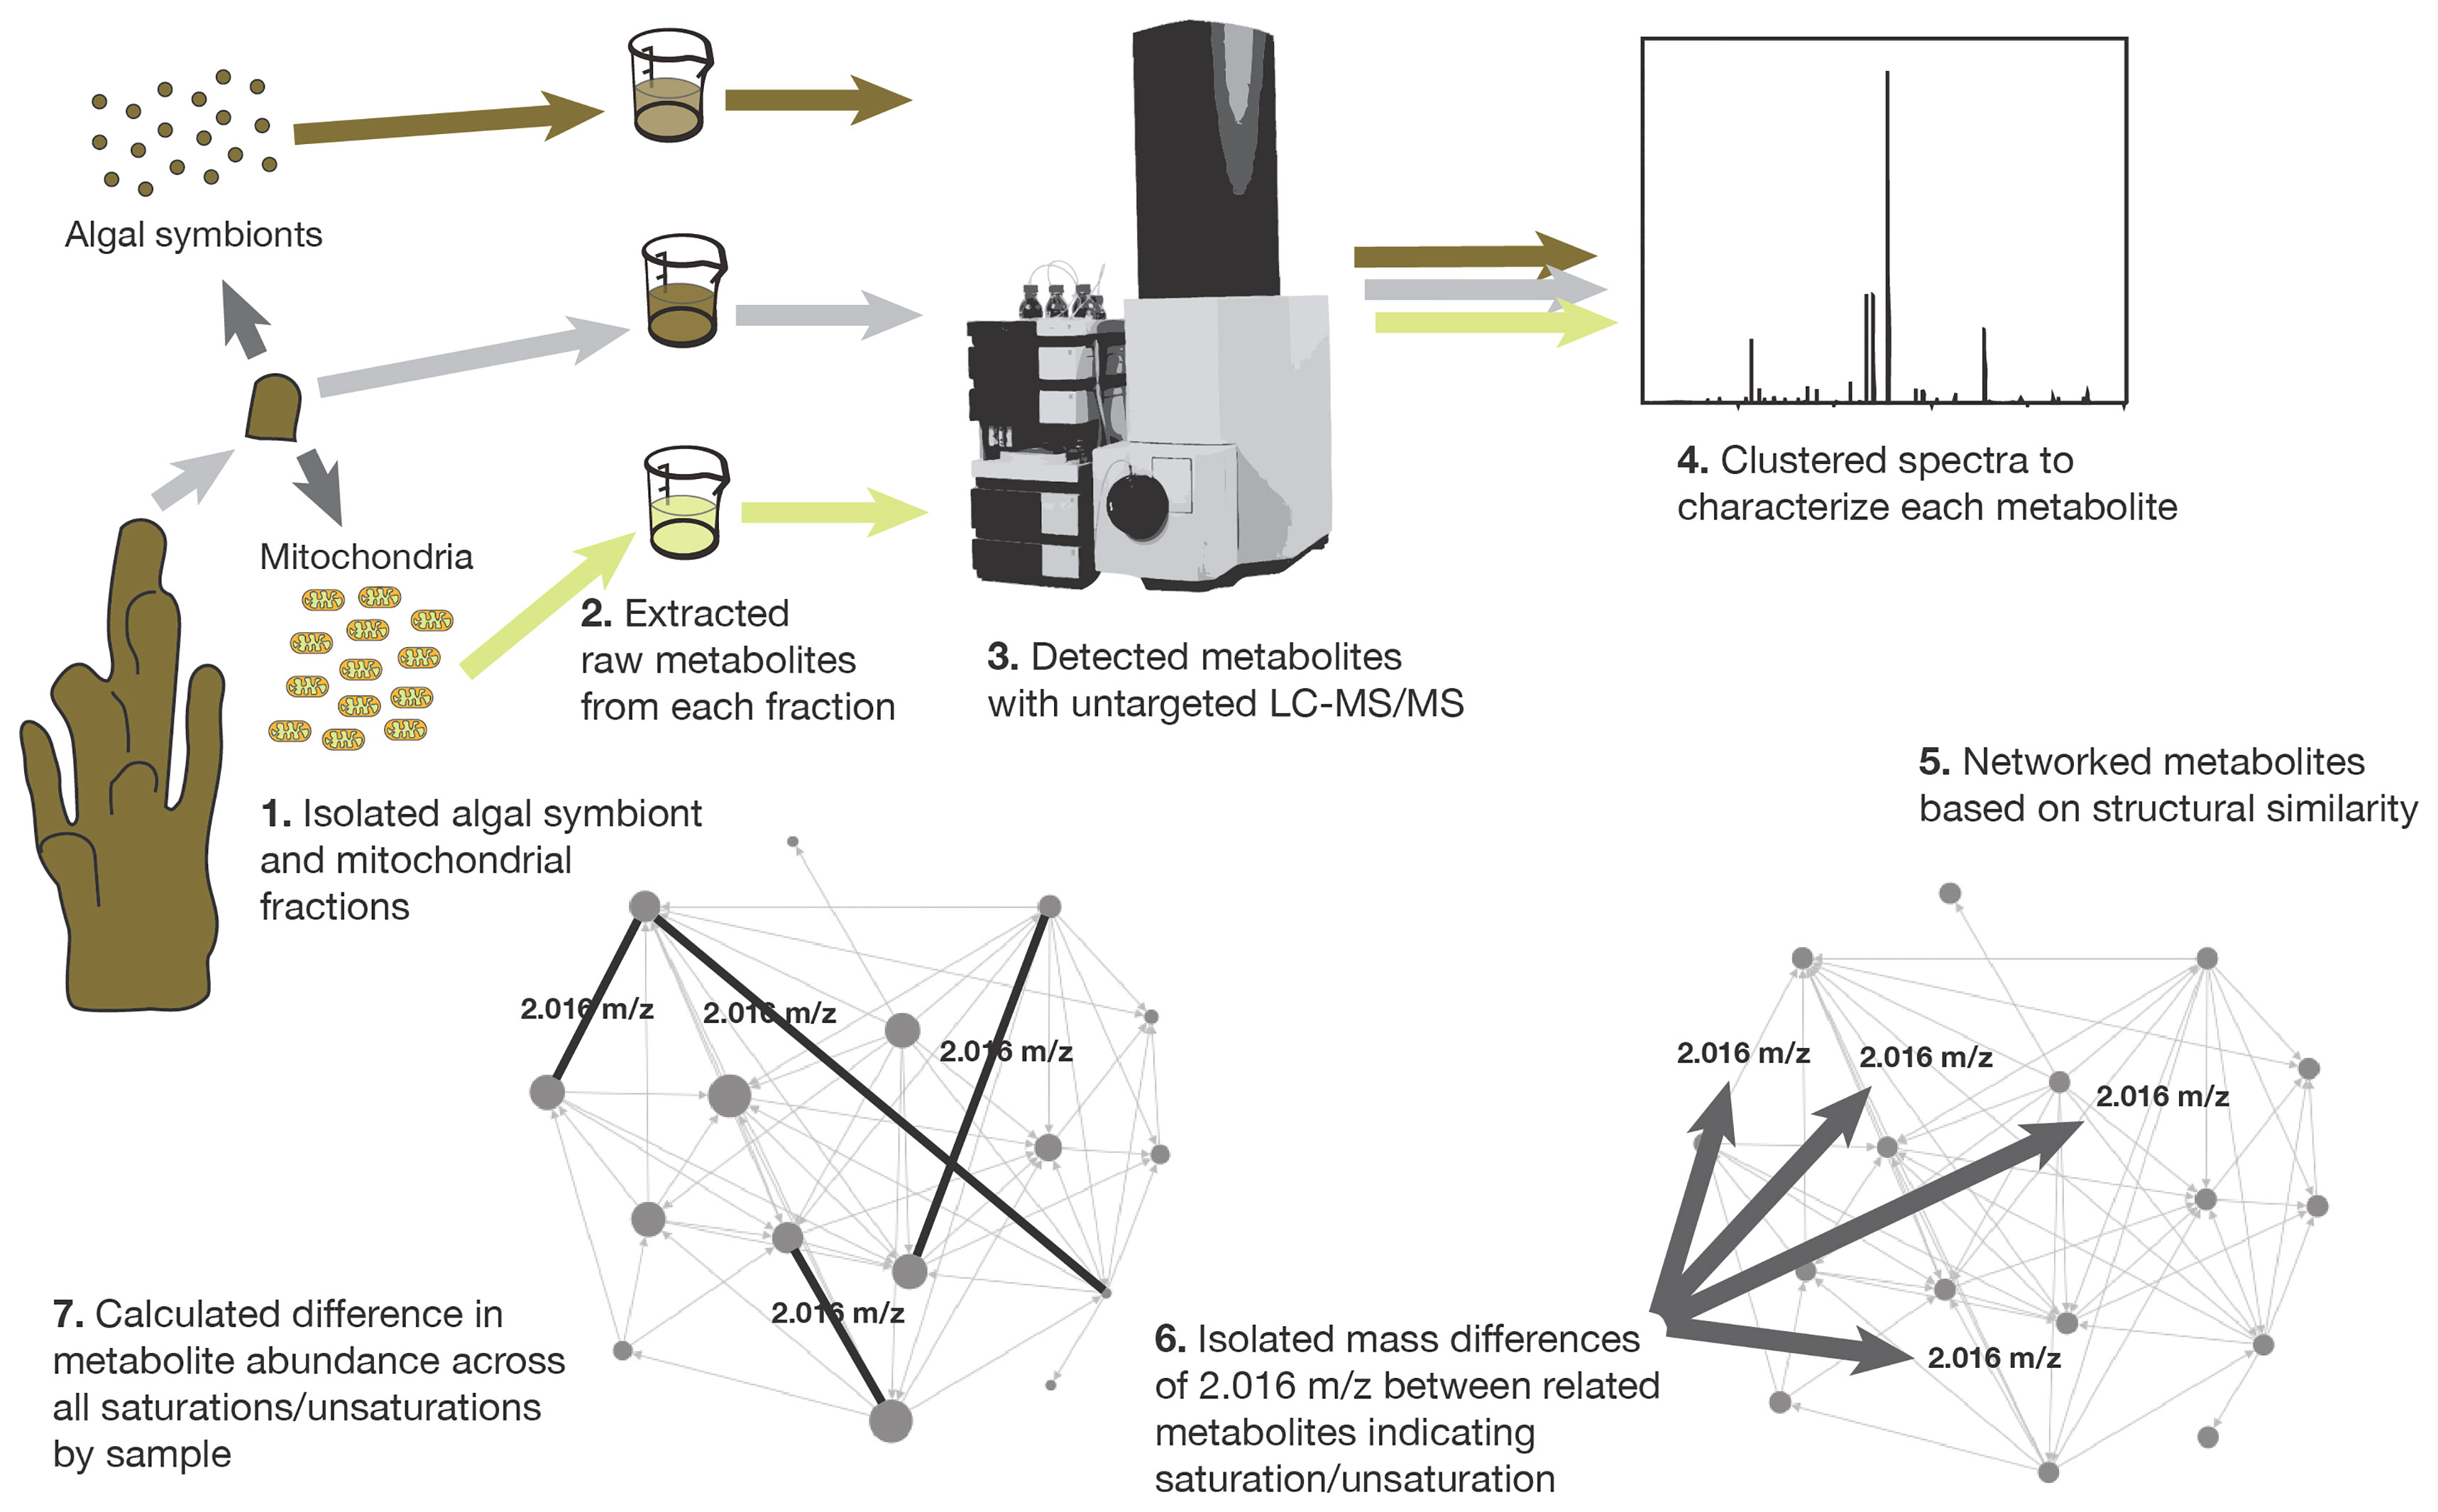
Figure 1 The steps involved in sample collection, tissue fractionation, metabolome extraction, metabolome analysis, molecular networking, and unsaturation-saturation pair isolation.
Collecting Coral Tissue Samples for Mitochondria and Algal Symbiont Isolation
Coral tissue was separated from the coral skeleton using an airbrush (80 PSI) fitted to a reservoir of 0.2 μm filtered artificial seawater (FASW) and attached to a SCUBA tank that provided pressurized air. The coral tissue sample was collected in sterile 50 ml conical falcon tubes. The sample was then centrifuged (1200 g, 4°C, 10 min) to pellet the tissue. The supernatant was discarded, and the pellet was resuspended in 6 ml FASW and transferred to a sterile 15 ml conical falcon tube. The cells were centrifuged again under the same conditions. The supernatant was discarded, and the pellet was used for further analyses (isolation of coral mitochondria and Symbiodiniaceae, and purification of respective metabolomes).
Staining and Enumeration of Live Coral Cells
Live coral cells were counted from one of the samples to confirm their isolation. The pellet of live coral cells from the control tank individuals was re-suspended in FASW, stained with 0.04% (v/v) trypan blue (dilution factor 1:5), and the non-stained cells were enumerated with a light microscope using a hemocytometer counting chamber. Using a 10X objective, unstained cells were clearly visible in high numbers indicative that cells were viable; cells in the entire central area (1 mm 2) were enumerated. The concentration of the live cells was estimated using the equation:
where 50.6 was the average number of cells found in the smaller squares of the chamber (1/25 mm2); 104 is a conversion factor for 0.1 mm3 to 1 ml, and 5 accounts for the dilution factor of the trypan stain.
Mitochondria Isolation: Cell Lysing and Centrifugation
Mitochondria were isolated from the coral cells using a modified version of the protocol described by Richier et al. (2003). Biological materials were stored on ice between all steps described below. Briefly, the pellets of isolated coral tissue were resuspended in 3 ml of a mitochondrial extraction medium pH 7.2 (440 mM sucrose, 10 mM MOPS-H, 1 mM ethylenediaminetetraacetic acid (EDTA), 0.1 mM phenylmethylsulphonyl fluoride (PMSF). Cell lysis was accomplished using a French Press at 1000 PSI. An aliquot (20 ul) was initially observed with light microscopy to ensure that all the coral cells were disrupted. The cell suspension was then centrifuged (1000 g, 4°C, 10 min) and the supernatant containing the mitochondria was collected. The pellet was washed with extraction buffer and centrifuged again. The supernatant was collected. The two supernatants from the previous steps were combined and centrifuged (10000 g, 4°C, 10 min). The final step resulted in a pellet of crudely isolated mitochondria that was re-suspended in 6 ml FASW for subsequent processing.
Mitochondria Isolation: Percoll Gradient Purification
The crude mitochondria were further purified by a percoll density gradient using a previously published method with slight modifications (Kristián et al., 2006). Briefly, percoll was diluted using 1X Phosphate buffered saline (PBS). Percoll density gradients were prepared in ultracentrifuge tubes (15 ml) as follows: 1 ml of 50% percoll (bottom), 3 ml of 22% percoll, 1 ml 15% percoll, and 6 ml of the sample in FASW (top). The loaded tubes were centrifuged in an ultracentrifuge Beckerman L8M (30700 g, 4°C, 6 min) with an SW41 rotor. The top layers were removed carefully by pipette and the isolated mitochondria were recovered within the 22% and 50% percoll layers and diluted in FASW (1:3) and centrifuged again in a microcentrifuge (17000 g, 4°C, 10 min; Kristián et al., 2006). The pellet was recovered and washed with 1.5 ml FASW followed by centrifugation (7000 g, 4°C, 5 min). The final pellet was placed in 1ml 70% methanol for metabolome extraction (Hartmann et al., 2017) and stored at -20°C until further analyses.
Mitochondria Isolation: Confirming With MitoTracker Red FM
To confirm the isolation and purification of mitochondria prior to mass spectrometry analysis, an aliquot of the purified mitochondrial suspension was stained with MitoTracker Red FM (Thermofisher), which only stains mitochondria, following the manufacturers protocol. After staining, the cell suspensions were centrifuged (1200 g, 10 min) and resuspended in FASW. An (10 μl) aliquot of the stained sample was put on a standard coated microscope slide and observed under an epifluorescence microscope (IX70 Olympus) fitted with a 581 nm/644 nm excitation/emission filter set. The presence of mitochondria was confirmed.
Symbiodiniaceae Isolation: Cell Isolation and Lysing
A modified version of the protocol from Banaszak (2007) was carried out to isolate the symbiotic Symbiodiniaceae from a second aliquot of crude coral extract. All steps were carried out on ice. Pelleted coral tissue was resuspended in an extraction buffer (EB; 100 mM Tris, 20 mM EDTA) and homogenized with a glass homogenizer. The homogenate was centrifuged (16000 g, 4°C, 5 min), supernatant discarded, and pellet resuspended in EB and homogenized again. Subsequently, cells in the resuspension were lysed using sodium dodecyl sulfate (SDS) at a final concentration of 0.3% (w/v). The mixture was left on ice for 15 min and vortexed every 3 min. The sample was centrifuged (16000 g, 4°C, 10 min), the supernatant discarded, and the pellet re-suspended in EB. This process was repeated three times to eliminate the SDS. The pellet was re-suspended in FASW and glass homogenized for further analyses. A 10 μL aliquot was observed under the light microscope to see that Symbiodiniaceae cell membranes were not disrupted by the SDS and that the host cells were destroyed.
Symbiodiniaceae Isolation: Percoll Gradient
Symbiodiniaceae was separated from cellular debris using a modified method described by Mydlarz et al. (2003). Briefly, a 50 ml falcon tube was layered as follows: 2 ml 80% of percoll (bottom), 2 ml of 40% percoll, 2 ml of 20% percoll, and 2 ml of crude Symbiodiniaceae suspension from the previous step (Pasaribu et al., 2014). The tube was then centrifuged 2000 g for 20 min. The Symbiodiniaceae was recovered from the bottom of the conical tube and washed in FASW (1:3) and centrifuged (17000 g, 4°C, 10 min; Kristián et al., 2006). The pellet was recovered and washed with 1.5 ml FASW (7000 g, 4°C, 5 min). A 10 μl aliquot was taken to check the cellular integrity of the Symbiodiniaceae using a light microscope. After confirming that the cells were intact, the final pellet was placed in 1 ml 70% HPLC-grade methanol and left in the dark at room temperature for the metabolome extraction (Quinn et al., 2016; Hartmann et al., 2017). The sample was then stored at -20°C until further analyses.
Metabolome Extraction and Sample Preparation for Mass Spectrometry
A total of 52 metabolomes were prepared: 22 purified mitochondrial samples (N = 10 from ambient tank, N = 12 from thermal experiment), 25 Symbiodiniaceae samples (N = 13 from ambient tank, N = 12 from thermal experiment), 5 crude whole coral tissue samples (N = 1 from ambient tank, N = 4 from thermal experiment), and 3 negative controls. The negative controls included one 20 μl aliquot of percoll and two replicates of 1 ml 70% HPLC-grade methanol used for the metabolome extraction. Just before analysis, an aliquot (0.5 ml) of each metabolome was weighed, centrifuged (250 g, 26°C, 12 h), and dried using a SpeedVac overnight. After 24 h, the material was re-weighed to ensure samples were above the minimum weight (0.0001 g) required for detection by the mass spectrometer. The dried metabolome extract was re-suspended in 100 μL of 80% HPLC-grade methanol and 1% formic acid.
Mass Spectrometry
Samples were introduced into a Q-Exactive orbitrap mass spectrometer (Thermo Fisher Scientific, Bremen, Germany) and measured as described by Petras et al. (2017). Briefly, the parameters of the electrospray ionization (ESI) were put to 0 AU sweep gas flow, 14 AU auxiliary gas flow, 52 AU sheath gas flow and 400°C auxiliary gas temperature. The voltage of the spray was put to 3.5 kV and the inlet capillary to 320°C. Furthermore, a 50 V S-lens level was used. The range of the mass spectrometry (MS) scan was 150–1,500 m/z and the resolution, at m/z 200 (Rm/z 200), was 140,000 with a positive mode micro-scan. Utilizing an automated gain control (AGC) of 1.0E6 the maximum time of the ion injection was 100ms. The Data dependent acquisition (DDA) mode was used to record the MS/MS spectra. Rm/z 200 of 17,500, with positive mode one micro-scan, was used to measure MS1 scans (150–1,500 m/z) up to 5 MS/MS scans of the most abundant ions per cycle. 100ms was the maximum ion injection time with an automated gain control for survey scans at 1.0E6 and, with minimum 10% C-trap filling, 3.0E5 for MS/MS. m/z 1 was set for the MS/MS precursor selection windows. A graduate increase from 20 to 30 to 40%, with z = 1 as default charge state, was set for normalized collision energy. An apex of peaks within 2–15 s from their first occurrence was used to trigger MS/MS experiments. 5 s was the exclusion dynamic. Unassigned charge states ions were not included in DDA and isotope peaks. For the negative mode analyses, the polarity was switched, and the spray voltage adjusted. The other ESI parameters were the same as the positive mode. 150–1,500 m/z was the MS scan range with R m/z 200 of 140,000, one micro-scan and 100 ms for the maximum ion injection time with an AGC target of 1.0E6.
Data Processing and Metabolite Quantification With MZmine2
MSConvert was used to convert the .raw data files to the .mzXML format required for data analysis (Chambers et al., 2012). MZmine 2.33 was then used to isolate and characterize each metabolite in the raw LC-MS/MS data (i.e., create consensus spectra) and quantify each metabolite from the MS1 scan. The parameters used were as follows: For the mass detection of the MS level 1 the mass detector was centroid and the noise level 1.0E5. For MS level 2 the noise level was set at 1.0E3. To build chromatograms the option “chromatogram builder” was used with the minimum time span set at 0.01, the minimum height at 3.0E5 and the mass tolerance 20ppm. For the chromatogram deconvolution algorithm “baseline cut-off” was used with minimum peak height of 1.5E3, a peak duration range between 0.01 and 3 and a baseline level of 1.0E3. The m/z range for MS2 scan pairing was set at 0.02 and the retention time (RT) range for MS2 scan pairing at 0.1. To group the isotopes the function “isotope grouper” was used with the following settings: the m/z tolerance was set at 20ppm and retention time tolerance at 0.1 s and the minimum charge of 3. The sample was then aligned with the function “join alignment” with the following parameters: m/z tolerance 20ppm, weight for m/z 75, retention time tolerance 0.1 and weight for RT 25. To remove noise the option “peak row list” was used with the settings: minimum peaks in a row set at 1, minimum peaks in an isotope pattern set at 2 and with the option “keep only peaks with MS2 scan” checked. Finally, the gap filling function was used with intensity tolerance at 10%, m/z tolerance 20ppm and retention time tolerance 0.2. At the end of these analyses, MZmine produced a feature table with the abundances of all molecules and a.mgf file containing the MS/MS summary to use for molecular networking in GNPS. For clarity, metabolite is used when identification is based on a spectrum library match, otherwise the term feature is used.
Spectrum Annotation and Molecular Networking in GNPS
Before importing the feature table into GNPS, contaminants were removed by comparing molecules detected in the samples and in the blanks. Specifically, molecules that were more abundant in the blanks than in the samples were removed. For molecules present in the sample and blanks, though less abundant in the blanks, the mean blank abundance value was subtracted from the abundance of the molecule in each sample. The abundances of all molecules were normalized by dividing them by the total abundance of all molecules in the sample. The feature table and the .mgf files generated by MZmine 2.33 were imported into the “feature based networking” function in the online molecular networking platform GNPS (Wang et al., 2016; Nothias et al., 2020). A pairwise method was used in GNPS to compare the similarity of spectral fragmentations patterns between all spectra utilizing a cosine score as a unit of relatedness. GNPS provided all necessary documentation to guide the parameterizations on the network analysis. The following criteria was used to connect two nodes in GNPS: spectral similarity with a cosine score higher than 0.7, a minimum of 6 matching spectra, and each node had to be in the 10 most similar features of the other node. The matching of MS/MS fragments within two spectra is used by the ranking algorithm. Thus, the mass difference between the precursors and the MS/MS fragments remains the same. This system identifies analogs that have multiple modifications in a specific location of the molecules or analogs that differ by one general modification. Compounds that have two or more modifications in different parts of the molecules can be, in some cases, connected through an analog with a single modification. Using the default settings, the MS spectra were searched against the public GNPS libraries to identify as many molecules as possible. All molecules that were specific for mitochondria or Symbiodiniaceae and had an ID were subsequently searched in the online literature.
Lipid Saturation Analysis
The list of all network pairs (i.e., connections between two nodes across all networks) and the mass difference between the two nodes was downloaded from GNPS. To quantify the degree of unsaturation-saturation, we identified all pairs of structurally similar metabolites forming direct connections in networks that differed by the mass of a hydrogen pair/double bond (difference in mass from 2.00—2.19 m/z). The abundance of each feature (i.e., node) in these pairs was then extracted from the MZmine abundance table, providing the abundances of all pairs of unsaturated-saturated molecules across all samples. The difference in the abundances of the molecules forming the pairs was calculated as the abundance of the unsaturated molecule minus the abundance of the saturated molecule. Thus, a positive value indicated higher abundance of the unsaturated molecule and a negative value indicated higher abundance of the saturated molecule. The saturation state was quantified across all unsaturation-saturation pairs in a sample by taking a mean value of the difference in abundance between all pairs. To understand whether the metabolites were desaturating or saturating through time, the mean values were calculated across all samples and time points, such that changes in abundance between members of the pair through time reflected a shift in saturation. Thus, this analysis allowed us to focus on a single process occurring in specific and distinct parts of the holobiont, the host mitochondria and its algal symbionts.
Direct Counts of Coral Mitochondria and Chloroplasts
The metabolomic analysis allowed us to test hypotheses related to physiological changes within the cell. To better understand how the thermal environment impacted the cells overall we quantified the coral mitochondria and chloroplasts (as an indicator of algal symbiont abundance) using a second experiment with the same conditions. For both organelles, 35 replicates were used to fully parameterize the stable state at ambient temperature and 12 replicates were collected for each time point at higher temperatures based on the availability of coral material. The coral tissue was removed as described above and both cell types were enumerated using fluorescence microscopy. The coral cells were stained with MitoTracker Red (ThermoFisher) to mark the mitochondria, while the chloroplasts were quantified using endogenous chlorophyll auto-fluorescence. Just prior to microscopy, the coral cell concentration was calculated (as previously described) in all the replicates and adjusted to have the same concentration of cells across all the samples and counts were conducted from the same volume for each sample. A fluorescence microscope (IX70 Olympus) fitted with 581nm/644nm excitation/emission and 465nm/673nm excitation/emission filter sets was used to visualize the stained mitochondria and chloroplast autofluorescence of the algal cells, respectively. Subsequently, ImageJ (Bankhead, 2014) was used to delete the light emitted in the background noise. ImageJ was used to measure the mean grey value (number of grey pixels divided by the number of total pixels), which was used as a proxy for the relative abundances of mitochondria and chloroplasts.
Statistical Tests
The metabolomic profiles of the tissue fractions in ambient and high temperature conditions were compared using Random Forest in R (R Core Team, 2020). This modelling generated an overall error (out-of-bag) as well as a class error, which indicates the extent to which a given sample was correctly classified to its actual treatment group versus placed in the incorrect treatment group. A subset of samples was used to grow each tree to normalize the samples used to the smallest treatment group because the number of samples from ambient and high temperature conditions were not the same (n = 10-15 ambient and n = 3 high temperature per time point) following Hartmann et al. (2017). For each comparison, 5000 trees were grown. The error was plotted across trees, and it was confirmed that the error stabilized, indicating that 5000 trees was sufficient to converge on the optimal model.
An ANOVA in R was used to determine whether the abundances of the chloroplasts or mitochondria and the levels of saturation in each changed during the elevated temperature experiment. Particularly, we were interested in whether there was a difference between the start and end of the experiment. The assumptions of normality and homoscedasticity were tested, and log squared transformation were made when needed. A post-hoc Tukey-Kramer honest significant difference (HSD) pairwise comparison was made for all significant results from ANOVA. Using R package “pwr” we discovered that to have a statistical power of 80% in an ANOVA with 5 groups (4 time points plus the one at ambient temperature) we need at least 10 replicates for each time point. Two linear regressions were used to determine if there was a correlation between saturation of mitochondria and algal symbionts and time. The assumptions of normality and equal variance were tested prior. Two additional linear regressions were made to determine if there was a correlation between abundances of mitochondria and algal symbionts and time. The assumptions of normality and equal variance were tested prior.
Results
Metabolite Profiling of Whole Coral and Isolated Fractions
Samples of all three fractions—bulk coral holobiont (host and symbionts), isolated algal symbiont cells, and isolated coral mitochondria—grouped with their fraction type in the Random Forest proximity based on the presence/absence of metabolite ion features (Figure 2A) and the abundances of those metabolites (Figure 2B). The Random Forest model based on metabolite presence/absence (Figure 2A) produced an overall error rate (out-of-bag) of 9.6%. The model perfectly distinguished the coral samples (0% error) from all other samples and incorrectly mismatched the mitochondria and algal symbiont samples at low rates (9.1% and 12% error, respectively). Based on the abundance of features, the Random Forest model (Figure 2B) produced an overall error rate of 7.7%, a slight improvement over the binary metabolite model. As with the binary model, the abundance-based model perfectly distinguished the coral samples (0% error) and incorrectly mismatched mitochondria and algal symbiont samples at low rates (4.5% and 12% error, respectively).
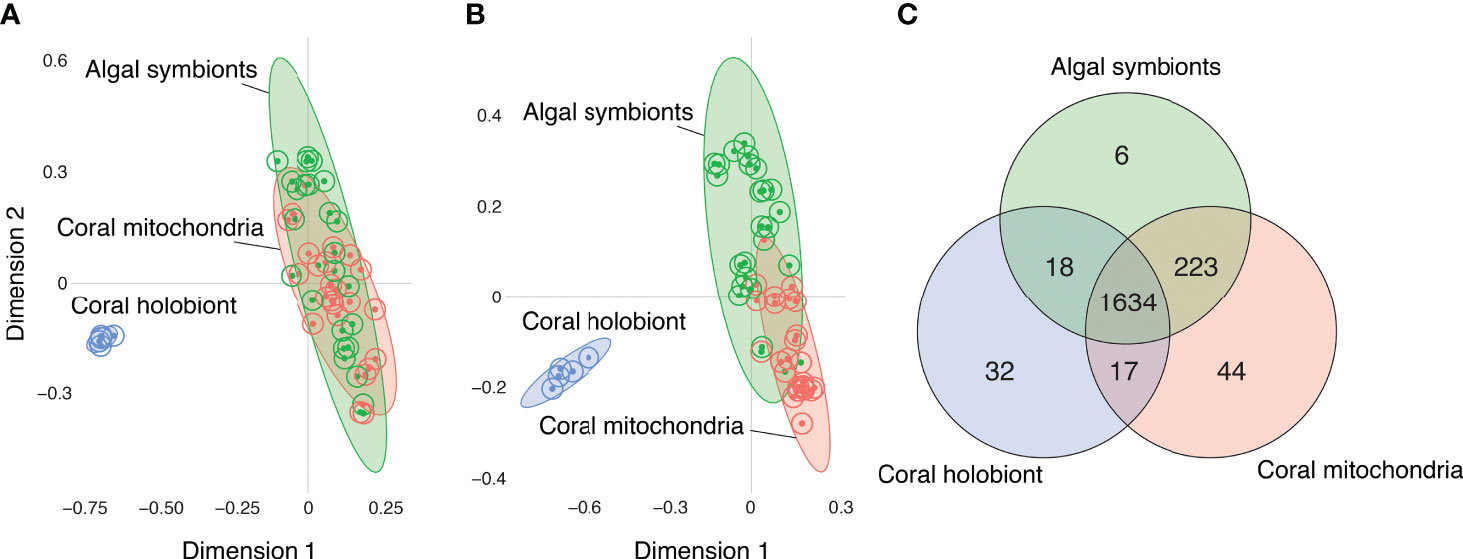
Figure 2 Comparisons of the metabolomes of coral holobionts (blue) versus isolated fraction of their algal symbionts (green) and mitochondria (red) using Random Forest proximity plots. (A) The metabolomic profiles of corals, mitochondria, and algal cells based on the presence/absence of metabolites. (B) The metabolomic profiles of corals, mitochondria, and algal cells based on the abundance of metabolites. (C) A Venn diagram of the distribution of molecules based on their presence/absence in each of the fractions.
When the detection of metabolites was compared between fractions, most features (1634 or 83%), were present in all three fractions (Figure 2C). The next largest group of shared molecules were those shared between the algal symbionts and the coral mitochondria (223 or 11%). The number of features shared between the algal symbiont and mitochondria fractions was an order of magnitude more than the number of features shared between corals and their mitochondria (i.e., not in algal symbionts; 1%), and features shared between corals and algal symbionts (i.e., not in mitochondria; 1%). Because the whole coral fraction contains the algal and mitochondria fractions, we can sum those features not detected in the whole coral fraction to quantify the metabolites that are masked by not partitioning the samples prior to analysis. We found that 273 (14%) of metabolite features are presumably present but not detected in the whole coral samples, showing that partitioning samples into respective portions allows for the detection of a larger number of metabolite features.
Metabolome-Wide Responses to Temperature Increase in Coral Mitochondria and Symbiotic Algae Cells
All detected features and their abundances were used to profile the metabolomes of coral mitochondria and their algal symbionts before and after the increase in temperature. The full metabolomic profiles of mitochondria revealed a rapid shift of the metabolome from the time corals were in ambient conditions to the first two hours they spent in elevated temperatures, with little change after that (2 h to 16 h; Figure 3A). This was supported in the Random Forest model, which correctly assigned 9 of 10 ambient samples into the correct group (10% error), with one misassigned ambient sample was placed in the 1 h group. All three 1 h samples were correctly assigned (0% error), while 2 h, 4 h, and 16 h were all less distinguishable from one another (33%, 100%, and 33% error, respectively). The Random Forest model produced an overall error rate of 27.3%. The algal symbionts did not show any overall metabolomic patterns that would suggest a response to the temperature increase (Figure 3B). The error rates of ambient, 1 h, 2 h, 4 h, and 16 h were 54%, 33%, 100%, 0%, and 33%, respectively, while the Random Forest model produced an overall error rate of 48%.
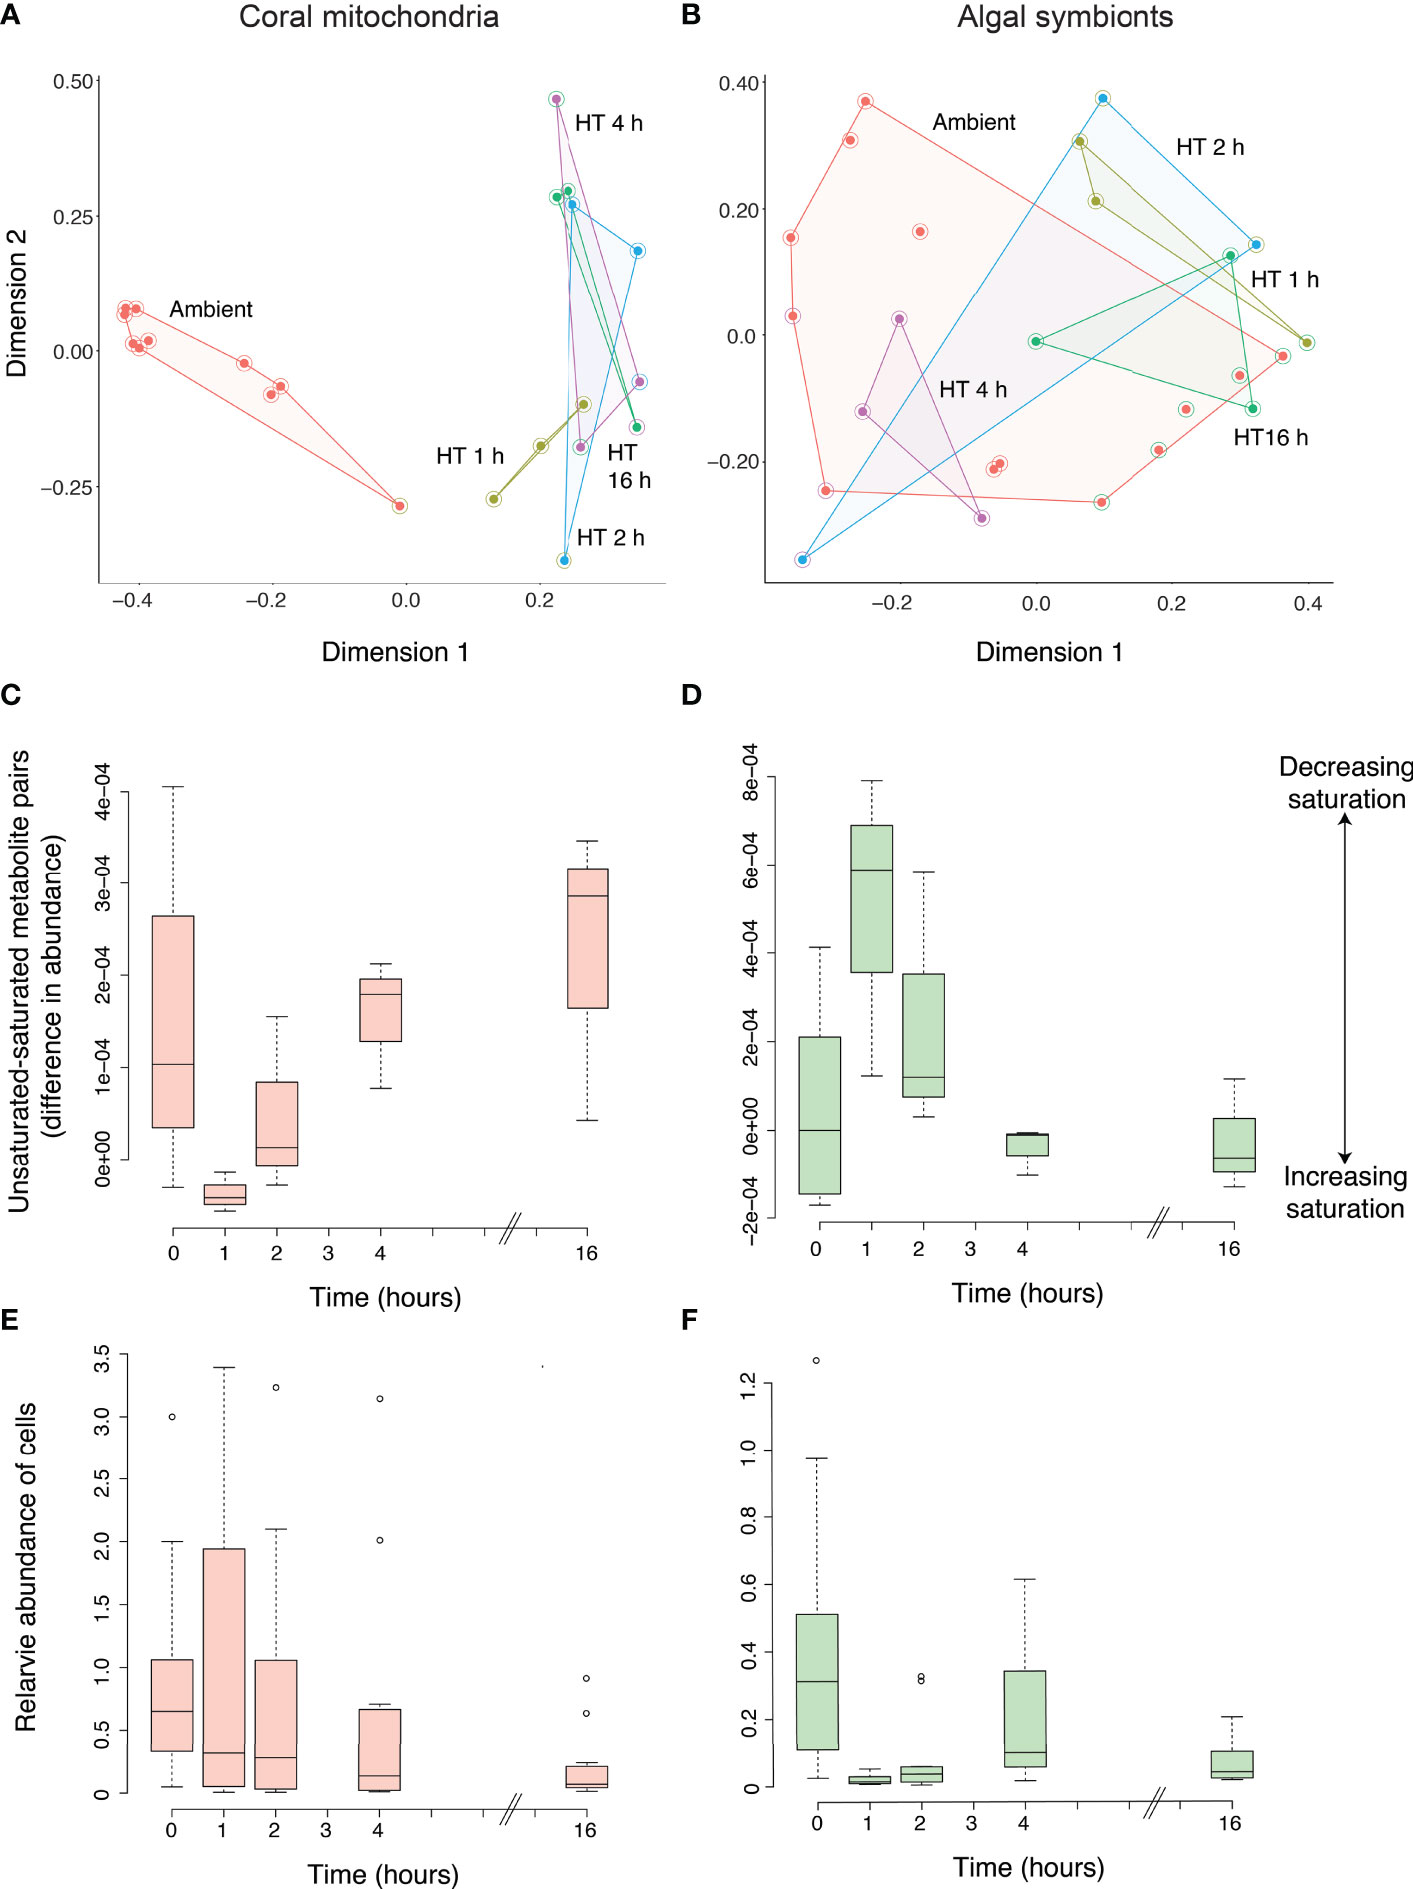
Figure 3 Metabolomic profiling of the response of coral mitochondria and algal symbionts to increased temperatures. The metabolomic profiles of coral mitochondria (A) and coral algal symbionts (B) at ambient temperature and at 1, 2, 4, and 16 h of elevated temperatures based on the abundance of metabolites as shown through a Random Forest proximity plot. High temperature is indicated by “HT” with the number of hours exposed to elevated temperature. All samples from the same time point are connected by lines, creating an enclosed space. The interior filled circle color indicates the group to which the sample belonged and the halo circle around it indicates the group in which the Random Forest model placed the sample. The delta values or degree of unsaturation to saturation of membrane lipids in the coral mitochondria (C) and the coral algal symbionts (D) at ambient temperature and at 1, 2, 4, and 16 h of elevated temperature. Positive delta values indicate a higher abundance of unsaturated molecules while negative values indicate a higher abundance of saturated values. Bars indicate the 25th and 75th Percentiles. The abundance of coral mitochondria (E) and algal chloroplasts (as a proxy of coral algal symbiont abundance; (F) at ambient temperature and at 1, 2, 4, and 16 h of elevated temperature.
Changes in Lipid Saturation in Coral Mitochondria and Algal Cell in Response to Temperature Increase
Metabolite quantifications and molecular networking were used to determine changes in the saturation of mitochondria and Symbiodiniaceae membranes during thermal stress. For the mitochondria, 17 unsaturated-saturated molecule pairs were identified through the molecular network, while 12 pairs were identified for the algal cells. The mitochondria mean unsaturated-saturated values were positive for the majority of replicates at ambient temperature (0 h, 80%; Figure 3C). Thus, under ambient conditions, unsaturated molecules were more abundant than saturated molecules in coral mitochondria. After 1 h of exposure to a higher temperature, mitochondria exhibited an increase in the abundance of saturated molecules relative to unsaturated molecules. However, as exposure to the warmer temperature continued, there was a linear increase in the unsaturated-saturated value (linear regression; p = 0.021; R2 = 0.42). This pattern demonstrated an increase in the abundance of unsaturated molecules relative to saturated molecules and a return to similar levels as those observed prior to the thermal stress. Therefore, elevated temperatures did not lead to a sustained increase in saturation, as hypothesized, but instead led to a brief increase in saturation followed by a decrease in saturation back to levels observed during ambient conditions. Despite the significant regression trend, the ANOVA detected no significant difference in mitochondrial saturation between time points (p = 0.114), further supporting the overall pattern of acclimatization or lack of change in saturation in the mitochondria due to the temperature increase.
Unlike the mitochondria, the unsaturation-saturation values in the algal symbionts at ambient conditions included both positive and negative values with a mean near zero (0.000045; Figure 3D). This result suggests that the abundance of molecules that are fully saturated is similar to the abundance of molecules with at least one double bond in the algal symbionts. After 1 h of increased temperature, the algal symbiont unsaturated-saturated values increased significantly (Tukey HSD; p = 0.028). This result indicated an increase in the relative abundance of unsaturated molecules and was opposite to the pattern in mitochondria. After this point (2 h), the delta values continued to decline and reached negative values at the later time points of 4 h, which was significantly lower (Tukey HSD; p = 0.045) compared to values after 1 h, and 16 h. This rapid return to ambient levels by 4 h also explains the lack of a negative linear trend across all time points (linear regression; p = 0.1; R2 = 0.24). Therefore, like the mitochondria, the Symbiodiniaceae underwent a rapid change in saturation between 0 h and 1 h, then returned to saturation levels similar to ambient conditions. But the rapid change after 1 h observed in the algal symbionts (saturating) occurred in the opposite direction of that observed in the mitochondria (desaturating).
Changes in Mitochondria and Chloroplast Abundance in Response to Temperature Increase
The number of mitochondria in the coral host remained stable at 1 and 2 h after the coral fragments were placed in the experimental tank with elevated temperature. At 4 h there was a significant difference in abundance across time as a decrease in the number of mitochondria (Tukey HSD; p-value= 0.002; Figure 3E) was observed, that persisted until the end of the experiment (16 h). Consistently, there was a negative linear relationship between mitochondria abundance and time (p < 0.001; R2 = 0.18). In contrast to the delayed drop in mitochondria, the number of chloroplasts decreased immediately after the thermal stress as indicated by a significant decrease in auto-fluorescence after 1, 2 and 16 h (Tukey HSD; all p < 0.001; Figure 3F) compared to 0 h. At 0 and 4 h, there was a large amount of variation in the abundance of the chloroplasts. Again, there was a negative linear relationship between chloroplast abundance and time (p < 0.001; R2 = 0.26).
Annotated Metabolites Among Saturation-Unsaturation Pairs
The 53 molecules comprising the saturated-unsaturated pairs in the mitochondria and Symbiodiniaceae were searched in GNPS against public libraries of known molecules. Some of the molecules were present in more than one pair, hence the odd number. Among them, two metabolites were annotated based on MS/MS matches in GNPS (Table 1). These annotations were Level 3 matches according to the 2007 Metabolomics Standards Initiative (Sumner et al., 2007), thus useful for identifying the class of metabolites of the saturation-unsaturation pairs, but not the location of E vs. Z configurations. The two identified metabolites were 1-Palmitoyl-2-hydroxy-sn-glycero-3-phosphoethanolamine and 1-Hexadecanoyl-sn-glycero-3-phosphoethanolamine, both of which are phospholipids. Among the rest, five molecules in pairs shared a molecular family with at least one identified molecule (Table 1) and the majority of these metabolites were also phospholipids (Table 1). This result supports the conclusion that the metabolites found in the saturation-unsaturation pairs are primarily phospholipids making up the membranes of both the mitochondria and algal chloroplasts.
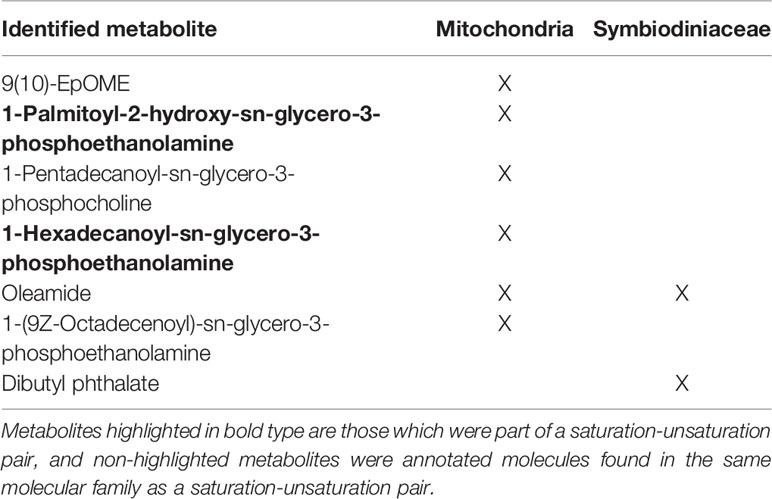
Table 1 Summary of annotated metabolites and the fraction in which they were detected.
Discussion
The primary goal of this work was to examine the benefits of partitioning tissue fractions—in this case the coral holobiont from its mitochondria and algal symbionts—prior to untargeted metabolomic analyses. Partitioning our sample in this way allowed us to test hypotheses about specific physiological responses while also achieving a robust detection of all the metabolites present in the samples. The experiment was used to (1) examine changes in the full metabolomic profile of the coral mitochondria and algal symbionts and (2) test the hypothesis that the coral mitochondria and algal chloroplasts acclimatize by modifying their membrane lipid saturation in favor of rigidity to compensate for the increased fluidity incurred from the temperature increase. Although coral bleaching (the breakdown of the coral-algal symbiosis) is now recognized as a recurrent problem, there is still a lack of knowledge about how host and symbiont physiology responds during a thermal stress event, especially in the host and in the earliest hours following the change in temperature.
Each fraction—holobiont, coral mitochondria, and algal symbiont—had a distinct metabolomic profile. The majority of features (83%) were found in all three fractions. Notably, the mitochondria and algal symbionts did not only produce a subset of metabolites produced by the entire holobiont. Instead, 273 or 14% of features were only detected in the mitochondria and/or the algal symbionts. These results show the importance and necessity of partitioning samples. For example, given the results shown here of distinct metabolomes between tissue fractions, including molecules that are masked when bulk samples (i.e., no partitioning) are analyzed, likely due to low concentrations and/or overlap with other, larger peaks. Interestingly, molecules detected in only two of the three fractions were most commonly those that were shared between the mitochondria and algal symbionts (11%) instead of the holobiont and either of the other fractions (1% for each). This result highlights similarities in the chemical building blocks used by the single-celled dinoflagellate and the energy-producing organelle of the coral.
The coral mitochondria exhibited a large shift in their overall metabolomic profile over the first two hours of warm water exposure, followed by a stabilization (no difference in profiles). The algal symbionts showed no clear metabolome-wide response to the temperature increase. Therefore, the mitochondrial metabolome transitioned to a new state, while the algal symbiont metabolome was largely unchanged. In contrast to the muted responses observed in the full metabolomic profiles, the mitochondria and algal symbionts exhibited rapid responses in hydrogen saturation. The abundance of unsaturated to saturated fatty acids in the mitochondria and algal symbionts deviated from the ambient control samples in the first hour following the temperature increase, then progressively returned to levels indistinguishable from that exhibited in ambient conditions. Thus, both fractions exhibited rapid acclimatization of membrane fluidity following a +3°C temperature increase. These results suggest that the coral acclimatization response to increased temperatures can be quite rapid and likely overlooked in studies with longer time points between sampling points.
Surprisingly, the rapid saturation change observed at 1 h of elevated temperature exposure in both fractions occurred in opposite directions: the mitochondria saturated and the algal symbionts unsaturated. The mitochondrial response of a rapid saturation is consistent with the saturation of cardiolipins, mitochondria-specific lipids containing polyunsaturated fatty acids, during thermal stress (Balogh et al., 2013; Pizzuto and Pelegrin, 2020; Emami et al., 2021). We did not detect cardiolipins, as they are larger than the scanning window used in the LC-MS/MS analysis. Our result suggests that other unsaturated lipids in addition to cardiolipins may also be saturated in response to stress, perhaps leading to cell death, similar to responses observed in cardiolipins.
The decrease of mitochondria saturation after 1 h is, however, distinct from previous works in other organisms (i.e., soybean, goldfish, Atlantic killifish) which show a sustained (measured after several days) increase in mitochondria membrane saturation in response to elevated temperature (van den Thillart et al., 1978; Chung et al., 2018; Davy De Virville et al., 2002). Preliminarily, it seems that the mitochondria in corals tend to increase their fluidity when exposed to higher temperatures yet can recover and acclimatize quickly by restoring membrane rigidity necessary for mitochondrial function. However, it remains elusive whether the rapid change of lipid saturation originates as commonly described through fatty acids metabolism and CoA-dependent fatty acid desaturase (Ballweg and Ernst, 2017; Ballweg et al., 2020) or if there is direct in situ modulation of membrane associated lipids as it has been described for chloroplasts (Schmidt and Heinz, 1990; Andersson and Dörmann, 2008). Either way, we see that a slower sampling schedule would have missed the saturation event in corals altogether, which would have led to the conclusion that there was no response in the coral holobiont.
We observed a rapid desaturation followed by an increase in saturation in the algal symbionts. The rapid desaturation of the algal symbionts partially agrees with a recent study by Botana et al. (2020) that showed how the glycolipids 18:4 and 18:5, lipids that are enriched inside chloroplasts membranes (Kobayashi and Wada, 2016), are maintained at high levels after a heat shock of the algal symbionts. Meanwhile, the abundances of phosphatidylcholine and 1,2-diacylglyceryl-3-(O-carboxyhydroxymethyl)-choline, containing saturated fatty acids tails tend to decrease overall. The increase of saturation of the algal symbionts observed in the later time points of our experiment agrees with previous work (Tchernov et al., 2004).
At ambient temperature, we found that the mitochondria of corals tend to have a higher degree of membrane unsaturation than their algal symbionts. This result is supported by previous studies showing that the ratio of saturated and unsaturated fatty acids differs between tissue types and different lipid species (Yabuuchi and O’Brien, 1968; Wood and Harlow, 1969). In addition, the unsaturation-saturation values of both fractions were highly variable at ambient temperatures and became narrower during exposure to increased temperatures, particularly in the mitochondria. This response lends evidence that the changes in saturation observed here were a response to the change in temperature.
The abundances of mitochondria and chloroplasts inside the symbiont were quantified during a sister experiment to help us better understand changes in saturation. Mitochondrial abundances started to decrease after 4 h of increased temperature and continued until a major decline at 16 h of thermal stress. Previous studies have shown conflicting results: some have demonstrated a decrease in mitochondrial abundance while other studies report no change (Dunn et al., 2012; Nielsen et al., 2018). As shown by Dunn et al. (2012), we speculate that the decrease in mitochondria abundance relates to the production of ROS and the reduced capacity of mitochondria to control ROS generation and membrane structure. The observed decrease in mitochondria abundance during the thermal stress experiment suggests that the loss of mitochondria integrity due to thermal stress could be important for the symbiosis disruption (Dunn et al., 2004; Ainsworth et al., 2008; Dunn et al., 2012).
In comparison to the gradual change in mitochondria abundance, changes in algal symbiont chloroplast abundance were large and more rapid. While the mitochondrial response initiated after 4 h, chloroplasts abundance decreased within the first hour of exposure. Consistent with this observation, the coral fragments looked visually paler than they were prior to the temperature increase. Our results agree with a previous report that high temperature leads to chloroplast degradation (Salih et al., 2006). During high temperatures, chloroplasts overproduce ROS due to the uncoupling of the photosynthetic reactions (Lesser and Shick, 1989; Lesser et al., 1990). In fact, the heat inhibits the electron transport chain in photosynthesis. The leakage of electrons leads to the formation of ROS (Wang et al., 2018). The thylakoid membranes of chloroplasts possess lipids and pigments that are sensitive to ROS, and hence the overproduction of ROS can lead to chloroplast disorganization and breakdown (Asada, 2006; Salih et al., 2006).
In summary, we conclude that partitioning samples by tissue type prior to untargeted metabolomics enabled us to identify specific metabolites and patterns of saturation-unsaturated pairs in a coral-symbiotic system, a non-model system. Here, we found that a host organelle and an algal symbiont demonstrated opposite physiological responses to the same environmental stress, all the while showing minimal change in their overall metabolomic profile. This approach allows researchers to expand their use of the vast amount of untargeted metabolomics data collected, which in turn will allow us to better understand how organisms respond to change.
Data Availability Statement
Data generated in this study is available in the Mass spectrometry Interactive Virtual Environment (http://massive.ucsd.edu/) under accession number MSV000083372, and includes the LC-MS/MS.raw and .mzXML files.
Author Contributions
This study was designed by AG, RF, FR, and AH. The samples were prepared by AG with the help of ML and BW. The mass spectrometry data was acquired by DP. The data analysis was performed by AG and AH. The results were interpreted by AG, RF, FR, AH, DP, and PD. The manuscript was written by AG, RF, and AH. All authors read and approved the final version of the manuscript.
Funding
DP acknowledges support from Deutsche Forschungsgemeinschaft for a postdoctoral research fellowship (PE 2600/1-1). FR acknowledges the support from the Gordon and Betty Moore Foundation GBMF9207. AG was supported by Msc program in Marine Biology from the Department of Biology at Stockholm University. RF is supported by the Knut and Alice Wallenberg Foundation.
Conflict of Interest
The authors declare that the research was conducted in the absence of any commercial or financial relationships that could be construed as a potential conflict of interest.
Publisher’s Note
All claims expressed in this article are solely those of the authors and do not necessarily represent those of their affiliated organizations, or those of the publisher, the editors and the reviewers. Any product that may be evaluated in this article, or claim that may be made by its manufacturer, is not guaranteed or endorsed by the publisher.
Acknowledgments
AG acknowledges the helpful advice and/or discussion of results with Marina Botana (Victoria University of Wellington), Maria-Isabel Rojas (San Diego State University), Cynthia Silveira (San Diego state University) and Professor Monika Winder (Stockholm University). AG also thanks Gonzalo Giribet, Adam Baldinger, the Department of Organismic and Evolutionary Biology and Invertebrate Zoology at Harvard University and the Museum of Comparative Zoology, respectively.
References
Ainsworth T. D., Hoegh-Guldberg O., Heron S. F., Skirving W. J., Leggat W. (2008). Early Cellular Changes Are Indicators of Pre-Bleaching Thermal Stress in the Coral Host. J. Exp. Mar. Bio. Ecol. 364, 63–71. doi: 10.1016/j.jembe.2008.06.032
Andersson M. X., Dörmann P. (2008). Chloroplast Membrane Lipid Biosynthesis and Transport. Plant Cell Monogr. 13, 125–149. doi: 10.1007/7089_2008_18
Asada K. (2006). Production and Scavenging of Reactive Oxygen Species in Chloroplasts and Their Functions. Plant Physiol. 141, 391–396. doi: 10.1104/pp.106.082040
Ballweg S., Ernst R. (2017). Control of Membrane Fluidity: The OLE Pathway in Focus. Biol. Chem. 398, 215–228. doi: 10.1515/hsz-2016-0277
Ballweg S., Sezgin E., Doktorova M., Covino R., Reinhard J., Wunnicke D., et al. (2020). Regulation of Lipid Saturation Without Sensing Membrane Fluidity. Nat. Commun. 11, 1–13. doi: 10.1038/s41467-020-14528-1
Balogh G., Péter M., Glatz A., Gombos I., Török Z., Horváth I., et al. (2013). Key Role of Lipids in Heat Stress Management. FEBS Lett. 587, 1970–1980. doi: 10.1016/j.febslet.2013.05.016
Banaszak A. T. (2007). Optimization of DNA Extraction From a Scleractinian Coral for the Detection of Thymine Dimers by Immunoassay. Photochem. Photobiol. 83, 833–838. doi: 10.1111/j.1751-1097.2007.00083.x
Bankhead P. (2014). Analyzing Fluorescence Microscopy Images With ImageJ. Heidelberg University, Queen’s University: Nikon Imaging Center.
Barelli H., Antonny B. (2016). Lipid Unsaturation and Organelle Dynamics. Curr. Opin. Cell Biol. 41, 25–32. doi: 10.1016/j.ceb.2016.03.012
Botana M., Chaves-Filho A., Inague A., Guth A. (2020). Thermal Plasticity in Coral Reef Symbionts Is Mediated by Oxidation of Membrane Lipids. Res. Square. doi: 10.21203/rs.3.rs-96835/v1. [Preprint].
Chambers M. C., MacLean B., Burke R., Amodei D., Ruderman D. L., Neumann S., et al. (2012). A Cross-Platform Toolkit for Mass Spectrometry and Proteomics. Nat. Biotechnol. 30, 918–920. doi: 10.1038/nbt.2377
Chung D. J., Sparagna G. C., Chicco A. J., Schulte P. M. (2018). Patterns of Mitochondrial Membrane Remodeling Parallel Functional Adaptations to Thermal Stress. J. Exp. Biol. 221:jeb174458. doi: 10.1242/jeb.174458
Da Silva R. R., Dorrestein P. C., Quinn R. A. (2015). Illuminating the Dark Matter in Metabolomics. Proc. Natl. Acad. Sci. U. S. A. 112, 12549–12550. doi: 10.1073/pnas.1516878112
Davy De Virville J., Cantrel C., Bousquet A. L., Hoffelt M., Tenreiro A. M., Vaz Pinto V., et al. (2002). Homeoviscous and Functional Adaptations of Mitochondrial Membranes to Growth Temperature in Soybean Seedlings. Plant Cell Environ. 25, 1289–1297. doi: 10.1046/j.1365-3040.2002.00901.x
Dubinsky Z., Stambler N. (2011). Coral Reefs: An Ecosystem in Transition. Dordrecht: Springer. doi: 10.1007/978-94-007-0114-4
Dunn S. R., Pernice M., Green K., Hoegh-Guldberg O., Dove S. G. (2012). Thermal Stress Promotes Host Mitochondrial Degradation in Symbiotic Cnidarians: Are the Batteries of the Reef Going to Run Out? PloS One 7:e39024. doi: 10.1371/journal.pone.0039024
Dunn S. R., Thomason J. C., Le Tissier M. D. A., Bythell J. C. (2004). Heat Stress Induces Different Forms of Cell Death in Sea Anemones and Their Endosymbiotic Algae Depending on Temperature and Duration. Cell Death Differ. 11, 1213–1222. doi: 10.1038/sj.cdd.4401484
Emami N. K., Jung U., Voy B., Dridi S. (2021). Radical Response: Effects of Heat Stress-Induced Oxidative Stress on Lipid Metabolism in the Avian Liver. Antioxidants 10, 1–15. doi: 10.3390/antiox10010035
Gardner S. G., Raina J. B., Nitschke M. R., Nielsen D. A., Stat M., Motti C. A., et al. (2017). A Multi-Trait Systems Approach Reveals a Response Cascade to Bleaching in Corals. BMC Biol. 15, 117. doi: 10.1186/s12915-017-0459-2
Garg N. (2021). Metabolomics in Functional Interrogation of Individual Holobiont Members. mSystems 6, 1–5. doi: 10.1128/msystems.00841-21
Gombos Z., Wada H., Hideg E., Murata N. (1994). The Unsaturation of Membrane Lipids Stabilizes Photosynthesis Against Heat Stress. Plant Physiol. 104, 563–567. doi: 10.1104/pp.104.2.563
Hartmann A. C., Petras D., Quinn R. A., Protsyuk I., Archer F. I., Ransome E., et al. (2017). Meta-Mass Shift Chemical Profiling of Metabolomes From Coral Reefs. Proc. Natl. Acad. Sci. U. S. A. 114, 11685–11690. doi: 10.1073/pnas.1710248114
Hughes T. P., Kerry J. T., Álvarez-Noriega M., Álvarez-Romero J. G., Anderson K. D., Baird A. H., et al. (2017). Global Warming and Recurrent Mass Bleaching of Corals. Nature 543, 373–377. doi: 10.1038/nature21707
Kobayashi K., Wada H. (2016). “Role of Lipids in Chloroplast Biogenesis,” in Lipids in Plant and Algae Development. Eds. Nakamura Y., Li-Beisson Y. (Cham: Springer International Publishing), 103–125.
Kristián T., Hopkins I. B., McKenna M. C., Fiskum G. (2006). Isolation of Mitochondria With High Respiratory Control From Primary Cultures of Neurons and Astrocytes Using Nitrogen Cavitation. J. Neurosci. Methods 152, 136–143. doi: 10.1016/j.jneumeth.2005.08.018
Lesser M. P., Shick J. M. (1989). Effects of Irradiance and Ultraviolet Radiation on Photoadaptation in the Zooxanthellae of Aiptasia Pallida: Primary Production, Photoinhibition, and Enzymic Defenses Against Oxygen Toxicity. Mar. Biol. 102, 243–255. doi: 10.1007/BF00428286
Lesser M. P., Stochaj W. R., Tapley D. W., Shick J. M. (1990). Coral Reefs Effects of Irradiance, Ultraviolet Radiation, and Temperature. Coral Reefs 8, 225–232. doi: 10.1007/BF00265015
Mydlarz L. D., Jacobs R. S., Boehnlein J., Kerr R. G. (2003). Pseudopterosin Biosynthesis in Symbiodinium Sp., the Dinoflagellate Symbiont of Pseudopterogorgia Elisabethae. Chem. Biol. 10, 1051–1056. doi: 10.1016/J.CHEMBIOL.2003.10.012
Nielsen D. A., Petrou K., Gates R. D. (2018). Coral Bleaching From a Single Cell Perspective. ISME J. 12, 1558–1567. doi: 10.1038/s41396-018-0080-6
Nothias L. F., Petras D., Schmid R., Dührkop K., Rainer J., Sarvepalli A., et al. (2020). Feature-Based Molecular Networking in the GNPS Analysis Environment. Nat. Methods 17, 905–908. doi: 10.1038/s41592-020-0933-6
Oswald F., Schmitt F., Leutenegger A., Ivanchenko S., D’Angelo C., Salih A., et al. (2007). Contributions of Host and Symbiont Pigments to the Coloration of Reef Corals. FEBS J. 274, 1102–1122. doi: 10.1111/j.1742-4658.2007.05661.x
Pasaribu B., Lin I. P., Tzen J. T. C., Jauh G. Y., Fan T. Y., Ju Y. M., et al. (2014). SLDP: A Novel Protein Related to Caleosin Is Associated With the Endosymbiotic Symbiodinium Lipid Droplets From Euphyllia Glabrescens. Mar. Biotechnol. 16, 560–571. doi: 10.1007/s10126-014-9574-z
Petras D., Caraballo-Rodríguez A. M., Jarmusch A. K., Molina-Santiago C., Gauglitz J. M., Gentry E. C., et al. (2021). Chemical Proportionality Within Molecular Networks. Anal. Chem. 93, 12833–12839. doi: 10.1021/acs.analchem.1c01520
Petras D., Koester I., Silva R., Da, Stephens B. M., Haas A. F., Nelson C. E., et al. (2017). High-Resolution Liquid Chromatography Tandem Mass Spectrometry Enables Large Scale Molecular Characterization of Dissolved Organic Matter. Front. Mar. Sci. 4. doi: 10.3389/fmars.2017.00405
Pizzuto M., Pelegrin P. (2020). Cardiolipin in Immune Signaling and Cell Death. Trends Cell Biol. 30, 892–903. doi: 10.1016/j.tcb.2020.09.004
Quinn R. A., Vermeij M. J. A., Hartmann A. C., d’Auriac I. G., Benler S., Haas A., et al. (2016). Metabolomics of Reef Benthic Interactions Reveals a Bioactive Lipid Involved in Coral Defence. Proc. R. Soc B Biol. Sci. 283, 469. doi: 10.1098/rspb.2016.0469
Rappez L., Stadler M., Triana S., Gathungu R. M., Ovchinnikova K., Phapale P., et al. (2021). SpaceM Reveals Metabolic States of Single Cells. Nat. Methods 18, 799–805. doi: 10.1038/s41592-021-01198-0
R Core Team (2020). R: A Language and Environment for Statistical Computing. Vienna, Austria: R Foundation for Statistical Computing. Available at: https://www.R-project.org/.
Richier S., Merle P. L., Furla P., Pigozzi D., Sola F., Allemand D. (2003). Characterization of Superoxide Dismutases in Anoxia- and Hyperoxia-Tolerant Symbiotic Cnidarians. Biochim. Biophys. Acta - Gen. Subj. 1621, 84–91. doi: 10.1016/S0304-4165(03)00049-7
Salih A., Cox G., Szymczak R., Coles S. L., Baird A. H., Dunstan A., et al. (2006). The Role of Host-Based Color and Fluorescent Pigments in Photoprotection and in Reducing Bleaching Stress in Corals. Proc. 10th Int. Coral Reef Symp. 756, 746–756.
Schmidt H., Heinz E. (1990). Desaturation of Oleoyl Groups in Envelope Membranes From Spinach Chloroplasts (Ferredoxin/Monogalactosyl Diacylglycerol/NADPH/Spinacia Okracea). Proc. Natl. Acad. Sci. U. S. A. 87, 9477–9480. doi: 10.1073/pnas.87.23.9477
Sumner L. W., Amberg A., Barrett D., Beale M. H., Beger R., Daykin C. A., et al. (2007). Proposed Minimum Reporting Standards for Chemical Analysis: Chemical Analysis Working Group (CAWG) Metabolomics Standards Initiative (MSI). Metabolomics 3, 211–221. doi: 10.1007/s11306-007-0082-2
Tchernov D., Gorbunov M. Y., De Vargas C., Yadav S. N., Milligant A. J., Häggblom M., et al. (2004). Membrane Lipids of Symbiotic Algae Are Diagnostic of Sensitivity to Thermal Bleaching in Corals. Proc. Natl. Acad. Sci. U. S. A. 101, 13531–13535. doi: 10.1073/pnas.0402907101
van den Thillart G., Modderkolk J. (1978). The Effect of Acclimation Temperature on the Activation Energies of State III Respiration and on the Unsaturation of Membrane Lipids of Goldfish Mitochondria. BBA - Biomembr. 510, 38–51. doi: 10.1016/0005-2736(78)90128-1
van der Walt G., Lindeque J. Z., Mason S., Louw R. (2021). Sub-Cellular Metabolomics Contributes Mitochondria-Specific Metabolic Insights to a Mouse Model of Leigh Syndrome. Metabolites 11, 658. doi: 10.3390/metabo11100658
Wang M., Carver J. J., Phelan V. V., Sanchez L. M., Garg N., Peng Y., et al. (2016). Sharing and Community Curation of Mass Spectrometry Data With Global Natural Products Social Molecular Networking. Nat. Biotechnol. 34, 828–837. doi: 10.1038/nbt.3597
Wang Q. L., Chen J. H., He N. Y., Guo F. Q. (2018). Metabolic Reprogramming in Chloroplasts Under Heat Stress in Plants. Int. J. Mol. Sci. 19, 9–11. doi: 10.3390/ijms19030849
Wood R., Harlow R. D. (1969). Structural Analyses of Rat Liver Phosphoglycerides. Arch. Biochem. Biophys. 135, 272–281. doi: 10.1016/0003-9861(69)90540-2
Yabuuchi H., O’Brien J. S. (1968). Positional Distribution of Fatty Acids in Glycerophosphatides of Bovine Gray Matter. J. Lipid Res. 9, 65–67. doi: 10.1016/s0022-2275(20)43144-x
Keywords: untargeted metabolomics, homeoviscous adaptation, molecular networking, coral, LC-MS/MS
Citation: Gamba A, Petras D, Little M, White B, Dorrestein PC, Rohwer F, Foster RA and Hartmann AC (2022) Applying Tissue Separation and Untargeted Metabolomics to Understanding Lipid Saturation Kinetics of Host Mitochondria and Symbiotic Algae in Corals Under High Temperature Stress. Front. Mar. Sci. 9:853554. doi: 10.3389/fmars.2022.853554
Received: 12 January 2022; Accepted: 04 March 2022;
Published: 12 May 2022.
Edited by:
Jin Liu, Peking University, ChinaReviewed by:
Feng Liu, Institute of Oceanology, Chinese Academy of Sciences (CAS), ChinaEspen Holst Hansen, UiT The Arctic University of Norway, Norway
Copyright © 2022 Gamba, Petras, Little, White, Dorrestein, Rohwer, Foster and Hartmann. This is an open-access article distributed under the terms of the Creative Commons Attribution License (CC BY). The use, distribution or reproduction in other forums is permitted, provided the original author(s) and the copyright owner(s) are credited and that the original publication in this journal is cited, in accordance with accepted academic practice. No use, distribution or reproduction is permitted which does not comply with these terms.
*Correspondence: Aaron C. Hartmann, aaron.hartmann@gmail.com; Rachel A. Foster, rachel.foster@su.se
†Present address: Andrea Gamba, School of Biological Sciences, Victoria University of Wellington, Te Herenga Waka, New Zealand