Differential Responses of Eelgrass and Macroalgae in Pacific Northwest Estuaries Following an Unprecedented NE Pacific Ocean Marine Heatwave
 Caitlin L. Magel
 Francis Chan1
  Margot Hessing-Lewis
- 1Department of Integrative Biology, Oregon State University, Corvallis, OR, United States
- 2Hakai Institute, Campbell River, BC, Canada
- 3Institute for the Oceans and Fisheries, University of British Columbia, Vancouver, BC, Canada
The 2013-2016 northeast Pacific Ocean marine heatwave (MHW) had myriad impacts on marine communities, but little is known about how this event affected coastal estuaries. We examined the extent to which elevated temperatures associated with the offshore MHW were observed in four estuaries (Willapa Bay, Washington and Netarts Bay, Yaquina Bay, and Coos Bay, Oregon) and the responses of macrophytes at marine dominated sites within these estuaries. Records of eelgrass (Zostera marina), ulvoid macroalgae (Ulva and Enteromorpha spp.), and environmental characteristics, including water temperature, were analyzed over three periods: before (2006-2010), during (2015-2016), and after (2017-2019) the MHW. During the MHW, all four estuaries experienced “estuarine heatwaves” (anomalous warm water events) at monitoring stations and there was an associated decline in macroalgae biomass. In northern estuaries (Willapa and Netarts bays) where water temperatures are normally higher and estuaries are shallower, aboveground eelgrass biomass declined and did not recover for at least three years after the MHW. In southern estuaries (Yaquina and Coos bays), where water temperatures are normally colder and estuaries are deeper, the MHW was associated with a neutral, or temporarily positive, change in aboveground eelgrass biomass. Our analysis supports the hypothesis that upwelling intensity and estuarine depth determined the severity of MHW impacts on macrophytes at marine dominated sites, and that the colder and deeper estuaries in the south may serve as refuges for eelgrass but not macroalgae. We suggest that estuary-specific responses were predictable given the drivers of macrophyte abundance at marine dominated sites, and that baseline ocean upwelling and estuarine temperature can be used to anticipate macrophyte responses at marine dominated sites to MHWs in the future.
Introduction
Over the past century, climate change has led to longer and more frequent extremes in ocean temperatures that can have dramatic effects on marine and coastal ecosystems (Oliver et al., 2018). Marine heatwaves (MHWs) are defined as prolonged periods of anomalously high sea surface temperature (Hobday et al., 2016) and are superimposed on the existing anthropogenic warming trend of the global ocean (Domingues et al., 2008; Wijffels et al., 2016). However, the impacts of MHW events likely differ from those caused by gradual ocean warming, and there has been increased interest in how these acute thermal events affect biophysical and biogeochemical processes (Cavole et al., 2016; Benthuysen et al., 2020). A number of significant MHWs have occurred in the last 20 years, including a 2003 event in the Mediterranean Sea (Olita et al., 2006), several events between 2011 and 2016 around the continent of Australia (Pearce and Feng, 2013; Oliver et al., 2017; Benthuysen et al., 2018), a 2012 event in the northwest Atlantic Ocean (Chen et al., 2014), and the most extreme MHW on record known as “The Blob” in the northeast (NE) Pacific Ocean, which persisted from 2013-2016 (Di Lorenzo and Mantua, 2016).
Following the offshore formation of the NE Pacific Ocean MHW in 2013, coastal sea surface temperature anomalies were observed along the US west coast beginning in January 2014 and extending through August 2016 (Gentemann et al., 2017). Documented changes from this large event included decreases in primary production, geographical shifts of species ranging from copepods to sharks, mass strandings of marine mammals and seabirds, and closures of economically important fisheries from harmful algal blooms (reviewed in Cavole et al., 2016). In addition, offshore foundational marine macrophytes, including giant kelp and bull kelp, were strongly affected (Cavanaugh et al., 2019; Rogers-Bennett and Catton, 2019). However, the extent to which this MHW propagated into Pacific coastal estuaries triggering “estuarine heatwaves,” with subsequent effects on estuarine macrophytes (including seagrass and macroalgae), has not been considered. Furthermore, little is generally known about how MHWs interact with local-scale physiographic characteristics of estuaries to amplify or diminish their impacts.
Seagrasses and macroalgae are the foundation of highly productive estuaries by providing habitat for commercially important fish species, coastal protection via wave attenuation, and nutrient cycling (Barbier et al., 2011; Smale et al., 2013; Nordlund et al., 2016). Moreover, there is growing interest in conservation and restoration of marine macrophytes for their important role in the carbon cycle (Howard et al., 2017) and their potential to mitigate ocean acidification (Hendriks et al., 2014; Magel, 2020). However, it is estimated that roughly 30% of the global seagrass distribution has been lost, prompting concern over the future of this critical habitat (Orth et al., 2006; Waycott et al., 2009). Negative impacts of MHWs on seagrasses have been documented in Australia (Thomson et al., 2015; Kendrick et al., 2019) and seagrasses are known to be sensitive to elevated water temperature, particularly for populations near their thermal limits (Marbà and Duarte, 2010; Koch et al., 2013; Kaldy et al., 2017; Lefcheck et al., 2017; Aoki et al., 2020). Less is known, however, about the causes of estuarine macroalgae loss, with most attention focused on macroalgal blooms and eutrophication (except see Sfriso and Marcomini, 1996). In addition, seagrasses and macroalgae exhibit a range of interactions with one another depending on estuarine conditions (Burkholder et al., 1992; Hauxwell et al., 2001; McGlathery, 2001; Armitage et al., 2005; Burkholder et al., 2007; Hessing-Lewis et al., 2011). Thus, it is important to understand the resilience of both seagrasses and macroalgae to MHWs in order to anticipate the consequences of these events and guide conservation and management (Unsworth et al., 2018).
Shallow mudflat habitats in estuaries can transition between seagrass dominated, macroalgae dominated, or unvegetated mud in response to environmental conditions (Nyström et al., 2012), indicating a range of community states in these ecosystems. The dynamics that produce these states can be non-linear, driven by biophysical feedbacks between vegetation, sediment, and the water column (e.g., McGlathery et al., 2013; Maxwell et al., 2017; O’Brien et al., 2018), and differences in the physiological tolerances of seagrasses and macroalgae to variable light intensity, water temperature, and nutrients (Roca et al., 2016). These nonlinearities present significant challenges for estuarine conservation and restoration if they result in further declines, or lags in system recovery, after the removal of the original perturbation (Nyström et al., 2012; Roca et al., 2016; Maxwell et al., 2017; O’Brien et al., 2018).
Here we explore the response and recovery dynamics of native eelgrass (Zostera marina) and ulvoid macroalgae (Ulva spp. and Enteromorpha spp.) in estuaries along the US Pacific Northwest coast that were exposed to the recent NE Pacific Ocean MHW. In these estuaries, macrophytes experience a range of water temperatures (Thom et al., 2003), urbanization and eutrophication (Shelton et al., 2017), and disturbance from aquaculture practices (Tallis et al., 2009). Most studies have shown US Pacific Northwest eelgrass to be relatively resilient to these perturbations as indicated by their high production and wide distributional range (Thom et al., 2003; Hessing-Lewis and Hacker, 2013). For instance, a recent study of the long-term dynamics of Z. marina in Puget Sound showed that, at the ecosystem scale of a large coastal basin, eelgrass abundance remained stable despite both anthropogenic and environmental change over the last 40 years (Shelton et al., 2017). Against thermal stress, Z. marina is thought to be “protected” in this region because eelgrass currently exists well within its reported temperature tolerance (up to about 30°C) (Lee et al., 2007). Coastal upwelling likely contributes to this high productivity and apparent resilience (Kaldy and Lee, 2007; Hessing-Lewis and Hacker, 2013). However, declines have also been observed along the US west coast, including small bays of the San Juan Islands, Washington in 2003 (Wyllie-Echeverria et al., 2003), Morro Bay, California from 2007-2013 (Walter et al., 2018), and the upper reaches of Coos Bay, Oregon starting in 2016 (Magel, 2020). In addition, studies of Z. marina in the US Pacific Northwest have shown decreased growth at water temperatures above 15°C (Thom et al., 2001; Kaldy et al., 2017), which is lower than those considered stressful at other locations within the species’ worldwide distribution (Kaldy and Lee, 2007).
In this study, we combine data from eelgrass and macroalgae surveys in four US Pacific Northwest estuaries (from north to south: Willapa Bay, Netarts Bay, Yaquina Bay, and Coos Bay; Figure 1) spanning 400 km of coastline and 14 years that covered the periods before, during, and after the NE Pacific Ocean MHW. These estuaries experience differences in oceanographic conditions that influence macrophyte production (Hessing-Lewis and Hacker, 2013). Along the coast, upwelling strength and the duration of the upwelling season increases from north to south (Hickey and Banas, 2003). This spatial variation in upwelling, combined with coastal topography (Hickey and Banas, 2008) and watershed drivers (Howarth et al., 2011), creates a latitudinal gradient in estuarine water temperature and nutrient concentrations (Brown et al., 2007; Brown and Ozretich, 2009). Estuaries in central and southern Oregon, such as Yaquina Bay and Coos Bay, tend to be colder and have higher nutrient concentrations compared to estuaries in the north such as Netarts Bay and Willapa Bay, resulting in differences in macrophyte biomass and community structure (Thom et al., 2003; Hessing-Lewis and Hacker, 2013). Previous research by Hessing-Lewis and Hacker (2013) showed that southern estuaries (i.e., Coos Bay and Yaquina Bay) had high total macrophyte biomass dominated by ulvoid macroalgae, whereas northern estuaries (i.e., Netarts Bay and Willapa Bay) had lower macrophyte biomass that was dominated by native eelgrass. The dominance of ulvoid macroalgae in southern estuaries was associated with cold and nutrient-rich, ocean-derived water while eelgrass production was negatively correlated with these conditions (Hessing-Lewis and Hacker, 2013; Kaldy, 2014). With high epiphyte and ulvoid macroalgae biomass, competition for nutrients and light between primary producers could also limit eelgrass, although previous research in the US Pacific Northwest has found little evidence of competition between eelgrass and ulvoid macroalgae (Hessing-Lewis et al., 2011; Hessing-Lewis and Hacker, 2013; Hessing-Lewis et al., 2015). Instead, eelgrass and ulvoid macroalgae in US Pacific Northwest estuaries appear to be responding to different drivers.
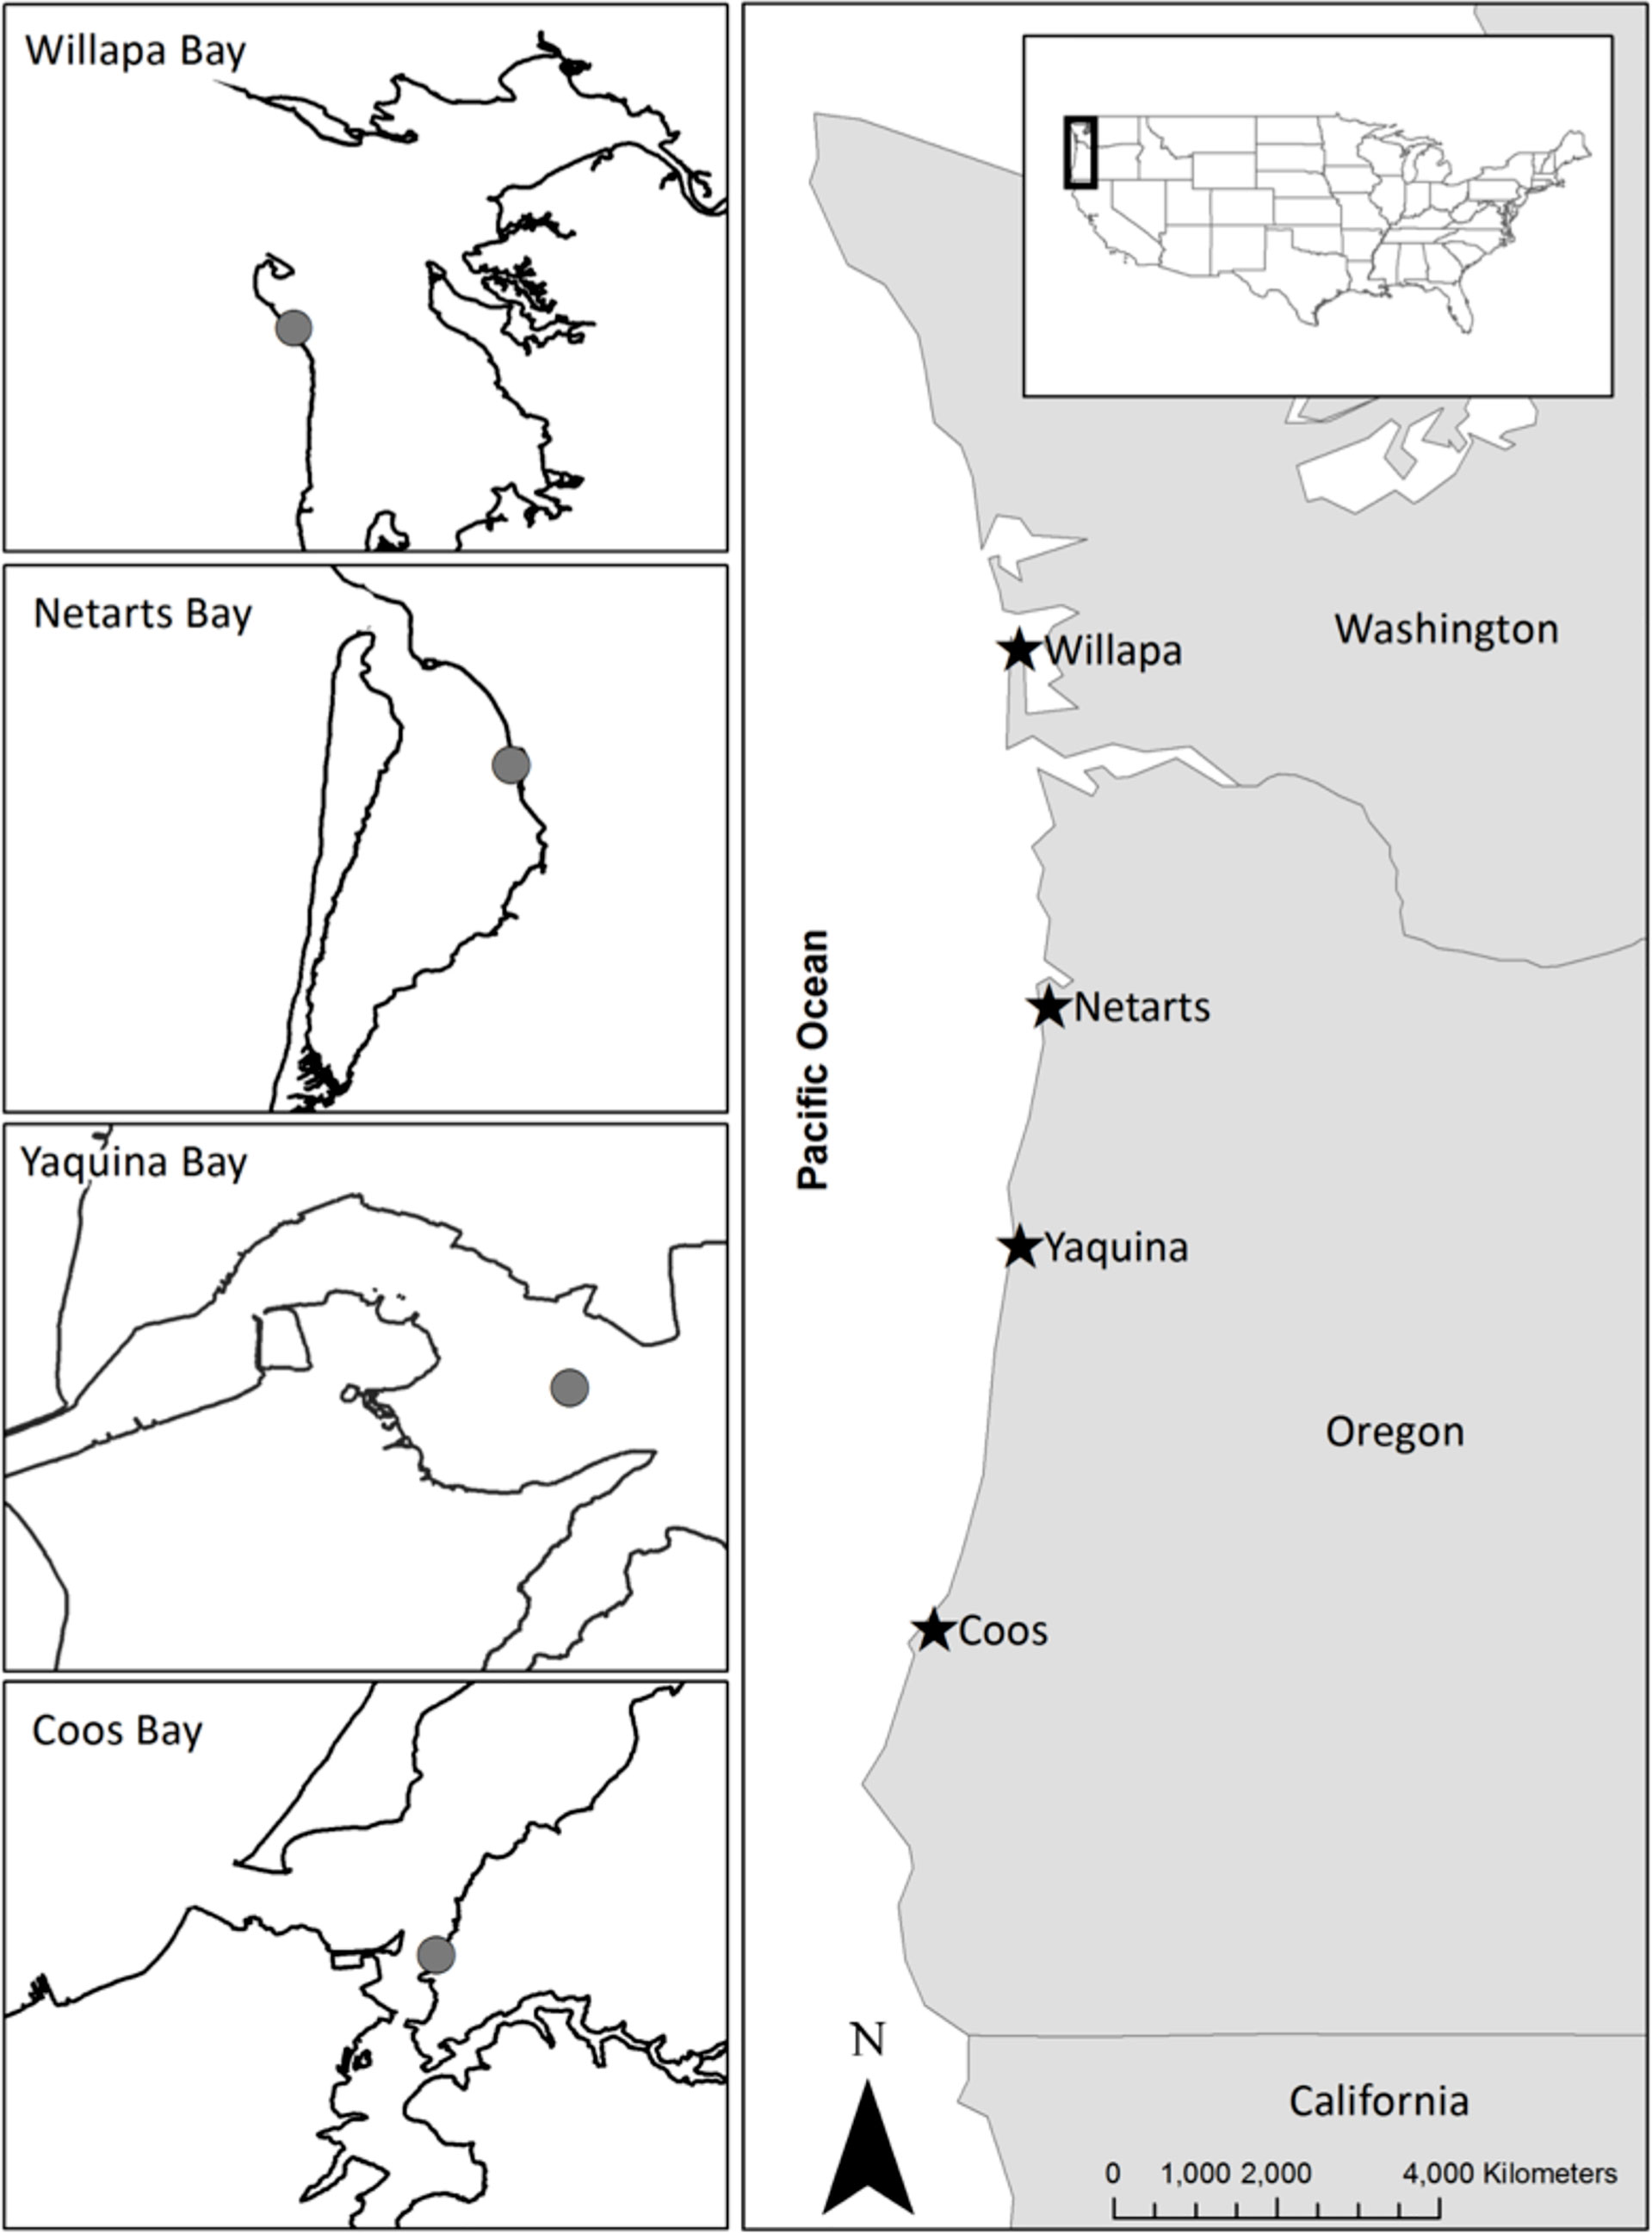
Figure 1 Map of the study sites in four estuaries of the US Pacific Northwest coast, including Willapa Bay, Washington and Netarts Bay, Yaquina Bay, and Coos Bay, Oregon. Gray circles on each inset map indicate the location of macrophyte sampling. Site locations and characteristics are given in Appendix A: Tables S1, S3.
Given the differences in the chemical, physical, and ecological structure of US Pacific Northwest estuaries, we asked three questions to explore the resilience of estuarine macrophytes to a strong MHW event: 1) Did spatiotemporal patterns in eelgrass and ulvoid macroalgae biomass change before, during, or after the 2013-2016 NE Pacific Ocean MHW? 2) If biomass did change, was recovery observed in the post MHW period and were responses coherent across estuaries and macrophyte taxa? Finally, 3) if there was variability in the response and recovery of macrophytes, was it influenced by differences in estuary-specific oceanographic and estuarine conditions, including the extent to which elevated temperatures associated with the MHW were observed in these estuaries?
Methods
Study Sites and Macrophyte Surveys
We considered the change in aboveground eelgrass (native Zostera marina) and ulvoid macroalgae (Ulva and Enteromorpha spp.) biomass and environmental characteristics, including water temperature, before (2006-2010), during (2015-2016), and after (2017-2019) the NE Pacific Ocean MHW in four estuaries (Willapa Bay, Washington, and Netarts Bay, Yaquina Bay, and Coos Bay, Oregon, US; Figure 1). These estuaries vary in oceanographic, estuarine, and watershed conditions (Appendix A: Tables S1 and S2). Willapa Bay and Netarts Bay are shallower with more intertidal area (relative to estuary size) compared to Yaquina Bay and Coos Bay (Lee and Brown, 2009). Yaquina Bay and Coos Bay have larger catchment sizes, greater population density, and higher freshwater nutrient loads compared to Willapa Bay and Netarts Bay (Appendix A: Table S1).
Within each estuary, we conducted annual surveys during peak macrophyte biomass at a single contiguous intertidal eelgrass bed from 2016–2019 (Figure 1). Past studies have found that the biomass of macrophytes in these estuaries is highest in July and August and does not vary much over the summer (Hessing-Lewis et al., 2011; Magel, 2020). Hayduk et al. (2019) performed multiple surveys at marine dominated beds and found similar biomass of eelgrass and ulvoid macroalgae among sites within each estuary, whereas differences among estuaries were significant. Therefore, we utilized individual sites to characterize annual variation within estuaries and differences among estuaries. The beds were located close (< 6 km) to the mouth of each estuary (Figure 1) and within ± 0.1 m of mean lower low water, where they experienced marine dominated conditions, including high salinities, high nutrients, and cold waters associated with ocean upwelling (Brown and Ozretich, 2009; Hessing-Lewis and Hacker, 2013). These surveys were combined with previous annual surveys conducted in 2006-2010 (Hessing-Lewis and Hacker, 2013) and 2015 (Hayduk et al., 2019) that used the same sampling methods at many of the same sites. Unpublished data for our Willapa site were obtained from M. Hessing-Lewis for 2007-2010, which differed from the site reported in Hessing-Lewis and Hacker (2013). Data were not collected in Willapa Bay in 2015 nor in Netarts Bay in 2007 and 2009.
The annual surveys consisted of haphazard placement of 15–20 0.5-meter x 0.5-meter (or 0.25 m2) quadrats within the eelgrass bed at each site during low tide. Percent cover of eelgrass and ulvoid macroalgae, number of eelgrass shoots, and the wet volume of ulvoid macroalgae were recorded. Field samples of at least 20 randomly collected eelgrass shoots and volumes of ulvoid macroalgae were collected, frozen, and returned to the lab for processing. In the lab, epiphytes were gently scraped from each eelgrass shoot using a microscope slide, and each shoot was dried (60°C for 48-72 hr) and weighed. Epiphyte samples were similarly dried and weighed for samples collected from 2016–2019 but not for the prior years. To estimate the annual aboveground biomass of eelgrass per 0.25 m2 at each site, we multiplied the mean eelgrass per shoot biomass by the average shoot density from the field surveys. Annual epiphyte load was calculated as the average epiphyte biomass per average eelgrass shoot biomass.
To determine macroalgae biomass per 0.25 m2, this study and Hessing-Lewis et al. (2011) established relationships to convert field measurements of either percent cover or wet volume (mL) to dry weight biomass (grams). For the Hessing-Lewis et al. (2011); Hessing-Lewis and Hacker (2013), and Hayduk et al. (2019) studies, the dry weight biomass was converted from macroalgae percent cover using the relationship: Macroalgae Dry Weight = Log (1.61 × Percent Cover – 3.83) (R2 = 0.85, p < 0.001, n = 199 field samples). For this study, dry weight biomass was converted from macroalgae wet volume using the relationship: Macroalgae Dry Weight = –0.67 × Wet Volume + 29.04 (R2 = 0.90, p < 0.001, n = 97 field samples).
Water Temperature Climatologies and Estuarine Heatwaves
Estuarine water temperature (°C) records were obtained from monitoring locations nearest to macrophyte survey sites in each estuary (see Appendix A: Table S3 for data sources). Data were combined from two sources in each estuary: the Northwest Association of Networked Ocean Observing Systems (NANOOS) and another local source (see Appendix A: Table S3 for additional sources). These additional datasets helped to fill in gaps in the NANOOS time series to create a more complete temperature record in each estuary, particularly during the focal years of our study (2006-2019). Overlapping daily average water temperature records from NANOOS were regressed with the local dataset for each estuary to ensure close agreement (see Appendix B for additional detail on the water temperature dataset comparisons). In addition, sea surface temperature records from 1979-2019 were obtained from an offshore mooring buoy located near Cape Blanco, Oregon (Appendix A: Table S3).
From the compiled datasets, daily average water temperature was calculated for each estuary and the coastal ocean. Water temperature climatologies and categorization of heatwaves for each estuary and the coastal ocean were determined using the R package ‘heatwaveR’ (Schlegel and Smit, 2018). This program determines MHWs based on the Hobday et al. (2016) definition and categories established by Hobday et al. (2018). Briefly, Hobday et al. (2016) consider a warm water occurrence to be a MHW if the event lasts for 5+ days, with temperatures above the 90th percentile based on a historical baseline. Graphs of the long-term climatology overlaid with MHW events were produced for each estuary and the coastal ocean. A cumulative intensity metric (°C above average x number of days elevated) was also used to capture the severity and the duration of heatwave events that occurred during the specified time period of the study [see the ‘heatwaveR’ documentation (Schlegel and Smit, 2018) for additional information on this metric]. For each estuary, cumulative intensity of all heatwaves was summed from November 2013 through January 2016, the duration of the NE Pacific MHW (Schmeisser et al., 2019), in order to compare the relative severity of heatwaves experienced by the four estuaries.
Environmental Factors Dataset
We compiled a dataset of average ocean upwelling, surface current strengths, and estuarine water temperature and salinity during June and July for each year (2006-2010 and 2015-2019) and estuary (see sources and data in Appendix A: Tables S3 and S2, respectively). Mean Ekman transport (referred to here as upwelling index, m3 s-1 100 m-1 of coastline) was calculated from sea level pressure maps and were averaged for a 0.5 degree latitude radius around the geographic coordinates of the mouth of each estuary following the method of Gouhier et al. (2010). Mean offshore (cm s-1 west) and alongshore (cm s-1 south) currents were obtained from Oregon State University’s CODAR dataset and were averaged for a 0.6 degree latitude/longitude radius around the geographic coordinates of the mouth of each estuary. Current data were filtered for values with at least 50% coverage. Ekman transport (upwelling index) and current strengths measure different aspects of upwelling along the coast. Records of salinity were also compiled from monitoring locations nearest to macrophyte survey sites in each estuary (Appendix A: Table S3). Watershed size, normalized by estuary area [catchment area (km2) per estuary area (km2)], was obtained for each estuary from Hessing-Lewis and Hacker (2013) (Appendix A: Table S1). Average tidal exchange volume (m3 d-1) and freshwater inflow normalized to estuary volume (year-1) were obtained for each estuary from Lee and Brown (2009) (Appendix A: Table S1). Tidal exchange volume and freshwater inflow measurements were not available over time, thus we used non-temporal, fixed values in our dataset.
Data and Statistical Analyses
All statistical analyses were performed using R (v. 4.0.2, R Development Core Team 2020). Generalized least squares regressions, including first-order autoregressive terms to account for the potential autocorrelation in time series data, were used to determine whether eelgrass and macroalgae biomass (g dry weight per 0.25 m2) changed over time at each site (2006-2019). Additionally, we used analysis of variance [‘Anova’ function of the ‘car’ R package (Fox and Weisberg, 2019)] and Tukey HSD comparisons of means [‘lsmeans’ R package (Lenth, 2016)] to test whether there were differences among sites, MHW time periods [before (2006-2010), during (2015-2016), and after (2017-2019) the NE Pacific Ocean MHW], or an interaction between site and time period for eelgrass metrics (shoot density per 0.25 m2, per shoot biomass, and eelgrass biomass) and macroalgae biomass. Eelgrass and macroalgae biomass values were log-transformed prior to analysis to improve normality.
We used partial least squares regression [PLSR; Carrascal et al. (2009)] analysis to assess the relationship between macrophyte biomass in the four estuaries with respect to the watershed, estuary, and ocean condition factors described above (Appendix A: Tables S1, S2). We conducted separate analyses for three time periods: all years (2006-2019), before the MHW (2006-2010), and during and after MHW (2015-2019). Given data limitations and lack of statistical power, we were unable to perform separate PLSR analyses using data from before, during, and after the MHW. PLSR is well suited to deal with multicollinearity in explanatory and response variables, which was evident in our data and is common in ecological datasets (Mevik and Wehrens, 2007). Using the PLSR technique, we defined blocks of response and explanatory variables. The response block (Y block) contained eelgrass biomass (log transformed), macroalgae biomass (log transformed), and epiphyte load. Each observation of eelgrass and macroalgae biomass and epiphyte load were paired with corresponding environmental factors for that estuary and/or year. The block of explanatory variables (X block) included 8 environmental parameters for each estuary [Appendix A: Tables S1, S2; i.e., mean estuary water temperature, salinity, upwelling index, offshore ocean current, and alongshore ocean current in June for each year; summed estuary heatwave cumulative intensity (°C x days; Schlegel and Smit [2018]) for the months preceding our sampling (January and July) for each year; tidal exchange volume (m3 d-1) and volume normalized freshwater inflow (year-1)]. If explanatory variable observations were missing for one year, we imputed the estuary-specific averages because PLSR analysis necessitates complete observations. Using the compiled data, the response variables (Y block) were modelled through the analysis of linear combinations among predictor variables (X block).
We then used squared weight (weight2), cross-correlation, and variable importance for projection (VIP) metrics to describe the importance of individual environmental factors as predictors of eelgrass and macroalgae biomass and epiphyte load. Explanatory variables with VIP greater than 1 are most relevant for explaining the variation observed in the block of response variables. The Stone-Geisser’s cross-validation metric (Q2) was used to determine significance of the PLSR axes. Axes are significant if Q2 is greater than or equal to 0.0975 (Carrascal et al., 2009). Radar plots with two axes for all years (2006-2019), before the MHW (2006-2010), and during and after the MHW (2015-2019) were used to explore the correlations between explanatory and response variables depending on time period. The R package ‘plsdepot’ (Sanchez, 2012) was used to develop and visualize the PLSR outputs.
Results
NE Pacific Ocean MHW and Estuarine Heatwaves
During the period of the NE Pacific Ocean MHW, there was evidence of corresponding heatwaves (water temperatures that exceed the local climatological threshold) in all four estuaries and the coastal ocean (Figure 2 and Table 1). At the coastal ocean buoy near Cape Blanco, Oregon, the MHW event was first detected in late winter or early spring 2014 and then was amplified in summer 2014 through fall 2015 (Figure 2A). Beginning around the same time, estuarine heatwave events were also detected and tended to be strongest during the fall and winter and dissipate during spring and summer (Figures 2B–E). In estuaries, the heatwaves amplified starting in fall 2014 and remained elevated through spring 2015 (Figures 2B–E). Smaller heatwave events were present in the summer and fall 2015 and well into winter 2016. Yaquina Bay experienced a particularly strong heatwave in winter and spring 2016, however the duration and magnitude of this event was not observed in the other estuaries (Figure 2D).
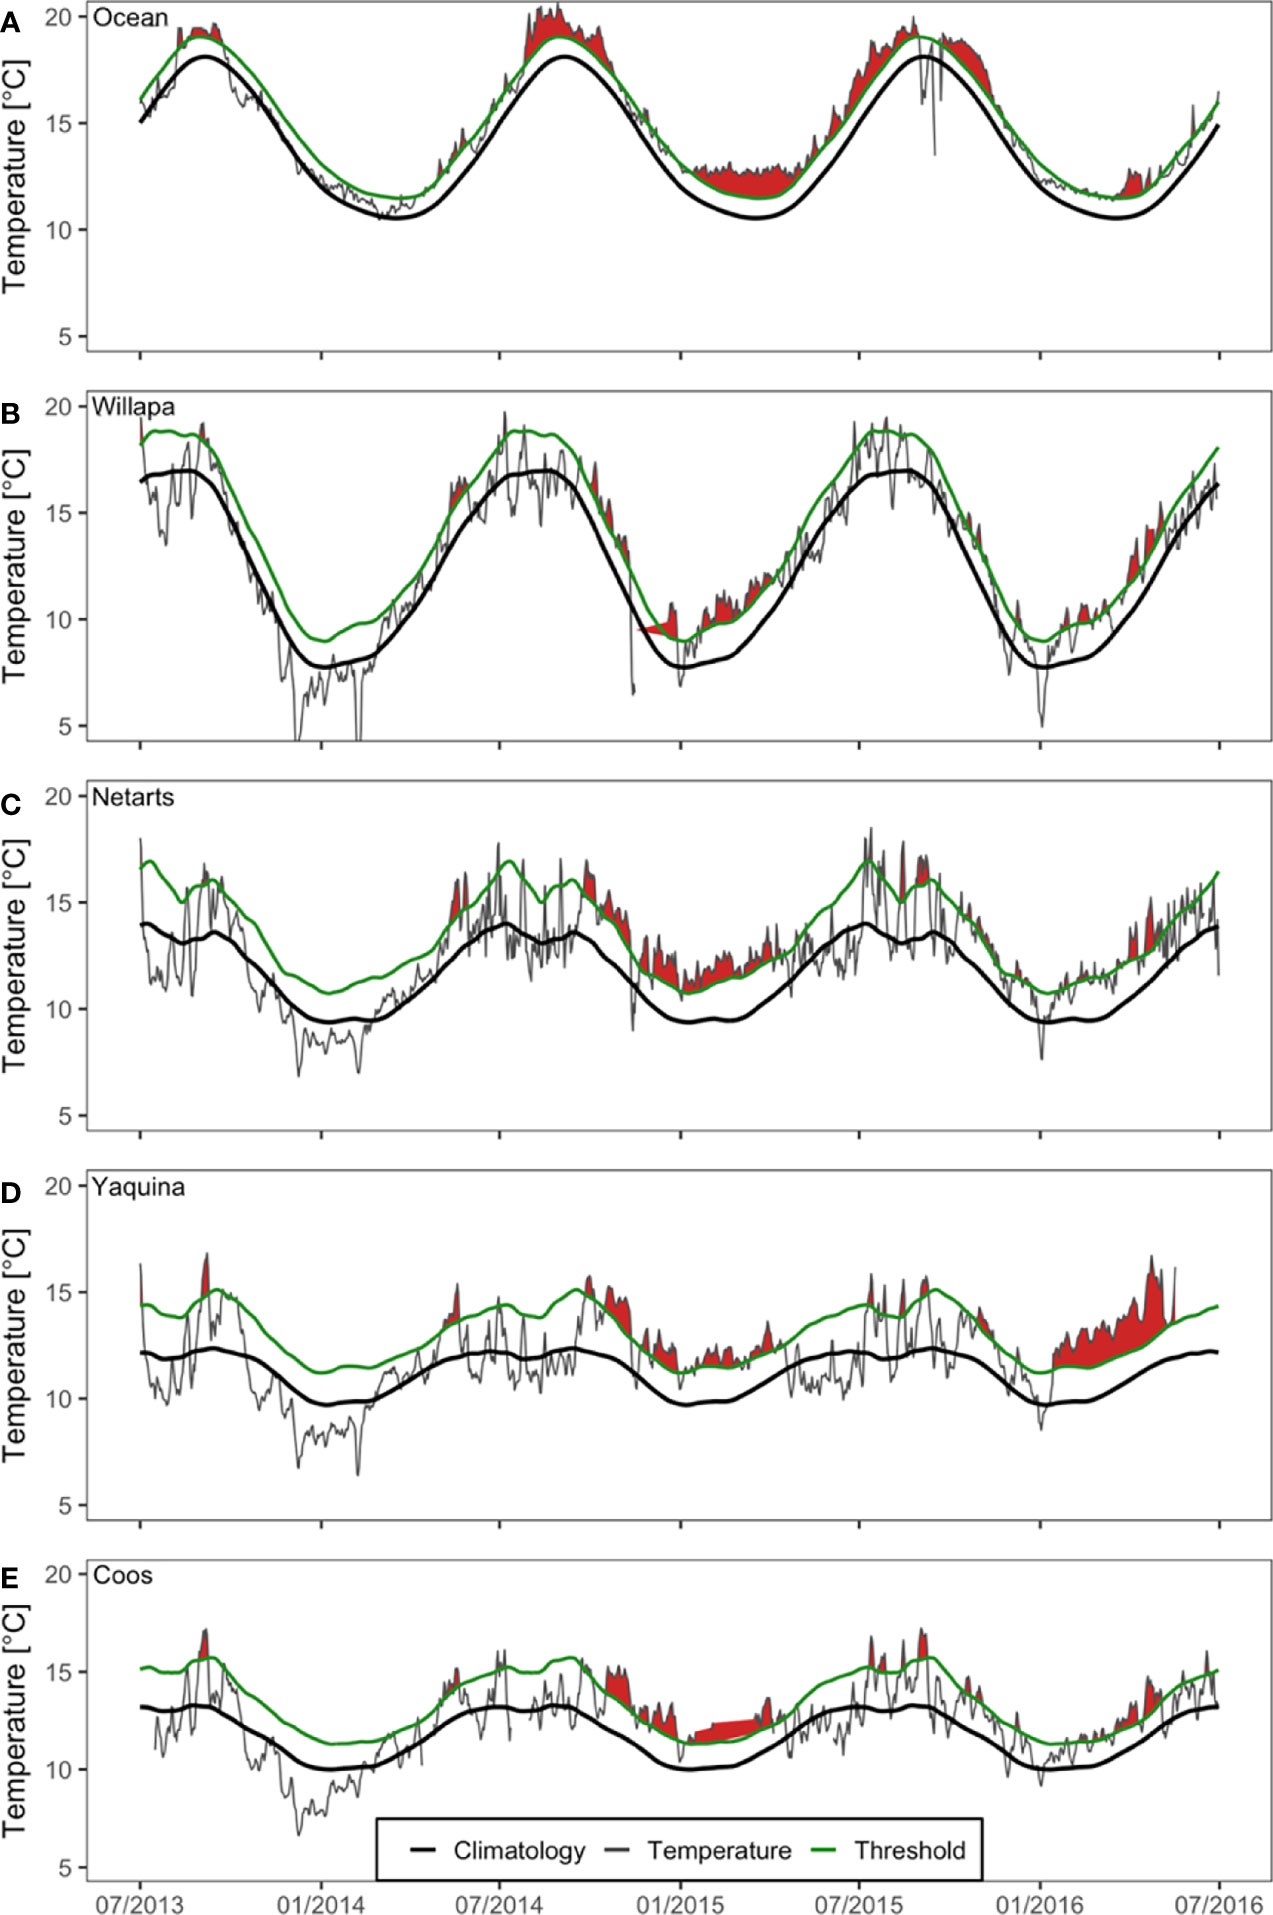
Figure 2 Water temperature (gray) and detected heatwave events (red fill) at monitoring stations in the northeast Pacific Ocean (A) and four US Pacific Northwest estuaries (Figure 1): Willapa Bay (B), Netarts Bay (C), Yaquina Bay (D), and Coos Bay (E) during July 2013 – July 2016. Seasonal climatologies (black) and heatwave thresholds (green) are based on the available historical data from each estuary. Graphs were produced using definitions and functions contained in the ‘heatwaveR’ R package (Schlegel and Smit, 2018). Occasional data gaps exist during this time period, indicated by the absence of the gray line, and heatwave condition is interpolated across missing data.
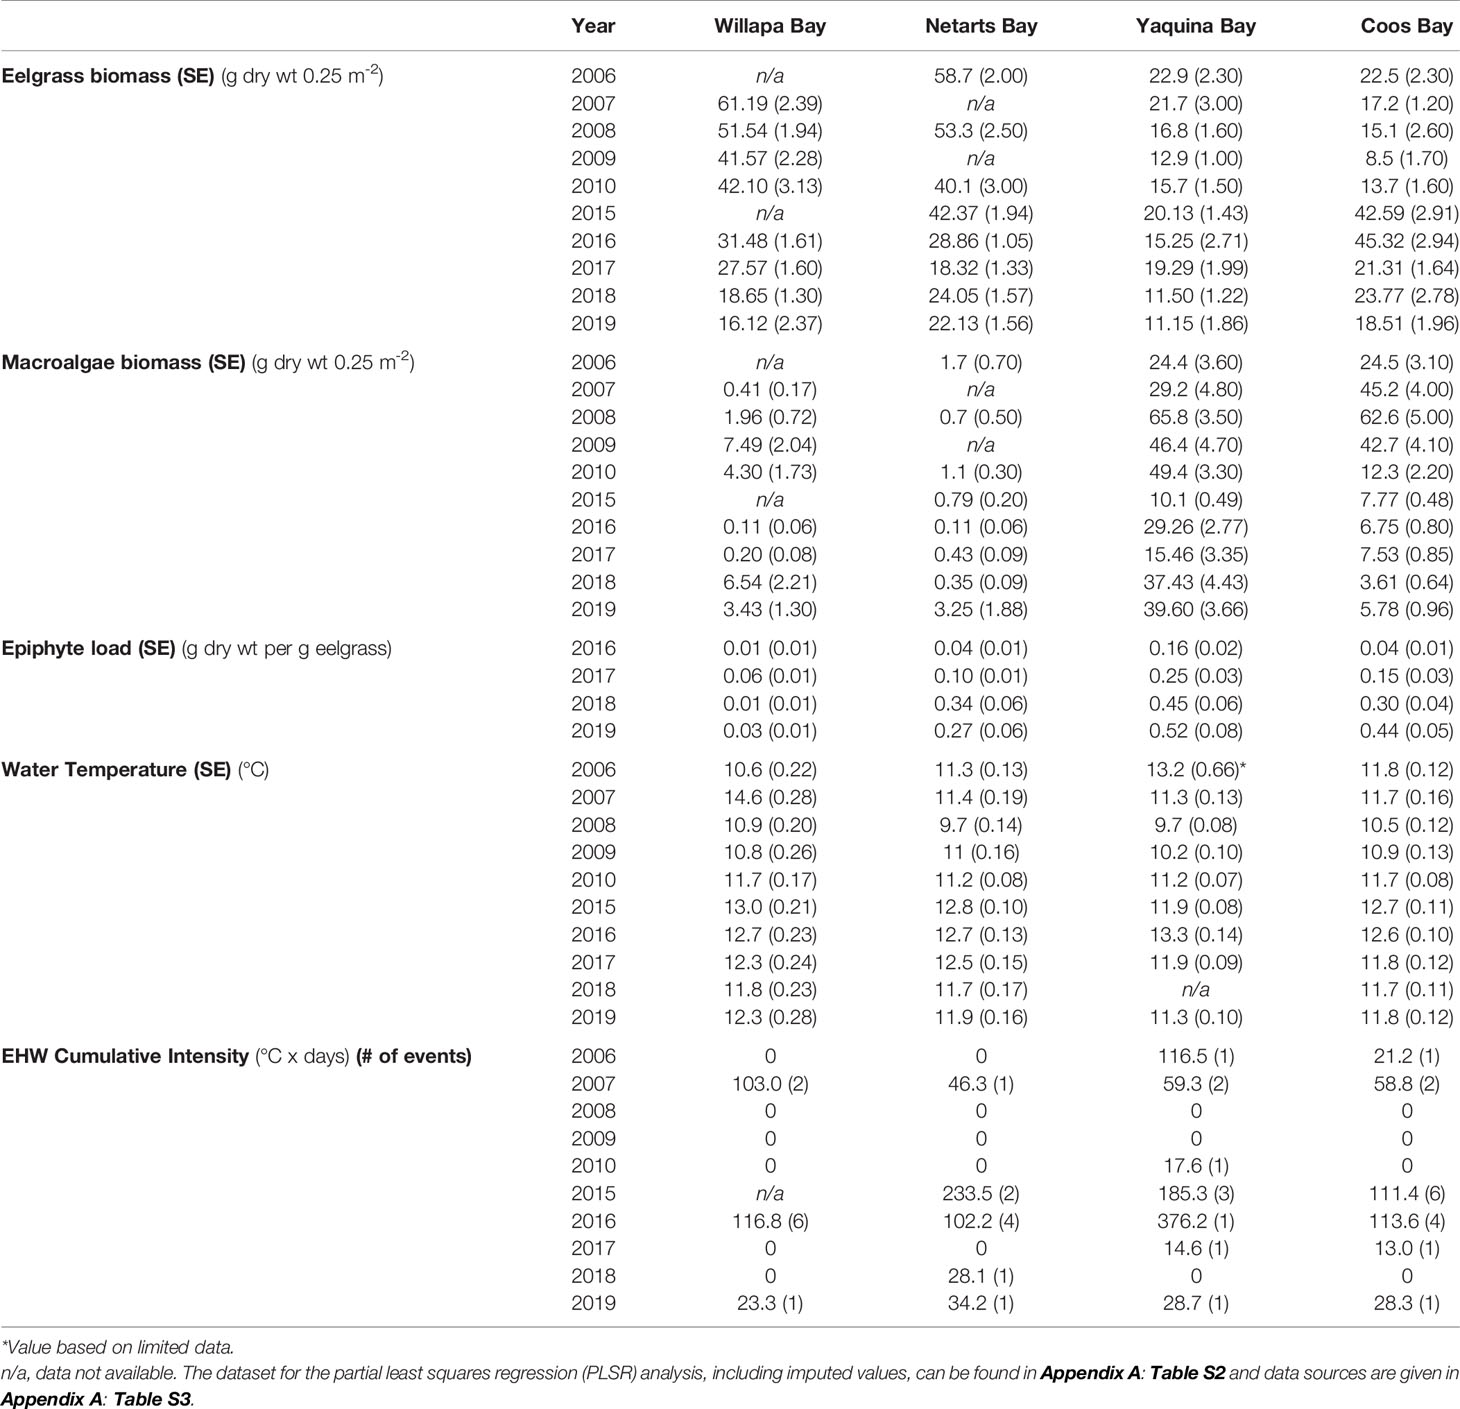
Table 1 Interannual average (standard error) summer (July or August) macrophyte (eelgrass, macroalgae, and epiphyte) biomass, estuary water temperature (January–July), and the estuarine heat wave (EHW) cumulative intensity from January to July (number of heat wave events lasting at least five days, when present) for Willapa Bay, WA, Netarts Bay, OR, Yaquina Bay, OR, and Coos Bay, OR from 2006-2010 and 2015-2019.
On average, Willapa Bay and Netarts Bay daily water temperatures were frequently above 15°C during summer 2014 and summer 2015 (Figures 2B, C), whereas summer water temperatures in Yaquina Bay and Coos Bay were comparatively lower (at or below 15°C) (Figures 2D, E). Willapa Bay (6-16°C) and Netarts Bay (8-14°C) water temperature climatologies showed greater seasonal variation, compared to Yaquina Bay (9-12°C) and Coos Bay (10-13°C) (Figures 2B–E).
Although the occurrence of estuarine heatwaves was variable between estuaries and years, the time period corresponding to the NE Pacific Ocean MHW event coincided with greater regularity of estuarine warming (Figure 2, Table 1 and Appendix A: Figure S1). Total cumulative intensity (°C x days) of estuarine heatwaves between November 2013 and January 2016 was highest in Netarts Bay (625.2), followed by Yaquina Bay (493.8) and Coos Bay (391.3), and lowest in Willapa Bay (369.9). However, missing water temperature data in Willapa Bay (late 2014) and Coos Bay (early 2015) precluded a complete understanding of the differences in the severity and duration of estuarine heatwaves (Figure 2).
Spatial and Temporal Patterns of Macrophytes
Regression analysis revealed that eelgrass at marine dominated sites in Willapa Bay and Netarts Bay declined across years (Willapa: slope = -3.7, p = 0.014; Netarts: slope = -2.8, p = 0.002), whereas no change was observed in Yaquina Bay or Coos Bay (Figure 3). Eelgrass biomass differed among estuaries (two-way ANOVA, F = 151.3, df = 3, p < 0.001), MHW time periods (i.e., before, during, after) (F = 58.8, df = 2, p < 0.001), and there was an estuary by time period interaction (F = 37.2, df = 6, p < 0.001) (Figure 4A and Appendix A: Table S4). Tukey post-hoc tests for each estuary revealed that, in Willapa Bay and Netarts Bay, eelgrass biomass declined during the MHW and continued to decline afterward (Before > During > After), whereas in Yaquina Bay there were no differences through time (Before = During = After). In Coos Bay, eelgrass biomass was highest during the MHW and lowest preceding the MHW (During > After > Before).
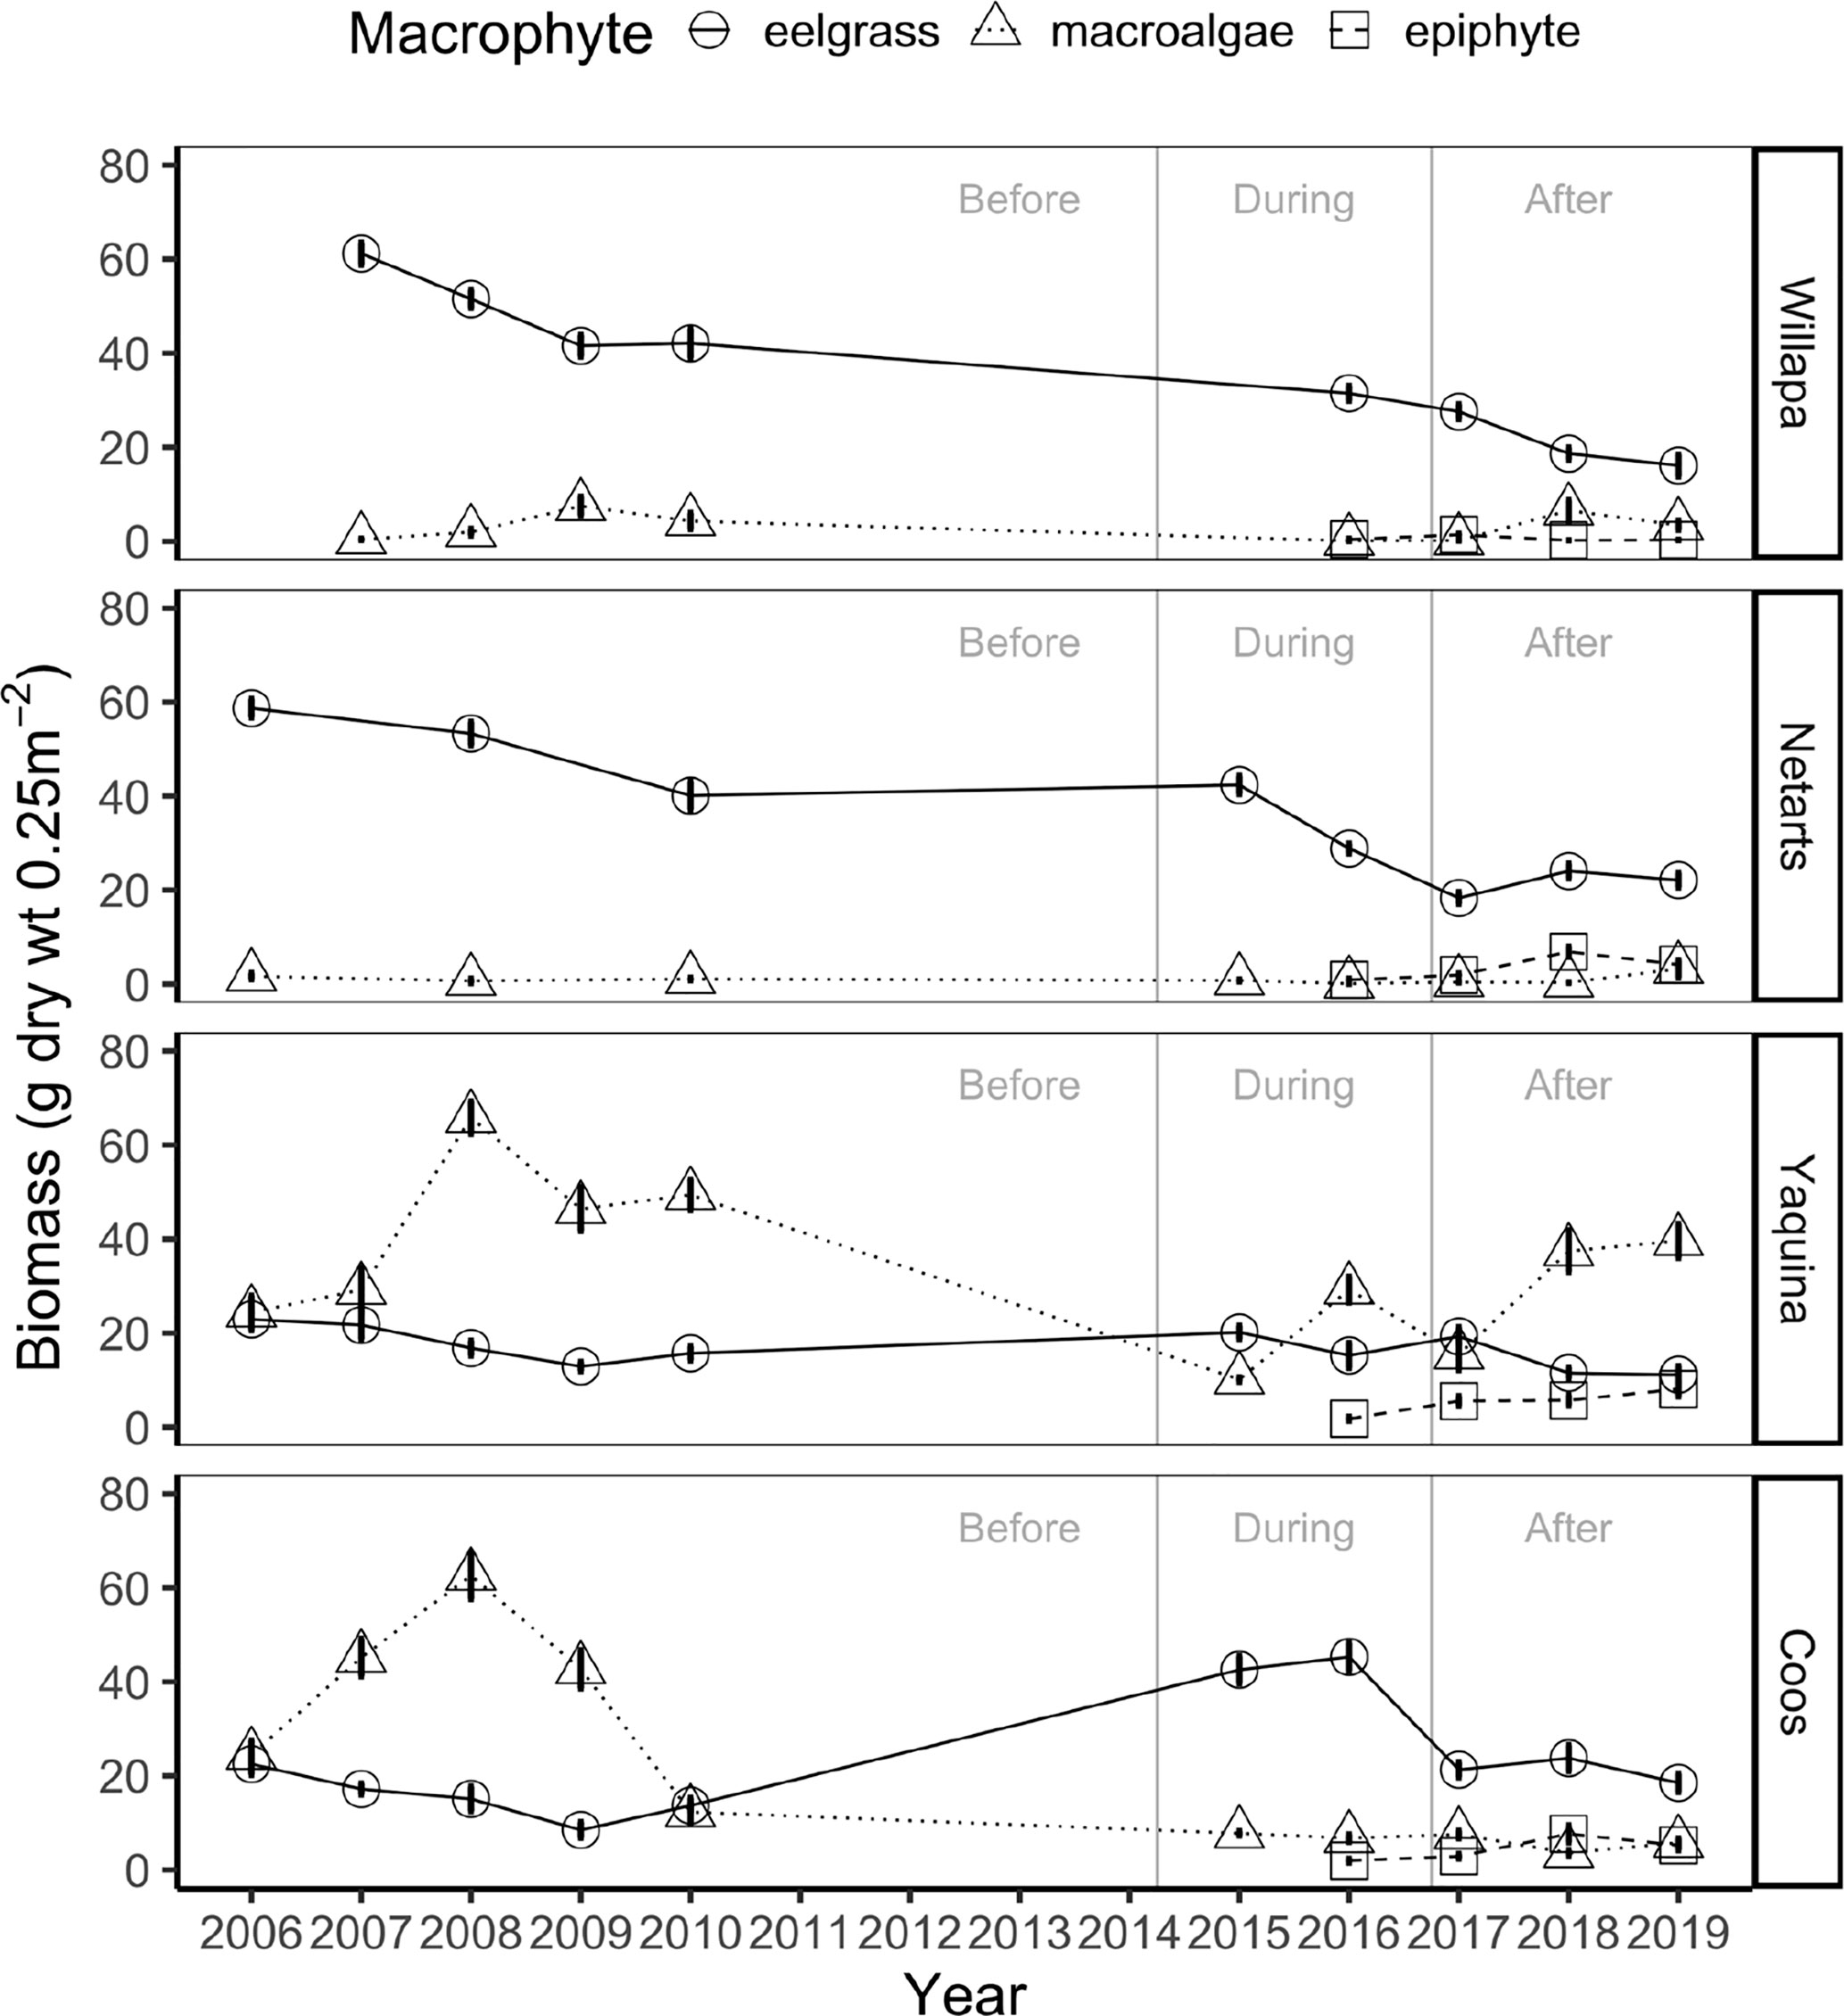
Figure 3 Mean interannual biomass ± standard error (g dry wt 0.25 m-2) of eelgrass (circles, solid lines), ulvoid macroalgae (triangles, dotted lines), and epiphytes (squares, dashed lines) at marine dominated sites in four US Pacific Northwest estuaries (Figure 1) between 2006-2019 over three time periods: before, during, and after the NE Pacific Ocean marine heatwave.
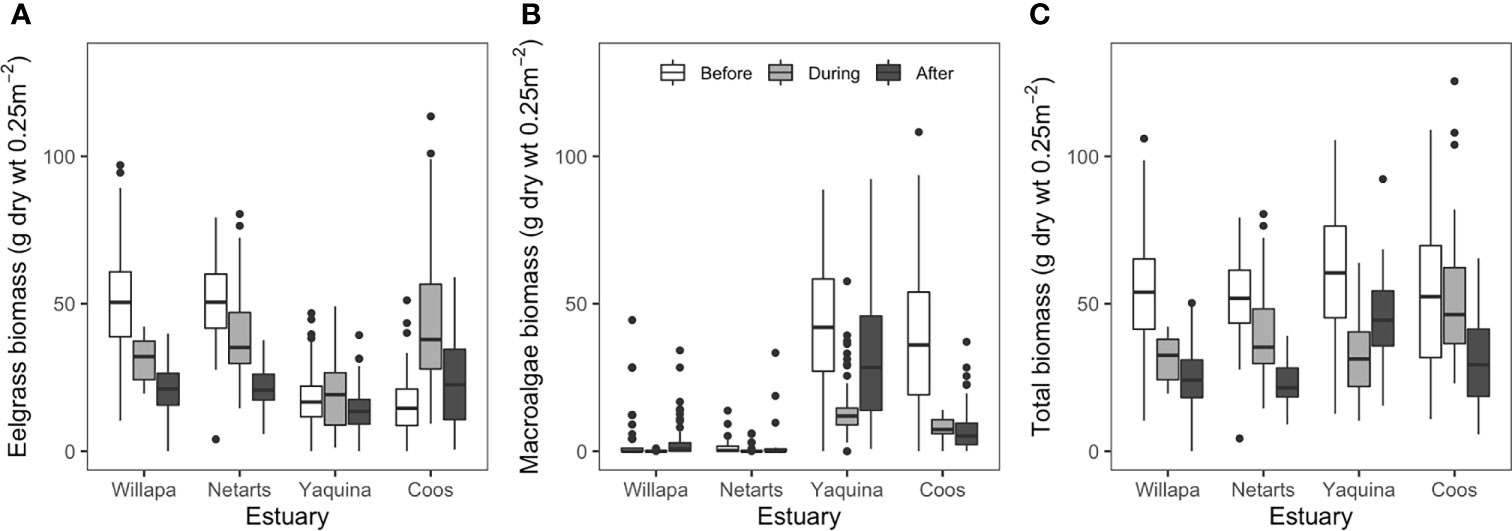
Figure 4 Comparison of eelgrass biomass (A), ulvoid macroalgae biomass (B), and total macrophyte (eelgrass plus macroalgae) biomass (C) at marine dominated sites in four US Pacific Northwest estuaries (Figure 1) before (2006-2010, white fill), during (2015-2016, light gray fill), and after (2017-2019, dark gray fill) the NE Pacific Ocean marine heatwave (2013-2016). Boxes (with median centerline) encompass the interquartile range (25th-75th percentile) of the data for each estuary and period. Whiskers extend to the most extreme data point that is no more than 1.5 times the length of the box and values falling beyond that range are shown as points. For clarity, ANOVA comparisons are not shown but are discussed in text.
Eelgrass shoot density and per shoot biomass also differed among the marine dominated site in each estuary (density: F = 69.0, df = 3, p < 0.001; shoot biomass: F = 54.7, df = 3, p < 0.001), MHW time periods (F = 12.6, df = 2, p < 0.001; F = 24.2, df = 2, p < 0.001), and there was an estuary by time period interaction (F = 26.6, df = 6, p < 0.001; F = 14.0, df = 6, p < 0.001) (Appendix A: Figure S2 and Table S4). Tukey post-hoc tests revealed that eelgrass density continued to decline after the MHW in Willapa Bay (Before = During > After) and Netarts Bay (Before > During > After), returned to its original density after the MHW (Before = After > During) in Yaquina Bay, but increased in density during and after the MHW (After > Before > During) in Coos Bay. Eelgrass shoot biomass showed similar patterns with declines after the MHW in Willapa Bay (Before = During > After) and Netarts Bay (Before = During > After), little change in Yaquina Bay (During > After, but neither differ from Before), and a temporary increase in Coos Bay during the MHW (During > Before = After).
Regression analysis showed no change in macroalgae biomass between 2006-2019 across estuaries at the marine dominated sites (Figure 3). Macroalgae biomass differed among estuaries (two-way ANOVA, F = 404.4, df = 3, p < 0.001), MHW time periods (F = 6.3, df = 2, p < 0.01), and there was an estuary by time period interaction (F = 22.7, df = 6, p < 0.001) (Figure 4B and Appendix A: Table S4). Tukey post-hoc tests for each estuary showed that macroalgae biomass declined during the MHW in Willapa Bay (Before = After > During) and Netarts Bay (Before > During, but neither differ from After). In both Yaquina Bay and Coos Bay, macroalgae biomass declined during the MHW but there was some recovery in Yaquina Bay (Before > After > During) but not in Coos Bay (Before > During = After).
Finally, total macrophyte biomass (eelgrass + macroalgae) differed among marine dominated sites in these estuaries (F = 2.6, df = 3, p = 0.05), MHW time periods (F = 91.7, df = 2, p < 0.001), and there was an estuary by time period interaction (F = 18.3, df = 6, p < 0.001) (Figure 4C and Appendix A: Table S4). Tukey post-hoc tests showed that total biomass in Willapa Bay and Netarts Bay decreased across the time periods (Before > During > After). For Yaquina Bay, total biomass was lowest during the MHW and highest before (Before > After > During) whereas in Coos Bay, total biomass was lowest after the MHW (Before = During > After).
Epiphyte load from 2016–2019 differed among estuaries at our sites (one-way ANOVA, F = 5.29, df = 3, p < 0.05), with the highest loads in Yaquina Bay compared to Willapa Bay (Tukey-adjusted comparison: t-ratio = -3.2, df = 12, p < 0.05) (Figure 3 and Appendix A: Figure S3). Netarts Bay and Coos Bay both had moderate epiphyte loads.
Estuarine Heatwaves and Other Environmental Effects on Macrophyte Biomass
The relationships between the eelgrass and macroalgae biomass, epiphyte load, and environmental drivers from 2006-2019 are shown in a radar plot (Figure 5). Overall, the PLSR analysis showed that 56.7% of the observed variability in macrophyte biomass was explained by the two PLSR axes. In addition, 75.8% of the variability in the block of environmental drivers, consisting of 8 metrics of watershed, estuary, and ocean conditions, was explained by the two PLSR axes. In terms of each axis separately, Axis 1 was significant (Q2axis 1 = 0.37), explained the majority of the observed variability in the macrophyte biomass block (52%), and was positively correlated with the vector for eelgrass biomass (“eelgrass”) and negatively correlated with vectors for macroalgae biomass (“macroalgae”) and epiphyte load (“epiphytes”) (Figure 5). Axis 2 was also significant (Q2axis 2 = 0.13) but explained only 14% of the variation in the macrophyte biomass block.
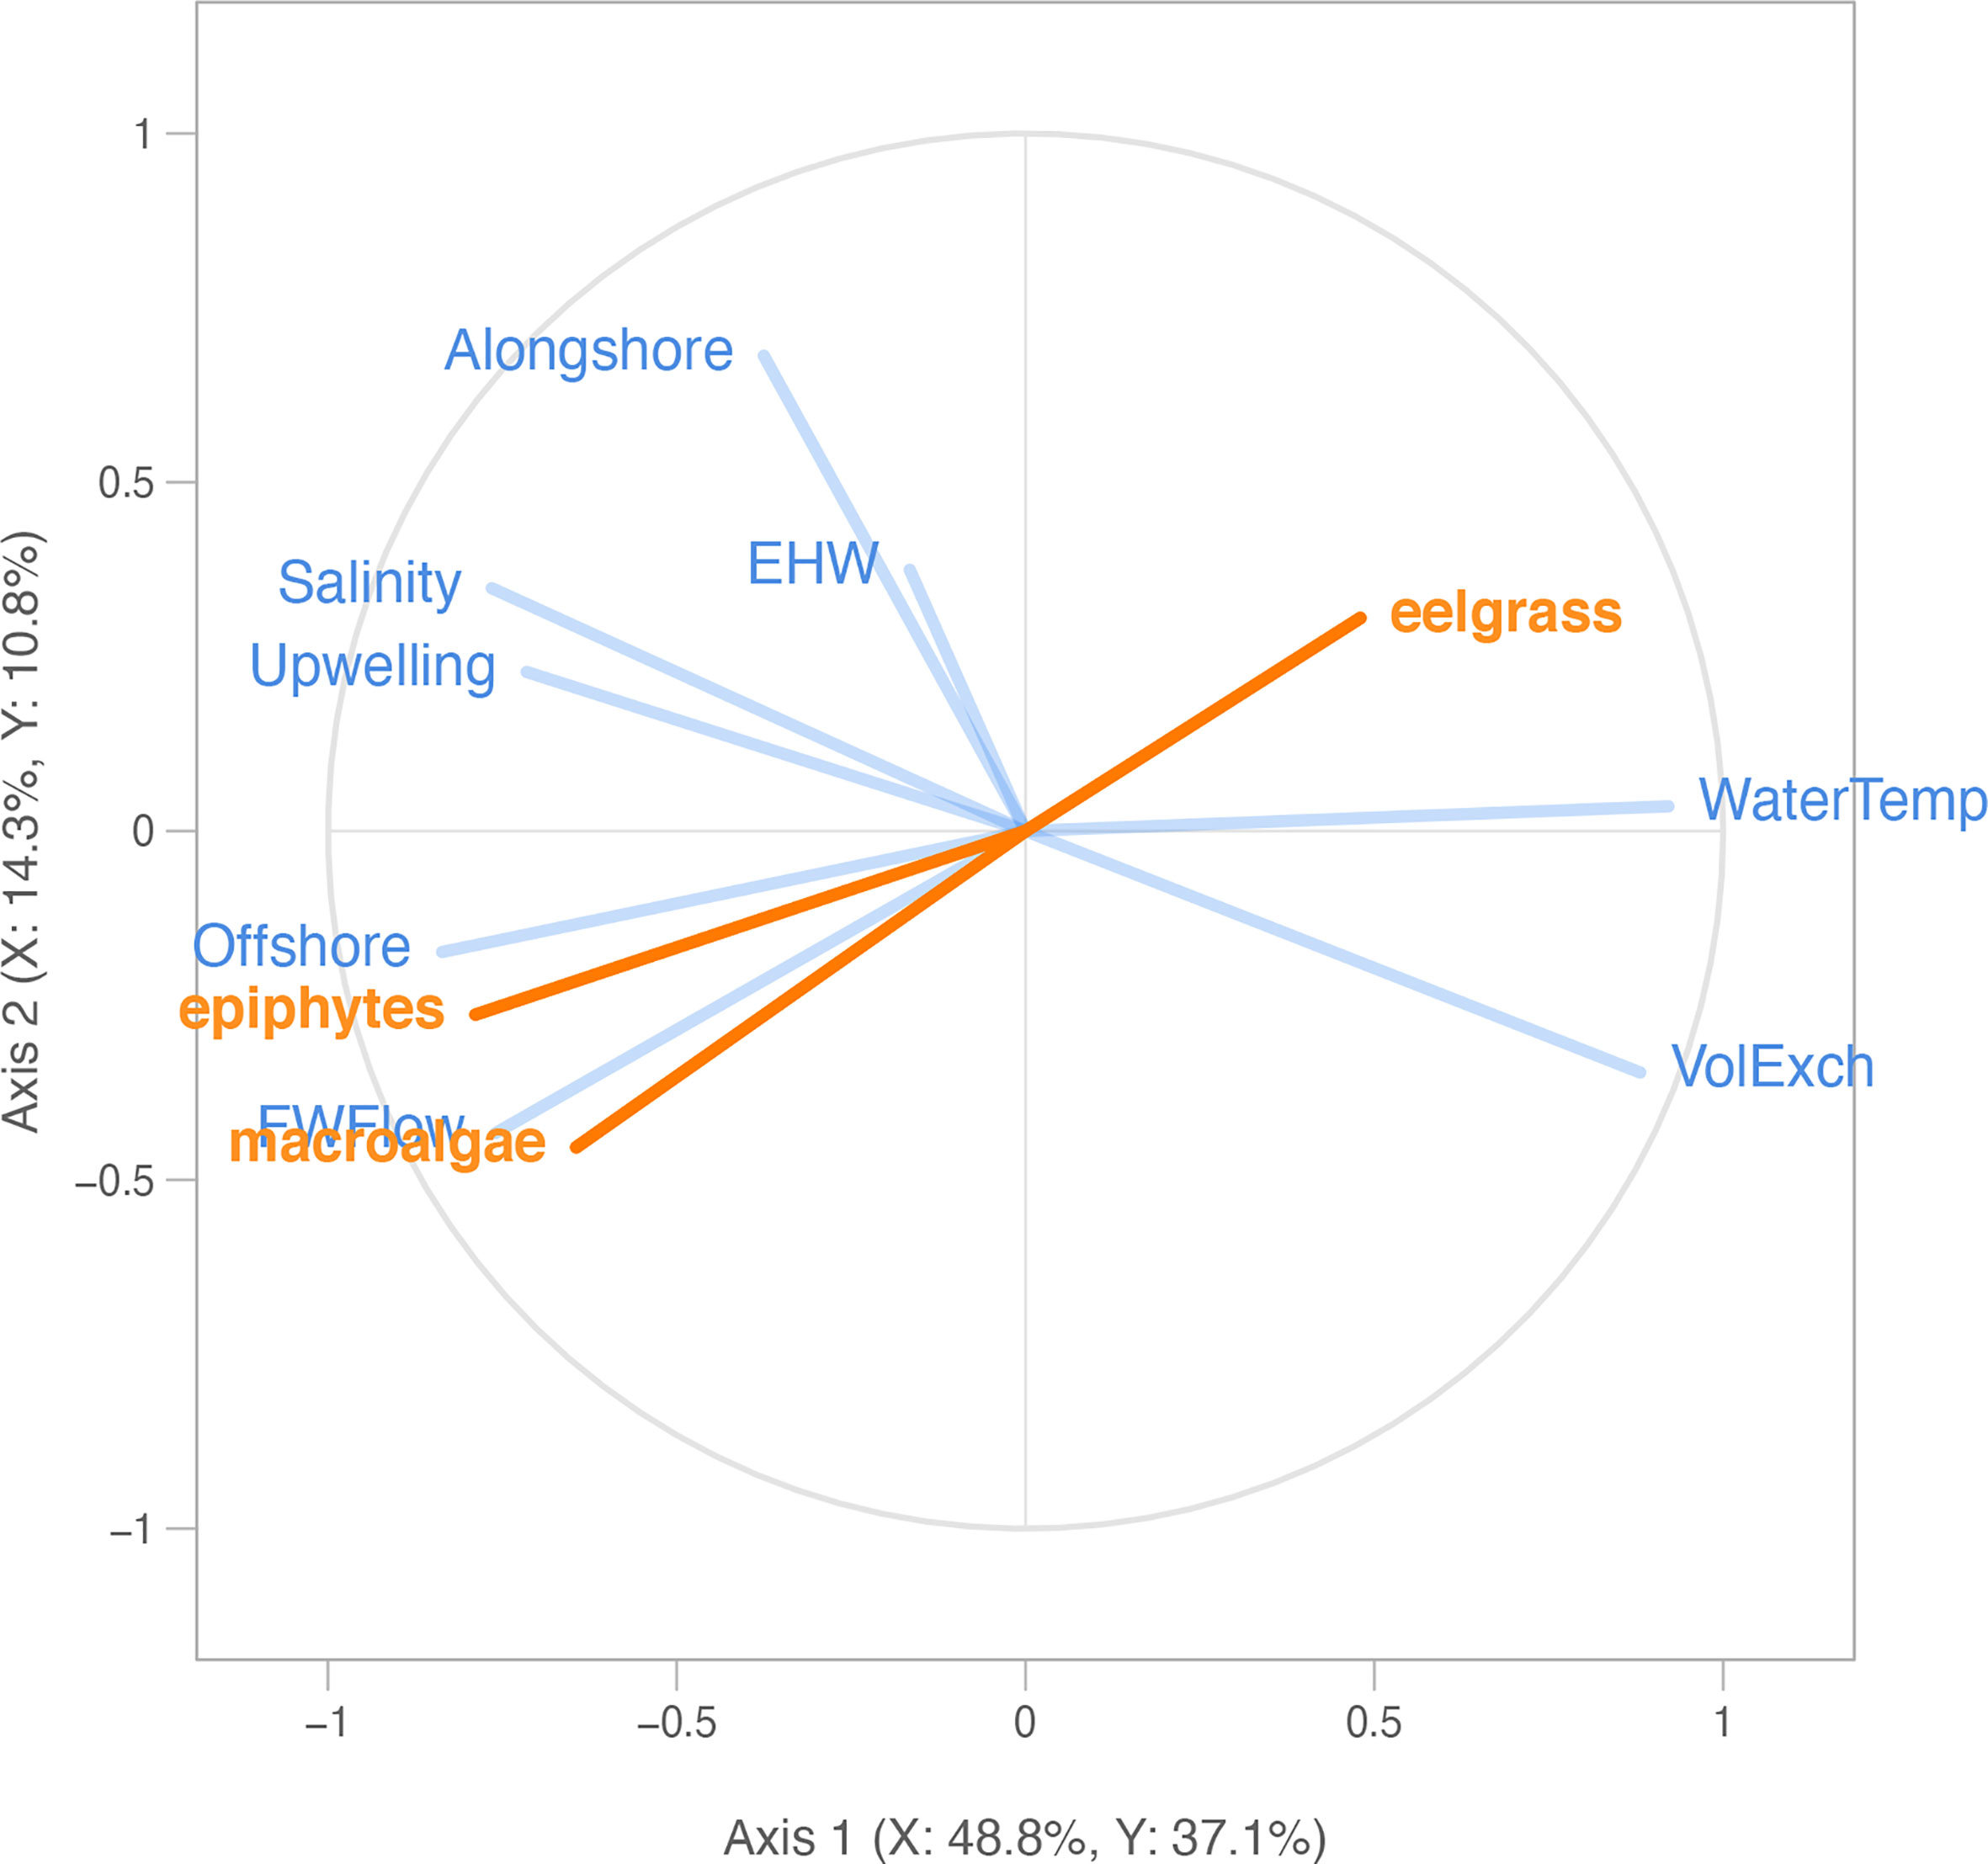
Figure 5 Partial least squares correlation radar plot of 8 explanatory environmental variables (blue; see Appendix A: Tables S1, S2 for abbreviations) and response macrophyte variables (orange; Figures 2, 3), including eelgrass biomass (“eelgrass”), ulvoid macroalgae biomass (“macroalgae”), and epiphyte load (“epiphytes”), across all years (2006-2019) and four US Pacific Northwest estuaries (Figure 1). Eelgrass and macroalgae biomass were log-transformed for the analysis, epiphyte load was not transformed. Each segment represents a model variable. Longer segments (closer to the circle perimeter) indicate that the variable is better represented. Segments close together are highly and positively correlated variables. Segments in opposite directions are negatively correlated. Orthogonal segments indicate no correlation.
For each taxon separately, we found that, of the proportion of variability in eelgrass biomass that was statistically explained in the PLSR, 48% was positively correlated with the block of environmental drivers, according to the PLSR cross-correlation value (Table 2). In particular, summer eelgrass biomass was positively related to water temperature (“Temp”) and tidal exchange volume (“VolExch”) across years, indicated by vectors that are aligned with one another in the PLSR plot (Figure 5). For the proportion of variability in macroalgae biomass that was statistically explained in the PLSR, 64% was negatively correlated with the block of environmental drivers (Table 2). Annual summer macroalgae biomass was positively related to freshwater flow (“FWFlow”) and offshore current strength (“Offshore”) indicated by vectors that are aligned with one another in the PLSR plot (Figure 5). In addition, macroalgae was negatively correlated with water temperature (“Temp”) indicated by vectors that are opposite one another. Macroalgae biomass was negatively correlated with eelgrass biomass, but positively related to epiphyte load. Finally, similar to macroalgae, 79% of the statistically explained variability in epiphyte load was negatively correlated with the block of environmental drivers according to the cross-correlation value (Table 2). Epiphyte load was also positively related to offshore current (“Offshore”) and freshwater flow (“FWFlow”), somewhat positively related to salinity (“Salinity”) and upwelling index (“Upwelling), and negatively related to water temperature (“Temp”) (Figure 5). Alongshore current strength (“Alongshore”) and estuarine heatwave cumulative intensity (“EWH”) were generally unrelated to the response variables, indicated by the orthogonal vectors.

Table 2 Summary of the partial least squares regression (PLSR) analysis between the response block (Y), including three response variables, and the explanatory block (X), including 8 explanatory variables (see Appendix A: Tables S1 and S2 for variable abbreviations) for four US Pacific Northwest estuaries (Figure 1) across all years (2006-2019).
Given that Axis 1 was significant and strongly related to all three response variables, we focused on the relative contribution of each environmental driver in explaining this axis (Figure 5). Environmental variables contributing (weight2) greater than a value of 1 divided by the total number of variables (in this case 1/8 or about 12%) were considered important. According to the weight2 values, normalized freshwater flow (“FWFlow”: 25%), water temperature (“Temp”: 21%), offshore current (“Offshore”: 20%), and tidal exchange volume (“VolExch”: 14%) contributed significantly to Axis 1 (Table 2). The remaining four environmental drivers, including estuarine heatwaves (“EHW”: 0%), all contributed less than 12% to Axis 1 (Table 2).
We also performed separate PLSR analyses for before the MHW (2006-2010) and during and after the MHW (2015-2019) relative to the NE Pacific Ocean MHW. Relationships between macrophyte biomass and environmental drivers before and after the MHW remained relatively similar and thus are well represented by the PLSR containing all years (Appendix A: Figures S4, S5 and Appendix A: Tables S5, S6). However, one notable difference is the eelgrass vector, which is positively associated with water temperature (“Temp”) and tidal exchange (“VolExch”) in the overall and early years models (Figure 5 and Appendix A: Figure S4), changed orientation to become orthogonal (unrelated) to those environmental driver vectors and became positively aligned with alongshore current strength (“Alongshore”) in the later years model (Appendix A: Figure S5).
Discussion
Responses to the MHW Differed by Estuary and Macrophyte Taxa
Marine dominated sites in four US Pacific Northwest estuaries experienced abnormally elevated water temperature events (“estuarine heatwaves”) between 2014-2016, coinciding with the timing of the NE Pacific Ocean marine heatwave (MHW) along the US west coast (Figure 2 and Table 1) (Gentemann et al., 2017). Changes in macrophyte abundance at the four marine dominated sites were associated with the MHW, however these changes were not coherent across estuaries or macrophyte taxa (Figures 3, 4). The lack of coherence observed, combined with our partial least square regression (PLSR) analysis, indicates that underlying physiographic differences in these estuaries, primarily ocean upwelling exposure and freshwater flow, likely altered the response of macrophytes to the MHW and associated estuarine heatwaves.
Total macrophyte biomass at our marine dominated sites generally declined in all estuaries during the MHW, in part because of universal declines in ulvoid macroalgae (Figures 3, 4). However, eelgrass varied in response to the MHW; there were declines in eelgrass biomass in northern estuaries (Willapa Bay and Netarts Bay) but either no change or an increase in eelgrass biomass in southern estuaries (Yaquina Bay and Coos Bay) (Figure 4 and Appendix A: Figure S2). After the MHW, ulvoid macroalgae returned to its original biomass in all estuaries except Coos Bay, remaining low through the end of our study (2019). Moreover, even though eelgrass in Coos Bay and Yaquina Bay returned to its pre-MHW biomass after the MHW abated, it continued to decline in Willapa Bay and Netarts Bay suggesting a lag in recovery of eelgrass in northern estuaries.
What might explain the differences in macrophyte response to the MHW across the four estuaries? Our analysis suggests that the differing responses of eelgrass in Willapa Bay and Netarts Bay (declining biomass and no subsequent recovery) compared to Coos Bay and Yaquina Bay (stable or increasing) are likely a consequence of differences in upwelling intensity and water depth among the estuaries (Figure 5 and Table 2). Although all sites in our study were located at approximately the same tidal elevation (within 0.1 m of mean lower low water), the overall depth of these estuaries and the proximity of the macrophyte beds to the main estuary channel differed. For example, Willapa Bay and Netarts Bay are shallower with less upwelling influence compared to Yaquina Bay and Coos Bay, which are deeper and experience stronger upwelling conditions. In addition, the sites in Willapa Bay and Netarts Bay were located further from the main estuary channel compared to the sites in Yaquina Bay and Coos Bay, which may have influenced macrophyte response to the MHW. Water depth, in particular, was identified as an important mitigating factor for eelgrass experiencing a MHW in the coastal bays of Virginia, US (Aoki et al., 2020). In that study, all water depths experienced elevated temperatures, but deeper eelgrass beds had a shorter total duration of warm water exposure and thus greater resilience (Aoki et al., 2020). It is important to note that eelgrass in the US Pacific Northwest occurs both in the intertidal and subtidal zones, but we lacked survey data to characterize the response of subtidal eelgrass to the MHW for this study.
Although eelgrass (Z. marina) is known to tolerate water temperatures up to 30°C (Orth and Moore, 1986; Lee et al., 2007), it has been shown to display acclimation to local environments (Kaldy and Lee, 2007; Kaldy, 2014; Reynolds et al., 2016) and, regionally, eelgrass in the US Pacific Northwest is thought to be most productive at 5–8°C with signs of physiological stress above 15°C (Thom et al., 2003). Because estuary water temperatures already commonly reach 15°C in Willapa Bay and Netarts Bay during the summer, the additional thermal stress of the MHW event likely exceeded a performance threshold for eelgrass at the marine dominated sites that resulted in reduced biomass and recovery. On the other hand, as a consequence of normally more intense upwelling and colder waters in the south, the eelgrass population at marine dominated sites in Yaquina Bay and Coos Bay appeared to be unaffected or to benefit from the MHW. Support for this hypothesis can be found in the comparison of the PLSR analyses for “all years” versus “during and after the MHW.” The factor that had the most positive effect on eelgrass biomass during the MHW was alongshore upwelling intensity, suggesting that the warm water associated with the MHW was mitigated by colder upwelled waters, creating a thermal regime in the marine dominated zone of southern estuaries that was conducive to eelgrass growth (Appendix A: Figure S5 and Table S6). The long-term trends in eelgrass biomass among the estuaries suggest that aboveground eelgrass biomass in southern estuaries, which was a third of that in northern estuaries prior to the MHW, is typically constrained by the cold, nutrient rich water delivered to these estuaries during non-MHW conditions (Figures 2, 4; Hessing-Lewis and Hacker, 2013).
The relationship between ulvoid macroalgae biomass and water temperature is not well defined, with previous studies reporting a negative relationship (Rivers and Peckol, 1995), positive relationship (Nelson et al., 2003), or no relationship (Kentula and DeWitt, 2003). However, similar to epiphytes (Kaldy et al., 2017) and kelp (Arafeh-Dalmau et al., 2019; Cavanaugh et al., 2019; Rogers-Bennett and Catton, 2019), we found that ulvoid macroalgae at marine dominated sites appeared to be sensitive to elevated temperatures with dramatic declines in the southern estuaries where ulvoid macroalgae dominated prior to the MHW (Figures 3, 4). Thus, even estuaries that experience more intense upwelling failed to provide a thermal refuge for macroalgae at marine dominated sites during the MHW.
Coincident with water temperature changes, altered nutrient delivery to estuaries due to oceanographic changes in stratification and upwelling during the MHW (Brodeur et al., 2019) may have influenced macrophyte production. Although macroalgae are traditionally considered nutrient-limited (Wheeler and Björnsäter, 1992), previous research in US Pacific Northwest estuaries suggests that, under most conditions, neither ulvoid macroalgae nor eelgrass experience nutrient limitation given the persistent exposure to nutrient rich upwelled waters during the growing season (Williams and Ruckelshaus, 1993; Hessing-Lewis and Hacker, 2013; Kaldy, 2014; Hessing-Lewis et al., 2015; Kaldy et al., 2017). Instead, macrophyte production in this region is primarily limited by light and temperature. However, although water temperature appears to be the main driver of macrophyte dynamics in this study, nutrients cannot be ruled out as a factor, particularly given the dramatic declines in ulvoid macroalgae that we observed. Therefore, future studies should characterize freshwater and marine nutrient loads and the nutrient ratio in macrophyte tissues to further tease apart the combined effects of temperature and nutrients during climatic events.
Other Factors Contributing to Variable Macrophyte Responses
The effect of the MHW may have been exacerbated by other differences among the estuaries, particularly in the timing of summer tides and the local climatic conditions. For example, summer spring low tides in northern estuaries are later in the morning compared to southern estuaries (roughly an hour difference between Willapa Bay and Coos Bay). This difference could expose intertidal macrophytes in Willapa Bay and Netarts Bay to additional heat stress, similar to what has been observed for rocky intertidal organisms along the US west coast (Helmuth et al., 2006). Additional local climate differences could play a mitigating role in macrophyte responses to MHWs, as well. Strong summer upwelling off Yaquina Bay and Coos Bay can lead to more frequent, dense coastal fog in the south compared to the north (Thom et al., 2003), which keeps summer air temperatures cooler and could reduce desiccation of intertidal macrophytes during aerial exposure at low tide (Boese et al., 2003). Moreover, the joint occurrence of the MHW with an atmospheric El Niño event, which increased both ocean and air temperatures across the US Pacific Northwest (Schmeisser et al., 2019), may accentuate the differences in the local tide- and climate-related thermal exposure of macrophytes among the estuaries.
There may have been indirect effects of the MHW on eelgrass through the reduction of negative species interactions with macroalgae and epiphytes. In particular, algal blooms (including macroalgae and epiphytes) can negatively affect seagrasses via reduced light availability and altered biogeochemical conditions (e.g., Burkholder et al., 1992; Hauxwell et al., 2001; McGlathery, 2001; Armitage et al., 2005; Burkholder et al., 2007; Hessing-Lewis et al., 2011; Nelson, 2017). However, for macroalgae, previous research in the same estuaries considered in this study did not find evidence of competition with eelgrass, even at very high macroalgae biomass in the marine dominated sites within the estuary (Hessing-Lewis et al., 2011; Hessing-Lewis and Hacker, 2013; Hessing-Lewis et al., 2015). In fact, in our study, eelgrass declines associated with the MHW were most pronounced in northern estuaries where ulvoid macroalgae biomass was already low prior to the MHW (Figures 3, 4). In Coos Bay, where ulvoid macroalgae biomass can be high, eelgrass did increase as macroalgae decreased during the MHW, but eelgrass returned to pre-MHW biomass despite macroalgae biomass remaining low (Figures 3, 4). Therefore, it does not appear that the possible indirect effects of macroalgae decline from the MHW contributed to the observed responses in eelgrass in any of the estuaries.
For epiphytes, the lack of survey data prior to the MHW prevents us from determining epiphyte response to the MHW or possible subsequent indirect effects to eelgrass. However, comparing our data to that of a synthesis by Nelson (2018) on eelgrass epiphyte loads in our study estuaries prior to the MHW, we find that average epiphyte load likely declined in all four estuaries during the MHW but then recovered afterward (see Appendix A: Table S4). Three previous studies concluded that eelgrass in US Pacific Northwest estuaries can tolerate high seasonal epiphyte loads because light availability at intertidal sites is sufficient during the summer when epiphytes are most dense (Ruesink, 2016; Nelson, 2018; Hayduk et al., 2019). In addition, our data (Figure 2 and Appendix A: Figure S3) and that of others (Nelson, 2018) show that epiphyte loads were already low in Willapa Bay and Netarts Bay where eelgrass declines were most pronounced, potentially a result of the underlying warmer water temperatures in these estuaries (Kaldy et al., 2017). Therefore, it is unlikely that changing epiphyte load was the primary driver of the eelgrass responses we observed. However, if epiphytes did decline in Yaquina Bay and Coos Bay in response to the MHW, this may have contributed to the stimulated eelgrass growth we observed in those locations during and after the MHW.
Variable Recovery of Eelgrass After the MHW Event
Eelgrass responses following the end of the MHW indicate differences in resilience among these sites to warm water events. At the Coos Bay site, eelgrass returned to pre-MHW biomass by 2019 but the continued decline of eelgrass (in total biomass, shoot density, and per shoot biomass) in Willapa Bay and Netarts Bay after the end of MHW indicates a substantial lag in recovery despite a reversal of adverse conditions in those estuaries. Lagged recovery in seagrass systems can be indicative of the presence of strong biophysical, physiological, and/or demographic feedbacks that maintain the system in the unrecovered state even after the perturbation has been removed (e.g., Roca et al., 2016; Maxwell et al., 2017; O’Brien et al., 2018). Change in eelgrass morphology as a consequence of a warming event, such as those identified by DuBois et al. (2020) in mesocosm studies of Zostera marina, could contribute to such feedbacks. Typically, positive feedbacks buffer seagrass from environmental stress (especially for larger and longer-lived seagrasses, such as Zostera marina), but once a threshold is exceeded, degradation can occur rapidly and recovery time scales can be protracted (Roca et al., 2016; O’Brien et al., 2018). The importance of specific feedbacks in preventing recovery can vary greatly between seagrass communities (Maxwell et al., 2017; O’Brien et al., 2018) and structural and demographic parameters such as those measured in our study (e.g., biomass and shoot density) are likely to respond more slowly during degradation and recovery compared to physiological indicators (Roca et al., 2016). Furthermore, previous experimental research in mesocosms found genotypic variation in Zostera marina sensitivity to warming (Reynolds et al., 2016; DuBois et al., 2019) and that the relative performance of genotypes shifts following a warming event (DuBois et al., 2019). In the case of our study, we lacked sufficient information about the biophysical condition and genetic makeup of the beds to explore the possible causes of differential recovery of eelgrass in the four estuaries, or the role of feedbacks in the lack of eelgrass recovery observed in the northern estuaries. Moreover, it is unclear why ulvoid macroalgae responded positively to the cessation of the MHW in all the estuaries except Coos Bay where it is normally abundant.
Understanding Resilience of Estuarine Macrophytes to Climate Change
Future climate predictions for the US Pacific Northwest coast include warming air and sea surface temperatures, decreased precipitation, and the potential for increased upwelling and MHW events (Sydeman et al., 2014; Joh and Di Lorenzo, 2017; USGCRP, 2017). If MHW events increase in frequency and magnitude in the NE Pacific Ocean (Joh and Di Lorenzo, 2017), eelgrass and ulvoid macroalgae in at marine dominated sites in northern estuaries are likely to be negatively affected, whereas eelgrass at marine dominated sites in southern estuaries may respond positively, up to a point. On the other hand, future increases in upwelling intensity (Sydeman et al., 2014) may offset MHW effects, favoring eelgrass over ulvoid macroalgae and epiphytes in northern estuaries, and the opposite in southern estuaries. Emerging research suggests the potential for acclimation and adaptation of macrophytes due to phenotypic variation (reviewed in Duarte et al., 2018), which could shape the resilience of these species over time. For example, DuBois et al. (2020) found that sublethal effects of warming resulted in phenotypic plasticity of Zostera marina that could confer either resilience or susceptibility to future exposure. Given the unique combinations of ocean and climate conditions experienced in US Pacific Northwest estuaries, our study provides a framework for understanding the differential consequences of marine heatwaves to estuarine macrophyte communities. We suggest that indicators of baseline ocean upwelling and estuarine temperature can be used to anticipate macrophyte response to future MHWs, but additional studies are needed to predict the resilience of macrophytes across the full spectrum of estuarine conditions.
Data Availability Statement
The original contributions presented in the study are included in the article/Supplementary Material. Further inquiries can be directed to the corresponding author.
Author Contributions
This study was conceived of and designed by CM, FC, and SH. CM, MH-L, and SH performed the field and lab work. CM performed the statistical analyses. CM wrote the manuscript and all authors provided edits for the final version. All authors contributed to the article and approved the submitted version.
Funding
Research in Willapa Bay from 2006–2010 was funded by a Western Regional Aquaculture Center (USDA) grant to SH. Research in Coos Bay from 2006-2010 was funded by the National Estuarine Reserve System (NOAA) to MH-L. Additional financial support to the authors came from OSU Department of Integrative Biology.
Conflict of Interest
The authors declare that the research was conducted in the absence of any commercial or financial relationships that could be construed as a potential conflict of interest.
Publisher’s Note
All claims expressed in this article are solely those of the authors and do not necessarily represent those of their affiliated organizations, or those of the publisher, the editors and the reviewers. Any product that may be evaluated in this article, or claim that may be made by its manufacturer, is not guaranteed or endorsed by the publisher.
Acknowledgments
We thank NANOOS for data access and the many individuals who collected long term records of water temperature. Additional data were provided by A. Helms and A. DeMarzo for Coos Bay, T. C. Mochon-Collura for Yaquina Bay, B. Hales for Netarts Bay, and A. Suhrbier for Willapa Bay. J. Hayduk provided 2015 macrophyte data. Many Oregon State University undergraduate students also contributed to field and lab work, including M. McGuire, C. Lozano, F. Hubbard, M. Hertford, C. Norman, and J. Moon. Thanks to several reviewers whose comments improved our manuscript.
Supplementary Material
The Supplementary Material for this article can be found online at: https://www.frontiersin.org/articles/10.3389/fmars.2022.838967/full#supplementary-material
References
Aoki L. R., McGlathery K. J., Wiberg P. L., Al-Haj A. (2020). Depth Affects Seagrass Restoration Success and Resilience to Marine Heat Wave Disturbance. Estuaries Coasts 43, 316–328. doi: 10.1007/s12237-019-00685-0
Arafeh-Dalmau N., Montaño-Moctezuma G., Martínez J. A., Beas-Luna R., Schoeman D. S., Torres-Moye G. (2019). Extreme Marine Heatwaves Alter Kelp Forest Community Near its Equatorward Distribution Limit. Front. Marine Sci. 6. doi: 10.3389/fmars.2019.00499
Armitage A. R., Frankovich T. A., Heck K. L., Fourqurean J. W. (2005). Experimental Nutrient Enrichment Causes Complex Changes in Seagrass, Microalgae, and Macroalgae Community Structure in Florida Bay. Estuaries 28, 422–434. doi: 10.1007/BF02693924
Barbier E. B., Hacker S. D., Kennedy C., Koch E. W., Stier A. C., Silliman B. R. (2011). The Value of Estuarine and Coastal Ecosystem Services. Ecol. Monogr. 81, 169–193. doi: 10.1890/10-1510.1
Benthuysen J. A., Oliver E. C. J., Chen K., Wernberg T. (2020). Editorial: Advances in Understanding Marine Heatwaves and Their Impacts. Front. Marine Sci. 7. doi: 10.3389/fmars.2020.00147
Benthuysen J. A., Oliver E. C. J., Feng M., Marshall A. G. (2018). Extreme Marine Warming Across Tropical Australia During Austral Summer 2015–2016. J. Geophysical Res.: Oceans 123, 1301–1326. doi: 10.1002/2017JC013326
Boese B. L., Alayan K. E., Gooch E. F., Robbins B. D. (2003). Desiccation Index: A Measure of Damage Caused by Adverse Aerial Exposure on Intertidal Eelgrass (Zostera Marina) in an Oregon (USA) Estuary. Aquat. Bot. 76, 329–337. doi: 10.1016/S0304-3770(03)00068-8
Brodeur R. D., Auth T. D., Phillips A. J. (2019). Major Shifts in Pelagic Micronekton and Macrozooplankton Community Structure in an Upwelling Ecosystem Related to an Unprecedented Marine Heatwave. Front. Marine Sci. 6. doi: 10.3389/fmars.2019.00212
Brown C. A., Nelson W. G., Boese B. L., DeWitt T. H., Eldridge P. M., Kaldy J. E., et al. (2007). An Approach to Developing Nutrient Criteria for Pacific Northwest Estuaries: A Case Study of Yaquina Estuary, Oregon. EPA/600/R-07/046. U.S. EPA. Office Res. Development Natl. Health Environ. Effects Res. Lab. Western Ecol. Division. pp. 169.
Brown C. A., Ozretich R. J. (2009). Coupling Between the Coastal Ocean and Yaquina Bay, Oregon: Importance of Oceanic Inputs Relative to Other Nitrogen Sources. Estuaries Coasts 32, 219–237. doi: 10.1007/s12237-008-9128-6
Burkholder J. M., Mason K. M., Glasgow H. B. (1992). Water-Column Nitrate Enrichment Promotes Decline of Eelgrass Zostera Marina: Evidence From Seasonal Mesocosm Experiments. Marine Ecol. Prog. Ser. 81, 163–178. doi: 10.3354/meps081163
Burkholder J. M., Tomasko D. A., Touchette B. W. (2007). Seagrasses and Eutrophication. J. Exp. Marine Biol. Ecol. 350, 46–72. doi: 10.1016/j.jembe.2007.06.024
Carrascal L. M., Galván I., Gordo O. (2009). Partial Least Squares Regression as an Alternative to Current Regression Methods Used in Ecology. Oikos 118, 681–690. doi: 10.1111/j.1600-0706.2008.16881.x
Cavanaugh K. C., Reed D. C., Bell R. W., Castorani M. C. N., Beas-Luna R. (2019). Spatial Variability in the Resistance and Resilience of Giant Kelp in Southern and Baja California to a Multiyear Heatwave. Front. Marine Sci. 6. doi: 10.3389/fmars.2019.00413
Cavole L. M., Demko A. M., Diner R. E., Giddings A., Koester I., Pagniello C. M. L. S., et al. (2016). Biological Impacts of the 2013–2015 Warm-Water Anomaly in the Northeast Pacific: Winners, Losers, and the Future. Oceanography 29, 273–285. doi: 10.5670/oceanog.2016.32
Chen K., Gawarkiewicz G. G., Lentz S. J., Bane J. M. (2014). Diagnosing the Warming of the Northeastern U.S. Coastal Ocean in 2012: A Linkage Between the Atmospheric Jet Stream Variability and Ocean Response. J. Geophysical Res.: Oceans 119, 218–227. doi: 10.1002/2013JC009393
Di Lorenzo E., Mantua N. (2016). Multi-Year Persistence of the 2014/15 North Pacific Marine Heatwave. Nat. Climate Change 6, 1042–1047. doi: 10.1038/nclimate3082
Domingues C. M., Church J. A., White N. J., Gleckler P. J., Wijffels S. E., Barker P. M., et al. (2008). Improved Estimates of Upper-Ocean Warming and Multi-Decadal Sea-Level Rise. Nature 453, 1090–1093. doi: 10.1038/nature07080
Duarte B., Martins I., Rosa R., Matos A. R., Roleda M. Y., Reusch T. B. H., et al. (2018). Climate Change Impacts on Seagrass Meadows and Macroalgal Forests: An Integrative Perspective on Acclimation and Adaptation Potential. Front. Marine Sci. 5. doi: 10.3389/fmars.2018.00190
DuBois K., Abbott J. M., Williams S. L., Stachowicz J. J. (2019). Relative Performance of Eelgrass Genotypes Shifts During an Extreme Warming Event: Disentangling the Roles of Multiple Traits. Marine Ecol. Prog. Ser. 615, 67–77. doi: 10.3354/meps12914
DuBois K., Williams S. L., Stachowicz J. J. (2020). Previous Exposure Mediates the Response of Eelgrass to Future Warming via Clonal Trans- Generational Plasticity. Ecology 101 (12), e03169. doi: 10.1002/ecy.3169
Gentemann C. L., Fewings M. R., García-Reyes M. (2017). Satellite Sea Surface Temperatures Along the West Coast of the United States During the 2014–2016 Northeast Pacific Marine Heat Wave. Geophysical Res. Lett. 44, 312–319. doi: 10.1002/2016GL071039
Gouhier T. C., Guichard F., Menge B. A. (2010). Ecological Processes can Synchronize Marine Population Dynamics Over Continental Scales. Proc. Natl. Acad. Sci. 107, 8281–8286. doi: 10.1073/pnas.0914588107
Hauxwell J., Cebrián J., Furlong C., Valiela I. (2001). Macroalgal Canopies Contribute to Eelgrass (Zostera Marina) Decline in Temperate Estuarine Ecosystems. Ecology 82, 1007–1022. doi: 10.1890/0012-9658(2001)082[1007:MCCTEZ]2.0.CO;2
Hayduk J. L., Hacker S. D., Henderson J. S., Tomas F. (2019). Evidence for Regional-Scale Controls on Eelgrass (Zostera Marina) and Mesograzer Community Structure in Upwelling-Influenced Estuaries. Limnol. Oceanography 64, 1120–1134. doi: 10.1002/lno.11102
Helmuth B., Broitman B. R., Blanchette C. A., Gilman S., Halpin P., Harley C. D. G., et al. (2006). Mosaic Patterns of Thermal Stress in the Rocky Intertidal Zone: Implications for Climate Change. Ecol. Monogr. 76, 461–479. doi: 10.1890/0012-9615(2006)076[0461:MPOTSI]2.0.CO;2
Hendriks I. E., Olsen Y. S., Ramajo L., Basso L., Steckbauer A., Moore T. S., et al. (2014). Photosynthetic Activity Buffers Ocean Acidification in Seagrass Meadows. Biogeosciences 11, 333–346. doi: 10.5194/bg-11-333-2014
Hessing-Lewis M. L., Hacker S. D. (2013). Upwelling-Influence, Macroalgal Blooms, and Seagrass Production; Temporal Trends From Latitudinal and Local Scales in Northeast Pacific Estuaries. Limnol. Oceanography 58, 1103–1112. doi: 10.4319/lo.2013.58.3.1103
Hessing-Lewis M. L., Hacker S. D., Menge B. A., McConville S., Henderson J. (2015). Are Large Macroalgal Blooms Necessarily Bad? Nutrient Impacts on Seagrass in Upwelling-Influenced Estuaries. Ecol. Appl. 25, 1330–1347. doi: 10.1890/14-0548.1
Hessing-Lewis M. L., Hacker S. D., Menge B. A., Rumrill S. S. (2011). Context-Dependent Eelgrass–Macroalgae Interactions Along an Estuarine Gradient in the Pacific Northwest, USA. Estuaries Coasts 34, 1169–1181. doi: 10.1007/s12237-011-9412-8
Hickey B. M., Banas N. S. (2003). Oceanography of the US Pacific Northwest Coastal Ocean and Estuaries With Application to Coastal Ecology. Estuaries 26, 1010–1031. doi: 10.1007/BF02803360
Hickey B. M., Banas N. S. (2008). Why is the Northern End of the California Current System So Productive? Oceanography 21, 90–107. doi: 10.5670/oceanog.2008.07
Hobday A. J., Alexander L. V., Perkins S. E., Smale D. A., Straub S. C., Oliver E. C. J., et al. (2016). A Hierarchical Approach to Defining Marine Heatwaves. Prog. Oceanography 141, 227–238. doi: 10.1016/j.pocean.2015.12.014
Hobday A. J., Oliver E. C. J., Gupta A. S., Benthuysen J. A., Burrows M. T., Donat M. G., et al. (2018). Categorizing and Naming Marine Heatwaves. Oceanography 31, 162–173. doi: 10.5670/oceanog.2018.205
Howard J., Sutton-Grier A., Herr D., Kleypas J., Landis E., Mcleod E., et al. (2017). Clarifying the Role of Coastal and Marine Systems in Climate Mitigation. Front. Ecol. Environ. 15, 42–50. doi: 10.1002/fee.1451
Howarth R., Chan F., Conley D. J., Garnier J., Doney S. C., Marino R., et al. (2011). Coupled Biogeochemical Cycles: Eutrophication and Hypoxia in Temperate Estuaries and Coastal Marine Ecosystems. Front. Ecol. Environ. 9, 18–26. doi: 10.1890/100008
Joh Y., Di Lorenzo E. (2017). Increasing Coupling Between NPGO and PDO Leads to Prolonged Marine Heatwaves in the Northeast Pacific. Geophysical Res. Lett. 44, 11663–11671. doi: 10.1002/2017GL075930
Kaldy J. E. (2014). Effect of Temperature and Nutrient Manipulations on Eelgrass Zostera Marina L. From the Pacific Northwest, USA. J. Exp. Marine Biol. Ecol. 453, 108–115. doi: 10.1016/j.jembe.2013.12.020
Kaldy J. E., Brown C. A., Nelson W. G., Frazier M. (2017). Macrophyte Community Response to Nitrogen Loading and Thermal Stressors in Rapidly Flushed Mesocosm Systems. J. Exp. Marine Biol. Ecol. 497, 107–119. doi: 10.1016/j.jembe.2017.09.022
Kaldy J. E., Lee K. (2007). Factors Controlling Zostera Marina L. Growth in the Eastern and Western Pacific Ocean: Comparisons Between Korea and Oregon, USA. Aquat. Bot. 87, 116–126. doi: 10.1016/j.aquabot.2007.03.008
Kendrick G. A., Nowicki R. J., Olsen Y. S., Strydom S., Fraser M. W., Sinclair E. A., et al. (2019). A Systematic Review of How Multiple Stressors From an Extreme Event Drove Ecosystem-Wide Loss of Resilience in an Iconic Seagrass Community. Front. Marine Sci. 6. doi: 10.3389/fmars.2019.00455
Kentula M. E., DeWitt T. H. (2003). Abundance of Seagrass (Zostera Marina L.) and Macroalgae in Relation to the Salinity-Temperature Gradient in Yaquina Bay, Oregon, USA. Estuaries 26, 1130–1141. doi: 10.1007/BF02803369
Koch M., Bowes G., Ross C., Zhang X. (2013). Climate Change and Ocean Acidification Effects on Seagrasses and Marine Macroalgae. Global Change Biol. 19, 103–132. doi: 10.1111/j.1365-2486.2012.02791.x
Lee H., Brown C. A. (2009). Classification of Regional Patterns of Environmental Drivers and Benthic Habitats in Pacific Northwest Estuaries. EPA/600/R-09/140. U.S. EPA Office Res. Development Natl. Health Environ. Effects Res. Lab. Western Ecol. Division. pp. 298.
Lee K., Park S. R., Kim Y. K. (2007). Effects of Irradiance, Temperature, and Nutrients on Growth Dynamics of Seagrasses: A Review. J. Exp. Marine Biol. Ecol. 350, 144–175. doi: 10.1016/j.jembe.2007.06.016
Lefcheck J. S., Wilcox D. J., Murphy R. R., Marion S. R., Orth R. J. (2017). Multiple Stressors Threaten the Imperiled Coastal Foundation Species Eelgrass (Zostera Marina) in Chesapeake Bay, USA. Global Change Biol. 23, 3474–3483. doi: 10.1111/gcb.13623
Lenth R. V. (2016). Least-Squares Means: The R Package Lsmeans. J. Stat. Software 69, 1–33. doi: 10.18637/jss.v069.i01
Magel C. L. (2020). Ecosystem Functions of Pacific Northwest Estuaries: The Role of Ocean and Watershed Drivers in Eelgrass and Coho Salmon Dynamics (PhD Dissertation, Corvallis, Oregon, USA: Oregon State University).
Marbà N., Duarte C. M. (2010). Mediterranean Warming Triggers Seagrass (Posidonia Oceanica) Shoot Mortality. Global Change Biol. 16, 2366–2375. doi: 10.1111/j.1365-2486.2009.02130.x
Maxwell P. S., Eklöf J. S., van Katwijk M. M., O’Brien K. R., de la Torre-Castro M., Boström C., et al. (2017). The Fundamental Role of Ecological Feedback Mechanisms for the Adaptive Management of Seagrass Ecosystems – a Review. Biol. Rev. 92, 1521–1538. doi: 10.1111/brv.12294
McGlathery K. J. (2001). Macroalgal Blooms Contribute to the Decline of Seagrass in Nutrient-Enriched Coastal Waters. J. Phycol. 37, 453–456. doi: 10.1046/j.1529-8817.2001.037004453.x
McGlathery K. J., Reidenbach M. A., D’Odorico P., Fagherazzi S., Pace M. L., Porter J. H. (2013). Nonlinear Dynamics and Alternative Stable States in Shallow Coastal Systems. Oceanography 26, 220–231. doi: 10.5670/oceanog.2013.66
Mevik B., Wehrens R. (2007). The Pls Package: Principal Component and Partial Least Squares Regression in R. J. Stat. Software 18, 1–23. doi: 10.18637/jss.v018.i02
Nelson W. G. (2017). Development of an Epiphyte Indicator of Nutrient Enrichment: Threshold Values for Seagrass Epiphyte Load. Ecol. Indic. 74, 343–356. doi: 10.1016/j.ecolind.2016.11.035
Nelson W. G. (2018). An Evaluation of Factors Controlling the Abundance of Epiphytes on Zostera Marina Along an Estuarine Gradient in Yaquina Bay, Oregon, USA. Aquat. Bot. 148, 53–63. doi: 10.1016/j.aquabot.2018.04.010
Nelson T., Nelson A., Tjoelker M. (2003). Seasonal and Spatial Patterns of “Green Tides” (ulvoid algal blooms) and related water quality parameters in the coastal waters of Washington state, USA. Botanica Marina 46, 263–275. doi: 10.1515/BOT.2003.024
Nordlund L. M., Koch E. W., Barbier E. B., Creed J. C. (2016). Seagrass Ecosystem Services and Their Variability Across Genera and Geographical Regions. PloS One 11, e0163091. doi: 10.1371/journal.pone.0163091
Nyström M., Norström A. V., Blenckner T., de la Torre-Castro M., Eklöf J. S., Folke C., et al. (2012). Confronting Feedbacks of Degraded Marine Ecosystems. Ecosystems 15, 695–710. doi: 10.1007/s10021-012-9530-6
O’Brien K. R., Waycott M., Maxwell P., Kendrick G. A., Udy J. W., Ferguson A. J. P., et al. (2018). Seagrass Ecosystem Trajectory Depends on the Relative Timescales of Resistance, Recovery and Disturbance. Marine Pollution Bull. 134, 166–176. doi: 10.1016/j.marpolbul.2017.09.006
Olita A., Sorgente R., Ribotti A., Natale S., Gabersek S. (2006). Effects of the 2003 European Heatwave on the Central Mediterranean Sea Surface Layer: A Numerical Simulation. Ocean Sci. Discussions 3, 85–125. doi: 10.5194/osd-3-85-2006
Oliver E. C. J., Benthuysen J. A., Bindoff N. L., Hobday A. J., Holbrook N. J., Mundy C. N., et al. (2017). The Unprecedented 2015/16 Tasman Sea Marine Heatwave. Nat. Commun. 8, 16101. doi: 10.1038/ncomms16101
Oliver E. C. J., Donat M. G., Burrows M. T., Moore P. J., Smale D. A., Alexander L. V., et al. (2018). Longer and More Frequent Marine Heatwaves Over the Past Century. Nat. Commun. 9, 1324. doi: 10.1038/s41467-018-03732-9
Orth R. J., Carruthers T. J. B., Dennison W. C., Duarte C. M., Fourqurean J. W., Heck K. L., et al. (2006). A Global Crisis for Seagrass Ecosystems. BioScience 56, 987–996. doi: 10.1641/0006-3568(2006)56[987:AGCFSE]2.0.CO;2
Orth R. J., Moore K. A. (1986). Seasonal and Year-to-Year Variations in the Growth of Zostera Marina L. (Eelgrass) in the Lower Chesapeake Bay. Aquat. Bot. 24 (4), 335–341. doi: 10.1016/0304-3770(86)90100-2
Pearce A. F., Feng M. (2013). The Rise and Fall of the “Marine Heat Wave” Off Western Australia During the Summer of 2010/2011. J. Marine Syst. 111–112:139–56. doi: 10.1016/j.jmarsys.2012.10.009
Reynolds L. K., DuBois K., Abbott J. M., Williams S. L., Stachowicz J. J. (2016). Response of a Habitat-Forming Marine Plant to a Simulated Warming Event is Delayed, Genotype Specific, and Varies With Phenology. PloS One 11 (6), e0154532. doi: 10.1371/journal.pone.0154532
Rivers J. S., Peckol P. (1995). Summer Decline of Ulva Lactuca (Chlorophyta) in a Eutrophic Embayment: Interactive Effects of Temperature and Nitrogen Availability? J. Phycol. 31, 223–228. doi: 10.1111/j.0022-3646.1995.00223.x
Roca G., Alcoverro T., Krause-Jensen D., Balsby T. J. S., van Katwijk M. M., Marbà N., et al. (2016). Response of Seagrass Indicators to Shifts in Environmental Stressors: A Global Review and Management Synthesis. Ecol. Indic. 63, 310–323. doi: 10.1016/j.ecolind.2015.12.007
Rogers-Bennett L., Catton C. A. (2019). Marine Heat Wave and Multiple Stressors Tip Bull Kelp Forest to Sea Urchin Barrens. Sci. Rep. 9, 15050. doi: 10.1038/s41598-019-51114-y
Ruesink J. L. (2016). Epiphyte Load and Seagrass Performance are Decoupled in an Estuary With Low Eutrophication Risk. J. Exp. Marine Biol. Ecol. 481, 1–8. doi: 10.1016/j.jembe.2016.03.022
Sanchez G. (2012). Plsdepot: Partial Least Squares (PLS) Data Analysis Methods. Available at: https://cran.r-project.org/package=plsdepot.
Schlegel R. W., Smit A. J. (2018). Heatwaver: A Central Algorithm for the Detection of Heatwaves and Cold-Spells. J. Open Source Software 3, 821. doi: 10.21105/joss.00821
Schmeisser L., Bond N. A., Siedlecki S. A., Ackerman T. P. (2019). The Role of Clouds and Surface Heat Fluxes in the Maintenance of the 2013–2016 Northeast Pacific Marine Heatwave. J. Geophysical Res.: Atmospheres 124, 10772–10783. doi: 10.1029/2019JD030780
Sfriso A., Marcomini A. (1996). Decline of Ulva Growth in the Lagoon of Venice. Bioresource Technol. 58, 299–307. doi: 10.1016/S0960-8524(96)00120-4
Shelton A. O., Francis T. B., Feist B. E., Williams G. D., Lindquist A., Levin P. S. (2017). Forty Years of Seagrass Population Stability and Resilience in an Urbanizing Estuary. J. Ecol. 105, 458–470. doi: 10.1111/1365-2745.12682
Smale D. A., Burrows M. T., Moore P., O’Connor N., Hawkins S. J. (2013). Threats and Knowledge Gaps for Ecosystem Services Provided by Kelp Forests: A Northeast Atlantic Perspective. Ecol. Evol. 3, 4016–4038. doi: 10.1002/ece3.774
Sydeman W. J., García-Reyes M., Schoeman D. S., Rykaczewski R. R., Thompson S. A., Black B. A., et al. (2014). Climate Change and Wind Intensification in Coastal Upwelling Ecosystems. Science 345, 77–80. doi: 10.1126/science.1251635
Tallis H. M., Ruesink J. L., Dumbauld B., Hacker S., Wisehart L. M. (2009). Oysters and Aquaculture Practices Affect Eelgrass Density and Productivity in a Pacific Northwest Estuary. J. Shellfish Res. 28, 251–261. doi: 10.2983/035.028.0207
Thom R. M., Borde A. B., Blanton S. L., Woodruff D. L., Williams G. D. (2001). “The Influence of Climate Variation and Change on Structure and Processes in Nearshore Vegetated Communities of Puget Sound and Other Northwest Estuaries,” in In Proceedings of the 2001 Puget Sound Research Conference. Ed. Droscher T. (Olympia, Washington: Puget Sound Water Quality Action Team).
Thom R. M., Borde A. B., Rumrill S., Woodruff D. L., Williams G. D., Southard J. A., et al. (2003). Factors Influencing Spatial and Annual Variability in Eelgrass (Zostera Marina L.) Meadows in Willapa Bay, Washington, and Coos Bay, Oregon, Estuaries. Estuaries 26, 1117–1129. doi: 10.1007/BF02803368
Thomson J. A., Burkholder D. A., Heithaus M. R., Fourqurean J. W., Fraser M. W., Statton J., et al. (2015). Extreme Temperatures, Foundation Species, and Abrupt Ecosystem Change: An Example From an Iconic Seagrass Ecosystem. Global Change Biol. 21, 1463–1474. doi: 10.1111/gcb.12694
Unsworth R. K. F., McKenzie L. J., Nordlund L. M., Cullen-Unsworth L. C. (2018). A Changing Climate for Seagrass Conservation? Curr. Biol. 28, R1229–R1232. doi: 10.1016/j.cub.2018.09.027
USGCRP. (2017). Climate Science Special Report: Fourth National Climate Assessment, Volume I. Wuebbles D. J., Fahey D. W., Hibbard K. A., Dokken D. J., Stewart B. C., Maycock T. K. (eds.). (Washington, DC, USA: U.S. Global Change Research Program) pp, 470. doi: 10.7930/J0J964J6
Walter R. K., Rainville E. J., O’Leary J. K. (2018). Hydrodynamics in a Shallow Seasonally Low-Inflow Estuary Following Eelgrass Collapse. Estuarine Coastal Shelf Sci. 213, 160–175. doi: 10.1016/j.ecss.2018.08.026
Waycott M., Duarte C. M., Carruthers T. J. B., Orth R. J., Dennison W. C., Olyarnik S., et al. (2009). Accelerating Loss of Seagrasses Across the Globe Threatens Coastal Ecosystems. Proc. Natl. Acad. Sci. 106, 12377–12381. doi: 10.1073/pnas.0905620106
Wheeler P. A., Björnsäter B. R. (1992). Seasonal Fluctuations in Tissue Nitrogen, Phosphorus, and N:P for Five Macroalgal Species Common to the Pacific Northwest Coast. J. Phycol. 28, 1–6. doi: 10.1111/j.0022-3646.1992.00001.x
Wijffels S., Roemmich D., Monselesan D., Church J., Gilson J. (2016). Ocean Temperatures Chronicle the Ongoing Warming of Earth. Nat. Climate Change 6 (2),116–118. doi: 10.1038/nclimate2924
Williams S. L., Ruckelshaus M. H. (1993). Effects of Nitrogen Availability and Herbivory on Eelgrass (Zostera Marina) and Epiphytes. Ecology 74, 904–918. doi: 10.2307/1940815
Keywords: marine heatwave, estuaries, eelgrass Zostera marina, ulvoid macroalgae, ocean upwelling, climate change
Citation: Magel CL, Chan F, Hessing-Lewis M and Hacker SD (2022) Differential Responses of Eelgrass and Macroalgae in Pacific Northwest Estuaries Following an Unprecedented NE Pacific Ocean Marine Heatwave. Front. Mar. Sci. 9:838967. doi: 10.3389/fmars.2022.838967
Received: 18 December 2021; Accepted: 09 March 2022;
Published: 01 April 2022.
Edited by:
Itxaso Odériz, National Autonomous University of Mexico, MexicoReviewed by:
Francisca C. García, King Abdullah University of Science and Technology, Saudi ArabiaLaura K. Reynolds, University of Florida, United States
Copyright © 2022 Magel, Chan, Hessing-Lewis and Hacker. This is an open-access article distributed under the terms of the Creative Commons Attribution License (CC BY). The use, distribution or reproduction in other forums is permitted, provided the original author(s) and the copyright owner(s) are credited and that the original publication in this journal is cited, in accordance with accepted academic practice. No use, distribution or reproduction is permitted which does not comply with these terms.
*Correspondence: Caitlin L. Magel, magelcai@uw.edu
†Present address:Caitlin L. Magel, Puget Sound Institute, University of Washington Tacoma, Tacoma, WA, United States