Mesoscale Advective and Biological Processes Alter Carbon Uptake Capacity in a Shelf Sea
 Vlad A. Macovei
 Ulrich Callies
 Paulo H. R. Calil
 Yoana G. Voynova
- 1Department of Coastal Productivity, Institute of Carbon Cycles, Helmholtz-Zentrum Hereon, Geesthacht, Germany
- 2Department of Biogeochemical Modelling, Institute of Carbon Cycles, Helmholtz-Zentrum Hereon, Geesthacht, Germany
- 3Department of Physical-Biological Interactions, Institute of Carbon Cycles, Helmholtz-Zentrum Hereon, Geesthacht, Germany
Marine uptake of carbon dioxide reduces the accumulation of carbon dioxide in the atmosphere. Continental shelf seas are essential for carbon uptake from the atmosphere, but are also highly variable environments, for which uncertainties of carbon budget estimates are large. Recent studies indicate that their carbon sink capacity is weakening. A way to reduce the uncertainty of carbon budgets is to increase our observational capacity, for example through FerryBox installations on Ships-of-Opportunity. Here, we compare FerryBox observations in the North Sea for the fall seasons of 2019 and 2020. We show that short-lived mesoscale events can be characterized when the sampling resolution is adequately high, and that these events cause changes in essential environmental variables on the same magnitude as seasonal cycles. Whether advective or biological in origin, these events rapidly lowered seawater pCO2 by 8–10% and influenced the carbon uptake capacity. We demonstrate the importance of resolving and integrating the variability of these smaller features in regional carbon budget assessments and advocate for the tuning of models in order to capture this small-scale variability.
Introduction
Many continental shelf seas are net sinks of atmospheric carbon dioxide (Chen and Borges, 2009; Laruelle et al., 2018). This is largely due to their highly productive nature, driven by nutrient supply from neighboring terrestrial and oceanic regions (Gattuso et al., 1998). The organic matter from primary production enriches the bottom shelf waters with carbon and the subsequent transfer of these waters to the stratified subsurface open ocean completes the “continental shelf pump” (Tsunogai et al., 1999; Thomas et al., 2004). Recent estimations situate the global net carbon uptake by coastal seas and continental shelves at around 0.2 Pg C yr–1 (Laruelle et al., 2010; Roobaert et al., 2019). It is still unclear how the size of this sink will evolve since the estimated rates of increase of the partial pressure of carbon dioxide (pCO2) in coastal waters were found to be variable between different regions and time periods (Wang et al., 2017; Laruelle et al., 2018).
Compared to the open ocean, the larger variability in trends in coastal seas is caused by the highly dynamic nature of their physical and biogeochemical essential ocean variables on a range of different scales (Bauer et al., 2013). Riverine influence impacts the long-term biogeochemical trends of shelf seas through time-varying nutrient runoff (Jickells, 1998), but also their short-term variability through episodic events such as floods (Voynova et al., 2017; Kerimoglu et al., 2020). As for long-term, cyclical variability, it has been shown that shelf sea biogeochemistry responds to forcings such as the North Atlantic Oscillation (Kühn et al., 2010; Salt et al., 2013; Legge et al., 2020; Xu et al., 2020). Variability could also exist on scales that we are missing if observations and models do not resolve them. Irregular, small temporal scale events might be overlooked even in open-ocean studies (Fischer et al., 2021). Since coastal ocean variability is large, inadequate sampling may bias our interpretation, for example when budgeting attempts are made over large areas extrapolating from sparse data (Landschützer et al., 2016).
A recent summary report of the current state of ocean carbon research has identified that large data gaps remain for coastal and marginal seas due to a lack of systematic pCO2 measurements (IOC-R, 2021). This is a problem considering diurnal variability of over 60 μatm has been observed in some coastal environments (Dai et al., 2009). Also, in dynamic regions such as the Skagerrak Strait in the North Sea, two different water masses caused variations of up to 50–100 μatm in surface pCO2 within a small area (Macovei et al., 2021b). Including data from previously under-sampled regions can change annual average CO2 flux estimates (Li et al., 2020). Similarly, sustained observations can identify events that would have been otherwise missed due to the paucity of observations.
The North Sea is a large temperate shelf sea known to be an important carbon sink in the past (Thomas et al., 2005). More recently, it has been found that its carbon uptake capacity is weakening (Lorkowski et al., 2012; Clargo et al., 2015; Macovei et al., 2021a). The highly dynamic nature of coastal and shelf seas makes it difficult to adequately constrain carbon fluxes (Bauer et al., 2013). As a consequence, their biogeochemistry can only be well-characterized through observations with high temporal and spatial resolution. The carbonate chemistry in the North Sea has been investigated through recent large-scale studies, with results focusing on intra-annual variability and typical annual cycles and budgets (Hartman et al., 2019; Kitidis et al., 2019). While such studies have undoubtedly improved our understanding of the seasonality of North Sea biogeochemistry, they were constructed using large spatial and temporal extrapolations of relatively sparse observations in time and space, which do not capture small to mesoscale events. Conversely, sampling may be done only during an anomalous event, which poses the risk of wrongly assuming typical conditions. With FerryBox Ship-of-Opportunity (SOO) monitoring in place, we can observe the evolution of smaller scale biogeochemical variabilities in surface waters, and determine their magnitude and causes, as well as their impact on ecosystem services, such as atmospheric carbon uptake through algal bloom formation. Given that local physical and biological processes control coastal seawater pCO2 (Cai et al., 2020), here we show that short-lived events (in this study defined as 2–4 weeks) driven by various mesoscale (in this study defined as 100–200 km) processes impact North Sea biogeochemistry significantly, and to the same extent as the long-term trend or seasonal variability.
The typical setting for the Northwest European Shelf in the fall season is that of a weak carbon sink, where the thermal effect of cooling water temperature and the biological effect of remineralization of organic matter act in opposite directions to maintain a close to neutral CO2 flux (Kitidis et al., 2019). More recently, attention was drawn to the effect of fall phytoplankton blooms in this shelf sea as a driver of carbon uptake (Wihsgott et al., 2019). The Central North Sea, in particular, lies on the boundary between being a carbon source/sink in late summer to early fall (Hartman et al., 2019). Furthermore, the same region was recently found to feature increasing trends in seawater pCO2 with the potential of losing its uptake capacity (Macovei et al., 2021a). It is therefore important to first identify the forcing that is acting upon this environment through adequate observational capacity and second, to quantify the effect of mesoscale variability on the fragile carbonate chemistry balance.
In this study, we will present the biogeochemical variability along two SOO lines in the Central North Sea in two consecutive falls (2019 and 2020). We will make use of the high spatial and temporal resolution of the FerryBox sampling to identify short-lived, mesoscale anomalous events during an advectively-driven cold-water intrusion and a late fall phytoplankton bloom. The origin of these events will be investigated with the aid of Lagrangian simulations and physical and biogeochemical models. Finally, the impact of these events will be assessed in the context of regional long-term pCO2 trends and sea-air CO2 fluxes.
Materials and Methods
Observations in Our Study Area
One of the main ways we can improve our understanding of the biogeochemistry of coastal and shelf seas is through increasing our observation capacity (Roobaert et al., 2019). Detailed hydrographic research cruises, which are focused on an area or an event, have in the past provided invaluable information about the biogeochemical evolution of shelf seas (Thomas et al., 2007). However, large time gaps were left unresolved, since they normally capture only a few sampling days in a year. Fixed-point stations, on the other hand, provide long-term records, but the overall coverage of the “footprint” of such observatories only extends over 9–15% of the global ocean surface (Henson et al., 2016). More recently, autonomous underwater gliders or floats have been equipped with biogeochemical sensors (Chai et al., 2020; von Oppeln-Bronikowski et al., 2021), but they are not yet commonly used in coastal regions and they still depend on deployment opportunities restricted to set expeditions. SOO, such as commercial vessels equipped with scientific instruments, are now being used to complement the gaps in data coverage left by other methods. These platforms are a cost-effective way of observing the surface ocean (Jiang et al., 2019). In particular, when the route is repeated often between two ports, the SOO create a pseudo-continuous time series that allows observing short-lived events over a larger spatial scale than fixed-point observatories (Callies et al., 2021).
A continental shelf region with a particularly good coverage by SOO is the North Sea, and this is largely due to the FerryBox program (Petersen, 2014; Petersen et al., 2018). Automated instrument packages are installed on SOO, making use of the regular shipping routes to provide surface seawater measurements. An array of sensors is connected to the ship underway system and typically measures seawater temperature, salinity, turbidity, dissolved oxygen, chlorophyll-a fluorescence, pCO2, and pH, with the ability to include extra sensors through its modular functioning. One of the newest additions to the fleet of FerryBox-equipped SOO in the North Sea is the cargo vessel Magnolia Seaways (DFDS Seaways, Copenhagen, Denmark). The FerryBox was installed in the summer of 2019. In this study, we will focus our analysis on the comparison between two consecutive fall seasons (in 2019—on the Immingham, United Kingdom to Gothenburg, Sweden route and in 2020—on the Immingham, United Kingdom to Esbjerg, Denmark route; see Figure 1). This choice is due both to the identification of significant biogeochemical events during these periods and to ship schedule changes and perturbations to the normal instrument maintenance schedule for the period in-between caused by the COVID-19 pandemic. The routes were repeated often during each season, with port calls at Immingham every 3–4 days in 2019 and every 2 days in 2020.
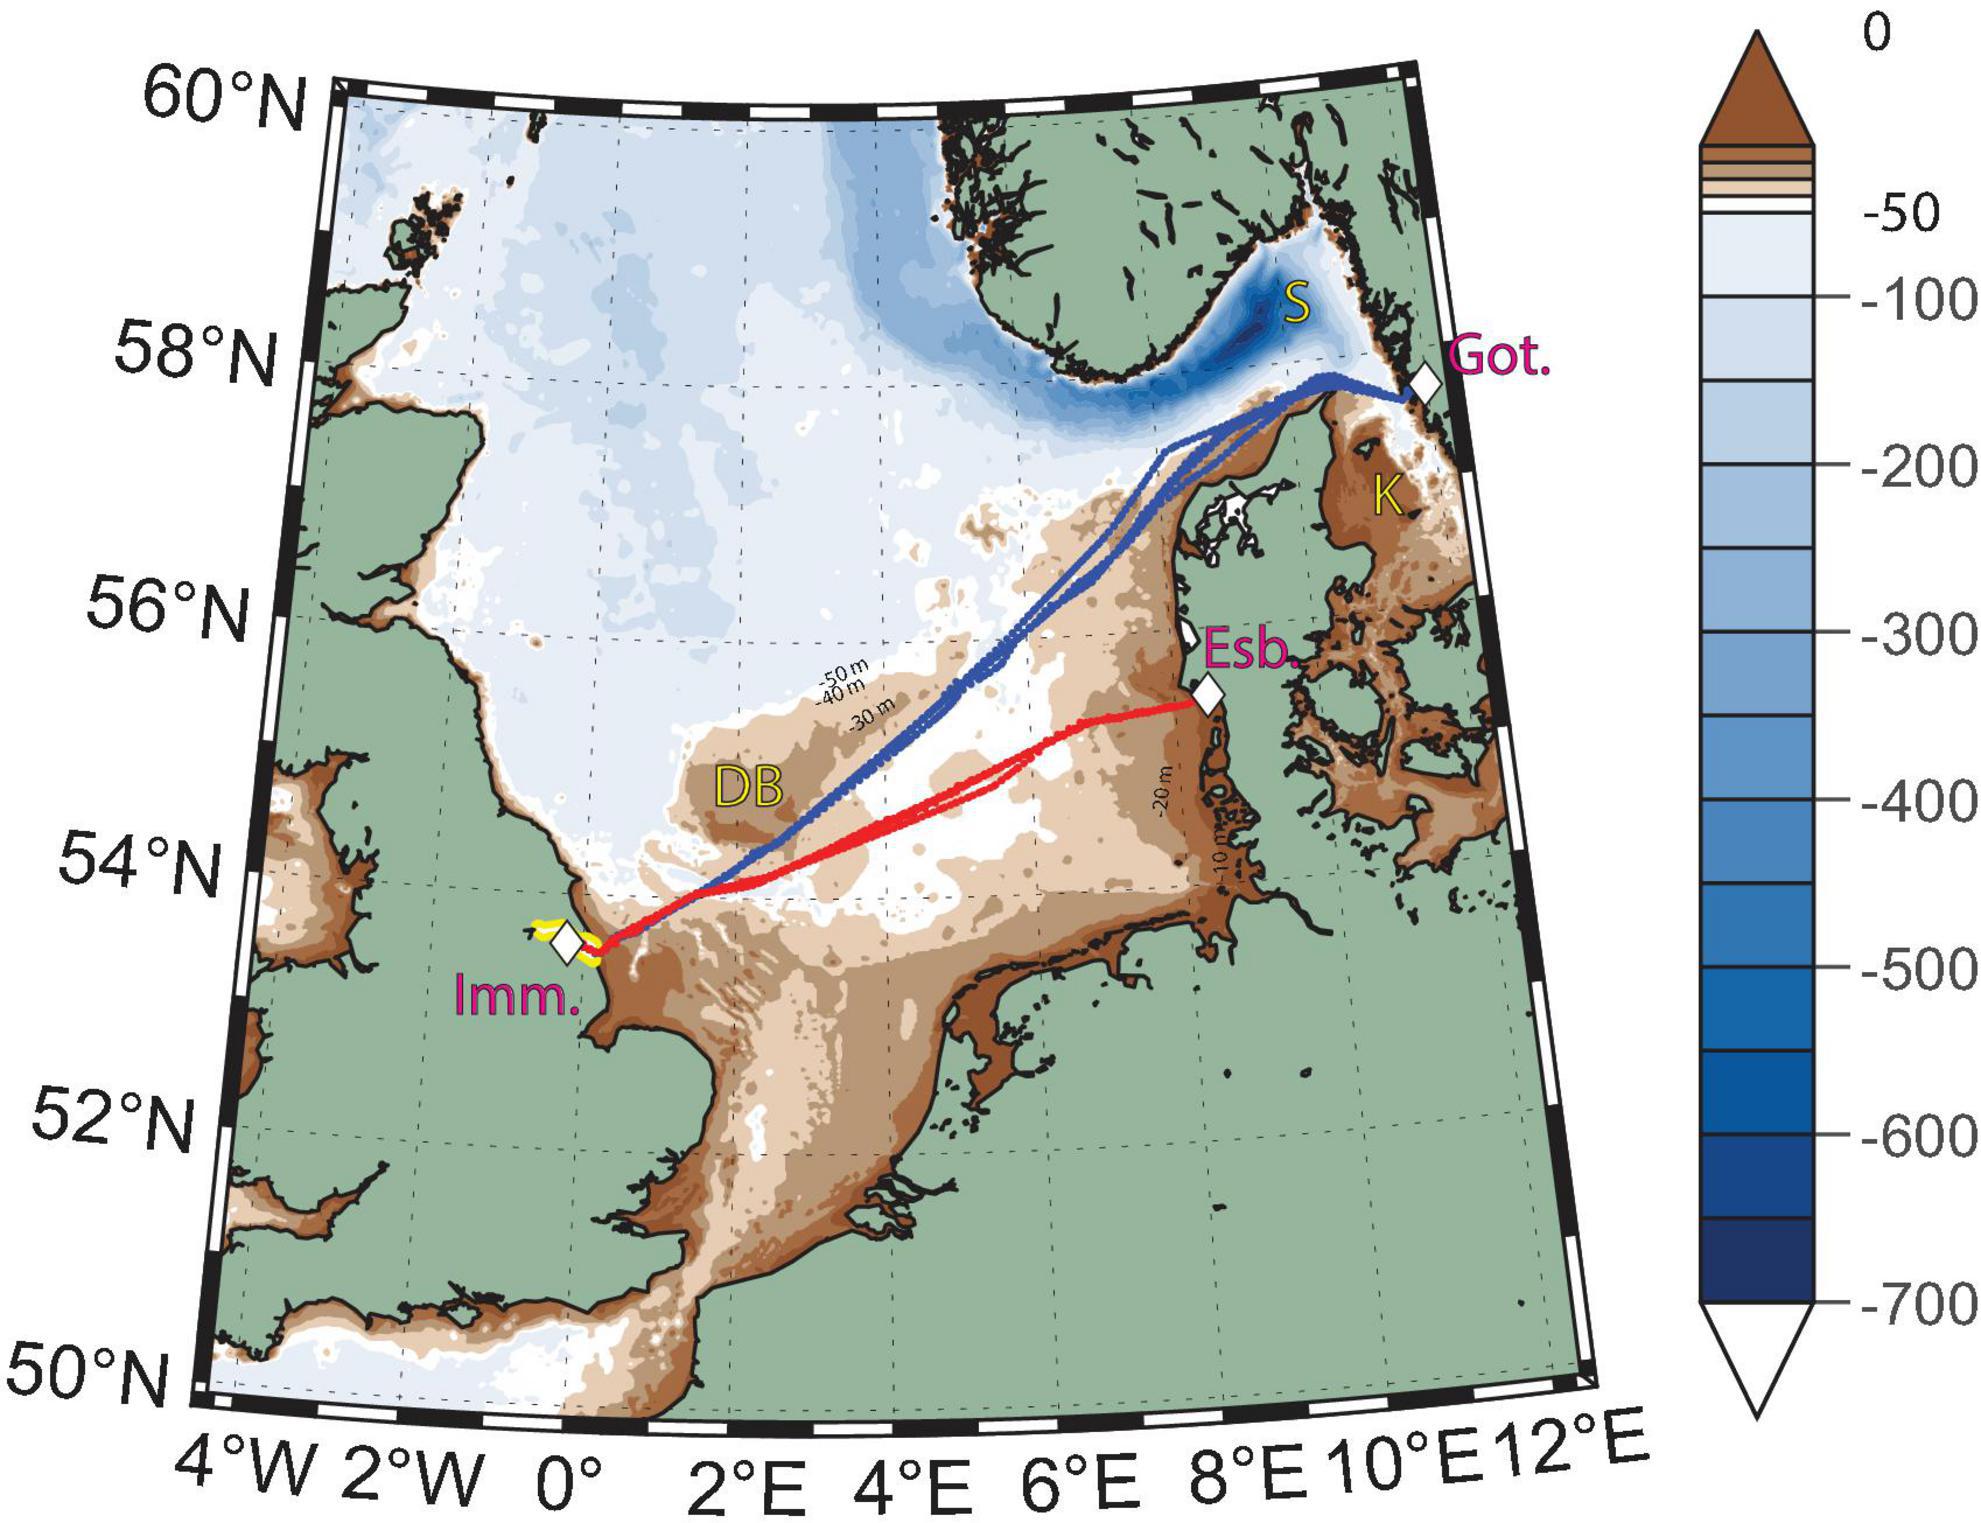
Figure 1. Bathymetric map of the North Sea showing Magnolia Seaways’s tracks in the fall 2019 (blue lines) and fall 2020 (red lines) seasons. The color scale changes shades and spacing at the 50 m isobath. The locations of the ports of Immingham, United Kingdom (Imm.), Gothenburg, Sweden (Got.), and Esbjerg, Denmark (Esb.) are indicated by the white diamonds. The Humber river estuary in the United Kingdom is highlighted in yellow. The locations of the Dogger Bank (DB), Skagerrak Strait (S), and Kattegat Strait (K) are also marked on the map.
Data Acquisition
FerryBox Data
The use of FerryBoxes as a cost-effective method of observing the marine environment is now well established. The ability to remotely control autonomous measurements and cleaning procedures, the minimum maintenance requirements, the overall low costs, and the ease of new sensor integration makes them an ever-growing and versatile platform for ocean observation. They have been used in various studies ranging from new sensor integrations (Voynova et al., 2019), instrument intercalibrations (Macovei et al., 2021b), ocean acidification monitoring (Reggiani et al., 2016) to an analysis of river influence on the coastal environment (Frigstad et al., 2020).
The seawater pCO2 was measured with a membrane-based HydroC CO2-FT sensor (4H-Jena Engineering GmbH, Germany; accuracy of ± 1%). The sensor was calibrated by the manufacturer in March 2019 and kept on the ship for the entire duration of this study. Integration with the FerryBox system allowed for automatic cleaning to be performed. At every port call, the tubes were flushed with acid, pressure cleaned, and freshwater was subsequently kept in the opaque tubes to prevent biofouling. Raw data were corrected for sensor drift and processed according to manufacturer recommendations (Fietzek et al., 2013). Seawater was pumped from the ship underway system through a filter to remove large debris and after approximately 4 m of piping and tubes, was brought to the FerryBox-integrated sensor at a flowrate of approximately 6 L min–1. Since the instrument is installed in the engine room, some warming is expected between the intake and the measurement. At the time of the measurements in this study, no intake temperature measurements were available, therefore a direct pCO2 correction is not possible. The expected warming, based on a similar installation on a different ship and on a ship-buoy comparison (Haller et al., 2015), is 0.4°C. The effect this has on our estimated CO2 fluxes will be explored in the respective section. During the last part of the fall 2020 journeys, the pCO2 sensor became slow to reach optimal operating parameters following the departure from port. As a result, the measurements in the first few hours of each journey were overestimated, evident when comparing with the measurements at the same location on the return route, or before the problem arose. We therefore discarded the first half of each of the affected journeys from the pCO2 dataset (details in Supplementary Material). The frequent journeys of the ship allowed for the removal of flagged data without significant impact on data coverage.
Seawater temperature and salinity were measured with sensors from Teledyne Instruments/Falmouth Scientific, United States (uncertainties of ± 0.1°C and ± 0.02, respectively). Seawater pH was measured with a pH electrode in 2019 (Sensortechnik Meinsberg, Xylem Analytics, Germany; resolution of 0.01 units) and an ion selective field effect transistor (ISFET) in 2020 (Endress Hauser GmbH, Germany; uncertainty of ±2%). In 2020, the pH instrument was slow to reach optimal performance following the departure from port, so the measurements from the first 1 degree of longitude were discarded. The 2019 electrode data, initially reported on the NBS pH scale, were converted to the total scale to match the ISFET results using the Matlab version of the CO2SYS program (van Heuven et al., 2011). The concentration of chlorophyll in seawater, as well as the separation into algal classes (green algae, diatoms, cryptophytes, blue-green algae) was measured by a fluorescence-based AlgaeOnlineAnalyser (AOA) instrument (bbe Moldaenke GmbH, Germany; resolution of 0.01 μg L–1 chlorophyll-a). Total chlorophyll-a was also measured using a microFlu fluorometer (TriOS Mess- und Datentechnik GmbH, Germany; uncertainty of ±5%). The 2020 AOA chlorophyll data were initially over-estimated, but were corrected using the relationship to the microFlu data (details in Supplementary Material). All these sensors were integrated with the FerryBox and operated with LabView routines. Data are available from the European FerryBox Database.1 The pCO2 measurements are also available from the Pangaea repository.2
Drift Simulations
In order to investigate the origin of the water masses sampled by the SOO, we used the Drift App of the CoastMap Geoportal3 under CC BY-NC 4.0 license. The simulations can be performed using the web-based tool.4 The application specifies drift trajectories using the Lagrangian transport program PELETS-2D (Callies et al., 2011). Water mass movements are determined offline based on pre-calculated 2D marine currents, optionally complemented by random dispersion and an extra wind drag forcing. For our study, marine surface currents were extracted from archived output of the three-dimensional hydrographic model BSHcmod (Dick et al., 2001, 2008), run operationally at the German Federal Maritime and Hydrographic Agency (BSH).5 With random dispersion being switched off, 2-week backward trajectories were calculated from chosen points of interest without additional wind drag strength. Using BSHcmod surface currents, Callies et al. (2017) found an extra wind drag specified as 0.6% of 10 m wind velocity to best reproduce observed trajectories of drifters representative for a 1 m surface layer. Since the intake of the FerryBox is located at around 5 m depth, we do not use any extra wind drag, but the conclusions are the same with either method.
Model Outputs
In order to (1) further evaluate the FerryBox observations, (2) compare them to model predictions, and (3) investigate the influence of biogeochemical variables not measured by the FerryBox, such as inorganic nutrients, we used outputs from the Northwest Shelf Analysis and Forecast models available from the Copernicus Marine Environment Monitoring Service.6 Daily surface means were extracted for selected variables of interest from the Physical—NORTHWESTSHELF_ANALYSIS_FORECAST_PHY_004_013 (Tonani et al., 2019) and Biogeochemical—NWSHELF_ ANALYSISFORECAST_BGC_004_002 (Butenschön et al., 2016) models that have a horizontal resolution of 1/33° longitude × 1/74° latitude and 1/9° longitude × 1/15° latitude, respectively. The results were analyzed both through North Sea-scale mapping of the products, as well as through matching each time step of the FerryBox observational dataset to a corresponding time and location grid cell in the models.
Additional Data
We used atmospheric CO2 measurements from the Lutjewad, Netherlands observatory due to its proximity to our study area. The data are found in the ICOS Carbon Portal.7 We used the Level 2 release for fall 2019 investigations and the growing time series for fall 2020 ones (Chen and Scheeren, 2020, 2021).
We used barometric pressure, dew point temperature and 10-m wind speed from the ERA5 reanalysis product (Hersbach et al., 2018) available from the Copernicus Climate Data Store8 for specific areas and times of interest matching the FerryBox observations.
pCO2 Decomposition and Flux Calculations
The effect of changing the temperature of a seawater parcel on a known value of seawater pCO2 when the initial and observed temperatures are also known was calculated according to Takahashi et al. (1993) sensitivity factor as follows:
where SST is the surface seawater temperature. This equation allows differentiating between the thermal and non-thermal component of an observed pCO2 change. The thermal component can be calculated from the initial conditions and the observed change in temperature, while the non-thermal component is the difference between the observation and the result of the thermal calculation, added to the initial conditions for ease of plotting:
In order to obtain a measurement representative of the atmospheric offshore concentrations, we ran a 14-day moving minimum filter through the raw hourly atmospheric dry air mole fraction of carbon dioxide (xCO2) data (details in Supplementary Material). We converted the atmospheric xCO2 to pCO2 using the water vapor pressure formula of Alduchov and Eskridge (1996), alongside barometric pressure and dew point temperature. First, the saturated water vapor pressure (Pv, in bar) was estimated from the dew point:
where Tdp is the dew point temperature. The atmospheric partial pressure of CO2 (in μatm) was then calculated:
where Pb is the barometric pressure. The sea to air CO2 flux was then calculated using code available online9 —see Humphreys et al. (2018)—following the parameterization according to Wanninkhof (2014):
where k is the gas transfer velocity, α is the solubility of carbon dioxide, a function of sea surface temperature and salinity evaluated following Weiss (1974), and the “sw” and “air” indices represent the seawater and atmospheric terms, respectively. The gas transfer velocity depends on the square of the 10 m wind speed (U10) and on D, the dimensionless Schmidt number for carbon dioxide at the surface layer seawater temperature (Wanninkhof, 2014):
Results
Small-Scale Biogeochemical Variability
pCO2 is a key indicator both in terms of increasing CO2 levels in the atmosphere, as well as a variable which is affected by changes in physical and biological conditions in the water column. Therefore, it is used in this study as an indicator of water column variability. During the fall seasons investigated here, variability in the observed pCO2 allowed the identification of three 2–4 week-long periods with distinct biogeochemical characteristics (Figure 2). While the reason for choosing this temporal separation was the pattern in the pCO2 variability, additional FerryBox measurements help to further explain the biogeochemical differences. There are moderate to strong correlations between the measurements. For example, the Pearson correlation coefficients between pCO2 and dissolved oxygen saturation range between −0.35 and −0.61, while the correlation coefficients between pCO2 and pH range between −0.74 and −0.98, depending on the sub-period investigated. The synchronous changes identified by instruments with different measurement techniques serve as a quality assessment of our data. Correlation plots are available in the Supplementary Material.
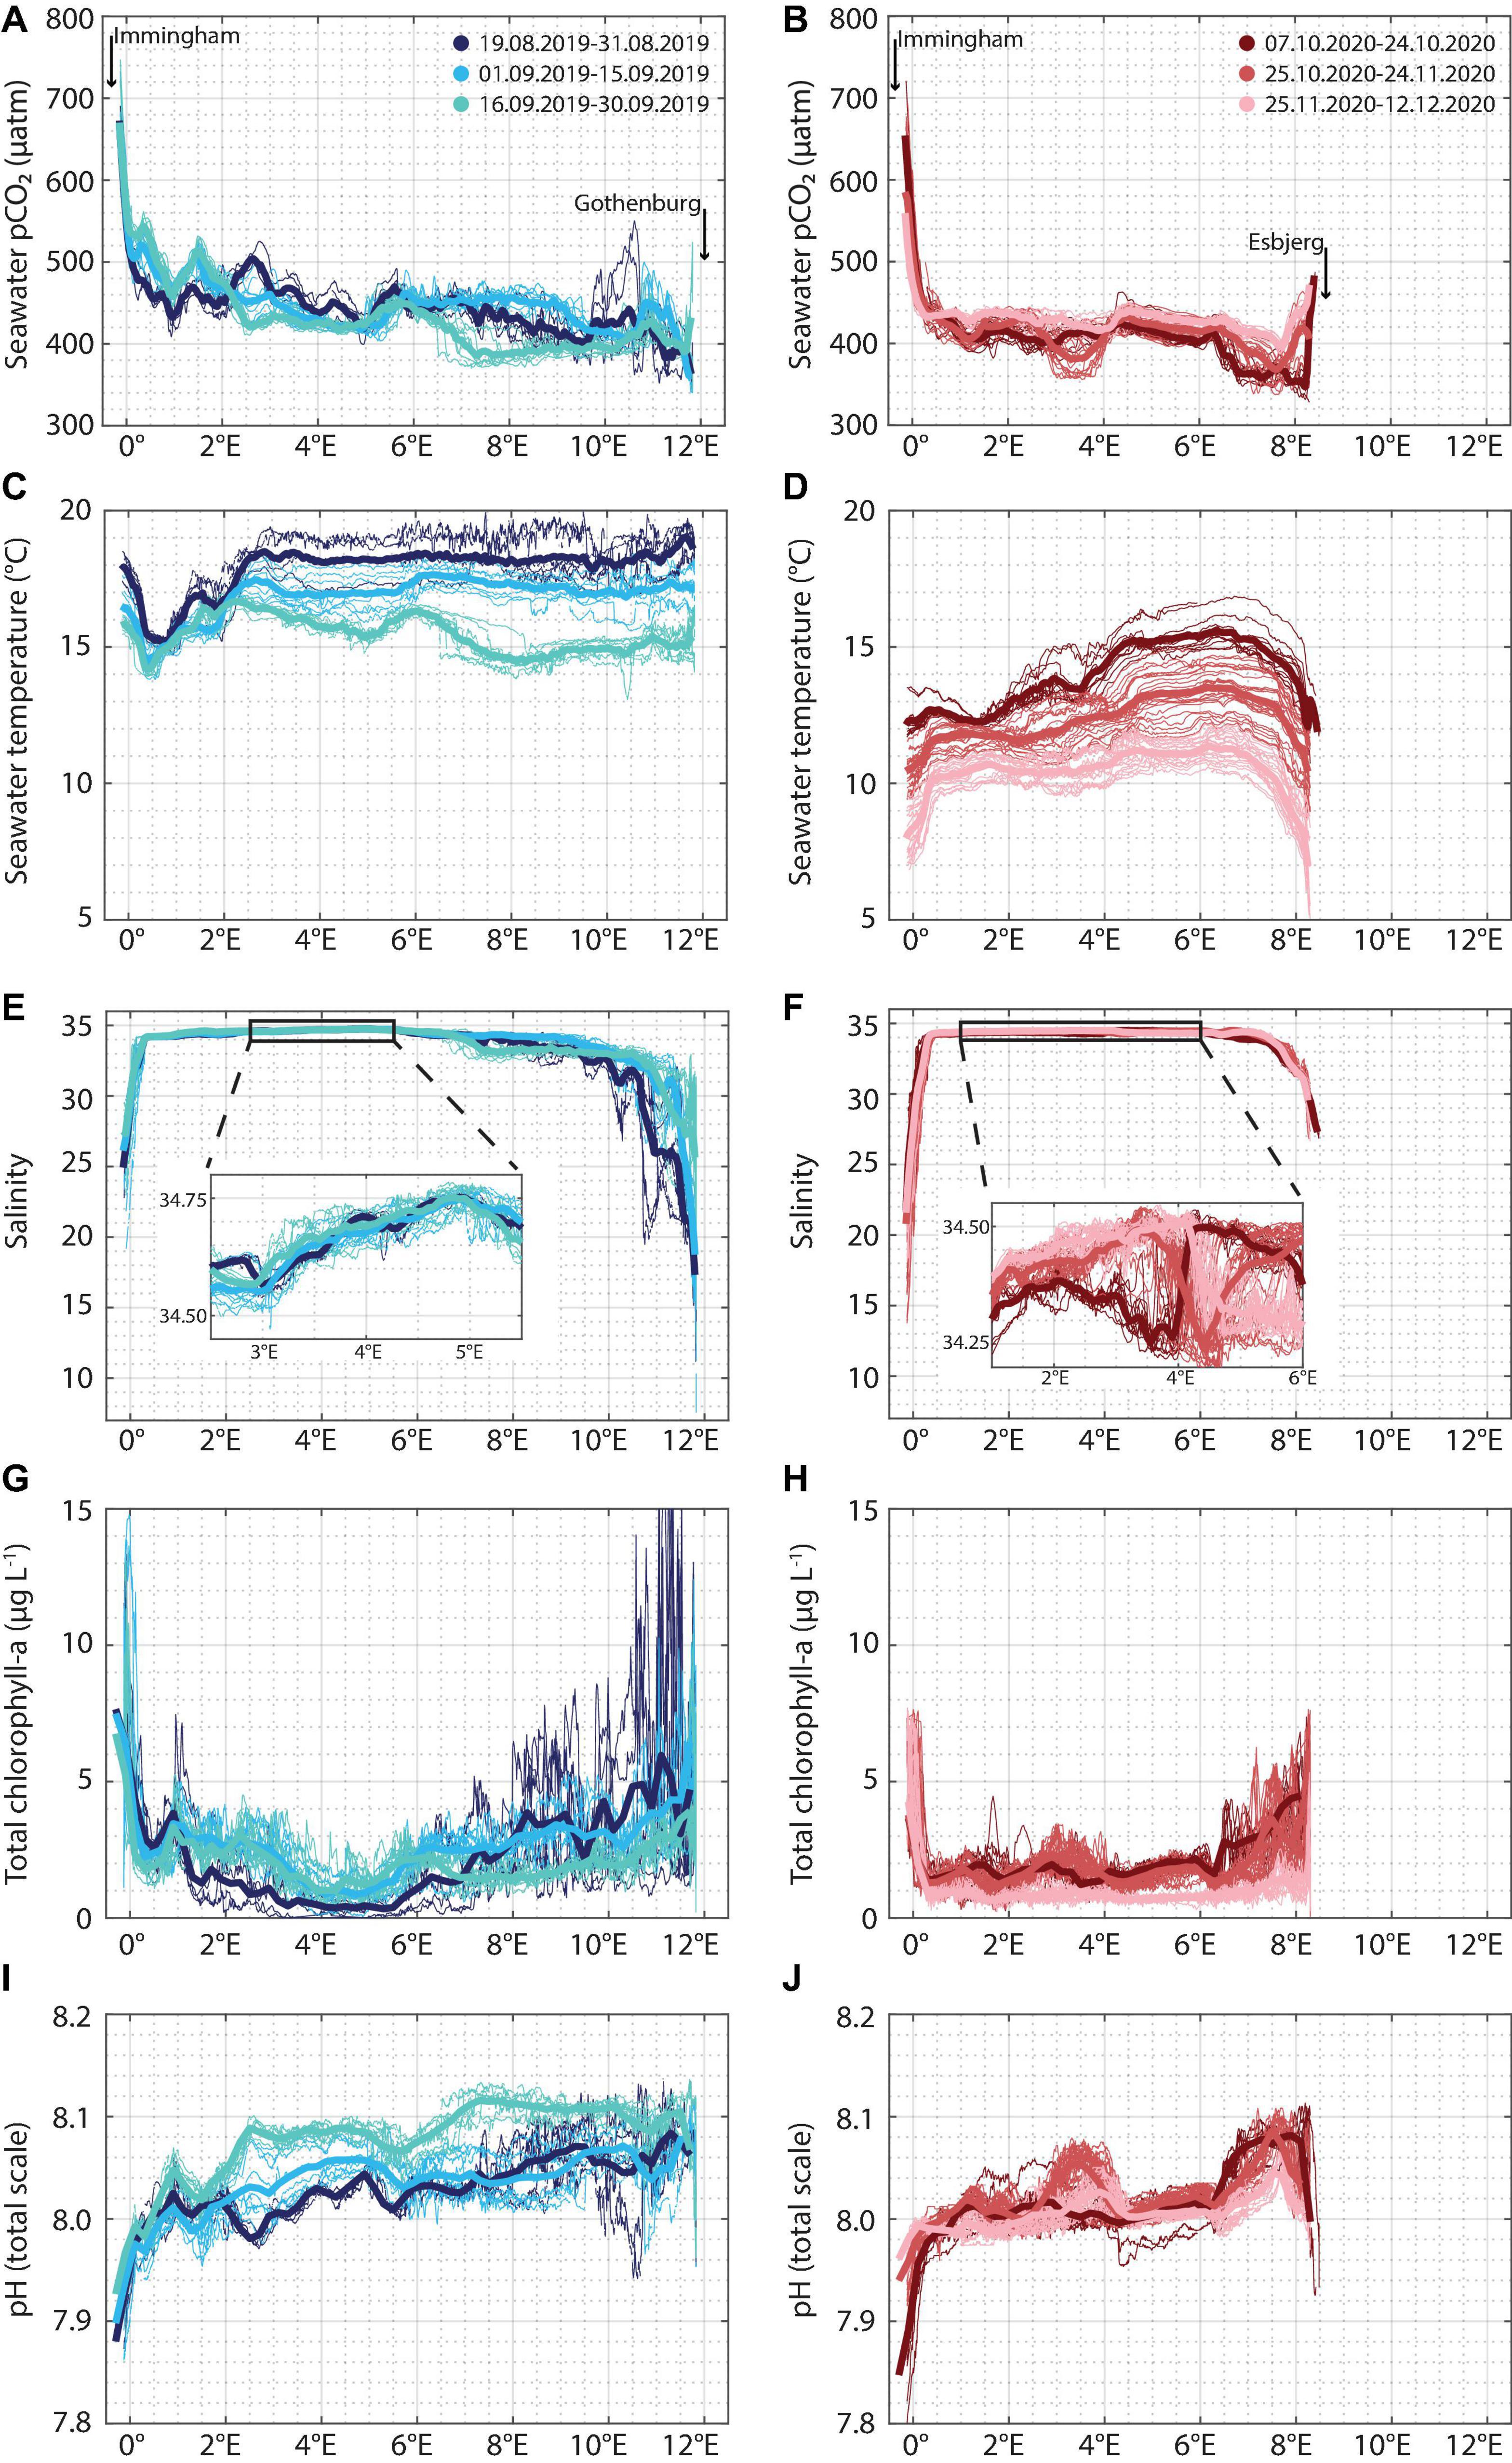
Figure 2. FerryBox variables [seawater pCO2 (A,B), sea surface temperature (C,D), sea surface salinity (E,F)—including a zoom-in, total chlorophyll-a concentration (G,H), and pH (I,J)] measured in fall 2019 (left column) and fall 2020 (right column) plotted against longitude. The color shades are used to separate the respective season into three sub-periods. Individual crossings are plotted as thin lines, and longitudinal averages for each sub-period are plotted as thick lines. The difference in the x-axis extent of the measurements is due to different ports in the east (Gothenburg, Sweden in 2019 and Esbjerg, Denmark in 2020, see Figure 1).
In fall 2019, pCO2 measurements (Figure 2A) can be split into three 2-week periods, guided by the nearly 100 μatm decrease which took place in the second half of September, between 6.5 and 9.5°E. Further variability was observed in the western part of the transect. Within less than 2 degrees longitude, between 0.5 and 2°E, the along-track pCO2 dropped and rose by nearly 100 μatm. These features were observed throughout August and September 2019, irrespective of sailing direction. The ship also consistently measured seawater pCO2 levels above 700 μatm near the port of Immingham, United Kingdom.
In fall 2020, pCO2 measurements (Figure 2B) can also be split into three distinct periods. Before the 25th of October, low pCO2 values (below 350 μatm) were observed near the eastern end of the transect. Between October 25 and November 24, low values (down to almost 350 μatm) were also recorded between 3 and 4°E, in the middle of the Central North Sea. The final period featured little variability along the ship track, with the exception of high values (occasionally > 700 μatm) recorded in the Humber estuary, also observed in 2019. In fall 2020, the eastern port was Esbjerg in Denmark, so the ship did not take any measurements in the Skagerrak Strait.
Sea surface temperature in the Central North Sea in 2019 featured an expected behavior, with crossings later in the fall measuring lower temperatures (Figure 2C). The final 2 weeks of measurements, however, identified an event east of 6.5°E, roughly 2°C colder than the expected cooling trend due to shorter days and shallower solar incidence angles later in the year. Furthermore, all the temperature measurements in the fall of 2019 identified differences of up to 4°C between the warm Humber estuary, the very cold region adjacent to the estuary (0.5°E, Figure 2C), and the warmer waters of the North Sea further away from the United Kingdom coast (1.5–3°E). The salinity profiles (Figure 2E) showed consistently high values (near 35) in the Central North Sea, with salinity rapidly dropping in the Humber estuary in the west, and near the northern Danish coast, the Skagerrak and Kattegat regions in the east. The low temperature event between 6.5 and 10 °E also featured low salinity (∼33 on average). Total chlorophyll-a concentrations (Figure 2G) were highest in the near-shore areas, while in the North Sea, west of the Skagerrak (1.5–8°E), they did not typically exceed 5 μg L–1. In the Skagerrak, chlorophyll-a concentrations decreased with time. The pH measurements (Figure 2I) were anti-correlated with the pCO2 pattern, as observed and modeled before (Gypens et al., 2011; Salt et al., 2013).
The along-track temperature measurements in 2020 (Figure 2D) did not show the same differences near the United Kingdom coast, in spite of covering the same region (Figure 1) and ending at the same western port, Immingham, United Kingdom. The eastern port of the transect was Esbjerg, DK, where the salinity (Figure 2F) was higher than the Baltic Sea-influenced Kattegat (Kristiansen and Aas, 2015). The chlorophyll-a concentrations were generally lower than in 2019 since measurements were taken later in the year, when days at these latitudes are shorter. An increase in the concentrations in the Central North Sea to over 3 μg L–1 was observed around 3 °E. Furthermore, high chlorophyll levels were observed near the Danish coast, east of 6.5°E. Especially in the first period of measurements, concentrations increased from around 3 μg L–1 120 km offshore to over 7 μg L–1 just outside of Esbjerg. Similarly to 2019, the pH measurements in 2020 (Figure 2J) were anti-correlated with pCO2, exemplified by the highest measurements coinciding with the two low pCO2 events.
Figures 3, 4 are Hovmöller diagrams simultaneously showing the spatial and temporal variability of the FerryBox variables for the two investigated fall seasons. They were produced in Ocean Data View 5 (Schlitzer, 2020), using DIVA interpolation with automatic x and y-scale lengths and automatically adjusting the color scale according to the median and non-linearity of the data. Contours were added to the pCO2 diagrams (Figures 3A, 4A) joining points of equal pCO2 in the interpolated product in steps of 50 μatm. These contours (white lines) were then kept as an overlay on top of all diagrams in Figures 3, 4 (Figures 3B–F, 4B–F, respectively) in order to show the synchronicity of biogeochemical changes.
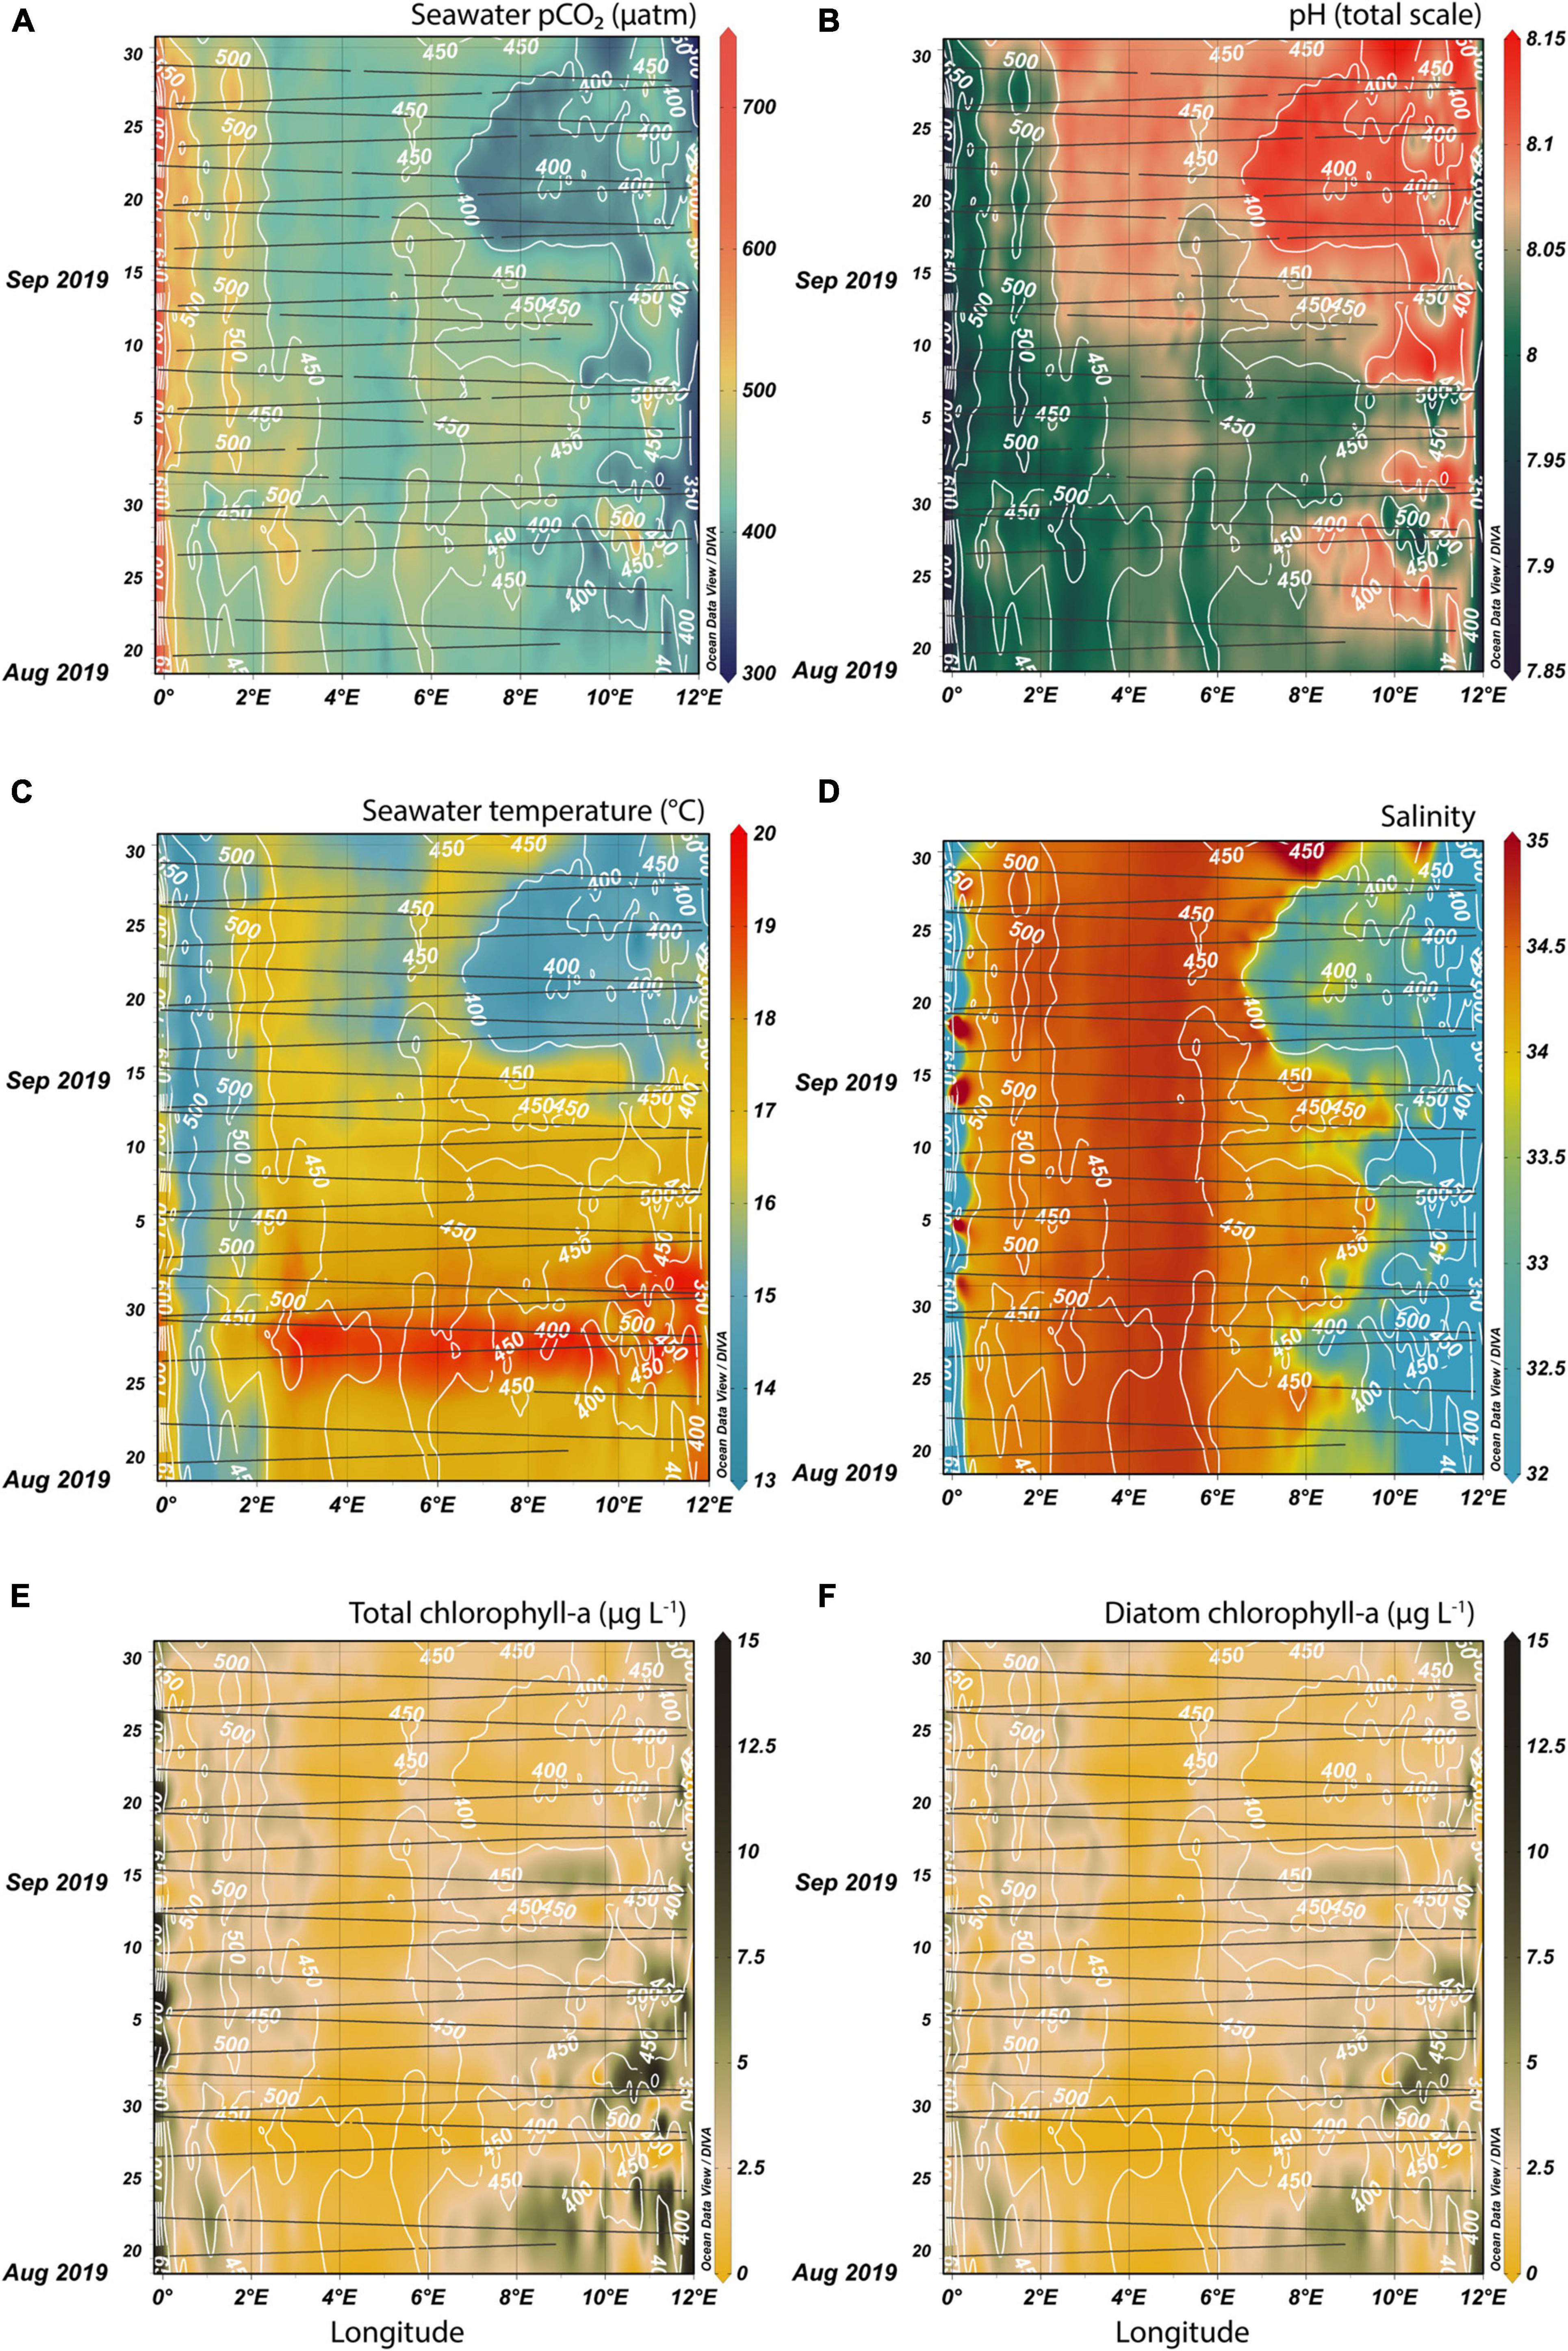
Figure 3. FerryBox measurements in fall 2019 between Immingham (west) and Gothenburg (east) interpolated over time and space. Surface seawater pCO2 (A), pH (B), temperature (C), salinity (D), total chlorophyll-a concentration (E), and diatom-specific chlorophyll-a concentration (F) are shown. The black lines indicate when and where respective measurements were available along the ship tracks. White pCO2 isolines based on (A) are drawn in all subplots, so that the pCO2 pattern is compared to other biogeochemical parameters.
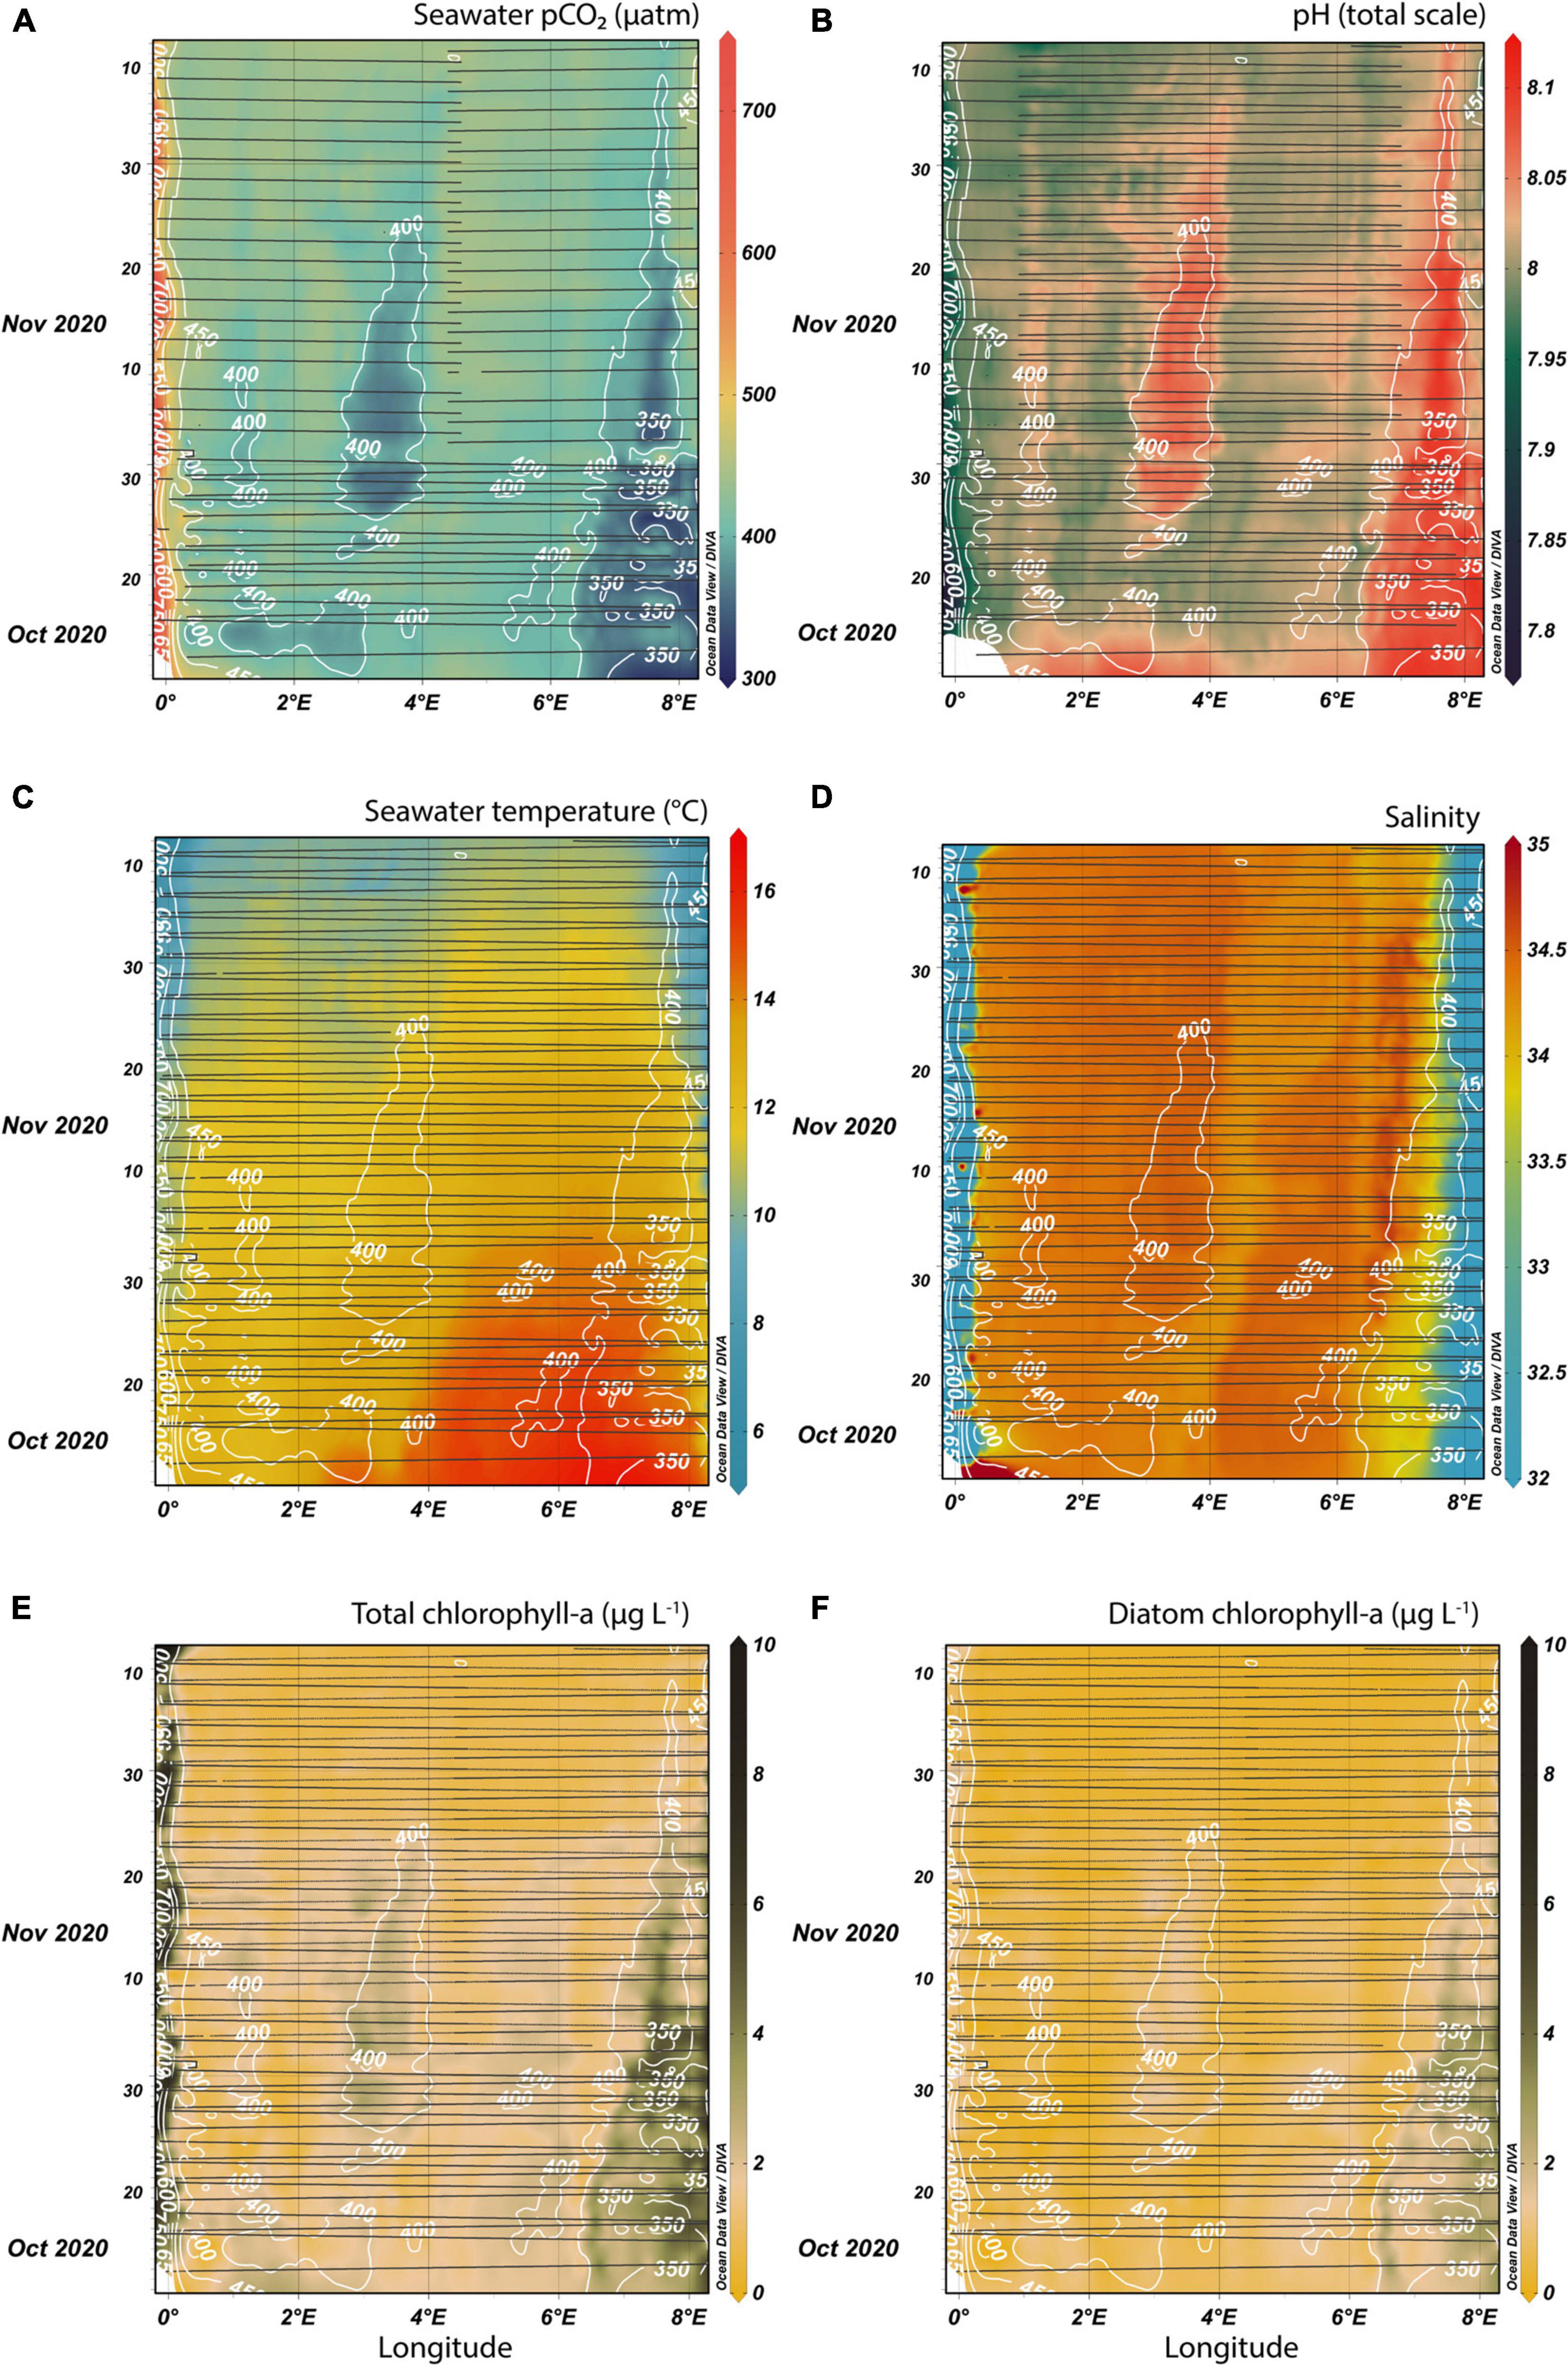
Figure 4. FerryBox measurements in fall 2020 between Immingham (west) and Esbjerg (east) interpolated over time and space. Surface seawater pCO2 (A), pH (B), temperature (C), salinity (D), total chlorophyll-a concentration (E), and diatom-specific chlorophyll-a concentration (F) are shown. The black lines indicate when and where respective measurements were available along the ship tracks. Notice the removal of the first half of each journey for seawater pCO2 data for later journeys. White pCO2 isolines based on (A) are drawn in all subplots, so that the pCO2 pattern is compared to the other biogeochemical parameters.
Close inverse variation between seawater pCO2 (Figure 3A) and pH (Figure 3B) can be observed. East of 6.5°E, pCO2 in the second half of September 2019, was lower than 400 μatm. The low pCO2 coincided with an area of persistent colder temperatures. This indicates a link between lower carbon dioxide values and a change in the water mass in September 2019. Another feature was a region at approximately 0.9°E, where pCO2 was consistently below 500 μatm. Adjacent to the 400 μatm pCO2 contour was a “band” of colder temperatures at 0.5°E (Figure 3C). This suggests that a more persistent feature near the United Kingdom coast (0.5–0.9°E) is causing colder temperatures and low carbon dioxide content in surface waters in early fall. Interestingly, the high temperatures of over 18.5°C in the Central North Sea (2–9.5°E) between the 26th and 29th August 2019 did not have a large impact on pCO2, especially in the eastern part of the transect. The correlation between temperature and pCO2 was stronger at lower temperatures. Similar to the temperature diagram, the 400 μatm contour also surrounded an anomalous area in the salinity diagram (Figure 3D). The chlorophyll-a concentrations (Figure 3E) were generally low outside the near-shore areas, with most measurements below 5 μg L–1. In the open North Sea, between 88 and 94% of the total chlorophyll-a fluorescence was assigned to diatom cells (Figure 3F).
The pCO2 values in fall 2020 were less variable, with most measurements between 400 and 450 μatm (Figure 4A). Two major low pCO2 events were identified with values below 400 μatm in the Central North Sea and near the Danish coast. In the Humber estuary, the largest pCO2 measurements were recorded during spring tides, when the difference between the sea level at low and high tide was at a maximum and potentially more mixing occurred. The pCO2 variability was anti-correlated to pH (Figure 4B). pH higher than 8.1 coincided with the two main low pCO2 events. Sea surface temperature (Figure 4C) had an expected seasonal cooling trend, but also a large temperature difference east and west of 4°E in October, with temperatures in the eastern half of the transect up to 4°C higher. The warm event did not appear to induce pCO2 changes. The interesting features in the salinity diagram (Figure 4D) were the low salinity “band” bordering the low pCO2 measurements in the Central North Sea (4–4.5°E) and the high salinity values bordering the low pCO2 in the Danish coastal North Sea (6.5–7°E). Chlorophyll-a concentrations (Figure 4E) were generally lower than in 2019, with three main regions with higher concentrations: near the Danish coast, the Central North Sea area around 3°E, and the estuarine-influenced region near the United Kingdom coast. The first two matched regions with low pCO2 measurements. An influence of the spring-neap tidal cycle at the Humber estuary outflow could be observed in the chlorophyll concentrations, similar to the pCO2 variability. The diatom-specific chlorophyll (Figure 4F) was dominant in the two non-estuarine regions with high total chlorophyll.
Thermal vs. Non-thermal Influence and Sea-Air Co2 Fluxes
The high spatial and temporal resolution sampling provided by the FerryBox-equipped line allowed the identification of anomalously low pCO2 events. We focus on two restricted regions (Figure 5A)—the northwestern Danish coast and the Central North Sea south of Dogger Bank—and decompose the pCO2 signal into its thermal and non-thermal components.
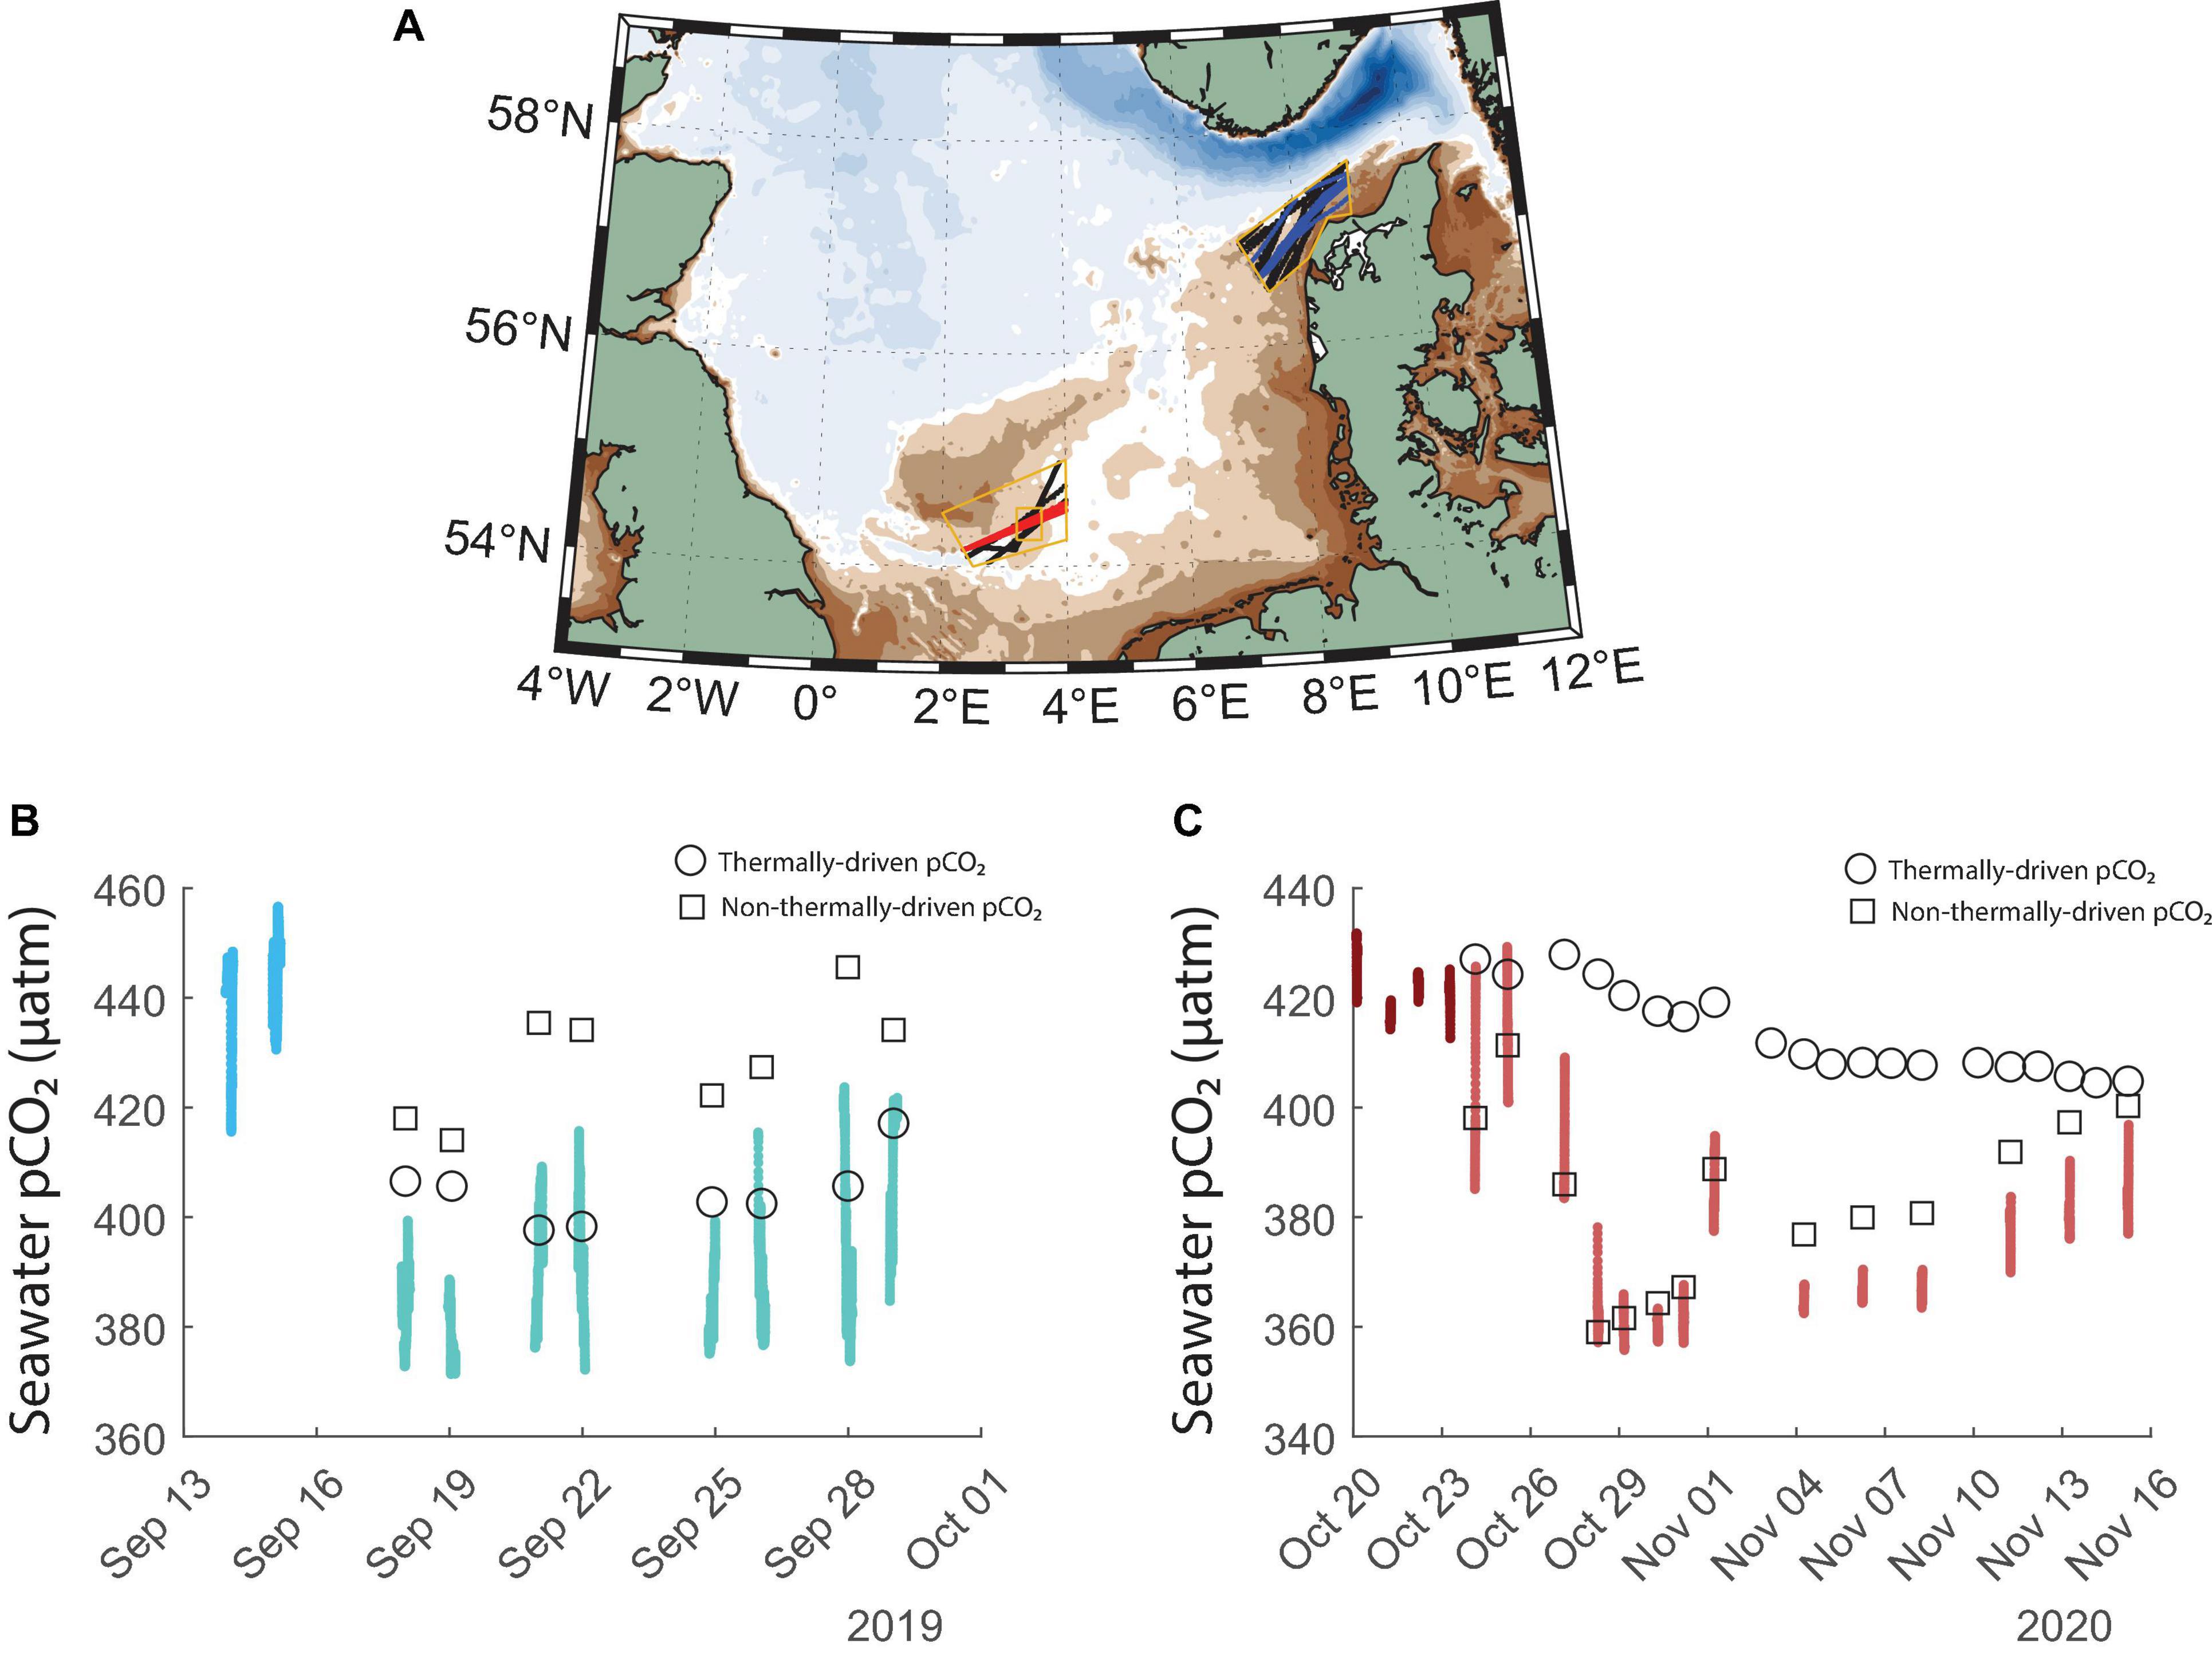
Figure 5. (A) Past tracks of Lysbris Seaways (black) in the same regions as the advectively-driven low pCO2 event in fall 2019 (blue) and the biologically driven low pCO2 event in fall 2020 (red) measured on the Magnolia Seaways tracks. (B) Measured pCO2 before and after the cold advective event initiated on the 15th of September 2019 (the two shades of blue, respectively) and expected average pCO2 values at the sampling times calculated using the pre-event pCO2 measurements and only applying the thermodynamic effect of decreasing water temperature, as well as the non-thermal component. (C) Measured pCO2 before and after the Central North Sea bloom initiated on the 25th of October 2020 (the two shades of red, respectively) and expected average pCO2 values at the sampling times calculated using the pre-event pCO2 measurements and only applying the thermodynamic effect of changing water temperature, as well as the non-thermal component. In subfigures (B,C), the black symbols denote what the pCO2 would have been at the time of the ship crossing if only thermal or non-thermal effects acted upon the water mass. The closeness to the observations indicates the dominant mechanism.
Considering the advective nature of the 2019 low pCO2 event, we determined the relative influence of thermodynamic changes on seawater pCO2. We used the average of the measurements of the last two crossings before the cold event to establish a baseline level for late-summer pCO2. Then, we calculated the expected pCO2 values solely due to the change in observed seawater temperature (black circles in Figure 5B) and found that the temperature change can explain almost all of the observed pCO2 change. It is likely that any additional decrease is due to the different chemical signatures of the advected waters. Past measurements have identified the Skagerrak as a relatively low pCO2 region (Macovei et al., 2021b). The cold water event lowered the average pCO2 by over 40 μatm, or >9% of the pre-event values, changing the CO2 flux regime from a net carbon source to the atmosphere in the beginning of September to a net carbon sink at the end of September 2019 (atmospheric pCO2 shown in Supplementary Figure 3). This also points to the dynamic nature of coastal regions, and the biogeochemical consequences of short-term changes in coastal ocean physics.
The 2020 low pCO2 measurements coincided with increases in chlorophyll-a concentration suggesting a biologically driven event. Indeed, the calculated thermal component of the pCO2 changes (black circles in Figure 5C) did not match the observations. Instead, the non-thermal component (black squares in Figure 5C, calculated as the difference between observations and the thermal component and added to the baseline), attributed to biological processes in the water column, explained most of the observed changes. The Magnolia Seaways observations presented in Figure 5C are extracted from the region defined by the smaller inner orange rectangle in Figure 5A, since the lowest pCO2 observations in late fall 2020 were measured at this location. The late fall phytoplankton bloom lowered seawater pCO2 by over 35 μatm, or > 8% of the pre-event values.
In fall 2019, before the cold advective event, the region north of the Danish coast (Figure 5A) was a CO2 source to the atmosphere, with a flux of 1.3 ± 0.6 mmol m–2 day–1. In mid-late September, during the event, the seawater pCO2 was in relative balance with the atmosphere, resulting in a flux of −0.04 ± 0.34 mmol m–2 day–1. During the 2020 fall bloom in the Central North Sea, the area south of Dogger Bank was a CO2 sink, with a flux of −0.6 ± 1.4 mmol m–2 day–1. The calculated uncertainties for these fluxes result from error propagation of the respective input term uncertainties. The gas transfer velocity and the carbon dioxide solubility have defined uncertainties, while the seawater and atmospheric pCO2 uncertainties were given by the standard deviation of the measurements in our time and space-restricted selections.
Discussion
Through the high-resolution FerryBox monitoring, we were able to observe small-scale and short-lived events that significantly lowered seawater pCO2. We will discuss the implications of these events, compare the effect to existing studies on North Sea pCO2 variability and carbon uptake, and evaluate if the observations were adequately predicted by regional models. In this study, we show how two consecutive fall seasons in a coastal shelf sea can differ in their biogeochemical characteristics and how each of these seasons featured mesoscale events captured through the high resolution FerryBox sampling. These low pCO2 anomalies occurred over 100–200 km spatially and 2–4 weeks temporally. Surface seawater pCO2 variability in the North Sea can be influenced by a variety of factors including changes in general circulation patterns, near-shore interactions, as well as inorganic nutrient changes.
Small-Scale Physical Processes Driving Co2 Uptake
The extensive low pCO2 event observed in the second half of September 2019 (Figure 6A) was strongly correlated with temperature and salinity changes (Figures 6B,C), without a simultaneous increase in chlorophyll-a. This suggests a physically driven phenomenon. In order to determine whether the advection of a new water mass was the explanation, we used Drift App simulations. The surface water circulation was investigated by choosing a point at 56.75°N, 7.50°E (location “A” in Figure 6D), on the main Immingham-Gothenburg route, centered at a location near the largest fluctuations between the first and second half of September. Fourteen-day backward simulations were applied to determine the origin of the water masses reaching this location. Several other locations along the ship route were tested with similar results. We found that the low-pCO2, low-temperature and low-salinity water mass observed in the second half of September had a contrasting origin to that from earlier in the month. While in the first half of September, the waters reaching location “A” were advected from the south-west, in the second half of September, the waters reaching this location had a 2-week backward trajectory origin just south of 58°N near the Norwegian coast, north of the investigated location.
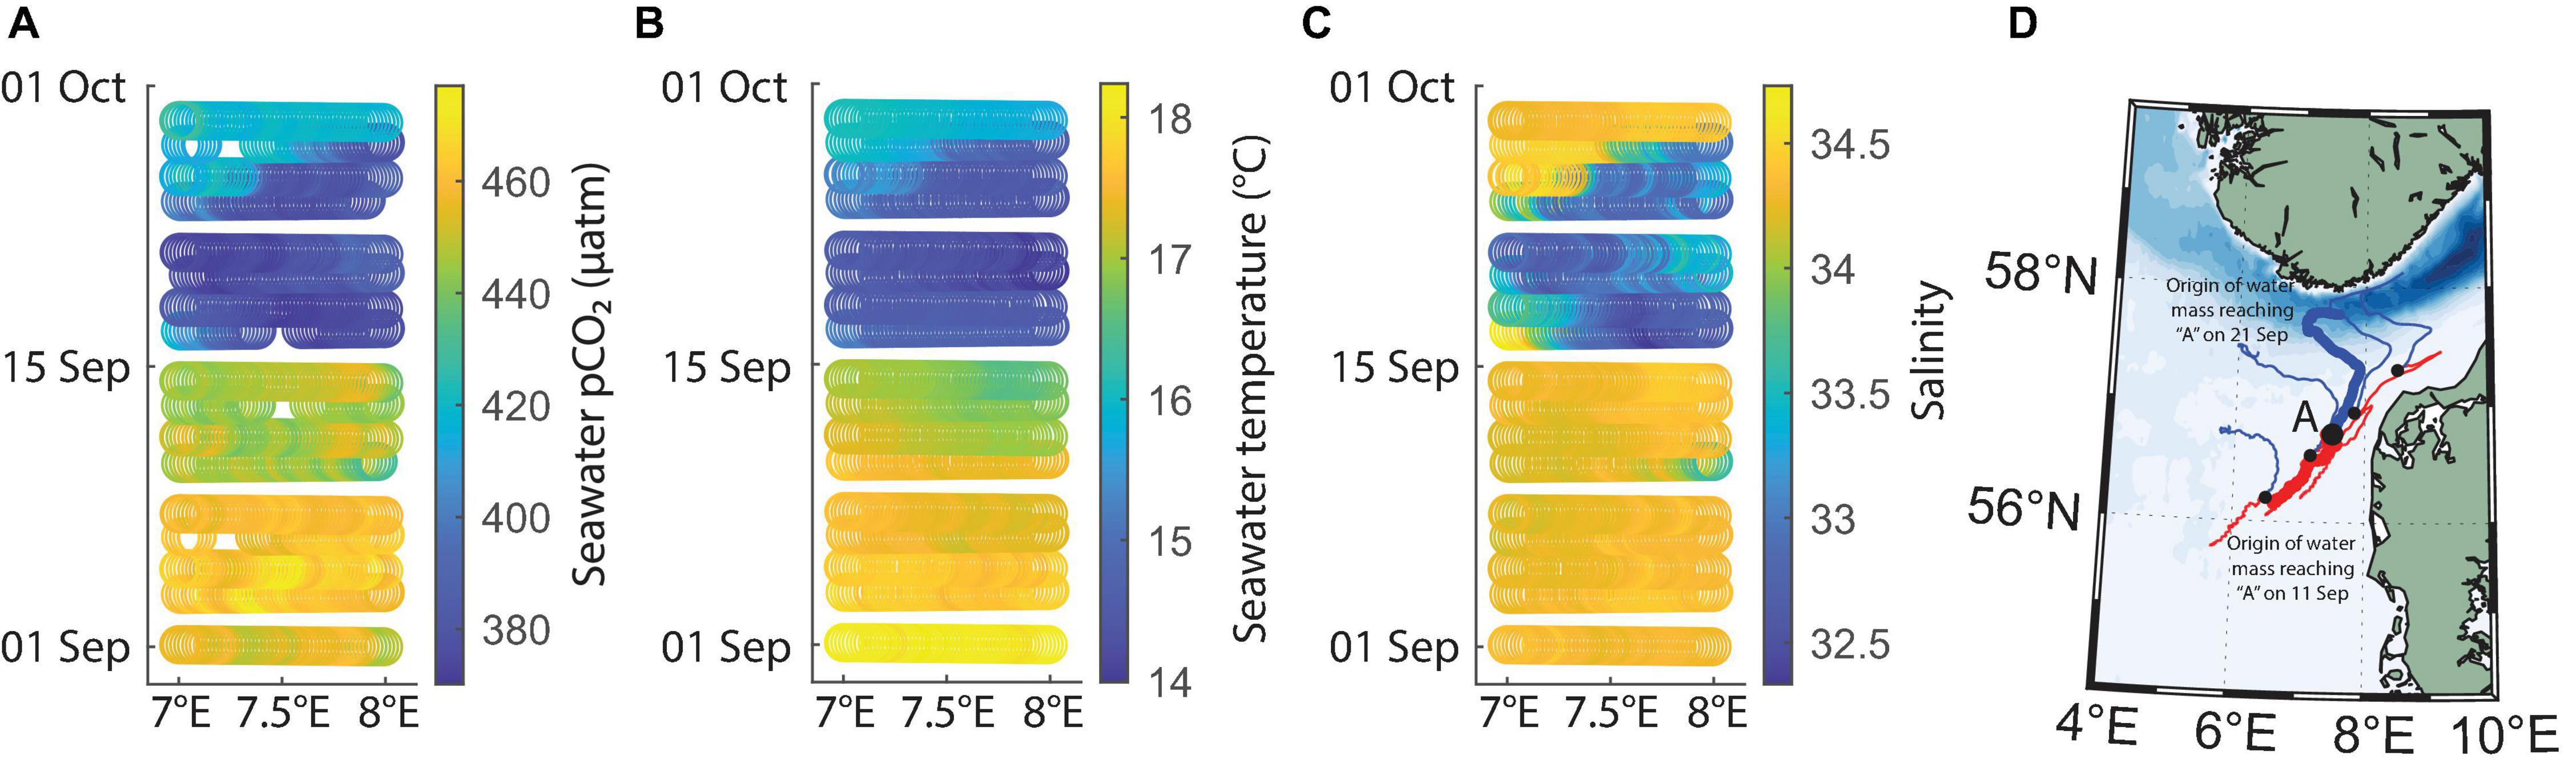
Figure 6. Seawater pCO2 (A), temperature (B) and salinity (C) shown as colored symbols plotted against longitude and time in a restricted area off the northwest coast of Denmark where anomalously low temperatures and salinities were recorded in the second half of September 2019. Subfigure (D) shows the simulated 2-week backward trajectories of water parcels reaching location “A” (thick lines), as well as four other similar locations (thin lines) on the 11th (red) and 21st (blue) of September, respectively.
The typical circulation of the North Sea in general and of the German Bight in particular is cyclonic. For a 1-week period starting on the 15th of September 2019, the German Bight circulation was consistently anticyclonic, associated with a sudden change in wind direction (not shown, circulation table available at bsh.de10). In the first half of September 2019, before the low pCO2 event, the origin of the water mass off the coast of Denmark was from the south-west. This is close to the expected south-to-north alongshore current drift (Holt and Proctor, 2008). In the second half of September 2019 however, the origin of the water arriving at location “A” (Figure 6D) was from the north, likely from the Skagerrak, confirming an anticyclonic circulation pattern. Therefore, at that time at location “A,” surface waters had a physical and biogeochemical signature characteristic of the low salinity outflow to the North Atlantic (low salinity, low temperature, Figure 6). During normal circulation patterns, the water export would be toward the North Atlantic along the Norwegian Coastal Current (Winther and Johannessen, 2006; Gröger et al., 2019). However, during the second half of September 2019, waters near the southern Norwegian coast returned to the Danish coast and produced the anomalous signal unveiled by the FerryBox sampling. Similar changes in the usual circulation patterns have been linked with strong winds in the region, but after the blocking event ended, the outflow was intensified (Gustafsson, 1997). Considering that the Norwegian Trench is the main carbon burial conduit in the North Sea, this change in circulation could have an effect on the usual carbon export from the North Sea (Hill et al., 2008; Luisetti et al., 2020). In September 2019, we found that this advective event lowered surface temperature, and prevented the region north of the Danish coast from releasing carbon to the atmosphere. Therefore, the anomalous event can in fact have a positive effect on the region’s carbon uptake capacity. Initially, a stronger air to sea flux occurs during the low seawater pCO2 period, followed by a strong export of the newly carbon-loaded waters to the North Atlantic, where they can be sequestered from the atmosphere for a longer term assuming the waters move to deeper, stratified layers.
Our study area fluctuates between being a carbon sink or source, depending on the spatial extent of the observations or the time period investigated. Flux calculations in coastal environments are known to be difficult (Meyer et al., 2018). As shown here, a 2-week event in a small region changed the CO2 saturation state and prevented carbon from being released into the atmosphere from an expected carbon source region. In the South and Central North Sea, the annual integrated sea-to-air carbon flux was −720 Gg C yr–1 in 2014 (marine carbon uptake) and 190 Gg C yr–1 in 2018 (marine carbon release) (Macovei et al., 2021a). Anomalous short-term biogeochemical events, like the ones described in this study, could influence the balance between regional carbon sinks and sources, especially if they become more frequent. In general, this study points toward the need to capture such events both through observational and modeling approaches. The caveats are that the coastal ocean was modeled to uptake a relatively small fraction of anthropogenic carbon (Bourgeois et al., 2016) and that such short-lived events may not allow sufficient time for air-sea gas exchange. However, since the main influence on the timescales of equilibration is given by wind speed and mixed layer depth (Jones et al., 2014), a fall setting in a shallow shelf sea, when winds are higher and mixing is stronger, should also contribute to a fast sea-air gas exchange rate.
Another example when low pCO2 was related to low seawater temperature occurred off the United Kingdom coast in fall 2019. The consistently lower pCO2 measurements around 0.9°E bordered a persistently low temperature water mass at around 0.5°E. This cold water mass was also modeled in BSHcmod throughout the fall 2019 sampling period (details in Supplementary Material). Intrusion of cold water from higher latitudes reaching the region offshore the Humber estuary is in fact a feature of the normal cyclonic circulation of the North Sea (Winther and Johannessen, 2006; Holt and Proctor, 2008). For example, the Southern North Sea is supplied with nutrients through the East Anglian plume (Weston et al., 2004). An additional influx of nutrients from the North Atlantic brought together with the cold water plume could explain our observations of matching peaks and troughs at 0.9°E in total chlorophyll-a and pCO2, respectively (Figures 2A,G). In 2020, the anomalously low temperature signal off the United Kingdom coast was absent in spite of measurements being taken on the same transect line west of 2°E in both years. However, our 2020 measurements happened later in the year compared to the 2019 ones, so the signal of a low sea surface temperature water mass was harder to observe.
Small-Scale Biological Processes Driving CO2 Uptake and How This Compares to Past Observations
The late fall 2020 blooms we observed suggest that, despite the low light availability in October-November, this season may be important for carbon drawdown in the North Sea. This becomes particularly important for a region where the main period of biologically driven CO2 undersaturation is the spring season (Hartman et al., 2019), and for which the summer and fall seasons are considered times of carbon release. In the first period of fall 2020, high chlorophyll-a concentrations near the Danish coast matched past observations in the Southern North Sea where phytoplankton blooms are initiated in nearshore waters and propagate offshore (Gypens et al., 2011). In the second period of observations, however, a phytoplankton bloom identified in the Central North Sea persisted over 4 weeks, lowered pCO2 and increased pH, and reached chlorophyll concentrations of over 3 μg L–1 (Figures 2H, 4E), similar to levels in early fall 2019. Despite the late fall occurrence and light limitations, this bloom significantly affected dissolved and particulate carbon in the region, bringing up the question whether such events happen in this region frequently, and if so, whether late fall blooms may have a larger influence on carbon dynamics than previously thought.
To compare these events with the long-term trend, we used results collected between 2013 and 2018 on another SOO equipped with a FerryBox, Lysbris Seaways. Quality controlled pCO2 data from this ship (Macovei et al., 2021a) are also available from the Pangaea repository (see text footnote 2). We selected measurements between 2013 and 2018 in the same two regions as the events (Figure 5A) and from the same time intervals—between the August 15 and September 30 (matching the 2019 measurements) and between October 25 and November 24 (matching the 2020 bloom), respectively. The average seawater pCO2 measured before the 2019 cold event was higher than predicted from the long-term trend, while the average pCO2 during the cold event was lower than predicted (Figure 7A). This could indicate that similar events might be common in this region and can help regulate the seasonal pCO2 averages. The pCO2 drawdown during the 2020 late fall bloom lowered the seawater levels to values similar to those observed by the FerryBox installed on Lysbris Seaways in 2015 in an analogous time of the year and area (Figure 7B). The identification of such a late fall bloom is particularly relevant since CO2 fluxes are stronger at this time of the year, and since satellite chlorophyll products typically do not cover the latitudes of our observations so late in the year (Ocean Productivity, 2021). In both regions in Figure 5, the long-term trends of increasing surface water pCO2 are higher than the atmospheric CO2 trend (Macovei et al., 2021a). The identification of these relatively short-lived events, which have such a large effect on the North Sea biogeochemistry, reinforces the idea that coastal and shelf seas are highly dynamic environments. Consequently, high-resolution observations are necessary to quantify biogeochemical changes induced by such events so that their importance on the average behavior of the region is properly assessed. Using the predicted trend from past measurements in the same region and time of year as the late fall bloom, the flux should have been strongly positive at 2.7 ± 2.1 mmol m–2 day–1. Both of the calculated (−0.6 ± 1.4 mmol m–2 day–1) and predicted fluxes are within the estimated range for the North Sea (Meyer et al., 2018; Becker et al., 2021). The fall season usually features strong fluxes due to higher wind speeds, including during storms, so the under- or oversaturated seawater state makes a large difference to annual budgets (Thomas et al., 2004).
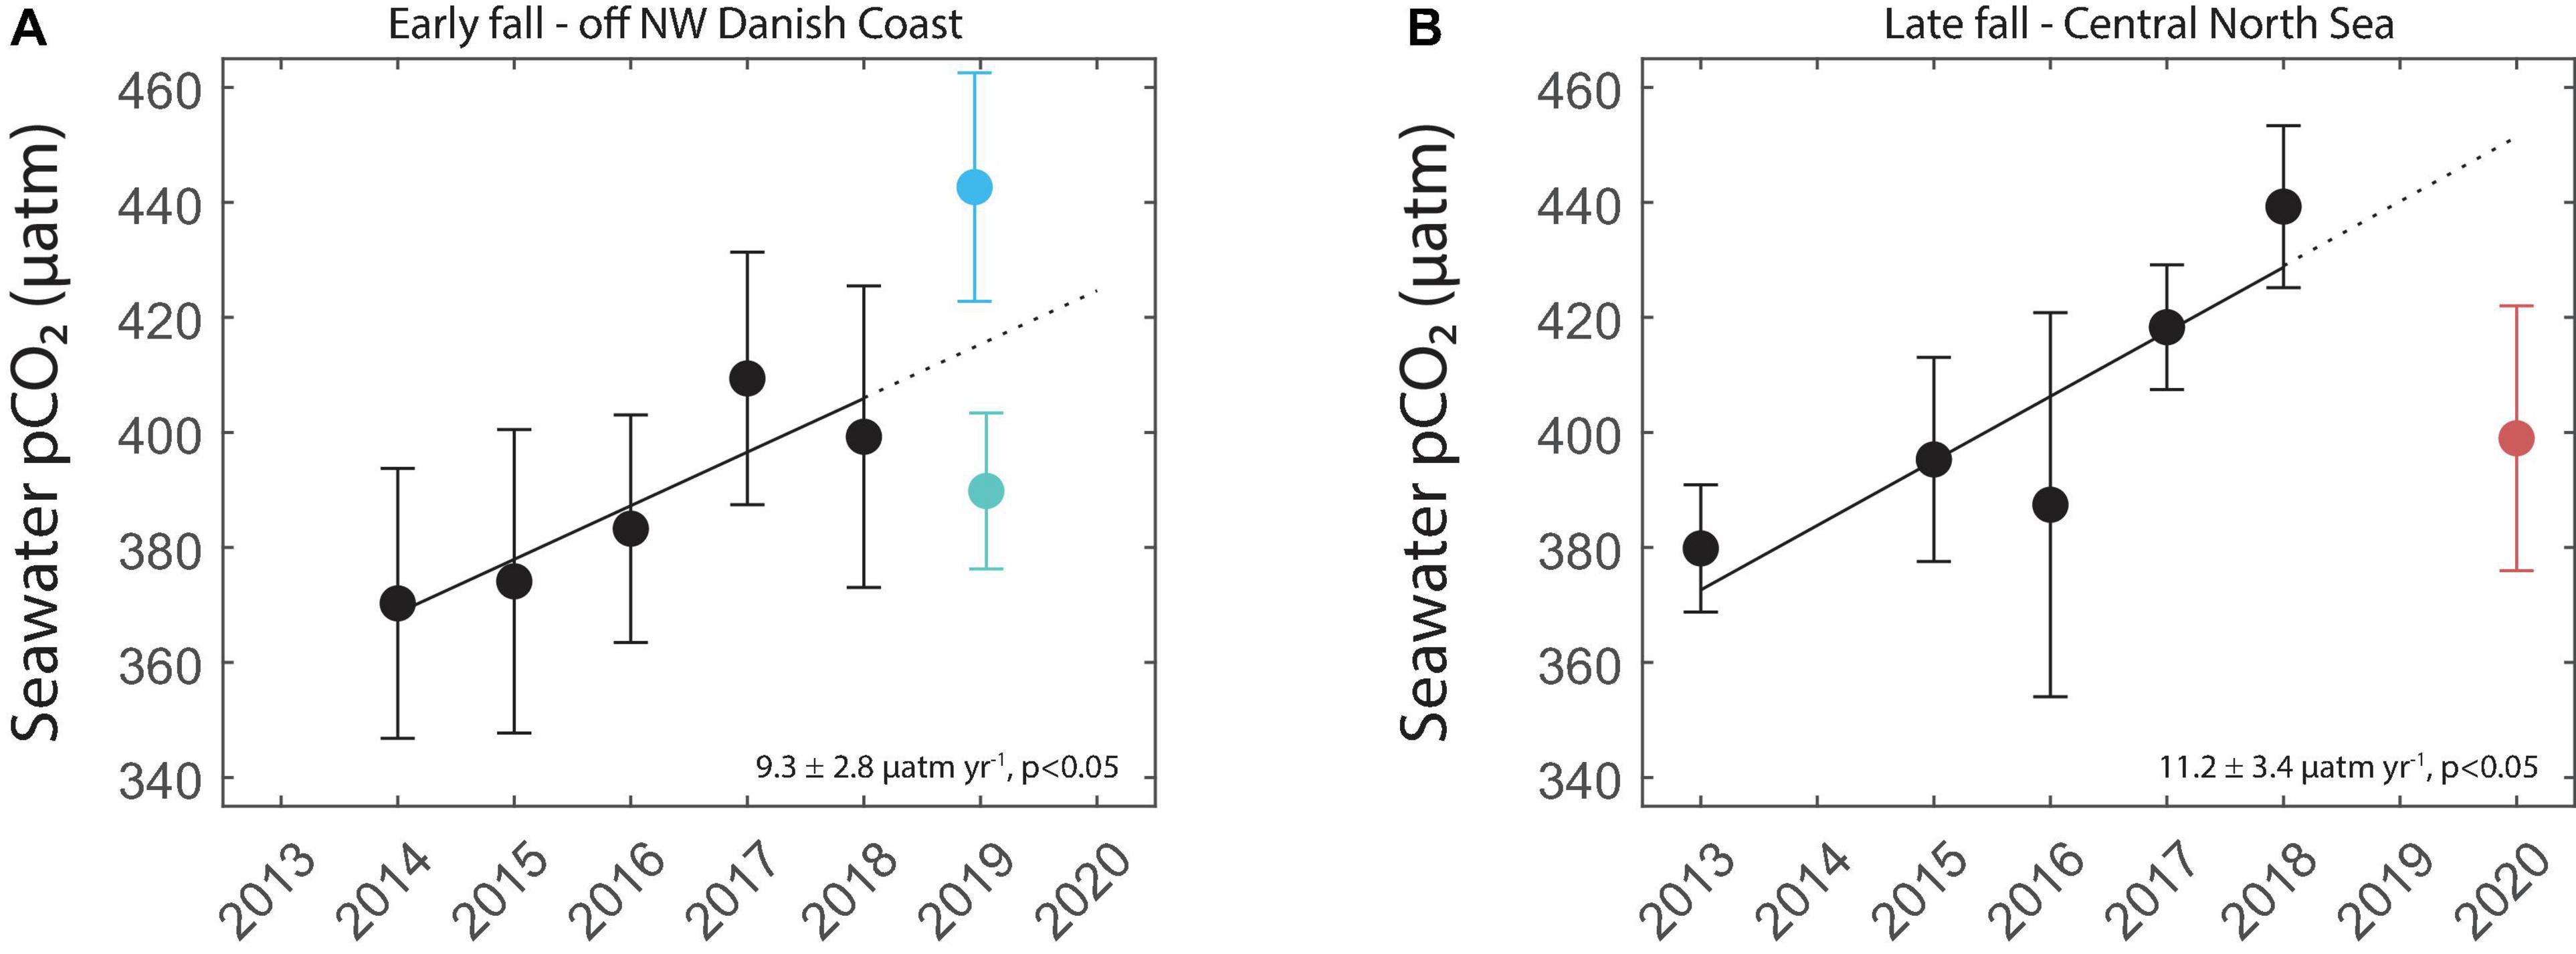
Figure 7. (A) Time and space equivalent pCO2 averages ± 1 standard deviation measured by Lysbris Seaways off the coast of Denmark in previous years with a best-fit linear trendline (black solid), prediction (black dotted), and the pre- and post-advective event averages ± 1 standard deviation measured by Magnolia Seaways in the same region in fall 2019. (B) Time and space equivalent pCO2 averages ± 1 standard deviation measured by Lysbris Seaways in the Central North Sea in previous years with a best-fit linear trendline (black solid), prediction (black dotted) and the average ± 1 standard deviation pCO2 measured by Magnolia Seaways in the same region during the fall 2020 phytoplankton bloom. The regions for data selection are the same as in Figure 5A.
Approximating the surface area of the two restricted regions at 6,600 and 8,600 km2, respectively, and including the large flux uncertainties, we were able to estimate the effect on the carbon budget in these regions. The 15-day advectively-driven low pCO2 event in 2019 prevented up to 2.8 Gg of carbon from being released into the atmosphere. The 31-day biologically driven pCO2 uptake event during the late fall 2020 bloom absorbed up to 21.8 extra Gg carbon from the atmosphere compared to the long term trend prediction. We performed the same calculations assuming a 0.4°C warming of the seawater inside the pipes of the FerryBox, potentially causing a slight overestimation of our measurements. The calculated maximum prevented and absorbed amounts of carbon for the 2019 and 2020 events, respectively, were 3.1 and 23.1 Gg—values which do not change the interpretation of our findings in the context of the large uncertainties involved in these flux calculations.
Kitidis et al. (2019) estimated an atmospheric carbon uptake in 2015 over the entire Northwest European Shelf of 23,000 Gg C yr–1 by averaging their observations and other literature estimations (Frankignoulle and Borges, 2001; Thomas et al., 2005; Borges et al., 2006; Laruelle et al., 2014). Compared to this value, the relative influence of our events seems small, but most of the atmospheric carbon uptake in the European Shelf occurs in the Northern North Sea and the Celtic Sea, which are outside the area of observations for this study. The location of our measurements lies approximately at the fall season boundary between the Northern North Sea, a carbon sink, and the Southern North Sea, a carbon source—see Figure 1 from Kitidis et al. (2019). Furthermore, here we show an integrated carbon exchange value for the short duration of the identified events and over two small areas, rather than upscaling over a whole year and the entire 1.06 × 10¹² m2 surface of the Northwest European Shelf. Downscaling the Kitidis et al. (2019) estimation would result in a mean flux of 4.95 mmol m–2 day–1, stronger than what we calculated during the low pCO2 events in our study. However, the seawater pCO2 in the North Sea has increased at a rate exceeding the atmospheric rate since 2015 (Macovei et al., 2021a). In addition, this study highlights the importance of late fall blooms, which was a surprising finding considering the limited light availability during this time of year.
Evaluation of Model Results
In 2020, the low pCO2 events coincided with slightly increased chlorophyll-a concentrations in the open North Sea and therefore were likely driven by late fall blooms. This was substantiated by results in Figure 5C, where most of the pCO2 decrease during this period could be attributed to the non-thermal component, i.e., biological CO2 drawdown. What led to the chlorophyll increase so late in the year? Past observations in the Northwestern European Shelf showed that fall phytoplankton blooms were supported by increases in surface nitrate concentrations (Wihsgott et al., 2019). Since inorganic nutrients are not currently measured on board our ships, we used the output from a Biogeochemical Northwest European Shelf model. The model predicts surface seawater temperature in fall 2020 well—Figure 8A is nearly identical to Figure 4C. The model also does a good job of predicting seawater pCO2, except in the region influenced by the Humber estuary (Figure 8B). However, the model is not able to reproduce the chlorophyll observations, both in terms of distribution and scale (Figure 8C). Modeled nitrate and phosphate concentrations were highest near the coasts (Figures 8D,E), suggesting a land origin. Both nitrate and phosphate were higher in the eastern Central North Sea basin, which did not match with the location of the Central North Sea fall 2020 bloom occurring west of 4°E. While the individual nutrient concentrations did not explain the observed patterns, the ratio of nitrate to phosphate revealed a remarkable match between the highest N:P and the two main phytoplankton blooms (Figure 8F). This could be a result of the influence of primary production and nutrient drawdown. If the model assumes that, during times of high primary production, phosphate is consumed but nitrate is left over due to the stoichiometry of this uptake, the resulting N:P ratio could increase further. On the other hand, past observations in the open North Sea around the location of the Central North Sea bloom found a N:P ratio below 16 (Burson et al., 2016), and far below what the Copernicus model predicted. Furthermore, the absolute concentrations from the model output are larger than those modeled for the late fall months by Kerimoglu et al. (2018)’s coupled physical-biogeochemical model of the German Bight and southeastern North Sea, as well as from the measurements Kerimoglu et al. (2018) use. Therefore, most likely this model overestimates surface nutrient concentrations.
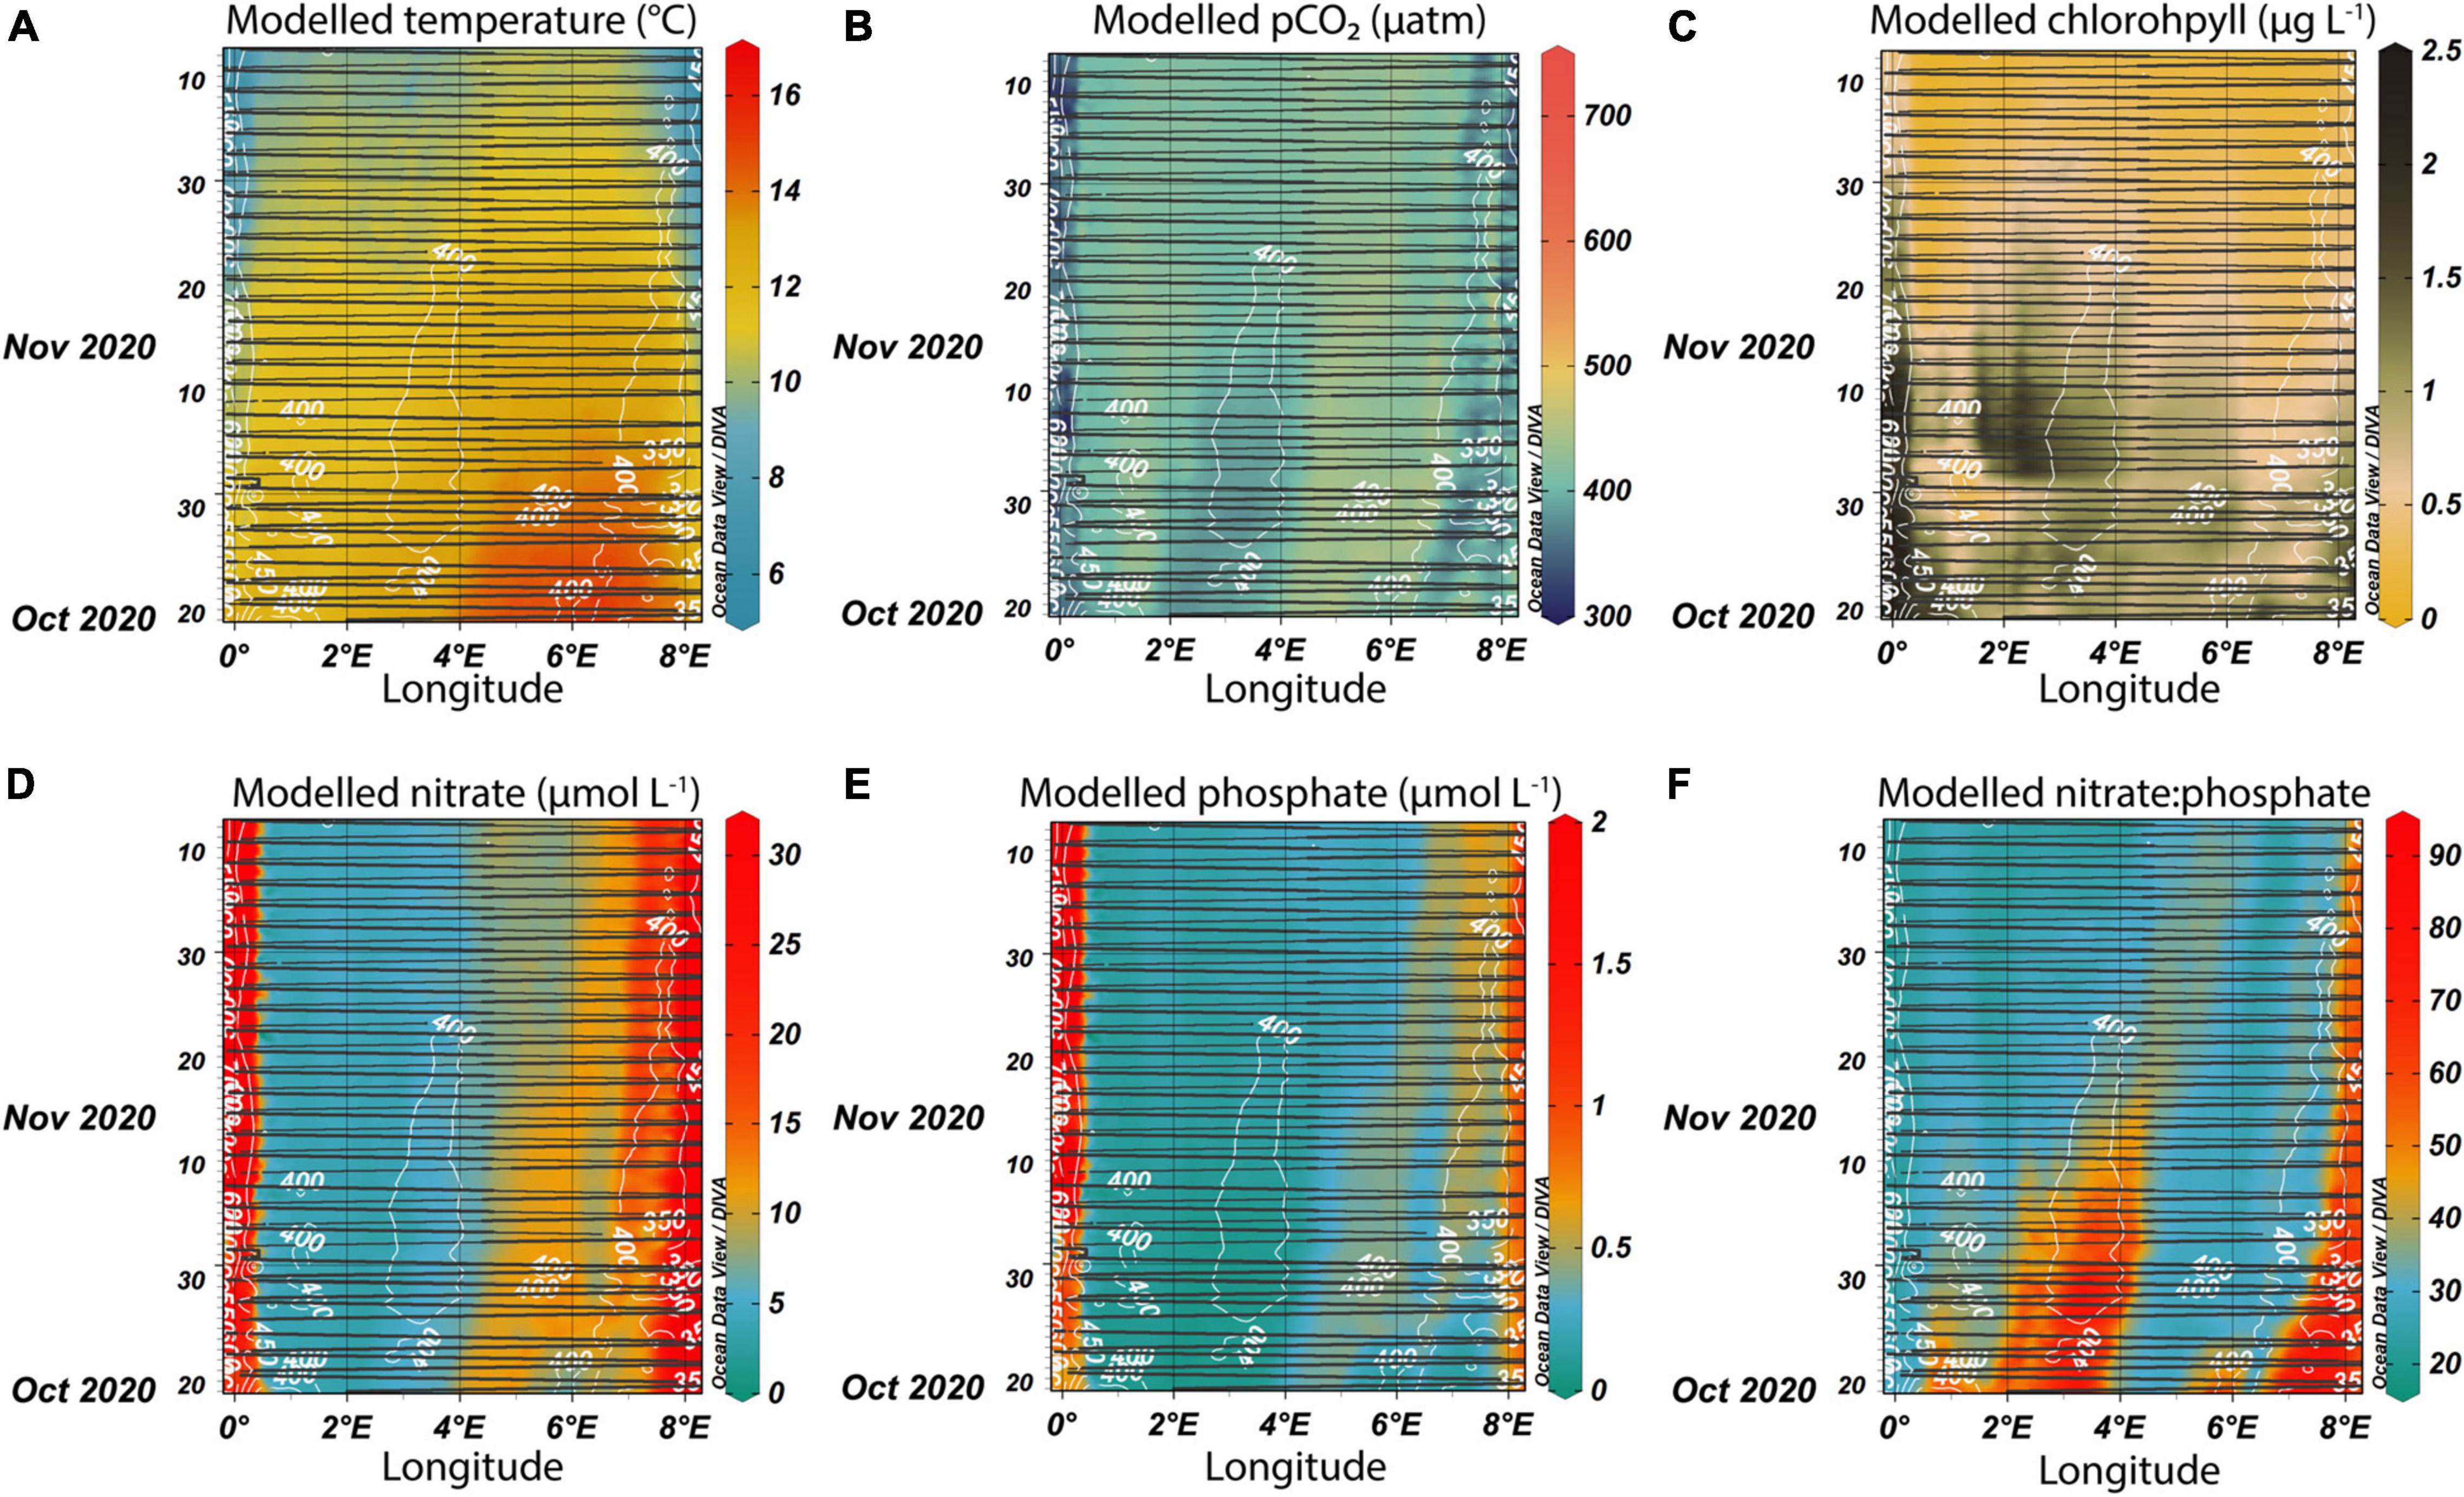
Figure 8. Modeled surface temperature (A), pCO2 (B), chlorophyll-a (C), dissolved nitrate (D), and phosphate (E) concentrations, as well as the N:P ratio (F). The model outputs were “sampled” along the ship tracks of Magnolia Seaways in fall 2020 (shown in black lines). The upper limits of the color bars are restricted to better show variability at the lower end. The white contours show the measured pCO2 values (equivalent to Figure 4A).
In this study, we find that despite the short days during this period, late fall blooms did occur in 2020, and their magnitude, spatial extent, and impact on surface water North Sea biogeochemistry were identified by our SOO observations. In this region, phytoplankton blooms usually consume nitrate (Weston et al., 2004), but nutrient addition experiments where both nitrate and phosphate were added resulted in a higher biomass (Mustaffa et al., 2020). The bloom in the Central North Sea was perhaps a result of mixing of previously stratified waters south of the Dogger Bank, with resulting nutrient inputs to surface waters. The bloom took place in high salinity waters and was bordered on the eastern edge by slightly lower salinity waters (Figures 4E,D). South of the Dogger Bank, a region with depths of more than 50 m (Figure 1, at 54°N; 2°E) may help to funnel deeper, nutrient enriched water to the surface. Interestingly, the region between 4 and 6°E, where the Copernicus model predicted higher inorganic nutrient concentrations (Figures 8D,E), featured lower chlorophyll-a concentrations than east of 4°E.
Wider Implications
Despite their relatively small size and short time scales, the events described in this study had effects that are relevant on much larger scales. For example, we know that the pCO2 dynamics in the Southern North Sea are controlled by biological activity (Schiettecatte et al., 2007) and that model runs without biology resulted in the North Sea as a whole to act as a source for atmospheric CO2 (Kühn et al., 2010; Lorkowski et al., 2012). However, biological influence has been mostly evaluated during the spring productive season. The effect of late fall blooms might be underestimated and here we show that such blooms can produce strong surface water CO2 undersaturation.
Recent global carbon cycle assessments define the sources of uncertainty in quantifying the ocean carbon sink as variability in the circulation, internal variability and anthropogenic changes in nutrient supply (Friedlingstein et al., 2020). The shortest time scale of these processes is the annual one, but in a coastal setting, due to the large gradients and intrinsic small-scale dynamics, carbon budgeting uncertainties are further complicated. This study suggests that short-lived features which occur on relatively small scales have potentially large scale impacts and thus, an aggregation of these events may impact the mean state of the system. We show here that model predictions are better for physical variables, which are better constrained in data assimilation schemes because of the remote observation possibilities. On the other hand, the scarcity of biogeochemical observations may hinder the efficacy of operational models. Reaching a better agreement between observations and operational models is crucial for their use in climate change analysis and prediction. Climate models are predicting that high latitudes will be more sensitive to changes in the future because their buffering capacity will decrease faster (Gallego et al., 2020). This could give an increased importance to small-scale events such as the ones identified in this study. The Southern North Sea is an area of coastal alkalinity generation (Burt et al., 2016; Voynova et al., 2019), and this extra alkalinity increases the CO2 buffering capacity (Thomas et al., 2009). While these are natural negative feedback mechanisms, the prevailing direction of biogeochemical change is toward increasing CO2 in surface waters (Macovei et al., 2021a). Only through sustained high-resolution observations of coastal regions and well-tuned models will we have the tools necessary for accurate future predictions in these highly dynamic environments and, in particular, for quantifying the role of mesoscale, short-lived events.
Conclusion
The FerryBox instrument array installed on the Magnolia Seaways provided high-resolution measurements in the dynamic and biogeochemically important region of the Central North Sea, resolving mesoscale changes in surface biogeochemistry in response to biological and water mass changes. Here we show results from two consecutive fall seasons that featured mesoscale variabilities with different origins, but with similarly large effects on surface water biogeochemistry and carbon uptake capacity. In fall 2019, an advectively-driven low pCO2 event was identified off the Danish coast, while in fall 2020, the main drivers of low pCO2 in the Central and Eastern North Sea were phytoplankton blooms. These events lowered surface seawater pCO2 and increased the atmospheric CO2 absorption capacity, temporarily offsetting the general long-term trend of pCO2 increase in this area. Despite being small in terms of spatial and temporal scales, they had a significant effect on the biogeochemistry of the North Sea and on the carbon sink or source status of two smaller subregions. We demonstrate the value of sustained biogeochemical observations in dynamic shelf sea environments and advocate for the consideration of these episodic events in regional carbon budget assessments and operational model forecasts.
Data Availability Statement
The datasets presented in this study can be found in online repositories. The datasets produced through the FerryBox monitoring and analyzed for this study are available from the European FerryBox Database (https://ferrydata.hzg.de/). The pCO2 measurements are also available from the Pangaea repository (https://doi.org/10.1594/PANGAEA.930383). Ancillary datasets are freely available online with access references included in the manuscript text. Furthermore, any ancillary data processed specifically for our region or time period of interest used in the study will be made available by the authors on request without undue reservation.
Author Contributions
YV and VM contributed to the conception and design of the study. UC provided expertise on the DriftApp simulations and BSHcmod outputs. PC provided expertise on the use and processing of the output of the Copernicus models. VM wrote the first draft of the manuscript. All authors contributed significantly to the final version.
Funding
FerryBox activities were partly supported by the EU project JERICO-NEXT (Grant agreement 654410), as well as funding from the Helmholtz Association.
Conflict of Interest
The authors declare that the research was conducted in the absence of any commercial or financial relationships that could be construed as a potential conflict of interest.
Publisher’s Note
All claims expressed in this article are solely those of the authors and do not necessarily represent those of their affiliated organizations, or those of the publisher, the editors and the reviewers. Any product that may be evaluated in this article, or claim that may be made by its manufacturer, is not guaranteed or endorsed by the publisher.
Acknowledgments
We are grateful to two reviewers whose comments improved the quality of the manuscript. We would like to thank the DFDS Seaways shipping company, as well as the captains, officers and crews of Magnolia Seaways and Lysbris Seaways. We are deeply grateful to the FerryBox group engineers who regularly serviced the instruments on board the ship. We thank Housam Dibeh for discussions on the functioning of the Drift App tool, and to Wilhelm Petersen for discussions on the functioning of the pH instruments and processing of their data.
Supplementary Material
The Supplementary Material for this article can be found online at: https://www.frontiersin.org/articles/10.3389/fmars.2022.827075/full#supplementary-material
Footnotes
- ^ https://ferrydata.hereon.de/
- ^ https://doi.org/10.1594/PANGAEA.930383
- ^ www.coastmap.org
- ^ hcdc.hereon.de/drift-now/
- ^ www.bsh.de
- ^ https://marine.copernicus.eu
- ^ https://data.icos-cp.eu
- ^ https://cds.climate.copernicus.eu
- ^ https://github.com/mvdh7/co2flux
- ^ https://www.bsh.de/EN/DATA/Predictions/Currents/Circulation_calendar/circulation_calendar_node.html
References
Alduchov, O. A., and Eskridge, R. E. (1996). Improved Magnus form approximation of saturation vapor pressure. J. Appl. Meteorol. 35, 601–609. doi: 10.1175/1520-0450(1996)035<0601:IMFAOS>2.0.CO;2
Bauer, J. E., Cai, W.-J., Raymond, P. A., Bianchi, T. S., Hopkinson, C. S., and Regnier, P. A. G. (2013). The changing carbon cycle of the coastal ocean. Nature 504, 61–70. doi: 10.1038/nature12857
Becker, M., Olsen, A., Landschützer, P., Omar, A., Rehder, G., Rödenbeck, C., et al. (2021). The northern European shelf as an increasing net sink for CO2. Biogeosciences 18, 1127–1147. doi: 10.5194/bg-18-1127-2021
Borges, A. V., Schiettecatte, L. S., Abril, G., Delille, B., and Gazeau, F. (2006). Carbon dioxide in European coastal waters. Estuar. Coast. Shelf Sci. 70, 375–387. doi: 10.1016/j.ecss.2006.05.046
Bourgeois, T., Orr, J. C., Resplandy, L., Terhaar, J., Ethé, C., Gehlen, M., et al. (2016). Coastal-ocean uptake of anthropogenic carbon. Biogeosciences 13, 4167–4185. doi: 10.1111/gcb.15822
Burson, A., Stomp, M., Akil, L., Brussaard, C. P. D., and Huisman, J. (2016). Unbalanced reduction of nutrient loads has created an offshore gradient from phosphorus to nitrogen limitation in the North Sea. Limnol. Oceanogr. 61, 869–888. doi: 10.1002/lno.10257
Burt, W. J., Thomas, H., Hagens, M., Pätsch, J., Clargo, N. M., Salt, L. A., et al. (2016). Carbon sources in the North Sea evaluated by means of radium and stable carbon isotope tracers. Limnol. Oceanogr. 61, 666–683. doi: 10.1002/lno.10243
Butenschön, M., Clark, J., Aldridge, J. N., Allen, J. I., Artioli, Y., Blackford, J., et al. (2016). ERSEM 15.06: a generic model for marine biogeochemistry and the ecosystem dynamics of the lower trophic levels. Geosci. Model Dev. 9, 1293–1339. doi: 10.5194/gmd-9-1293-2016
Cai, W.-J., Xu, Y.-Y., Feely, R. A., Wanninkhof, R., Jönsson, B., Alin, S. R., et al. (2020). Controls on surface water carbonate chemistry along North American ocean margins. Nat. Commun. 11:2691. doi: 10.1038/s41467-020-16530-z
Callies, U., Groll, N., Horstmann, J., Kapitza, H., Klein, H., Maßmann, S., et al. (2017). Surface drifters in the German Bight: model validation considering windage and Stokes drift. Ocean Sci. 13, 799–827. doi: 10.5194/os-13-799-2017
Callies, U., Kreus, M., Petersen, W., and Voynova, Y. G. (2021). On Using Lagrangian Drift Simulations to Aid Interpretation of in situ Monitoring Data. Front. Mar. Sci. 8:666653. doi: 10.3389/fmars.2021.666653
Callies, U., Plüß, A., Kappenberg, J., and Kapitza, H. (2011). Particle tracking in the vicinity of Helgoland, North Sea: a model comparison. Ocean Dyn. 61, 2121–2139. doi: 10.1007/s10236-011-0474-8
Chai, F., Johnson, K. S., Claustre, H., Xing, X., Wang, Y., Boss, E., et al. (2020). Monitoring ocean biogeochemistry with autonomous platforms. Nat. Rev. Earth Environ. 1, 315–326. doi: 10.1038/s43017-020-0053-y
Chen, C.-T. A., and Borges, A. V. (2009). Reconciling opposing views on carbon cycling in the coastal ocean: continental shelves as sinks and near-shore ecosystems as sources of atmospheric CO2. Deep Sea Res. Part II Top. Stud. Oceanogr. 56, 578–590. doi: 10.1016/j.dsr2.2009.01.001
Chen, H., and Scheeren, B. (2020). ICOS ATC CO2 Release, Lutjewad (60.0 m), 2018-08-13-2020-05-31. Plateau de Saclay: Atmospheric Thematic Centre.
Chen, H., and Scheeren, B. (2021). ICOS ATC NRT CO2 growing time series, Lutjewad (60.0 m), 2020-06-01–2021-05-07. Plateau de Saclay: Atmospheric Thematic Centre.
Clargo, N. M., Salt, L. A., Thomas, H., and De Saar, H. J. W. (2015). Rapid increase of observed DIC and pCO(2) in the surface waters of the North Sea in the 2001-2011 decade ascribed to climate change superimposed by biological processes. Mar. Chem. 177, 566–581. doi: 10.1016/j.marchem.2015.08.010
Dai, M., Lu, Z., Zhai, W., Chen, B., Cao, Z., Zhou, K., et al. (2009). Diurnal variations of surface seawater pCO(2) in contrasting coastal environments. Limnol. Oceanogr. 54, 735–745. doi: 10.4319/lo.2009.54.3.0735
Dick, S., Kleine, H., and Janssen, F. (2008). “A new operational circulation model for the North Sea and Baltic Sea using a novel vertical coordinate setup and first results,” in Proceedings of the 5th International Conference on Coastal to Global Operational Oceanography: Achievements and Challenges, Vol. 28 (Exeter: EUROGOOS).
Dick, S., Müller-Navarra, S., Klein, H., and Komo, H. (2001). The operational circulation model of BSH (BSHcmod), Model description and validation. Tech. Rep. 29:59.
Fietzek, P., Fiedler, B., Steinhoff, T., and Körtzinger, A. (2013). In situ Quality Assessment of a Novel Underwater pCO2 Sensor Based on Membrane Equilibration and NDIR Spectrometry. J. Atmos. Ocean. Technol. 31, 181–196. doi: 10.1175/jtech-d-13-00083.1
Fischer, G., Romero, O., Karstensen, J., Moradi, N., Iversen, M., Ruhland, G., et al. (2021). Seasonal flux patterns and carbon transport from low oxygen eddies at the Cape Verde Ocean Observatory: lessons learned from a time series sediment trap study (2009–2016). Biogeosci. Discuss. 2021, 1–35. doi: 10.5194/bg-18-6479-2021
Frankignoulle, M., and Borges, A. V. (2001). European continental shelf as a significant sink for atmospheric carbon dioxide. Glob. Biogeochem. Cycles 15, 569–576. doi: 10.1029/2000gb001307
Friedlingstein, P., O’sullivan, M., Jones, M. W., Andrew, R. M., Hauck, J., Olsen, A., et al. (2020). Global Carbon Budget 2020. Earth Syst. Sci. Data 12, 3269–3340. doi: 10.5194/essd-12-3269-2020
Frigstad, H., Kaste, Ø, Deininger, A., Kvalsund, K., Christensen, G., Bellerby, R. G. J., et al. (2020). Influence of Riverine Input on Norwegian Coastal Systems. Front. Mar. Sci. 7:332. doi: 10.3389/fmars.2020.00332
Gallego, M. A., Timmermann, A., Friedrich, T., and Zeebe, R. E. (2020). Anthropogenic Intensification of Surface Ocean Interannual pCO2 Variability. Geophys. Res. Lett. 47:e2020GL087104. doi: 10.1029/2020GL087104
Gattuso, J. P., Frankignoulle, M., and Wollast, R. (1998). Carbon and carbonate metabolism in coastal aquatic ecosystems. Annu. Rev. Ecol. Syst. 29, 405–434. doi: 10.1146/annurev.ecolsys.29.1.405
Gröger, M., Arneborg, L., Dieterich, C., Höglund, A., and Meier, H. E. M. (2019). Summer hydrographic changes in the Baltic Sea, Kattegat and Skagerrak projected in an ensemble of climate scenarios downscaled with a coupled regional ocean–sea ice–atmosphere model. Clim. Dyn. 53, 5945–5966. doi: 10.1007/s00382-019-04908-9
Gustafsson, B. (1997). Interaction between Baltic Sea and North Sea. Dtsch. Hydrogr. Zeitschrift 49, 165–183. doi: 10.1007/bf02764031
Gypens, N., Lacroix, G., Lancelot, C., and Borges, A. V. (2011). Seasonal and inter-annual variability of air–sea CO2 fluxes and seawater carbonate chemistry in the Southern North Sea. Prog. Oceanogr. 88, 59–77. doi: 10.1016/j.pocean.2010.11.004
Haller, M., Janssen, F., Siddorn, J., Petersen, W., and Dick, S. (2015). Evaluation of numerical models by FerryBox and fixed platform in situ data in the southern North Sea. Ocean Sci. 11, 879–896. doi: 10.5194/os-11-879-2015
Hartman, S. E., Humphreys, M. P., Kivimäe, C., Woodward, E. M. S., Kitidis, V., and Mcgrath, T. (2019). Seasonality and spatial heterogeneity of the surface ocean carbonate system in the northwest European continental shelf. Prog. Oceanogr. 177:101909. doi: 10.1016/j.pocean.2018.02.005
Henson, S. A., Beaulieu, C., and Lampitt, R. S. (2016). Observing climate change trends in ocean biogeochemistry: when and where. Glob. Chang. Biol. 22, 1561–1571. doi: 10.1111/gcb.13152
Hersbach, H., Bell, B., Berrisford, P., Biavati, G., Horányi, A., Muñoz Sabater, J., et al. (2018). ERA5 hourly data on pressure levels from 1979 to present. Copernicus Climate Change Service. Bologna, Italy: Climate Data Store.
Hill, A. E., Brown, J., Fernand, L., Holt, J., Horsburgh, K. J., Proctor, R., et al. (2008). Thermohaline circulation of shallow tidal seas. Geophys. Res. Lett. 35:L11605. doi: 10.1038/35015531
Holt, J., and Proctor, R. (2008). The seasonal circulation and volume transport on the northwest European continental shelf: a fine-resolution model study. J. Geophys. Res. Oceans 113:C06021. doi: 10.1029/2006JC004034
Humphreys, M. P., Achterberg, E. P., Hopkins, J. E., Chowdhury, M. Z. H., Griffiths, A. M., Hartman, S. E., et al. (2018). Mechanisms for a nutrient-conserving carbon pump in a seasonally stratified, temperate continental shelf sea. Prog. Oceanogr. 177:101961. doi: 10.1016/j.pocean.2018.05.001
IOC-R (2021). Integrated Ocean Carbon Research: a Summary of Ocean Carbon Research, and Vision of Coordinated Ocean Carbon Research and Observations for the Next Decade. IOC Tech. Ser. 158:46.
Jiang, Z.-P., Yuan, J., Hartman, S. E., and Fan, W. (2019). Enhancing the observing capacity for the surface ocean by the use of Volunteer Observing Ship. Acta Oceanol. Sin. 38, 114–120. doi: 10.1007/s13131-019-1463-3
Jickells, T. D. (1998). Nutrient Biogeochemistry of the Coastal Zone. Science 281:217. doi: 10.1126/science.281.5374.217
Jones, D. C., Ito, T., Takano, Y., and Hsu, W.-C. (2014). Spatial and seasonal variability of the air-sea equilibration timescale of carbon dioxide. Glob. Biogeochem. Cycles 28, 1163–1178. doi: 10.1002/2014GB004813
Kerimoglu, O., Große, F., Kreus, M., Lenhart, H.-J., and Van Beusekom, J. E. E. (2018). A model-based projection of historical state of a coastal ecosystem: relevance of phytoplankton stoichiometry. Sci. Total Environ. 639, 1311–1323. doi: 10.1016/j.scitotenv.2018.05.215
Kerimoglu, O., Voynova, Y. G., Chegini, F., Brix, H., Callies, U., Hofmeister, R., et al. (2020). Interactive impacts of meteorological and hydrological conditions on the physical and biogeochemical structure of a coastal system. Biogeosciences 17, 5097–5127.
Kitidis, V., Shutler, J. D., Ashton, I., Warren, M., Brown, I., Findlay, H., et al. (2019). Winter weather controls net influx of atmospheric CO2 on the north-west European shelf. Sci. Rep. 9:20153. doi: 10.1038/s41598-019-56363-5
Kristiansen, T., and Aas, E. (2015). Water type quantification in the Skagerrak, the Kattegat and off the Jutland west coast. Oceanologia 57, 177–195. doi: 10.1016/j.oceano.2014.11.002
Kühn, W., Pätsch, J., Thomas, H., Borges, A. V., Schiettecatte, L. S., Bozec, Y., et al. (2010). Nitrogen and carbon cycling in the North Sea and exchange with the North Atlantic-A model study, Part II: carbon budget and fluxes. Cont. Shelf Res. 30, 1701–1716. doi: 10.1016/j.csr.2010.07.001
Landschützer, P., Gruber, N., and Bakker, D. C. E. (2016). Decadal variations and trends of the global ocean carbon sink. Glob. Biogeochem. Cycles 30, 1396–1417. doi: 10.1002/2015GB005359
Laruelle, G. G., Cai, W.-J., Hu, X., Gruber, N., Mackenzie, F. T., and Regnier, P. (2018). Continental shelves as a variable but increasing global sink for atmospheric carbon dioxide. Nat. Commun. 9:454. doi: 10.1038/s41467-017-02738-z
Laruelle, G. G., Dürr, H. H., Slomp, C. P., and Borges, A. V. (2010). Evaluation of sinks and sources of CO2 in the global coastal ocean using a spatially-explicit typology of estuaries and continental shelves. Geophys. Res. Lett. 37:L15607. doi: 10.1029/2010GL043691
Laruelle, G. G., Lauerwald, R., Pfeil, B., and Regnier, P. (2014). Regionalized global budget of the CO2 exchange at the air-water interface in continental shelf seas. Glob. Biogeochem. Cycles 28, 1199–1214. doi: 10.1002/2014GB004832
Legge, O., Johnson, M., Hicks, N., Jickells, T., Diesing, M., Aldridge, J., et al. (2020). Carbon on the Northwest European Shelf: contemporary Budget and Future Influences. Front. Mar. Sci. 7:143. doi: 10.3389/fmars.2020.00143
Li, Q., Guo, X., Zhai, W., Xu, Y., and Dai, M. (2020). Partial pressure of CO2 and air-sea CO2 fluxes in the South China Sea: synthesis of an 18-year dataset. Prog. Oceanogr. 182:102272. doi: 10.1016/j.pocean.2020.102272
Lorkowski, I., Pätsch, J., Moll, A., and Kühn, W. (2012). Interannual variability of carbon fluxes in the North Sea from 1970 to 2006 – Competing effects of abiotic and biotic drivers on the gas-exchange of CO2. Estuar. Coast. Shelf Sci. 100, 38–57. doi: 10.1016/j.ecss.2011.11.037
Luisetti, T., Ferrini, S., Grilli, G., Jickells, T. D., Kennedy, H., Kröger, S., et al. (2020). Climate action requires new accounting guidance and governance frameworks to manage carbon in shelf seas. Nat. Commun. 11:4599. doi: 10.1038/s41467-020-18242-w
Macovei, V. A., Voynova, Y. G., Becker, M., Triest, J., and Petersen, W. (2021b). Long-term intercomparison of two pCO2 instruments based on ship-of-opportunity measurements in a dynamic shelf sea environment. Limnol. Oceanogr. Methods 19, 37–50. doi: 10.1002/lom3.10403
Macovei, V. A., Petersen, W., Brix, H., and Voynova, Y. G. (2021a). Reduced Ocean Carbon Sink in the South and Central North Sea (2014–2018) Revealed From FerryBox Observations. Geophys. Res. Lett. 48:e2021GL092645. doi: 10.1029/2021GL092645
Meyer, M., Pätsch, J., Geyer, B., and Thomas, H. (2018). Revisiting the Estimate of the North Sea Air-Sea Flux of CO2 in 2001/2002: the Dominant Role of Different Wind Data Products. J. Geophys. Res. Biogeosci. 123, 1511–1525. doi: 10.1029/2017JG004281
Mustaffa, N. I. H., Kallajoki, L., Hillebrand, H., Wurl, O., and Striebel, M. (2020). Sea surface phytoplankton community response to nutrient and light changes. Mar. Biol. 167:123. doi: 10.1073/pnas.2107238118
Ocean Productivity (2021). Net Primary Production Standard Products. Available Online at: https://www.science.oregonstate.edu/ocean.productivity/ (accessed May 25, 2021).
Petersen, W. (2014). FerryBox systems: state-of-the-art in Europe and future development. J. Mar. Syst. 140, 4–12. doi: 10.1016/j.jmarsys.2014.07.003
Petersen, W., Reinke, S., Breitbach, G., Petschatnikov, M., Wehde, H., and Thomas, H. (2018). FerryBox data in the North Sea from 2002 to 2005. Earth Syst. Sci. Data 10, 1729–1734. doi: 10.5194/essd-10-1729-2018
Reggiani, E. R., King, A. L., Norli, M., Jaccard, P., Sørensen, K., and Bellerby, R. G. J. (2016). FerryBox-assisted monitoring of mixed layer pH in the Norwegian Coastal Current. J. Mar. Syst. 162, 29–36. doi: 10.1016/j.jmarsys.2016.03.017
Roobaert, A., Laruelle, G. G., Landschutzer, P., Gruber, N., Chou, L., and Regnier, P. (2019). The Spatiotemporal Dynamics of the Sources and Sinks of CO2 in the Global Coastal Ocean. Glob. Biogeochem. Cycles 33, 1693–1714. doi: 10.1029/2019GB006239
Salt, L. A., Thomas, H., Prowe, A. E. F., Borges, A. V., Bozec, Y., and De Baar, H. J. W. (2013). Variability of North Sea pH and CO2 in response to North Atlantic Oscillation forcing. J. Geophys. Res. Biogeosci. 118, 1584–1592. doi: 10.1002/2013JG002306
Schiettecatte, L. S., Thomas, H., Bozec, Y., and Borges, A. V. (2007). High temporal coverage of carbon dioxide measurements in the Southern Bight of the North Sea. Mar. Chem. 106, 161–173. doi: 10.1016/j.marchem.2007.01.001
Schlitzer, R. (2020). Ocean Data View. Available Online at: http://odv.awi.de (accessed February 18, 2021).
Takahashi, T., Olafsson, J., Goddard, J. G., Chipman, D. W., and Sutherland, S. C. (1993). Seasonal variation of CO2 and nutrients in the high-latitude surface oceans: a comparative study. Glob. Biogeochem. Cycles 7, 843–878. doi: 10.1029/93GB02263
Thomas, H., Bozec, Y., De Baar, H. J. W., Elkalay, K., Frankignoulle, M., Schiettecatte, L. S., et al. (2005). The carbon budget of the North Sea. Biogeosciences 2, 87–96. doi: 10.5194/bg-2-87-2005
Thomas, H., Bozec, Y., Elkalay, K., and De Baar, H. J. W. (2004). Enhanced Open Ocean Storage of CO2 from Shelf Sea Pumping. Science 304:1005. doi: 10.1126/science.1095491
Thomas, H., Friederike Prowe, A. E., Van Heuven, S., Bozec, Y., De Baar, H. J. W., Schiettecatte, L. S., et al. (2007). Rapid decline of the CO2 buffering capacity in the North Sea and implications for the North Atlantic Ocean. Glob. Biogeochem. Cycles 21:GB4001. doi: 10.1029/2006GB002825
Thomas, H., Schiettecatte, L. S., Suykens, K., Koné, Y. J. M., Shadwick, E. H., Prowe, A. E. F., et al. (2009). Enhanced ocean carbon storage from anaerobic alkalinity generation in coastal sediments. Biogeosciences 6, 267–274. doi: 10.5194/bg-6-267-2009
Tonani, M., Sykes, P., King, R. R., Mcconnell, N., Péquignet, A. C., O’dea, E., et al. (2019). The impact of a new high-resolution ocean model on the Met Office North-West European Shelf forecasting system. Ocean Sci. 15, 1133–1158. doi: 10.5194/os-15-1133-2019
Tsunogai, S., Watanabe, S., and Sato, T. (1999). Is there a “continental shelf pump” for the absorption of atmospheric CO2? Tellus B-Chem. Phys. Meteorol. 51, 701–712. doi: 10.1034/j.1600-0889.1999.t01-2-00010.x
van Heuven, S., Pierrot, D., Rae, J. W. B., Lewis, E., and Wallace, D. W. R. (2011). CO2SYS v 1.1 MATLAB Program Developed for CO2 System Calculations. ORNL/CDIAC-105b. Oak Ridge, Tennessee: Oak Ridge National Laboratory, U.S. Department of Energy. doi: 10.3334/CDIAC/otg.CO2SYS_MATLAB_v1.1
von Oppeln-Bronikowski, N., De Young, B., Atamanchuk, D., and Wallace, D. (2021). Glider-based observations of CO2 in the Labrador Sea. Ocean Sci. 17, 1–16. doi: 10.5194/os-17-1-2021
Voynova, Y. G., Brix, H., Petersen, W., Sieglinde, W.-K., and Scharfe, M. (2017). Extreme flood impact on estuarine and coastal biogeochemistry: the 2013 Elbe flood. Biogeosciences 14, 541–557. doi: 10.5194/bg-14-541-2017
Voynova, Y. G., Petersen, W., Gehrung, M., Aßmann, S., and King, A. L. (2019). Intertidal regions changing coastal alkalinity: the Wadden Sea-North Sea tidally coupled bioreactor. Limnol. Oceanogr. 64, 1135–1149. doi: 10.1002/lno.11103
Wang, H., Hu, X., Cai, W.-J., and Sterba-Boatwright, B. (2017). Decadal fCO2 trends in global ocean margins and adjacent boundary current-influenced areas. Geophys. Res. Lett. 44, 8962–8970. doi: 10.1002/2017GL074724
Wanninkhof, R. (2014). Relationship between wind speed and gas exchange over the ocean revisited. Limnol. Oceanogr. Methods 12, 351–362. doi: 10.4319/lom.2014.12.351
Weiss, R. F. (1974). Carbon dioxide in water and seawater: the solubility of a non-ideal gas. Mar. Chem. 2, 203–215. doi: 10.1016/0304-4203(74)90015-2
Weston, K., Jickells, T. D., Fernand, L., and Parker, E. R. (2004). Nitrogen cycling in the southern North Sea: consequences for total nitrogen transport. Estuar. Coast. Shelf Sci. 59, 559–573. doi: 10.1016/j.ecss.2003.11.002
Wihsgott, J. U., Sharples, J., Hopkins, J. E., Woodward, E. M. S., Hull, T., Greenwood, N., et al. (2019). Observations of vertical mixing in autumn and its effect on the autumn phytoplankton bloom. Prog. Oceanogr. 177:102059. doi: 10.1016/j.pocean.2019.01.001
Winther, N. G., and Johannessen, J. A. (2006). North Sea circulation: atlantic inflow and its destination. J. Geophys. Res. Oceans 111:C12018. doi: 10.1029/2005JC003310
Keywords: North Sea, shelf sea, biogeochemistry, variability, seawater pCO2, carbon uptake, FerryBox
Citation: Macovei VA, Callies U, Calil PHR and Voynova YG (2022) Mesoscale Advective and Biological Processes Alter Carbon Uptake Capacity in a Shelf Sea. Front. Mar. Sci. 9:827075. doi: 10.3389/fmars.2022.827075
Received: 01 December 2021; Accepted: 24 February 2022;
Published: 05 April 2022.
Edited by:
Ivica Vilibic, Rudjer Boskovic Institute, CroatiaReviewed by:
Wei-dong Zhai, Shandong University (Qingdao), ChinaZhangxian Ouyang, University of Delaware, United States
Copyright © 2022 Macovei, Callies, Calil and Voynova. This is an open-access article distributed under the terms of the Creative Commons Attribution License (CC BY). The use, distribution or reproduction in other forums is permitted, provided the original author(s) and the copyright owner(s) are credited and that the original publication in this journal is cited, in accordance with accepted academic practice. No use, distribution or reproduction is permitted which does not comply with these terms.
*Correspondence: Vlad A. Macovei, vlad.macovei@hereon.de