Microplastics in the Mediterranean: Variability From Observations and Model Analysis
 Kostas Tsiaras1*
  Elisa Costa2
  Silvia Morgana2
  Chiara Gambardella2
  Veronica Piazza2
  Marco Faimali2 Roberta Minetti2
  Christina Zeri1 Melilotus Thyssen3
  Sana Ben Ismail4
  Yannis Hatzonikolakis1,5
  Sofia Kalaroni1
  Francesca Garaventa2
- 1Institute of Oceanography, Hellenic Centre for Marine Research (HCMR), Anavyssos, Greece
- 2National Research Council, Institute for the Study of Anthropic Impact and Sustainability in the Marine Environment, Genova, Italy
- 3Aix Marseille Univ., Université de Toulon, CNRS, IRD, MIO, Marseille, France
- 4Laboratory Marine Environment, Institut National des Sciences et Technologies de la Mer, Tunis, Tunisia
- 5Department of Biology, National and Kapodistrian University of Athens, Athens, Greece
In this study, the abundance and properties (size, shape, and polymer type) of microplastics (MPs) in sea surface water samples, collected during two sampling campaigns over 2018–2019, in four coastal areas of the Mediterranean Sea (Saronikos Gulf, LIgurian Sea, Gulf of Lion, and Gabes Gulf) were investigated. Coupled hydrodynamic/particle drift model simulations with basin-scale Mediterranean and high resolution nested models were used to provide a better understanding on the variability of the abundance/size of MPs, originating from wastewater and river runoff, in the four areas. Different size classes of MPs were considered in the model, taking into account biofouling induced sinking, as a possible mechanism of MPs removal from the surface. The Gabes Gulf showed the highest mean MPs abundance (0.073–0.310 items/m2), followed by Ligurian Sea (0.061–0.134 items/m2), Saronikos Gulf (0.047–0.080 items/m2), and Gulf of Lion (0.029–0.032 items/m2). Overall, the observed MPs abundance and size distribution was reasonably well reproduced by the model in the four different areas, except an overestimation of small size contribution in Saronikos Gulf. The basin-scale simulation revealed a strong decrease of smaller size MPs in offshore areas, due to biofouling induced sinking, with larger (floating) MPs being able to travel longer distances in the open sea. A significant impact of waves drift and advection of MPs from non-local sources was identified from model simulations, particularly in the Gulfs of Lion and Gabes, having a stronger effect on larger microplastics. In Gabes Gulf, most MPs originated from offshore areas, being mainly (floating) larger size classes, as suggested by the observed quite small contribution of <1 mm particles. The MPs observed abundance distribution in each area could be partly explained by the adopted sources distribution. The modeling tools proposed in this study provide useful insight to gain a better understanding on MPs dynamics in the marine environment and assess the current status of plastic pollution on basin and regional scale to further develop environmental management action for the mitigation of plastic pollution in the Mediterranean Sea.
Introduction
In 2019, worldwide production of plastic was 368 million metric tons and, after a decrease in the first half of the year 2020, due to COVID-19 pandemic, it has started to increase again (PlasticEurope, 2020; Patrício Silva et al., 2021). Plastics have been found worldwide in the marine environment, with estimates suggesting that 5–10 million tonnes (accounting for 1.5–4% of the global plastic production) enter the ocean every year. These amounts are expected to increase 1 order of magnitude by 2025 (Maes et al., 2018; Kane et al., 2020; Shabaka et al., 2020).
Recently, there is a growing global awareness and concern on the impact of plastic pollution on marine organisms (Anastasopoulou and Fortibuoni, 2019), particularly considering that a substantial proportion (estimated at 13.5%) of the marine plastic budget occurs as microplastics (MPs) (particles <5 mm; Eriksen et al., 2014). In the marine environment, MPs can originate from different sources (Freeman et al., 2020). The so-called primary MPs are those manufactured for applications including resin pellet, microbeads associated with industrial spillages and cosmetics exfoliators in personal care products (Van Cauwenberghe et al., 2015; Coyle et al., 2020), while secondary MPs are those deriving from the progressive fragmentation of larger pieces of plastic litter, as a consequence of weathering on land and at sea (Arthur et al., 2009; Gerritse et al., 2020; Napper and Thompson, 2020). MPs can originate from various land- and sea-based sources, entering the marine environment via different pathways, such as sewage outlets, wind and land run-off, rivers or urban effluents (Veiga et al., 2016).
The Mediterranean Sea is a semi-enclosed basin with limited outflow of surface waters and a densely populated coastline, hosting a series of intensive activities (tourism, fishing, shipping, and industry) and subject to several anthropogenic pressures (Schmidt et al., 2018; Wakkaf et al., 2020). Concerning plastic pollution, it represents one of the most impacted regions of the world (Lebreton et al., 2012; UNEP/MAP, 2015; Llorca et al., 2020; Macias et al., 2021), receiving from 5 to 10% of the global plastic mass (Cózar et al., 2015; Compa et al., 2020; Wakkaf et al., 2020). As listed in Table 1, a high density of floating debris was reported since 1980s (Morris, 1980), while recently, Cózar et al. (2015) have highlighted that the average plastic concentration in Mediterranean surface waters was comparable to the accumulation of plastic litter in the five subtropical gyres, contributing to define this area in the subsequent years a hot spot of plastic pollution (Suaria et al., 2016; Cincinelli et al., 2019; Avio et al., 2020), with IUCN (International Union for Conservation of Nature) recent estimates of total accumulated plastics in the Mediterranean (surface, seafloor, water column, and coasts) ranging between 53,500 and 3,546,700 tonnes (Boucher and Bilard, 2020).
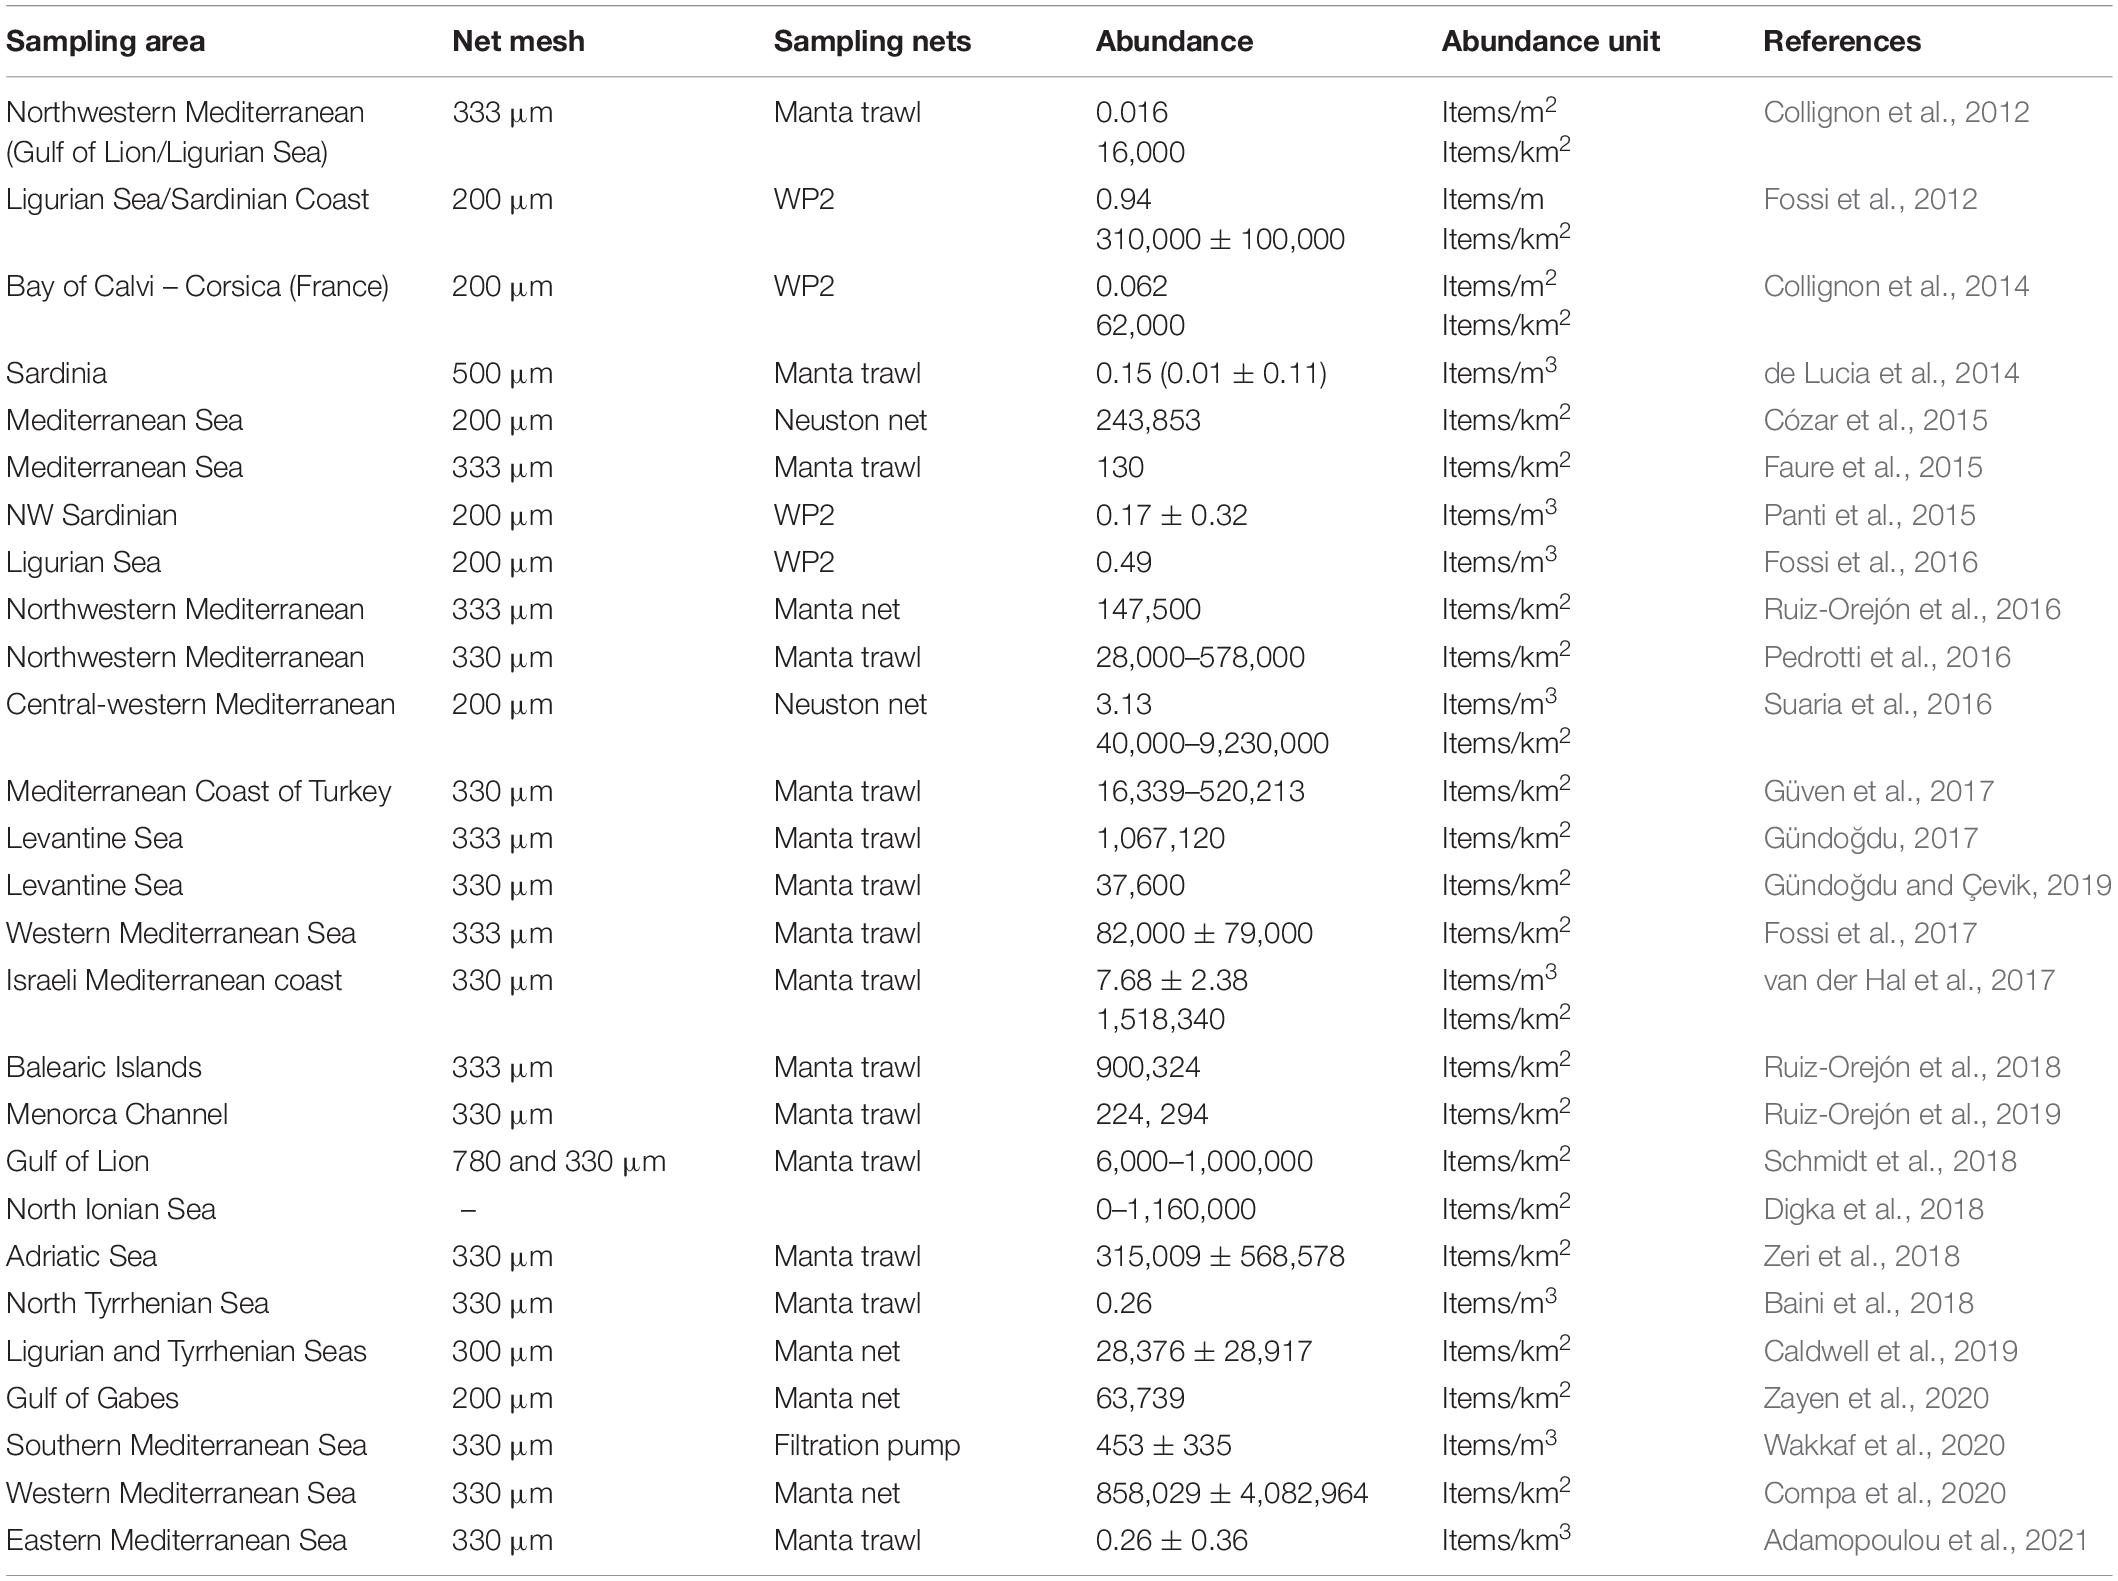
Table 1. Indicative microplastics concentrations in the Mediterranean.
Although the Mediterranean Sea is one of the most investigated marine regions of the world (Cincinelli et al., 2019), a comprehensive knowledge on the marine litter distribution, sources and sinks in this area is still lacking. The MPs pollution may significantly vary geographically, depending on local source inputs (i.e., river runoff, industrial and urban effluents, etc.), as well as environmental factors (Browne et al., 2008; Kukulka et al., 2012; Kim et al., 2015; Imhof et al., 2017). When buoyant plastics enter the ocean, their fate is determined not only by their physical properties (e.g., density, size, and shape) and processes in the marine environment (wind, waves, and ocean currents), but also by processes related to the MP itself, including aggregation with other particles (Long et al., 2015), biofouling (Fazey and Ryan, 2016; Kooi et al., 2017) and degradation into smaller particles (Eriksen et al., 2014; Gewert et al., 2015; Song et al., 2017; Kvale et al., 2020). The interplay of such different factors may contribute to the accumulation of MPs in an open sea or coastal area (Desforges et al., 2014; Fauziah et al., 2015; Brach et al., 2018; Adamopoulou et al., 2021). Numerical models simulating the movement and fate of marine litter provide essential tools to gain a better understanding and predict accumulation areas of plastic debris (NOAA, 2016). Such models have been implemented on both global scale (e.g., Lebreton et al., 2012; Maximenko et al., 2012; van Sebille et al., 2015) and in the Mediterranean (e.g., Mansui et al., 2015; Zambianchi et al., 2017; Liubartseva et al., 2018; Kaandrop et al., 2020; Soto-Navarro et al., 2020; Macias et al., 2021) to simulate the pathways and accumulation patterns of floating plastics, originating from known sources (cities, rivers, and shipping lanes). However, except very few studies (e.g., van Sebille et al., 2015; Carlson et al., 2017; Kaandrop et al., 2020), simulated plastics concentrations were not validated against in situ data and model results provided mainly qualitative findings.
Tsiaras et al. (2021) implemented a basin-scale coupled hydrodynamic/particle drift model in the Mediterranean to track the pathways of MPs from major land-based sources (cities wastewater and river runoff), which, according to the IUCN (Boucher and Friot, 2017), represents the overwhelming majority (98%) of primary MPs input into the ocean. Different size classes of MPs were considered in the model, taking into account biofouling induced sinking, a size specific process that has been hypothesized in several studies (Cózar et al., 2014, 2015; van Sebille et al., 2015; Fazey and Ryan, 2016; Kaiser et al., 2017; Koelmans et al., 2017) as a potential explanation of the decreasing surface concentration of smaller size microplastics. The primary objective of the present study is to investigate the variability of MPs abundance, obtained from surface water samples collected during 2018–2019 EU H2020 Claim Project sampling campaigns in four coastal areas of the Mediterranean Sea (Saronikos Gulf, Ligurian Sea, Gulf of Lion, and Gabes Gulf) and also to further evaluate model results. The simulated MPs distributions with the basin-scale Mediterranean model (Tsiaras et al., 2021) over the 2018–2019 period was used to provide a better understanding on the variability of MPs abundance and size distribution in the key study areas. While such basin-scale simulations may provide an important first step for the assessment of plastic pollution on Mediterranean basin-scale, effectively considering also transboundary pollution (Macias et al., 2021; Hatzonikolakis et al., 2022), management plans for the mitigation of plastics are usually implemented on more local scales. Moreover, given the significant uncertainty in the plastics sources distribution (Tsiaras et al., 2021), inputs of plastics on local scale may be biased and require adjustments. Thus, in order to better resolve the dynamics of MPs and also fine-tune existing source inputs to obtain a better fit with the observational data, high resolution hydrodynamic/particle drift models, nested in the Mediterranean basin-scale model, were downscaled in the four different areas. Such an approach with nested particle tracking models has not been implemented elsewhere, to our knowledge, and might offer a useful modeling tool for the assessment of plastic pollution on regional and local scales.
Materials and Methods
Sampling Collection
Two sampling campaigns were performed, across four coastal areas of the Mediterranean Sea (Saronikos Gulf, Ligurian Sea, Gulf of Lion, and Gabes Gulf), from September 2018 to November 2019, aiming to represent two different seasons, corresponding to autumn/winter (campaign I) and spring/summer (campaign II) when possible. For each geographical area (Figure 1), sampling sites (same locations in both campaigns; see Supplementary Tables 1–5) were selected based on potential MPs sources/pathways (e.g., Wastewater Treatment Plants/WWTPs, river mouths), including also some vulnerable or less sensitive habitats (i.e., Marine Protected Areas, MPAs), characterized by a low anthropogenic impact in order to compare results with those belonging from potential MP sources. Detailed information about sampling sites for each geographical area (e.g., coordinates and sampling data) is reported in Supplementary Tables 2–5.
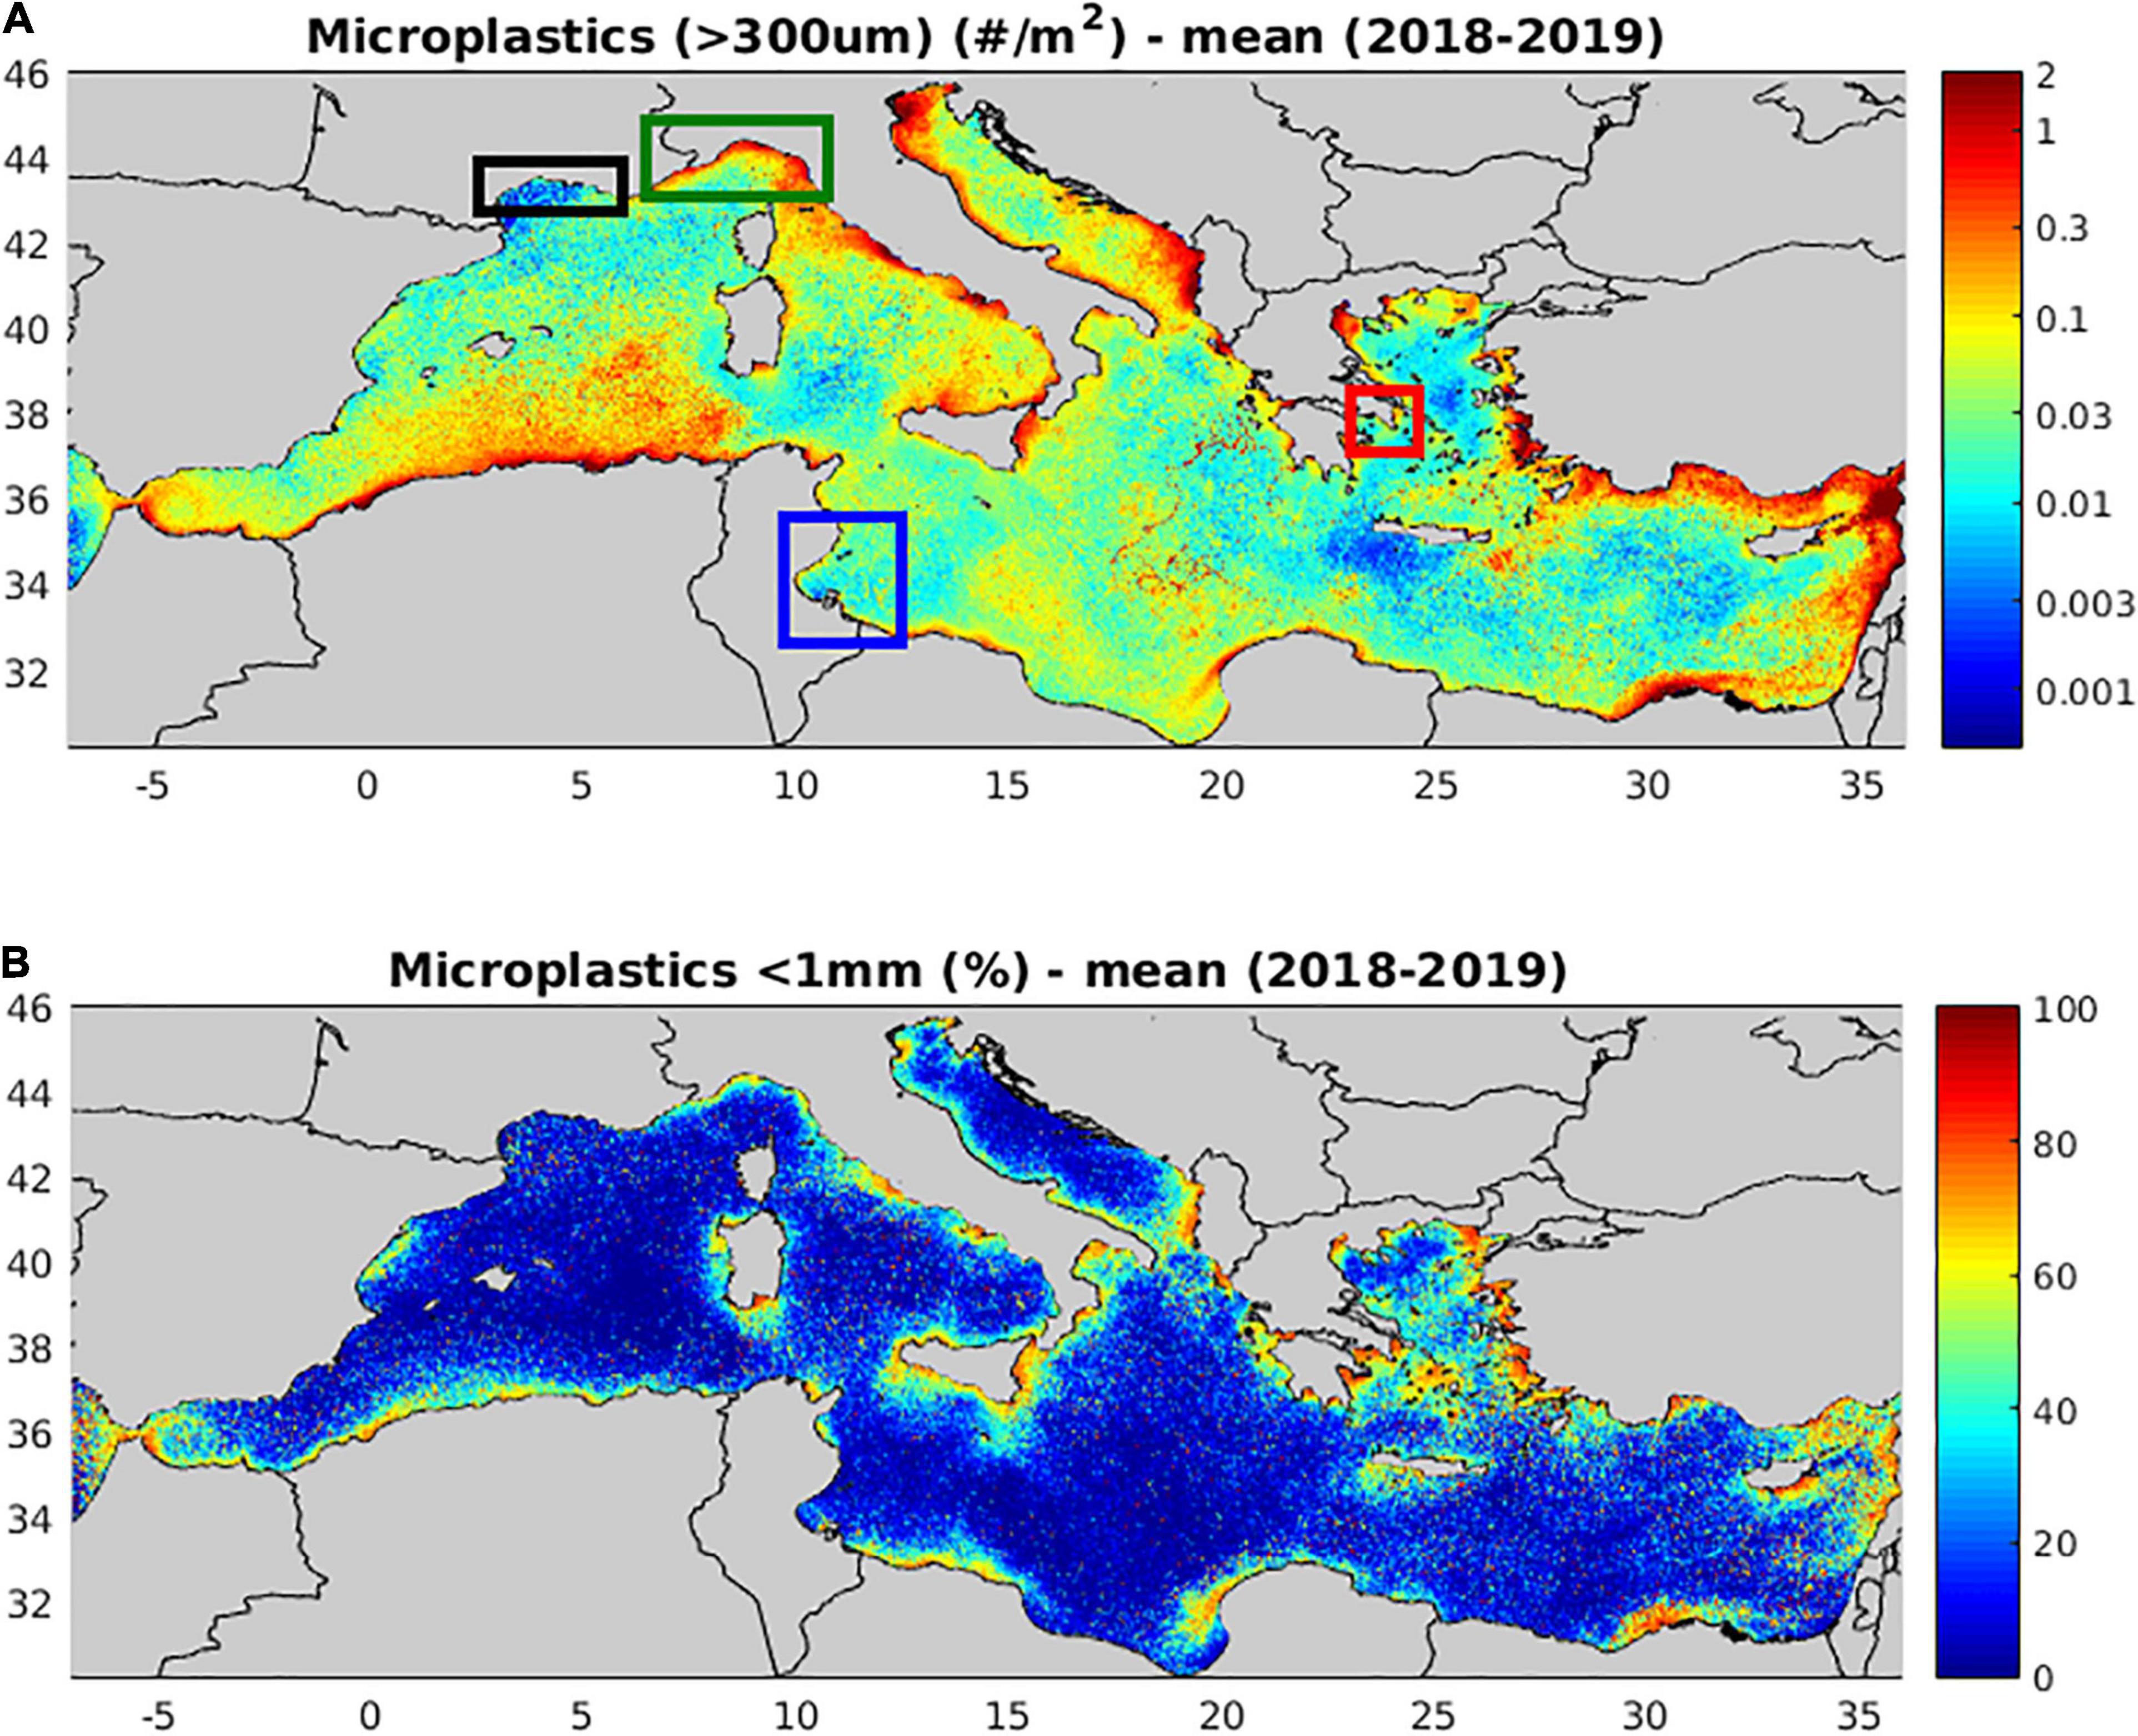
Figure 1. Mean (2018–2019) simulated microplastics (A) concentration (items/m2) and (B) contribution <1 mm (%). The four key study areas are indicated (black box, Gulf of Lion; blue box, Ligurian Sea; green box, Gabes Gulf; and red box, Saronikos Gulf).
A total of 74 surface water samples were collected using a manta net of different mesh and open mouth size: a 100 and 330 μm manta net (W0.70xH0.40m) in Ligurian Sea and Gulf of Lion, respectively; a 330 μm manta net (W0.60xH0.24m) in Saronikos Gulf and a trawled net (W0.60xH0.20m) mounted with a 200 μm mesh size in Gabes Gulf. During all sampling activities, the manta nets were trawled on the water surface at 1–2 Knots for 10/20 min, kept at a distance of about 50 m from the boat to avoid the turbulence induced by the wake of the ship.
After each sampling event, all collected samples were then carefully transferred into new plastic bottles (previously rinsed with Milli-Q water) and then appropriately maintained for subsequent laboratory analysis. During sampling and sample handling, all precautionary measures (e.g., carefully cleaning all the equipment used prior to sampling, covering samples and equipment in use), recently suggested by GESAMP (2019) guidelines, were taken into account in order to avoid potential environmental contamination. The use of a flow-meter was not applied in all sampling areas, since flow-meters do not always give reliable results (Gago et al., 2018). For all sampling areas, the filtered volume (m3) was calculated by multiplying the area of the net mouth by the distance covered during the tow, between two positions registered by GPS starts and stops (Gago et al., 2018; Ourmieres et al., 2018). The MPs abundance was then calculated as items/m3, namely the number of particles per volume. These data were also converted to items/m2 and items/Km2 in order to be comparable with the simulated MPs abundance and also the majority of available in situ data in the Mediterranean (see Table 1). The area covered (m2) was calculated by multiplying the width of the net mouth by the distance covered during the tow.
Sea Water Samples Analysis
Water samples were analyzed for their plastic content at CNR laboratory using a stereomicroscope (Olympus SZX7, 8×–56×) with attached digital camera (Nikon, DSL3).
All potential particles were directly identified and manually sorted out from the sample (Morgana et al., 2018), then categorized by shape (fragment, lime fiber, pellet, film, and foam) and size (macroplastics: >5 mm; large MPs: 3–5 mm; medium MPs: 1–3 mm, and small MPs: <1 mm) (Morgana et al., 2018; Frias and Nash, 2019). In order to confirm the polymeric nature, all items were identified by a Perkin Elmer Two Fourier Transform Infrared (FT-IR) spectrometer, equipped with Universal ATR (UATR) accessory with a 9-bounce diamond top-plate (wave number range: 4,000 and 450 cm-1 resolutions; 32 scans). After measurement, the spectrum was compared to reference spectra through libraries supplied by Perkin Elmer, with a >70% similarity threshold.
Since contamination is a constant threat toward accurate laboratory analysis, several precautionary measures have been applied to prevent and avoid potential contamination of samples from external sources (i.e., airborne fibers) according to GESAMP (2019). As the laboratory is a busy environment and it is difficult to control contamination from nearby activities, the samples were covered during visual identification (Torre et al., 2016; Prata et al., 2019) and filter blanks were run in parallel to verify background airborne contamination during laboratorial procedures, as suggested by Gago et al. (2018). All particles found both in the sample and on the filter blank were excluded from the final MPs estimate in order to avoid overestimation (Rummel et al., 2016; Morgana et al., 2018).
Model Description
A basin-scale Mediterranean (Figure 1) 3-D hydrodynamic model (∼5 Km horizontal resolution) has been coupled with a Lagrangian drift model (see also Tsiaras et al., 2021), describing the transport and fate of different size MPs from major land based sources (rivers and wastewater effluents). The hydrodynamic model is based on the Princeton Ocean Model (POM; Blumberg and Mellor, 1983) that is currently operational within the POSEIDON forecasting system (Korres et al., 20071). A hybrid ensemble data assimilation algorithm (Tsiaras et al., 2017) was implemented to correct the simulated near surface circulation, based on satellite altimetry and sea surface temperature data, obtained from the European Copernicus database.2 The hydrodynamic model is also coupled with a comprehensive biogeochemical model (Kalaroni et al., 2020a,b), based on the European Regional Seas Ecosystem Model (ERSEM; Baretta et al., 1995), which provides bacterial biomass that is used to parameterize biofilm growth of microplastics (see Supplementary Material 1.1). The waves forcing (stokes drift, wave period, and significant height), used in the Lagrangian drift model was obtained off-line from Copernicus marine service (see text footnote 2) and is based on WAM Cycle 4.5.4 wave model (Gunther and Behrens, 2012) that is also a component of POSEIDON forecasting system.
The Lagrangian drift model is based on Pollani et al. (2001) and evaluates the particles’ displacement taking into account the following processes:
• Advection from ocean currents, obtained from the hydrodynamic model.
• Waves stokes drift, obtained off-line from the wave model output.
• Buoyancy/sinking, depending on the particles’ diameter/size and density.
• Random movement in the horizontal, depending on the horizontal diffusion (obtained from the hydrodynamic model).
• Random movement in the vertical, depending on the turbulent vertical diffusion (obtained from the hydrodynamic model) and waves (obtained off-line from the wave model output).
• Increase of particle density with time due to biofouling.
The model follows the concept of Super-Individuals (SI; Scheffer et al., 1995) for computational efficiency, with each SI representing a group of particles, sharing the same attributes (position, weight, origin, type of plastic, etc.). Four size classes (350, 500, 1,000, and 2,000 μm) of MPs are considered in the model, with initial density ∼960 kg/m3, being the density of most common plastics (polyethylene; Zeri et al., 2018; Llorca et al., 2020) found in the marine environment. The MPs concentration is initialized with a uniform background concentration, based on the basin median abundance from available in situ data (∼0.06 items/m2, see Supplementary Figure 3) and is distributed with the same weight on all size classes. A simplified parameterization of biofilm growth is adopted in the model, as a function of bacterial abundance (obtained from a biogeochemical model simulation) that is considered as a proxy for the biofouling community. Biofilm growth, which is assumed to be mainly controlled by detachment and colonization rates (Kiørboe, 2003) is generally faster for smaller particles, while the critical biofilm thickness that is necessary for microplastics to start sinking also decreases with size, based only on physical considerations of the particle’s shape and density (Cubarenko et al., 2016). Based on the adopted formulation, smaller size microplastics (350 and 500 μm) are gradually sinking (time to sink with mean bacterial biomass: 14 days 350 μm, 32.5 days 500 μm) due to the buoyancy loss resulting from the attachment of heavier biofilm (see Supplementary Figure 1), while larger size particles (>1 mm) practically remain afloat. A detailed model description is provided as Supplementary Material Section 1). The interested reader may also refer to Tsiaras et al. (2021) for more details on the basin scale model implementation.
Model Setup
Fine Resolution Models
Fine resolution (∼800 m) 3-D hydrodynamic/particle drift models were set up in the four key study areas (Saronikos Gulf, Ligurian Sea, Gulf of Lion, and Gabes Gulf) in order to better resolve the horizontal variability of MPs and also to fine-tune existing source inputs to obtain a better fit with the observational data. After an initial 2-year spin-up, a simulation over the 2018–2019 period was performed. The fine model’s open boundary conditions for the hydrodynamics (temperature, salinity, and currents) are obtained from the Mediterranean basin-scale model simulation over the same period. Moreover, an input of MPs (MicroIn, #items), obtained from the same basin-scale simulation, is adopted along the open boundary on a daily basis, in the case of water inflowing into the fine model domain:
where u(j,z) is the inflowing current velocity (m/day), depending on the particle depth (z) in the water column, dx is the fine model resolution (m), nfi_med(j) is the amount of MPs (#items) from the basin-scale model at point j of the fine model open boundary and res_factor (20/120 = 0.16) is a scaling factor between the basin-scale (1/20°) and fine model (1/120°) grids. The latter is used because nfi_med(j) is saved within a basin-scale grid point (1/20 = 6 × 1/120).
Sources
Two main sources of MPs were considered in the Mediterranean basin scale model:
(a) Input of MPs from coastal cities (>2,000 inhabitants) municipal wastewater discharge (see Supplementary Figure 2), which was extracted from UNEP/MAP (2011) report.
Larger MP particles (>300 μm) that are considered in this study are assumed to be totally removed, when some type of treatment is applied, being discharged into the sea only from untreated wastewater. The amount of microplastics (∼17,500 #/m3) in the influent (untreated) wastewater was estimated based on available data from the literature for the Mediterranean (Gündogdu et al., 2018; Magni et al., 2019; Bayo et al., 2020). The adopted concentration might be considered relatively low, as compared with existing data from different countries (range 2,000–400,000 #/m3, global average ∼170,000 #/m3, Uddin et al., 2020). However, we should note that there is a huge variability between measurements, depending also on the methodology (mesh size, sampled volume, etc.). Larger particles >300 μm were assumed to represent ∼20% of the total (Talvitie et al., 2017). The MPs input from sources was assumed to decrease with size due to fragmentation, following a power function (Lindeque et al., 2020):
For the considered size classes 350, 500, 1,000, and 2,000 μm, this practically results in a decreasing contribution of 50, 35, 10, and 5%, respectively in the sources.
(b) Input of microplastics from river discharge (see Supplementary Figure 2; Tsiaras et al., 2021) was obtained as a function of accumulated plastics production and monthly river runoff, based on Lebreton et al. (2017) global dataset.
The MP sources in the fine models implementation were slightly modified from those adopted in the Mediterranean in order to obtain a better fit with data (see below section “Fine-Resolution Model Simulations and Comparison With in situ Data”).
Validation With Data
The model simulated microplastics concentration was obtained from the 0.30 m surface layer to be comparable with collected in situ data, with manta net height varying between 0.20 and 0.40 m among different areas. The MPs abundance from field data, initially expressed as items/m3, was converted to items/m2 (see section “Sampling Collection”), excluding particles with size <330 μm and >5 mm, to be comparable with the simulated abundance. The raw data of MPs abundances are provided in the Supplementary Material. To validate the simulated microplastics size distribution, the percentage of smaller microplastics <1 mm {i.e., [abundance (350 μm) + abundance (500 μm)] / total abundance} was compared with the observed percentage (abundance <1 mm / total abundance).
Results and Discussion
Mediterranean Basin-Scale Simulation
The mean (2018–2019) distribution of MPs abundance and smaller size (<1 mm) contribution, simulated with the Mediterranean basin-scale model is shown in Figure 1. This has been validated against available in situ data, showing a reasonable agreement (see Supplementary Figure 3), both in terms of magnitude and horizontal variability. The simulated distribution reveals a strong decrease of MPs abundance from coastal areas near source inputs to offshore areas, modulated by hydrodynamic circulation patterns (see Tsiaras et al., 2021). The smaller size contribution follows the same pattern, decreasing in open sea areas. This is partly due to the adopted decreasing number of particles with size in sources (Equation 2), but is also strongly related to biofouling induced sinking of the smaller size classes. The obtained size distribution in open sea areas (10, 18, 55, and 20% for the 350 μm, 500 μm, 1 mm, and 2mm size classes, respectively) is consistent with Cózar et al. (2015) findings (comparing at the same locations), showing a peak around 1–2 mm size class. The effect of biofouling on microplastics abundance and size distribution may be seen in Figure 2, indicating a 75 and 40% increase on basin average respectively, in a simulation with no biofouling adopted in the model (see also Supplementary Figure 4). Among the four key study areas, biofouling appears to have a stronger effect in Gabes Gulf. This is a quite shallow area, where sinking MPs may accumulate on the seafloor (Tsiaras et al., 2021). In addition, this may be attributed to a strong phytoplankton biomass induced by high nutrient concentrations through terrestrial (atmospheric) or sediments inputs characteristic of this area, where the presence of biofouled MP items were frequently found in samples from Gabes Gulf (Zayen et al., 2020). We should note that when no biofouling is adopted, smaller size MPs remain floating at surface and therefore may travel longer distances with currents. Thus, Gabes Gulf may receive particles from the more polluted Algerian coast (Figure 1), following the pathway of the Algerian current and Atlantic-Ionian stream (see Supplementary Figure 5). In Zayen et al. (2020), the hydrodynamics models highlighted that the surface water sampled in the same area came mainly from outside of the Gabes Gulf (Atlantic Tunisian Current) and advancing by coastal current (Tunisian Coastal Current).
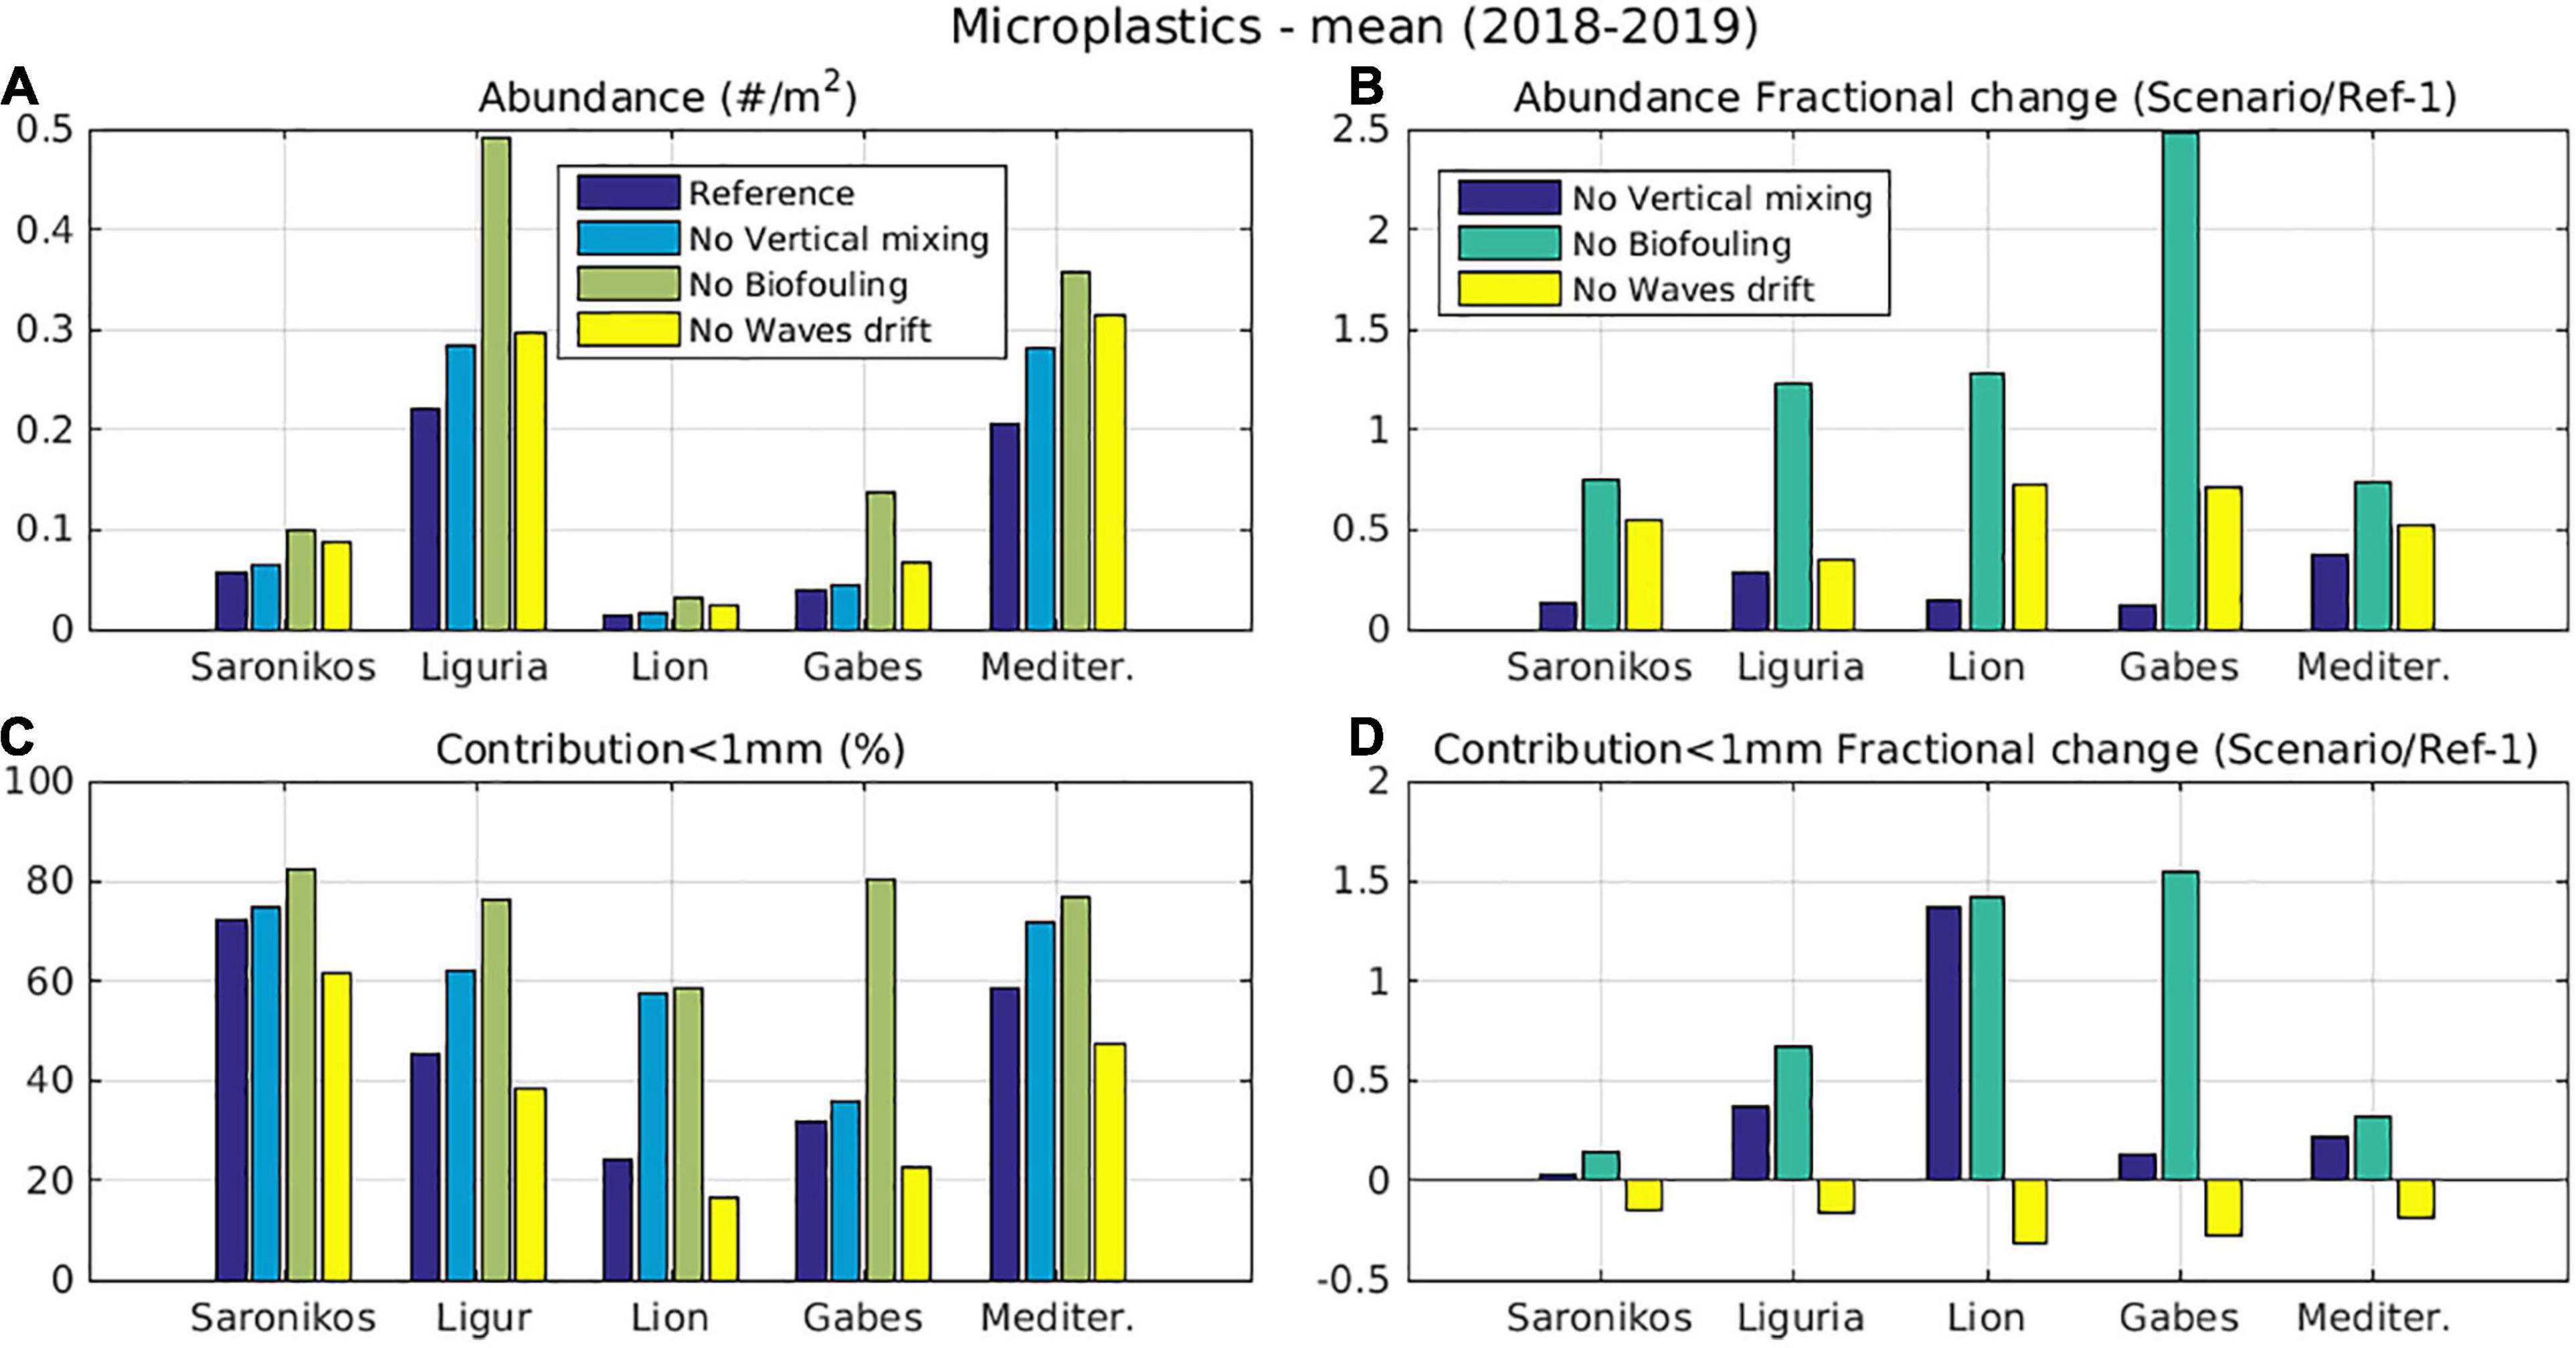
Figure 2. Mean (2018–2019) simulated microplastics (A) concentration (items/m2) (B) contribution <1 mm (%), (C) concentration fractional change (Scenario/Reference-1), and (D) contribution <1mm fractional change (Scenario/Reference-1), with the reference simulation and simulations without vertical mixing, waves drift, and biofouling, averaged in the four key study areas (Saronikos Gulf, Ligurian Sea, Gulf of Lion, and Gabes Gulf) and the Mediterranean.
Similarly, the Gulf of Lion receives MPs from the Ligurian Sea, following the cyclonic circulation in the area (see Supplementary Figure 5). Thus, when biofouling is de-activated in the model, small size MPs, originating from the Ligurian Sea, remain floating and may reach the Gulf of Lion, which may explain the stronger increase of small size MPs in the Gulf of Lion, otherwise dominated by larger particles as compared to Liguria. The effect of vertical mixing and (stokes) drift from waves was also investigated, de-activating those processes in two additional model simulations, in an attempt to gain a better understanding on the dominant drivers in the four different key study areas. Vertical mixing has a stronger effect on smaller size particles, characterized by relatively weaker buoyancy. When this is de-activated an increase of MP abundance and small size contribution is simulated. The latter is stronger in the Ligurian Sea and the Gulf of Lion, which are areas known for intense winter mixing (e.g., Bergamasco and Malanotte-Rizzoli, 2010). The effect of waves drift appears stronger in the Gulf of Lion and Gabes Gulf. Those areas, particularly the Gulf of Lion, are characterized by quite strong predominant wind/waves (see Supplementary Figure 7). In all areas, MPs’ small size percentage contribution decreases, when waves drift is not applied. This is because larger MPs are floating at surface and are more prone to direct drift from waves that may result in their offshore advection (as in the Gulf of Lion) and/or their beaching. Previous model and observational studies, carried out in Gulf of Lion, have highlighted a high beaching probability of the floating debris transported by the Northern Current toward the Balearic Islands (Mansui et al., 2015; Schmidt et al., 2018).
Fine-Resolution Model Simulations and Comparison With in situ Data
In this study, a 2-year simulation over the 2018–2019 period was performed with the fine-resolution models in the four key study areas (Figures 3–6). As mentioned above, sources of MPs were slightly modified from those adopted in the Mediterranean basin-scale simulation in order to obtain a better fit of simulated microplastics with in situ data in this study (Figures 7–9) and other available data in the Ligurian Sea and the Gulf of Lion (see Supplementary Figures 8, 9). More specifically, untreated wastewater in the Ligurian Sea was decreased (× 0.35), as simulated MPs abundance with the Mediterranean model was clearly overestimated in coastal areas (Figures 7–9 and Supplementary Figures 3, 8, 9). This initial overestimation in sources could be related to a possible upgrade of treatment facilities along the Italian coast, with regard to those reported in the UNEP/MAP (2011) report. In the Gulf of Lion, an area with no untreated wastewater sources according to UNEP/MAP (2011), microplastics input with river runoff was increased (× 20) to compensate the underestimation of microplastics abundance with the Mediterranean model (Figures 7–9 and Supplementary Figures 3, 8, 9). This increase is consistent and probably conservative, comparing with estimates based on in situ observations in the River Rhone runoff area (Schmidt et al., 2018), suggesting a river load of ∼3.65 t/year, which is more than 20 times higher than the one (∼0.16 t/year) estimated by Lebreton et al. (2017). This initial underestimation of river inputs could be attributed to Lebreton et al. (2017) global empirical function (tuned using only River Po data) that is strongly influenced by mismanaged plastic production distribution (Mai et al., 2020), being particularly low along the French and Spanish coasts (see Supplementary Figure 2). As there was no information available for untreated wastewater discharge in the Gulf of Lion and the Gabes Gulf, two additional point sources were included at Cortiou WWTP (Tedetti et al., 2012; Savriama et al., 2015; Figure 5), and Gabes port (Figure 6), with their magnitude being tuned based on a best fit with the in situ data (Figure 7). In this respect, the local sewage facility of Cortiou has been already highlighted as a possible source of microplastics in the Bay of Marseille due to the treated wastewater reaching the sea in the southeastern part of the city (Schmidt et al., 2018). Gabes is also a known source of untreated industrial and domestic wastewaters that are continuously discharged in the open sea from the industrial complex of Ghannouch-Gabes and the local municipal WWTP, respectively (El Zrelli et al., 2018; Zayen et al., 2020).
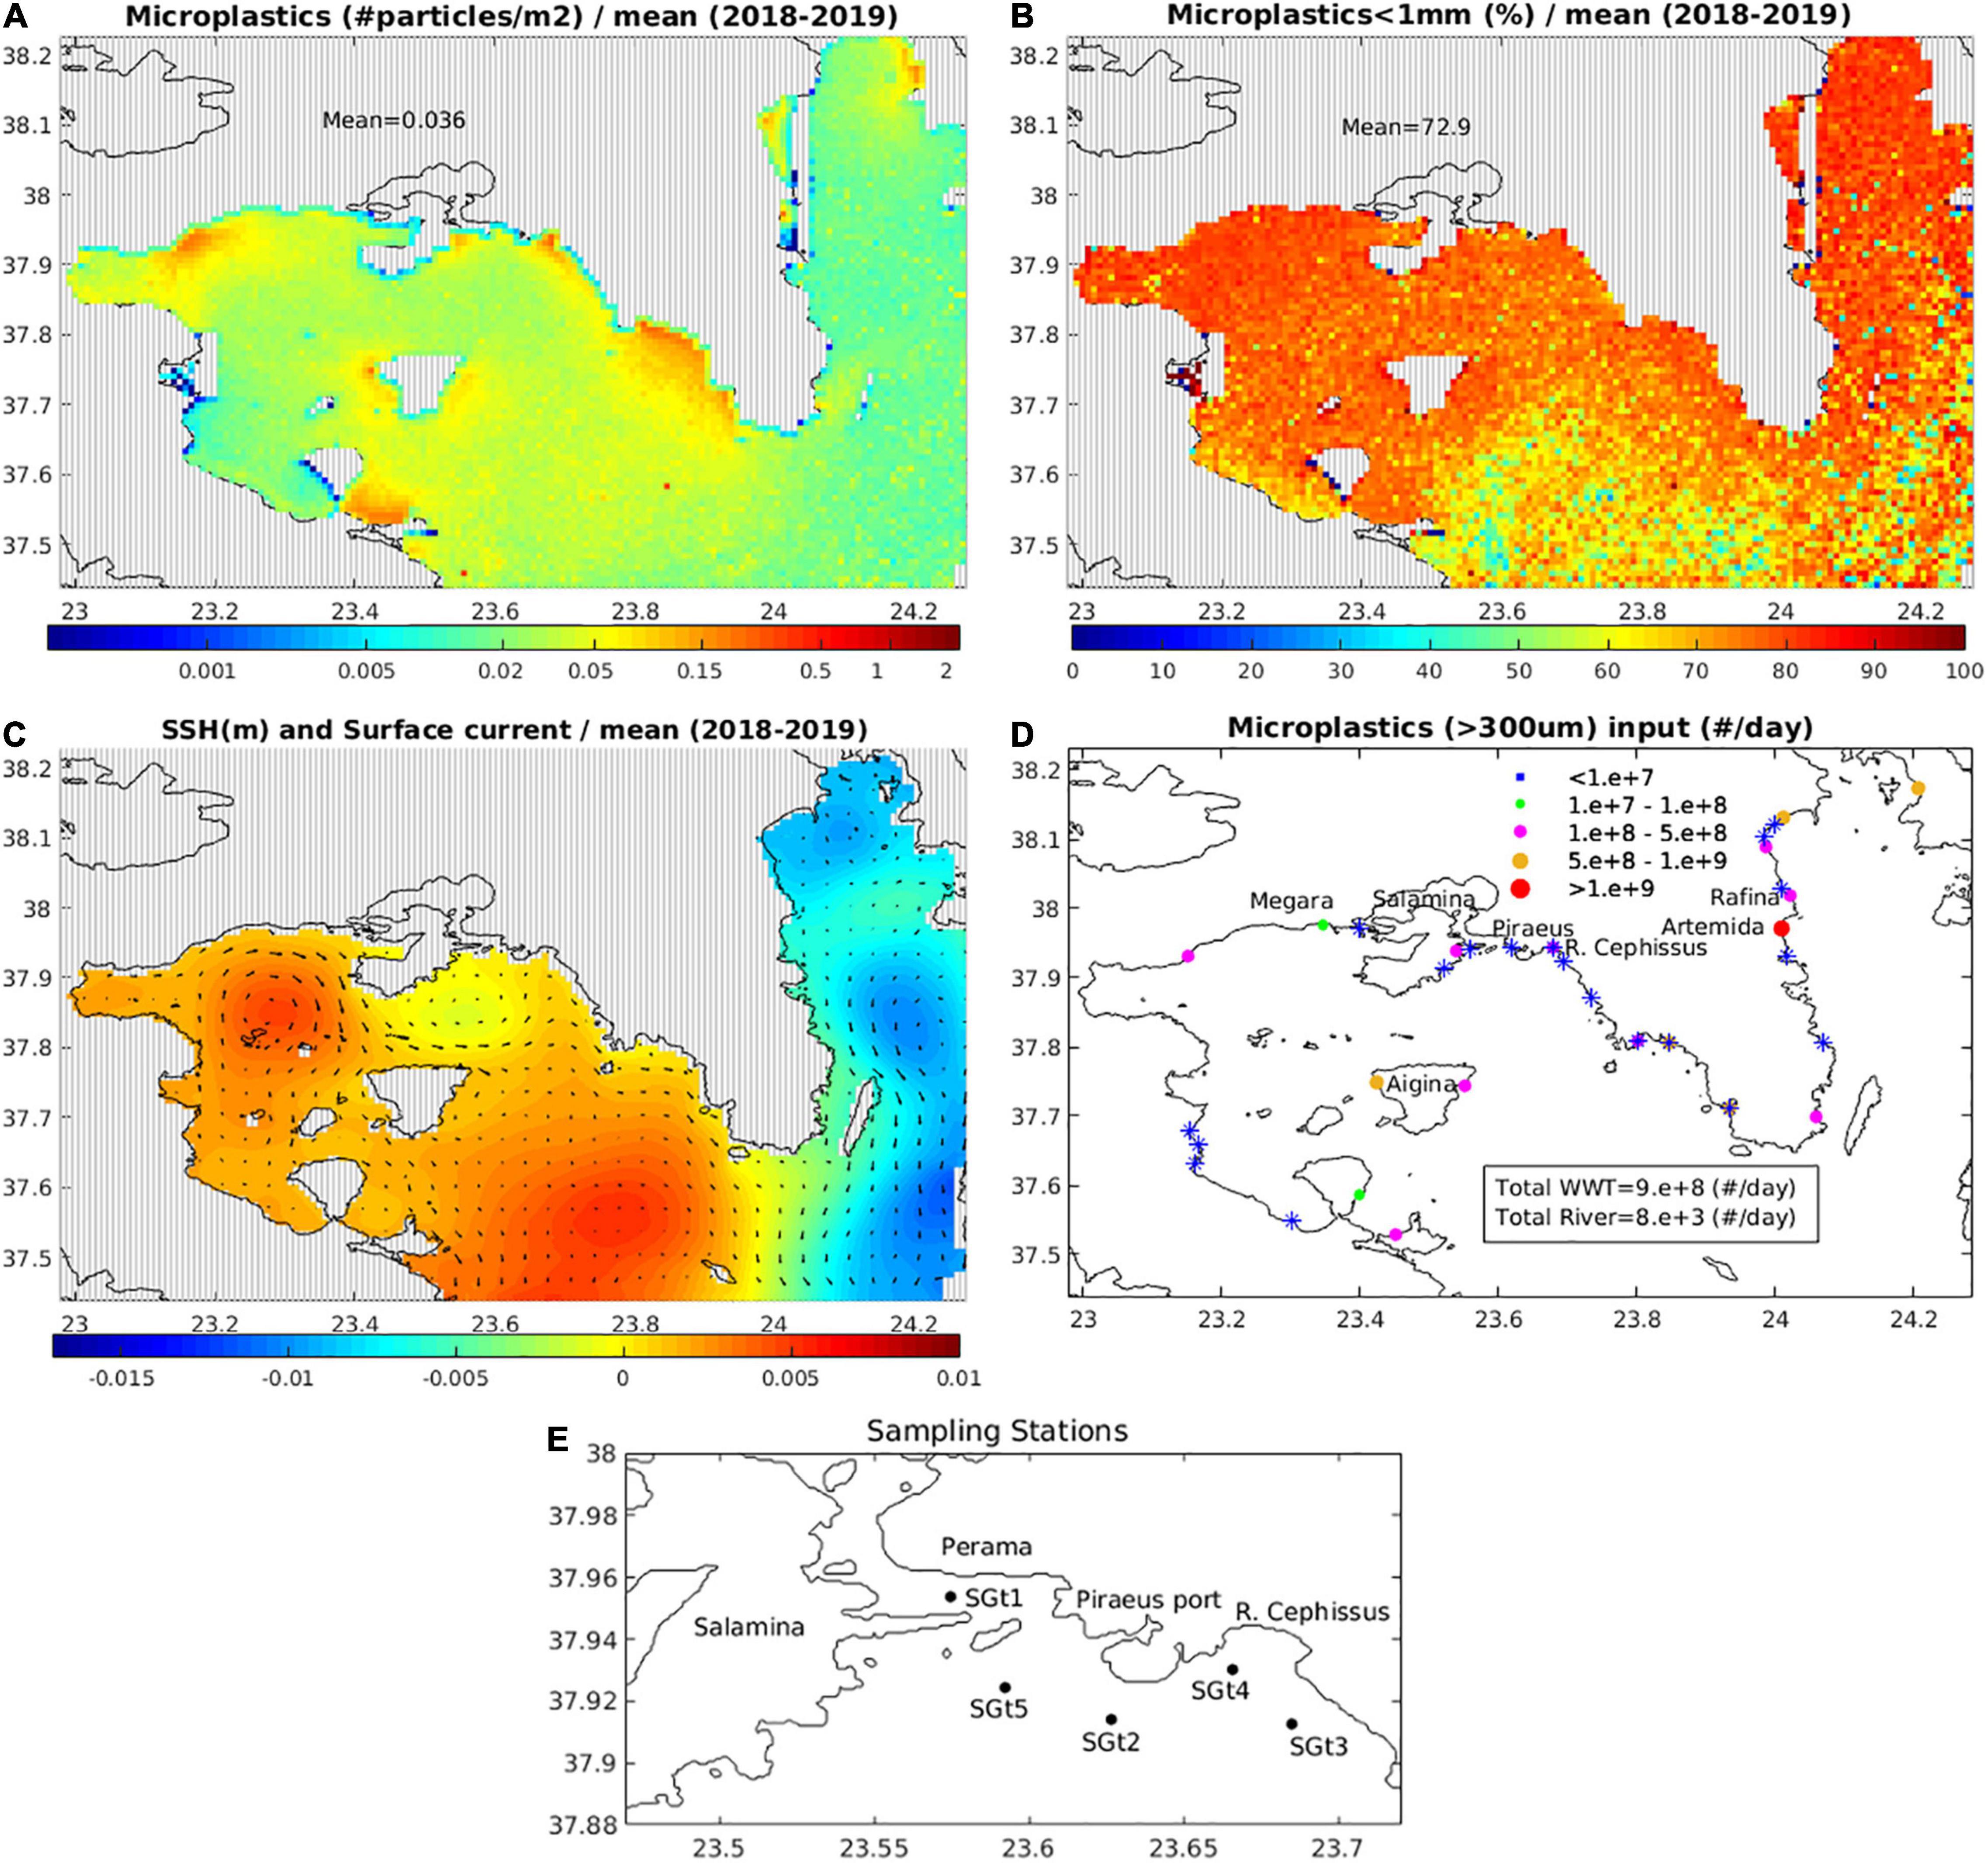
Figure 3. Mean (2018–2019) simulated (A) microplastics concentration (items/m2) (B) microplastics <1 mm (%), (C) surface current and sea surface height (m) and (D) sources of microplastics (items/day) from cities wastewater discharge and river runoff, (E) sampling stations in Saronikos Gulf.
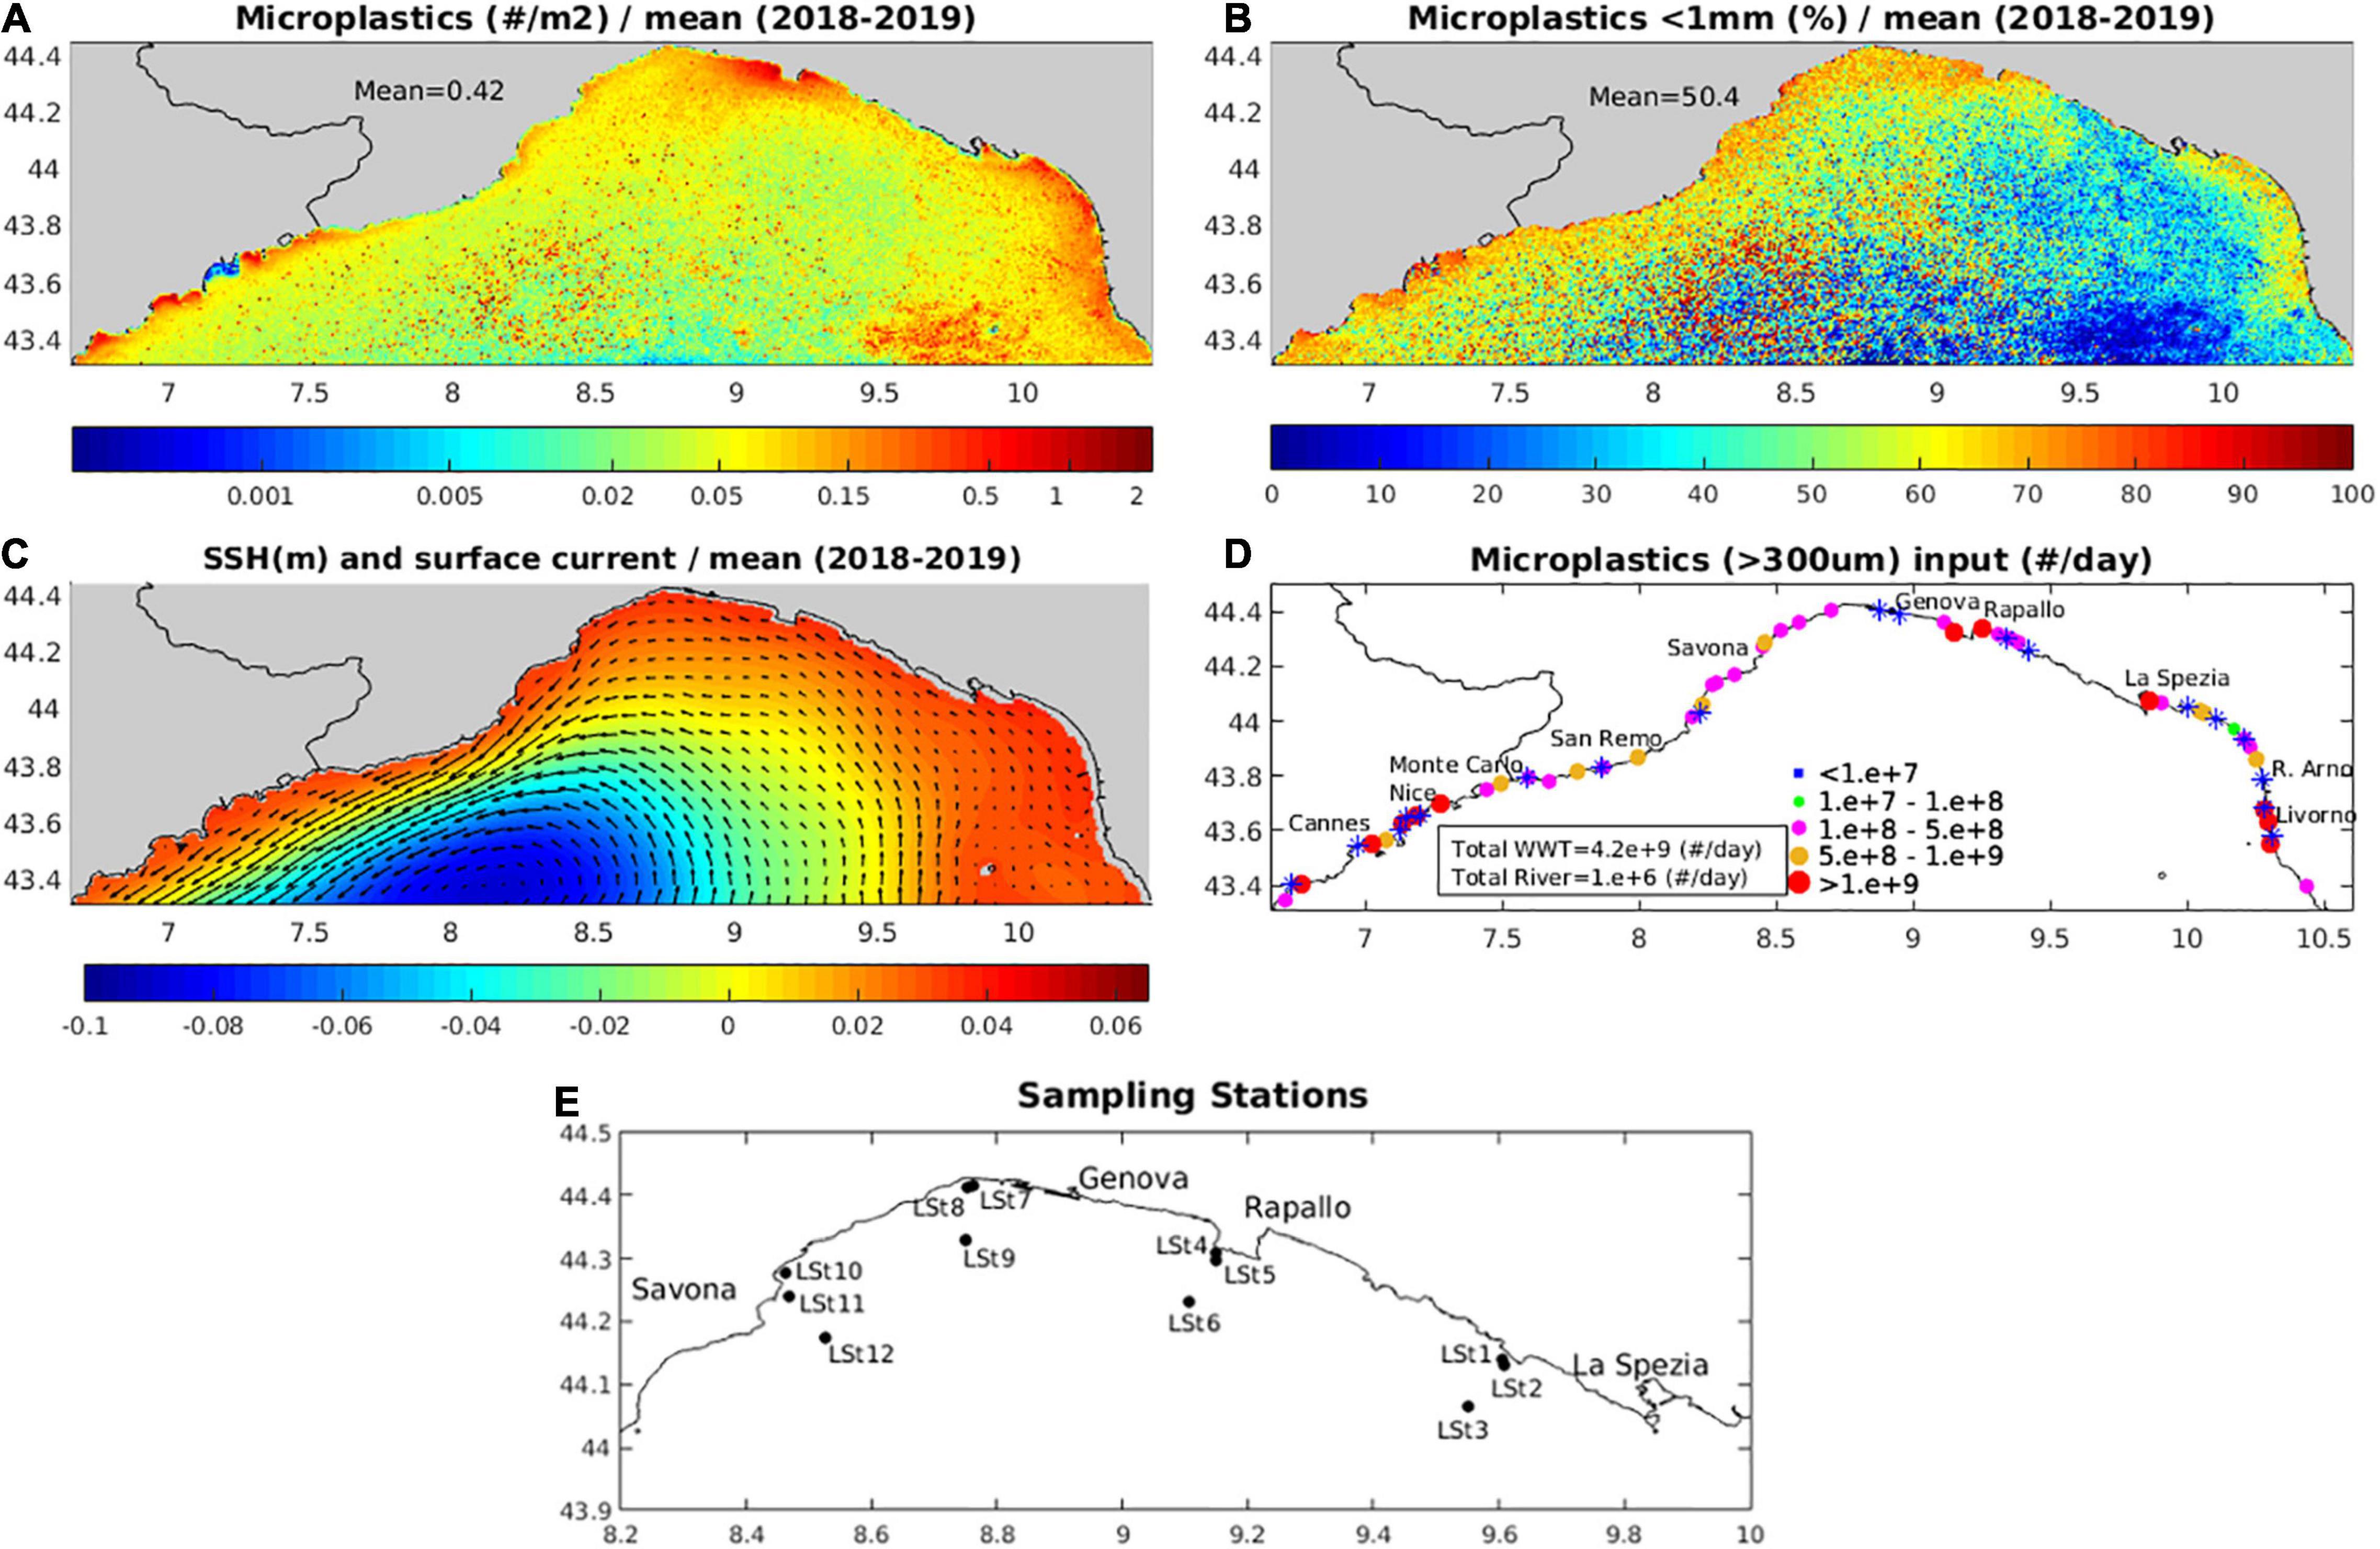
Figure 4. Mean (2018–2019) simulated (A) microplastics concentration (items/m2) (B) microplastics <1 mm (%), (C) surface current and sea surface height (m) and (D) sources of microplastics (items/day) from cities wastewater discharge and river runoff, (E) sampling stations in the Ligurian Sea.
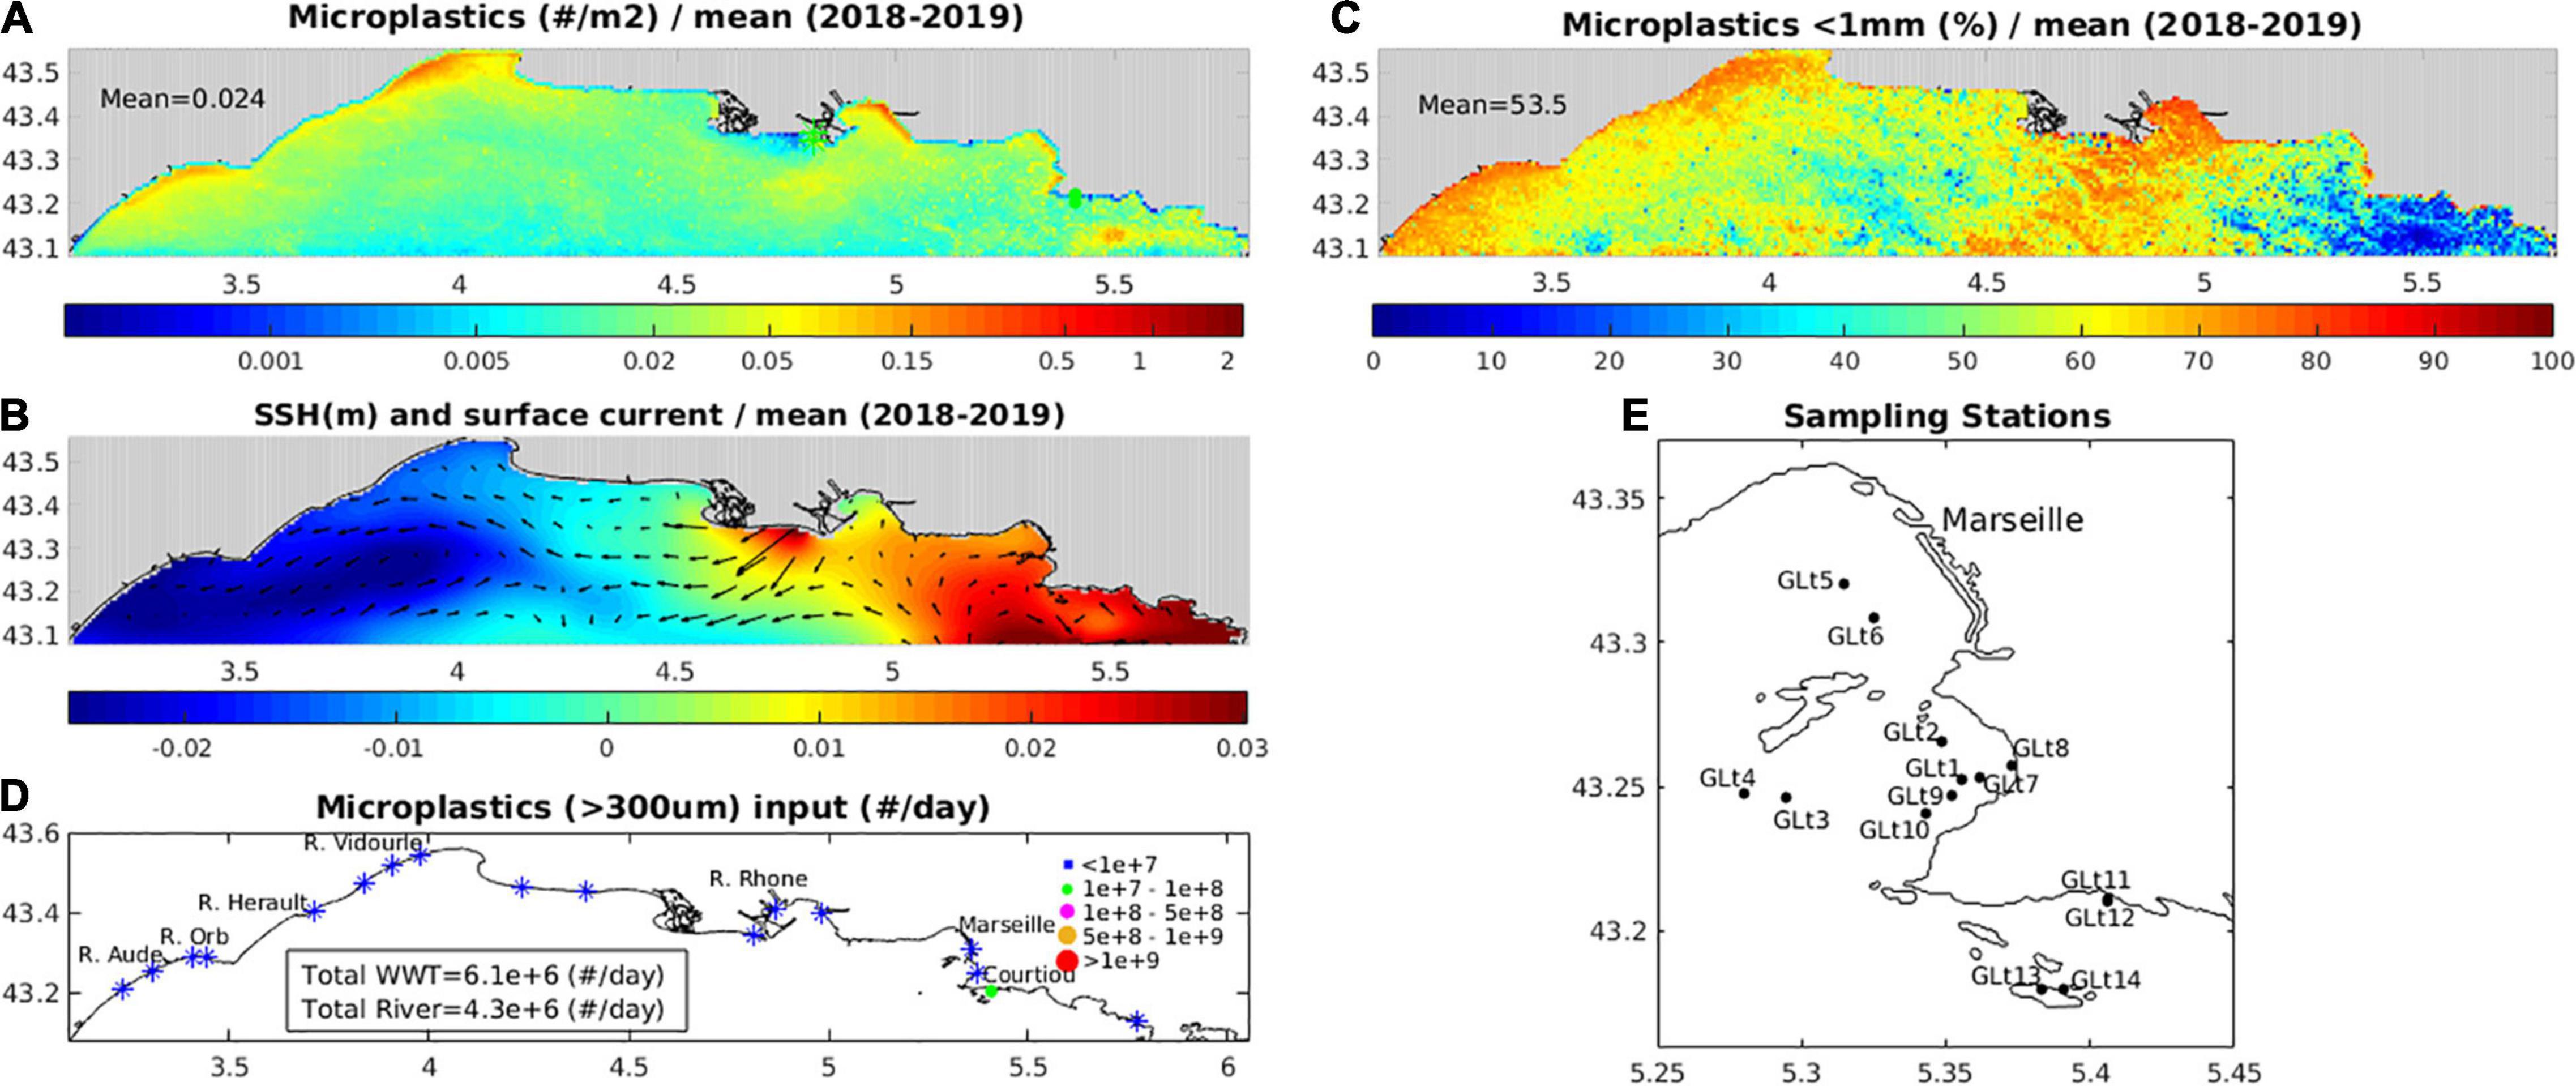
Figure 5. Mean (2018–2019) simulated (A) microplastics concentration (items/m2) (B) microplastics <1 mm (%), (C) surface current and sea surface height (m) and (D) sources of microplastics (items/day) from cities wastewater discharge and river runoff, (E) sampling stations in Gulf of Lion.
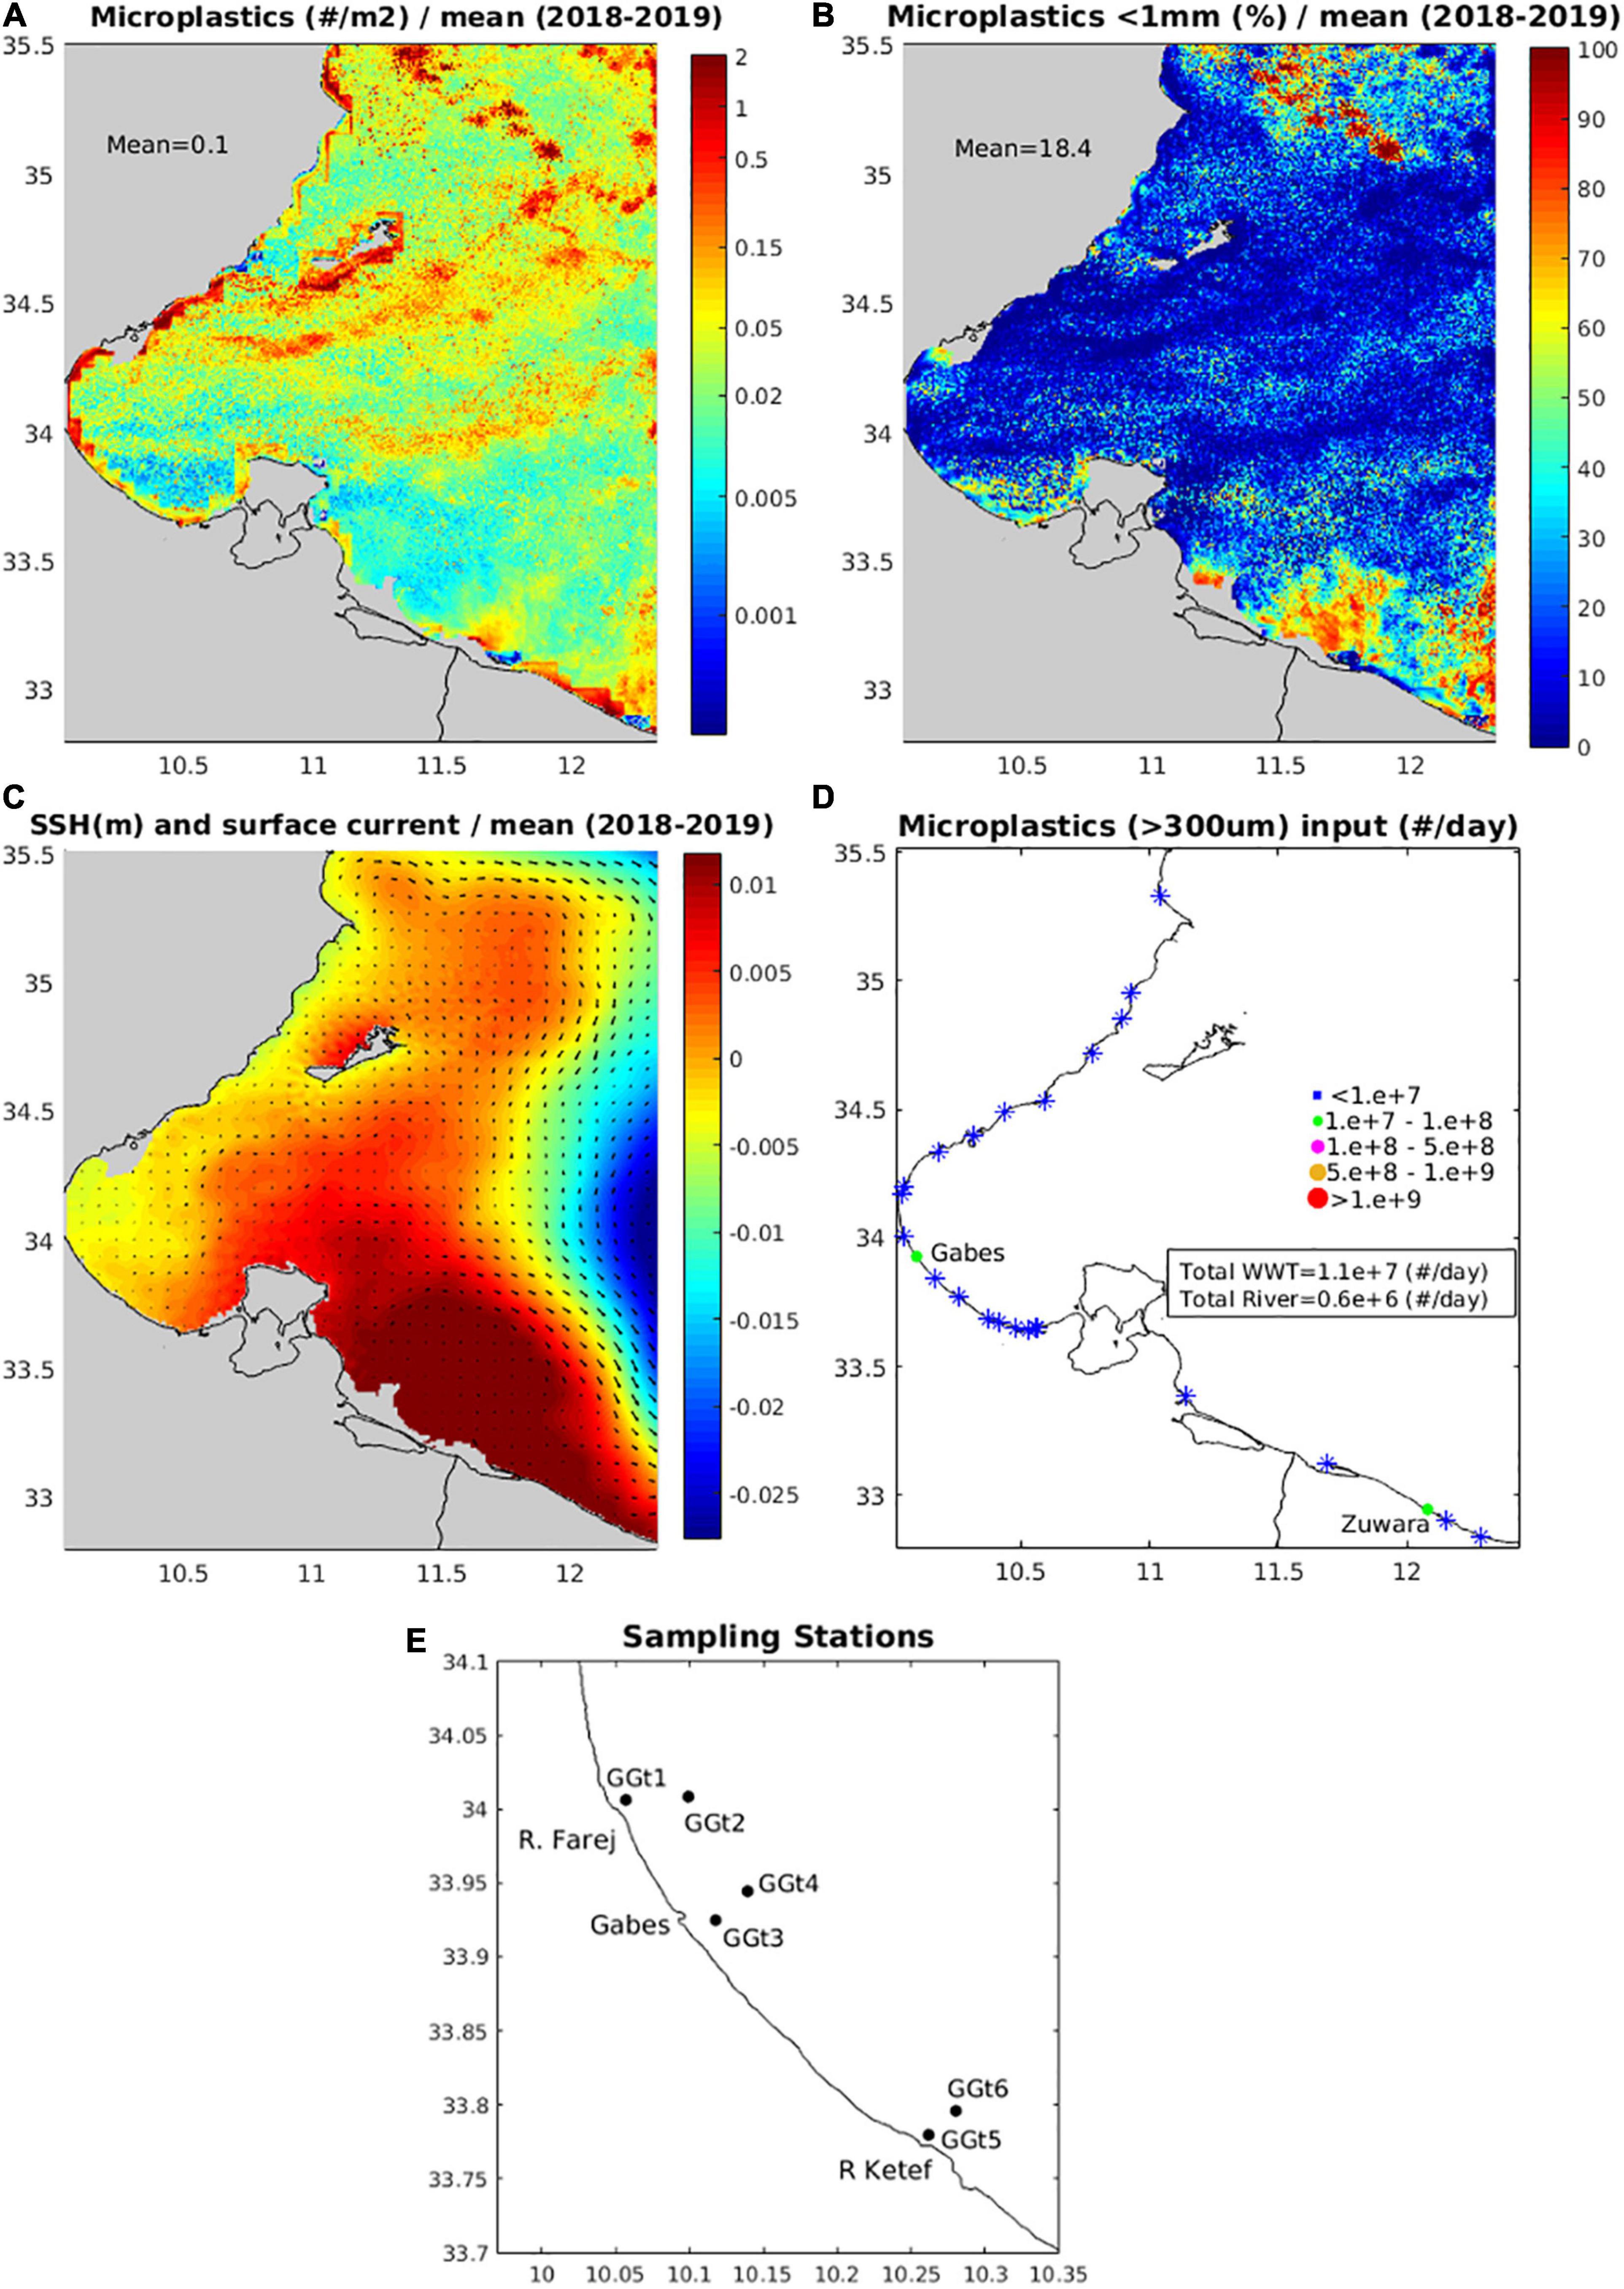
Figure 6. Mean (2018–2019) simulated (A) microplastics concentration (items/m2) (B) microplastics <1 mm (%), (C) surface current and sea surface height (m) and (D) sources of microplastics (items/day) from cities wastewater discharge and river runoff, (E) sampling stations in Gulf of Gabes.
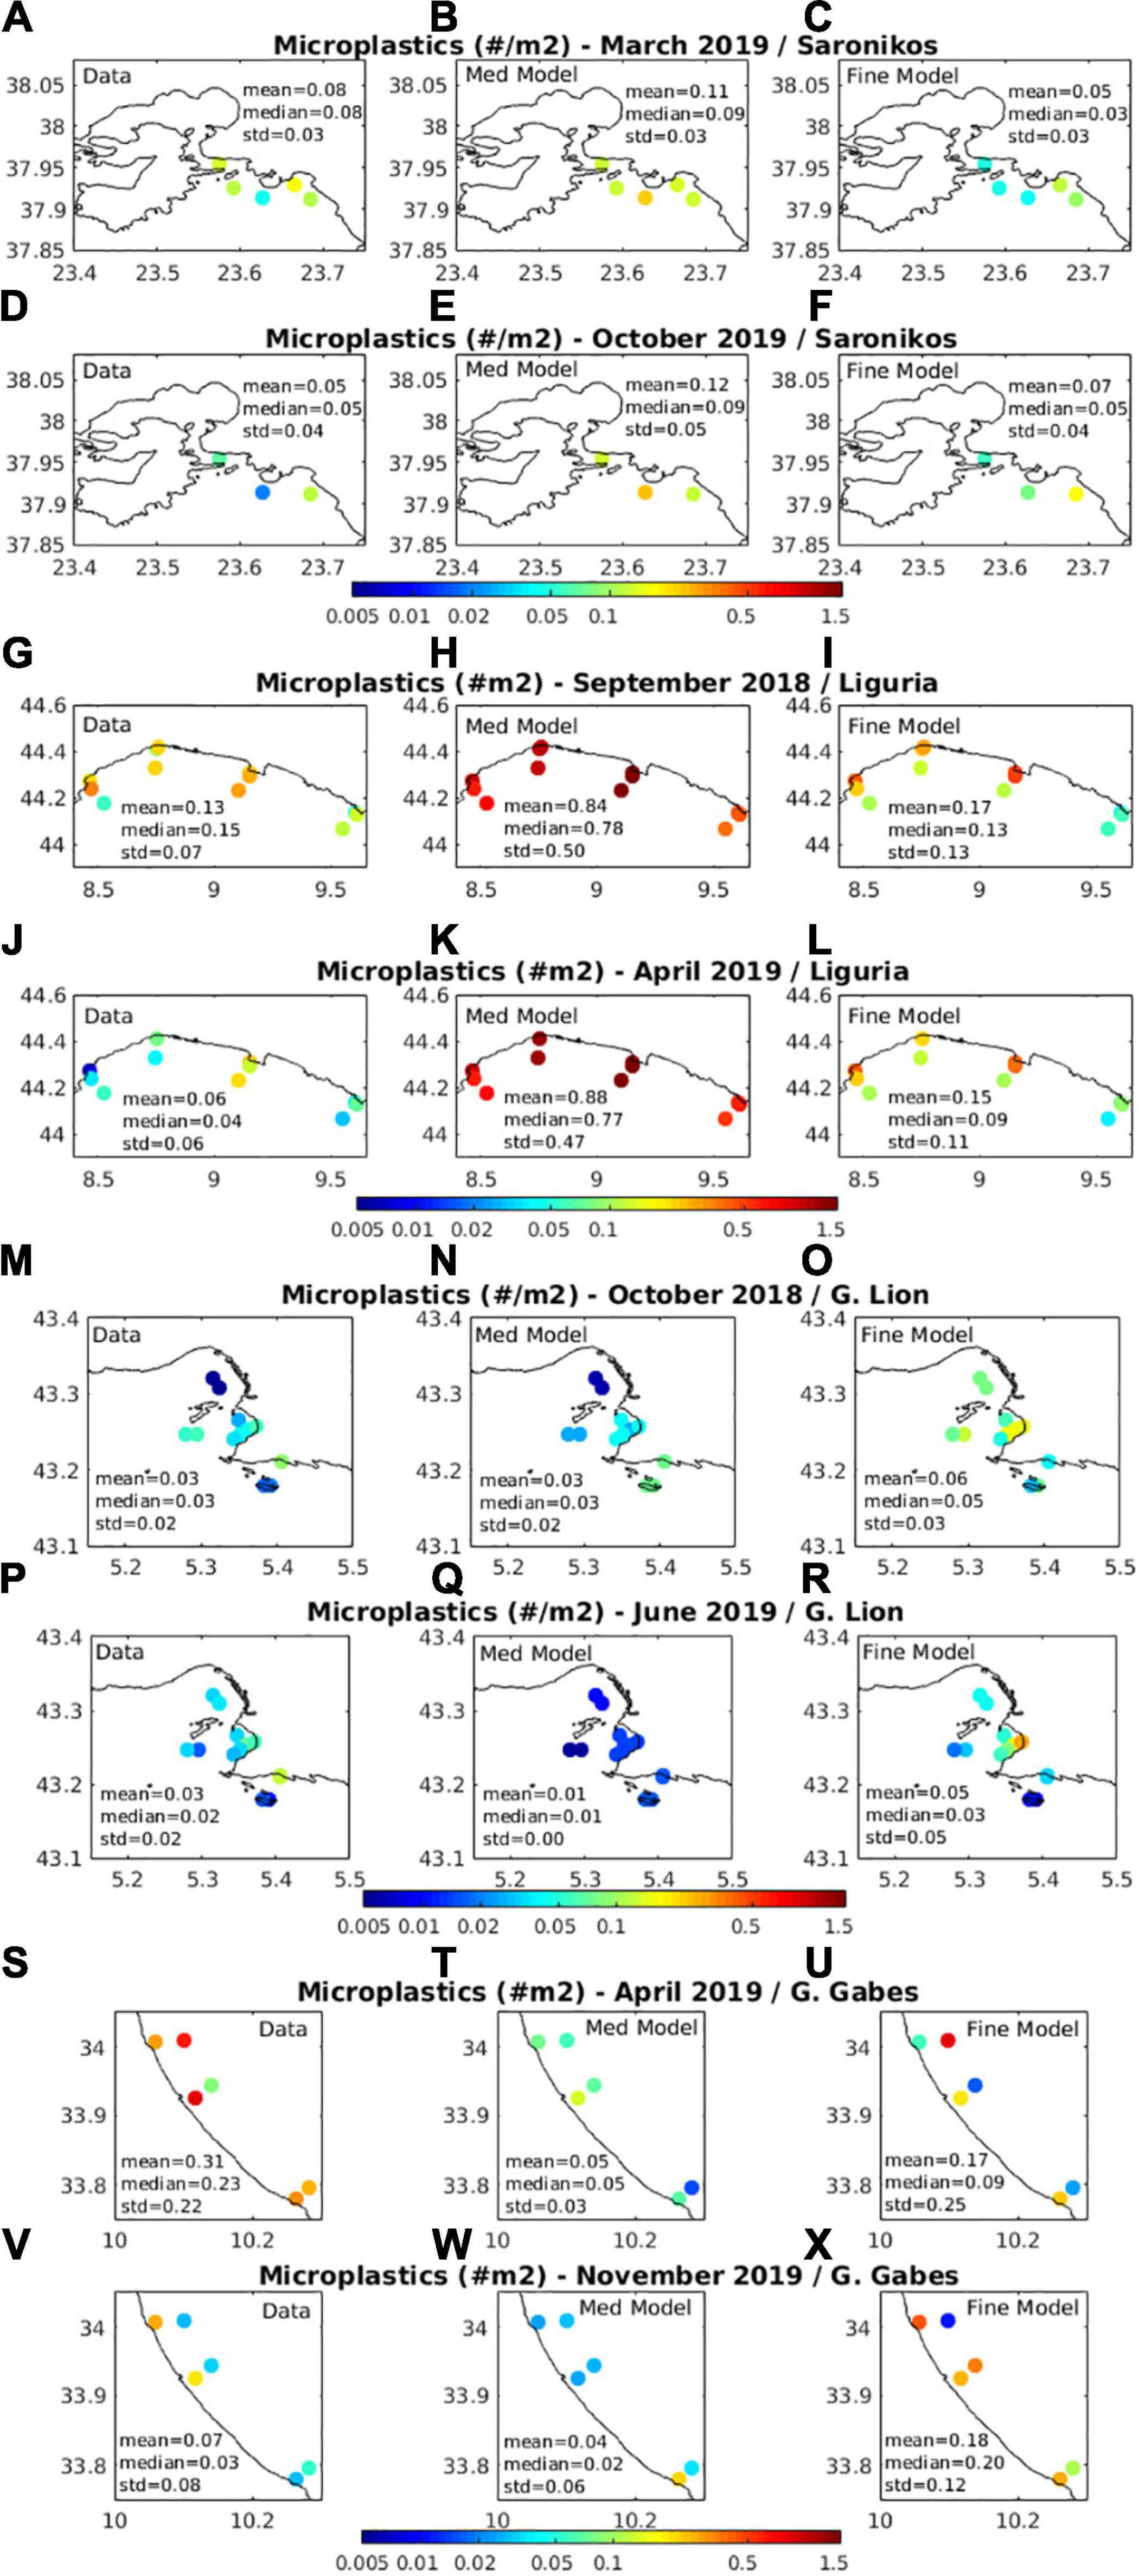
Figure 7. Microplastics abundance (items/m2) simulated with the Mediterranean (Med model) and fine-resolution (Fine model) models, against in situ data collected in the four key study areas, during the two campaigns. (A–F) Saronikos Gulf, (G–L) Ligurian Sea, (M–R) Gulf of Lion, and (S–X) Gulf of Gabes.
Saronikos Gulf
In Saronikos Gulf, the main sources of MPs originate from the untreated wastewater from relatively small cities (population 5–50 K, Figure 3), as there is no untreated wastewater, discharged from the Athens-Piraeus (>3 million inhabitants) WWT facility. However, there is some important wastewater input from the Metamorphosis WWTP, serving part of Athens population, which is discharged into the Cephissus River. The simulated mean (2018–2019) MPs abundance (∼0.036 #/m2 on average) and small size contribution (∼72.9% on average) is shown in Figure 3. This is higher close to local sources, while the anti-cyclonic (eastward) predominant circulation, known also from observations (Kontoyiannis, 2010) results in the southward advection of particles from the Northern coastal areas to South Aegean.
The sampling in Saronikos Gulf revealed an average MP concentration of 0.080 items/m2 during the first campaign (March 2019, Figures 7, 9). Among the five sampled stations, the lowest value (0.03 items/m2) was found in station SGt2 (close to the Piraeus port) and the highest was found in station SGt4 (Cephissus urban river) with a concentration of 0.12 items/m2. The high MPs concentration in this area is most probably related to the wastewater discharge from Metamorphosis WWTP, mentioned above. During the second campaign (October 2019), three (SGt1, SGt2, and SGt3) out of five stations were analyzed, showing an average MPs abundance of 0.047 items/m2. The value found in SGt3 (0.083 items/m2) was higher than the one found during the first campaign (0.073 items/m2), while a lower MPs abundance was found in stations SGt1 and SGt2 (0.045 and 0.012 items/m2, respectively) if compared to those found during the first campaign (0.093 and 0.029 items/m2, respectively). The simulated MPs abundance with the fine model in the different stations appears in reasonable agreement with in situ data (Figures 7A–F), capturing the observed magnitude and the relatively higher concentration in the vicinity of Cephissus River runoff. The simulated abundance is, opposite to the data, slightly lower during the first campaign, in spring (Figure 9), which is related to a decrease of the microplastics concentration during the less stratified period (see below discussion in section “Seasonal Variability”). On the other hand, the observed higher concentrations during spring (first campaign) might be related to a seasonality in source inputs that is not considered in the model. The simulated small size contribution (∼75%) was significantly overestimated, as compared to the data (13–23%) (Figures 8, 9). This model deviation might be related to an underestimated inflow of (larger size) MPs from other remote areas, as the model simulation suggests that MPs in this semi-enclosed gulf are mainly originating from local sources.
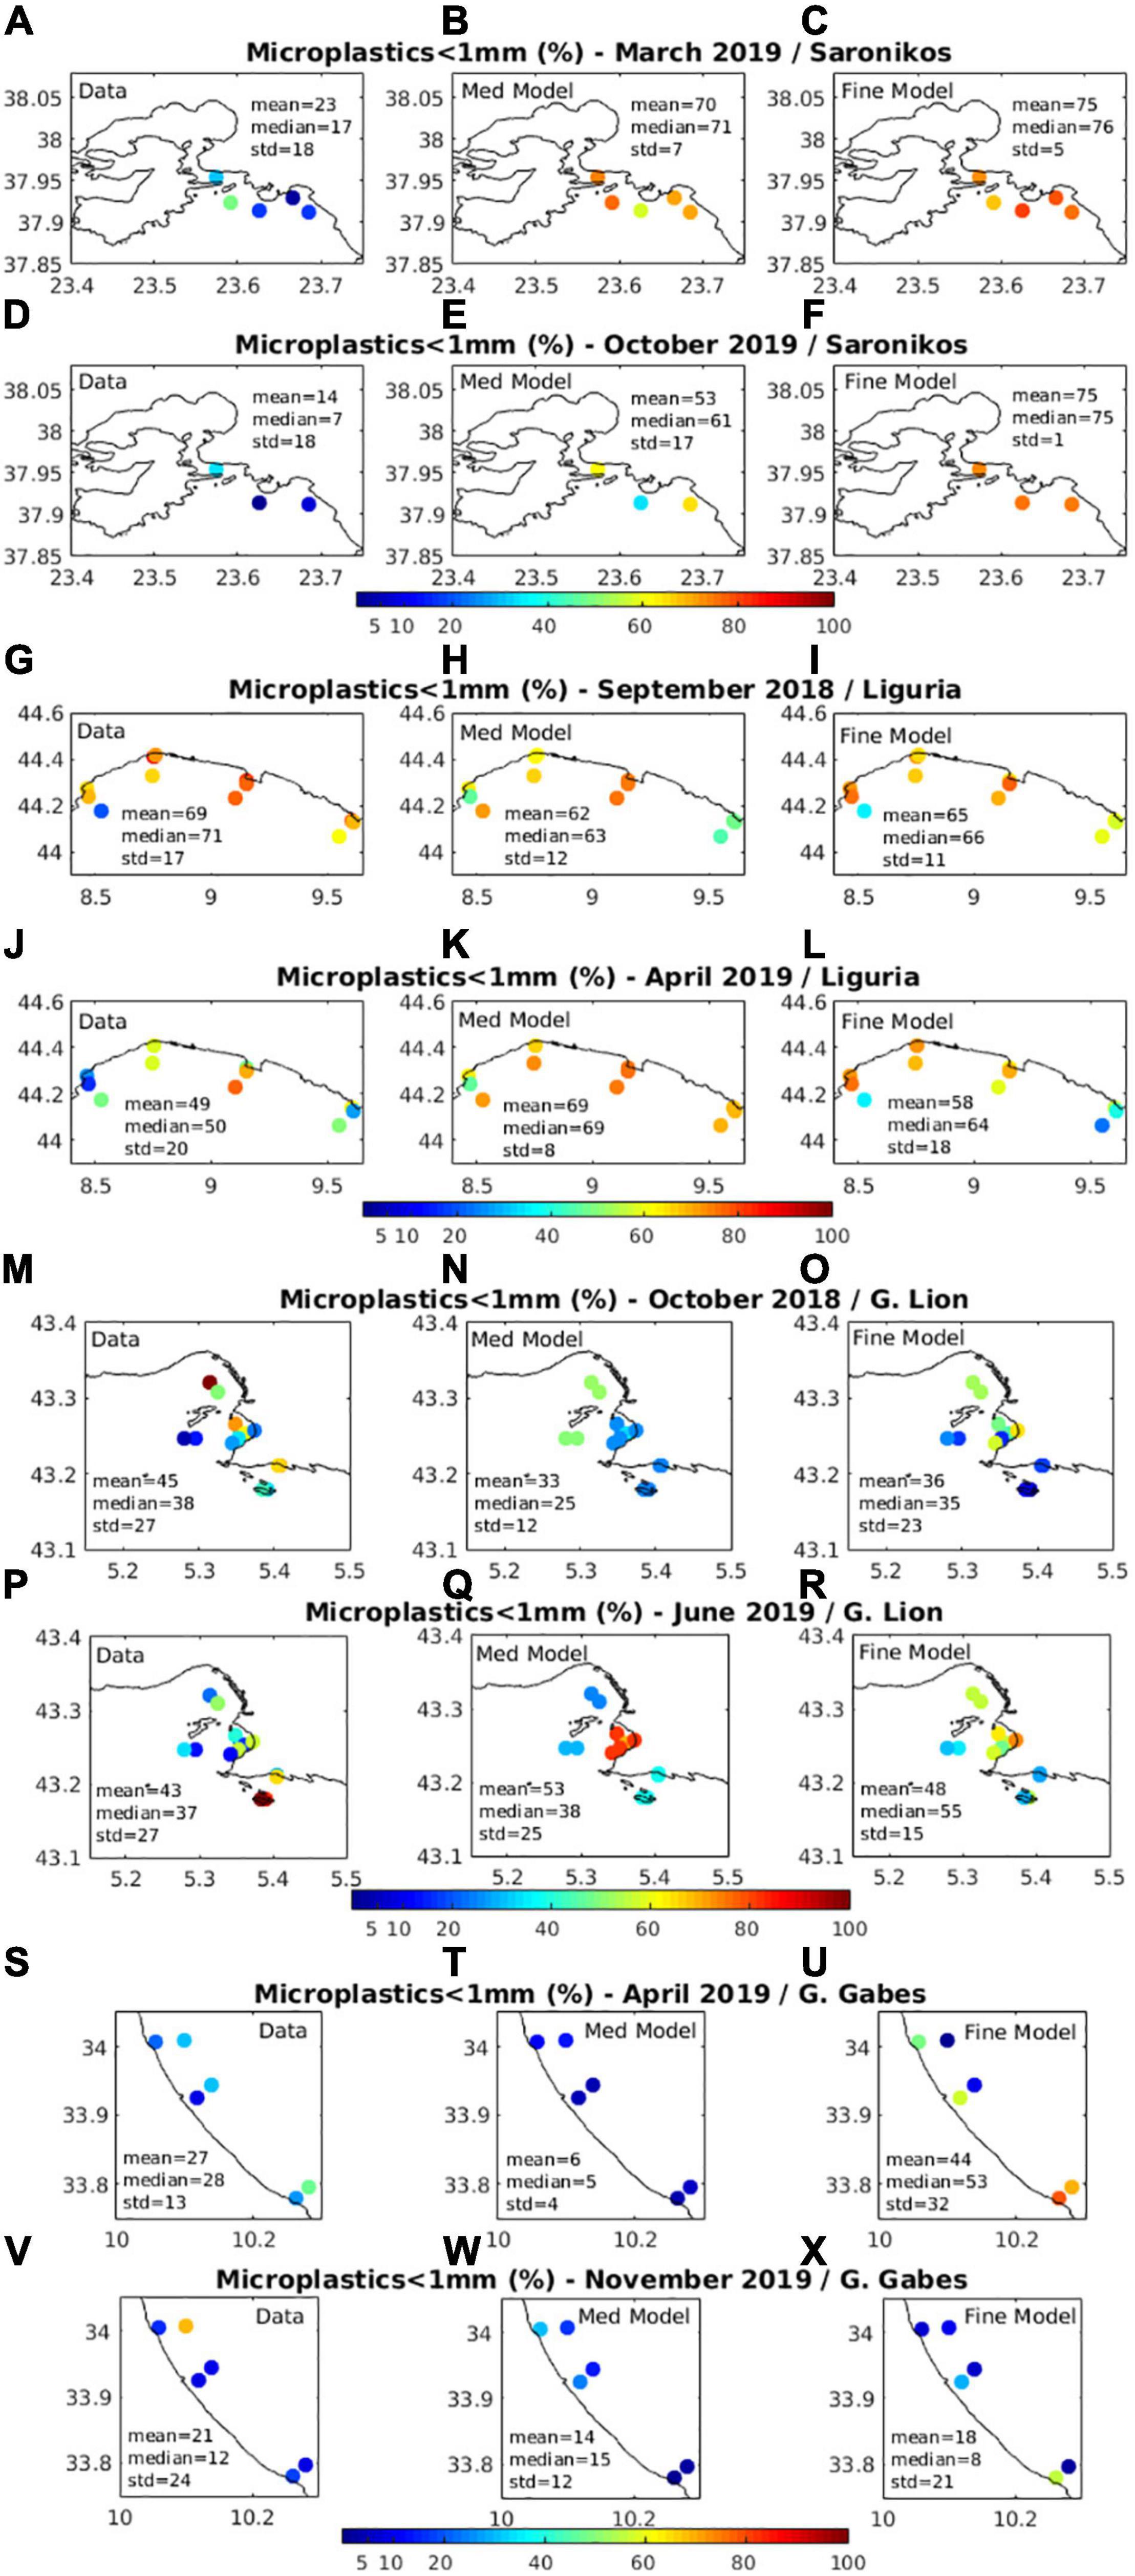
Figure 8. Microplastics small size (<1mm) contribution (%), simulated with the Mediterranean (Med model) and fine-resolution (Fine model) models, against in situ data collected in the four key study areas, during the two campaigns. (A–F) Saronikos Gulf, (G–L) Ligurian Sea, (M–R) Gulf of Lion, and (S–X) Gulf of Gabes.
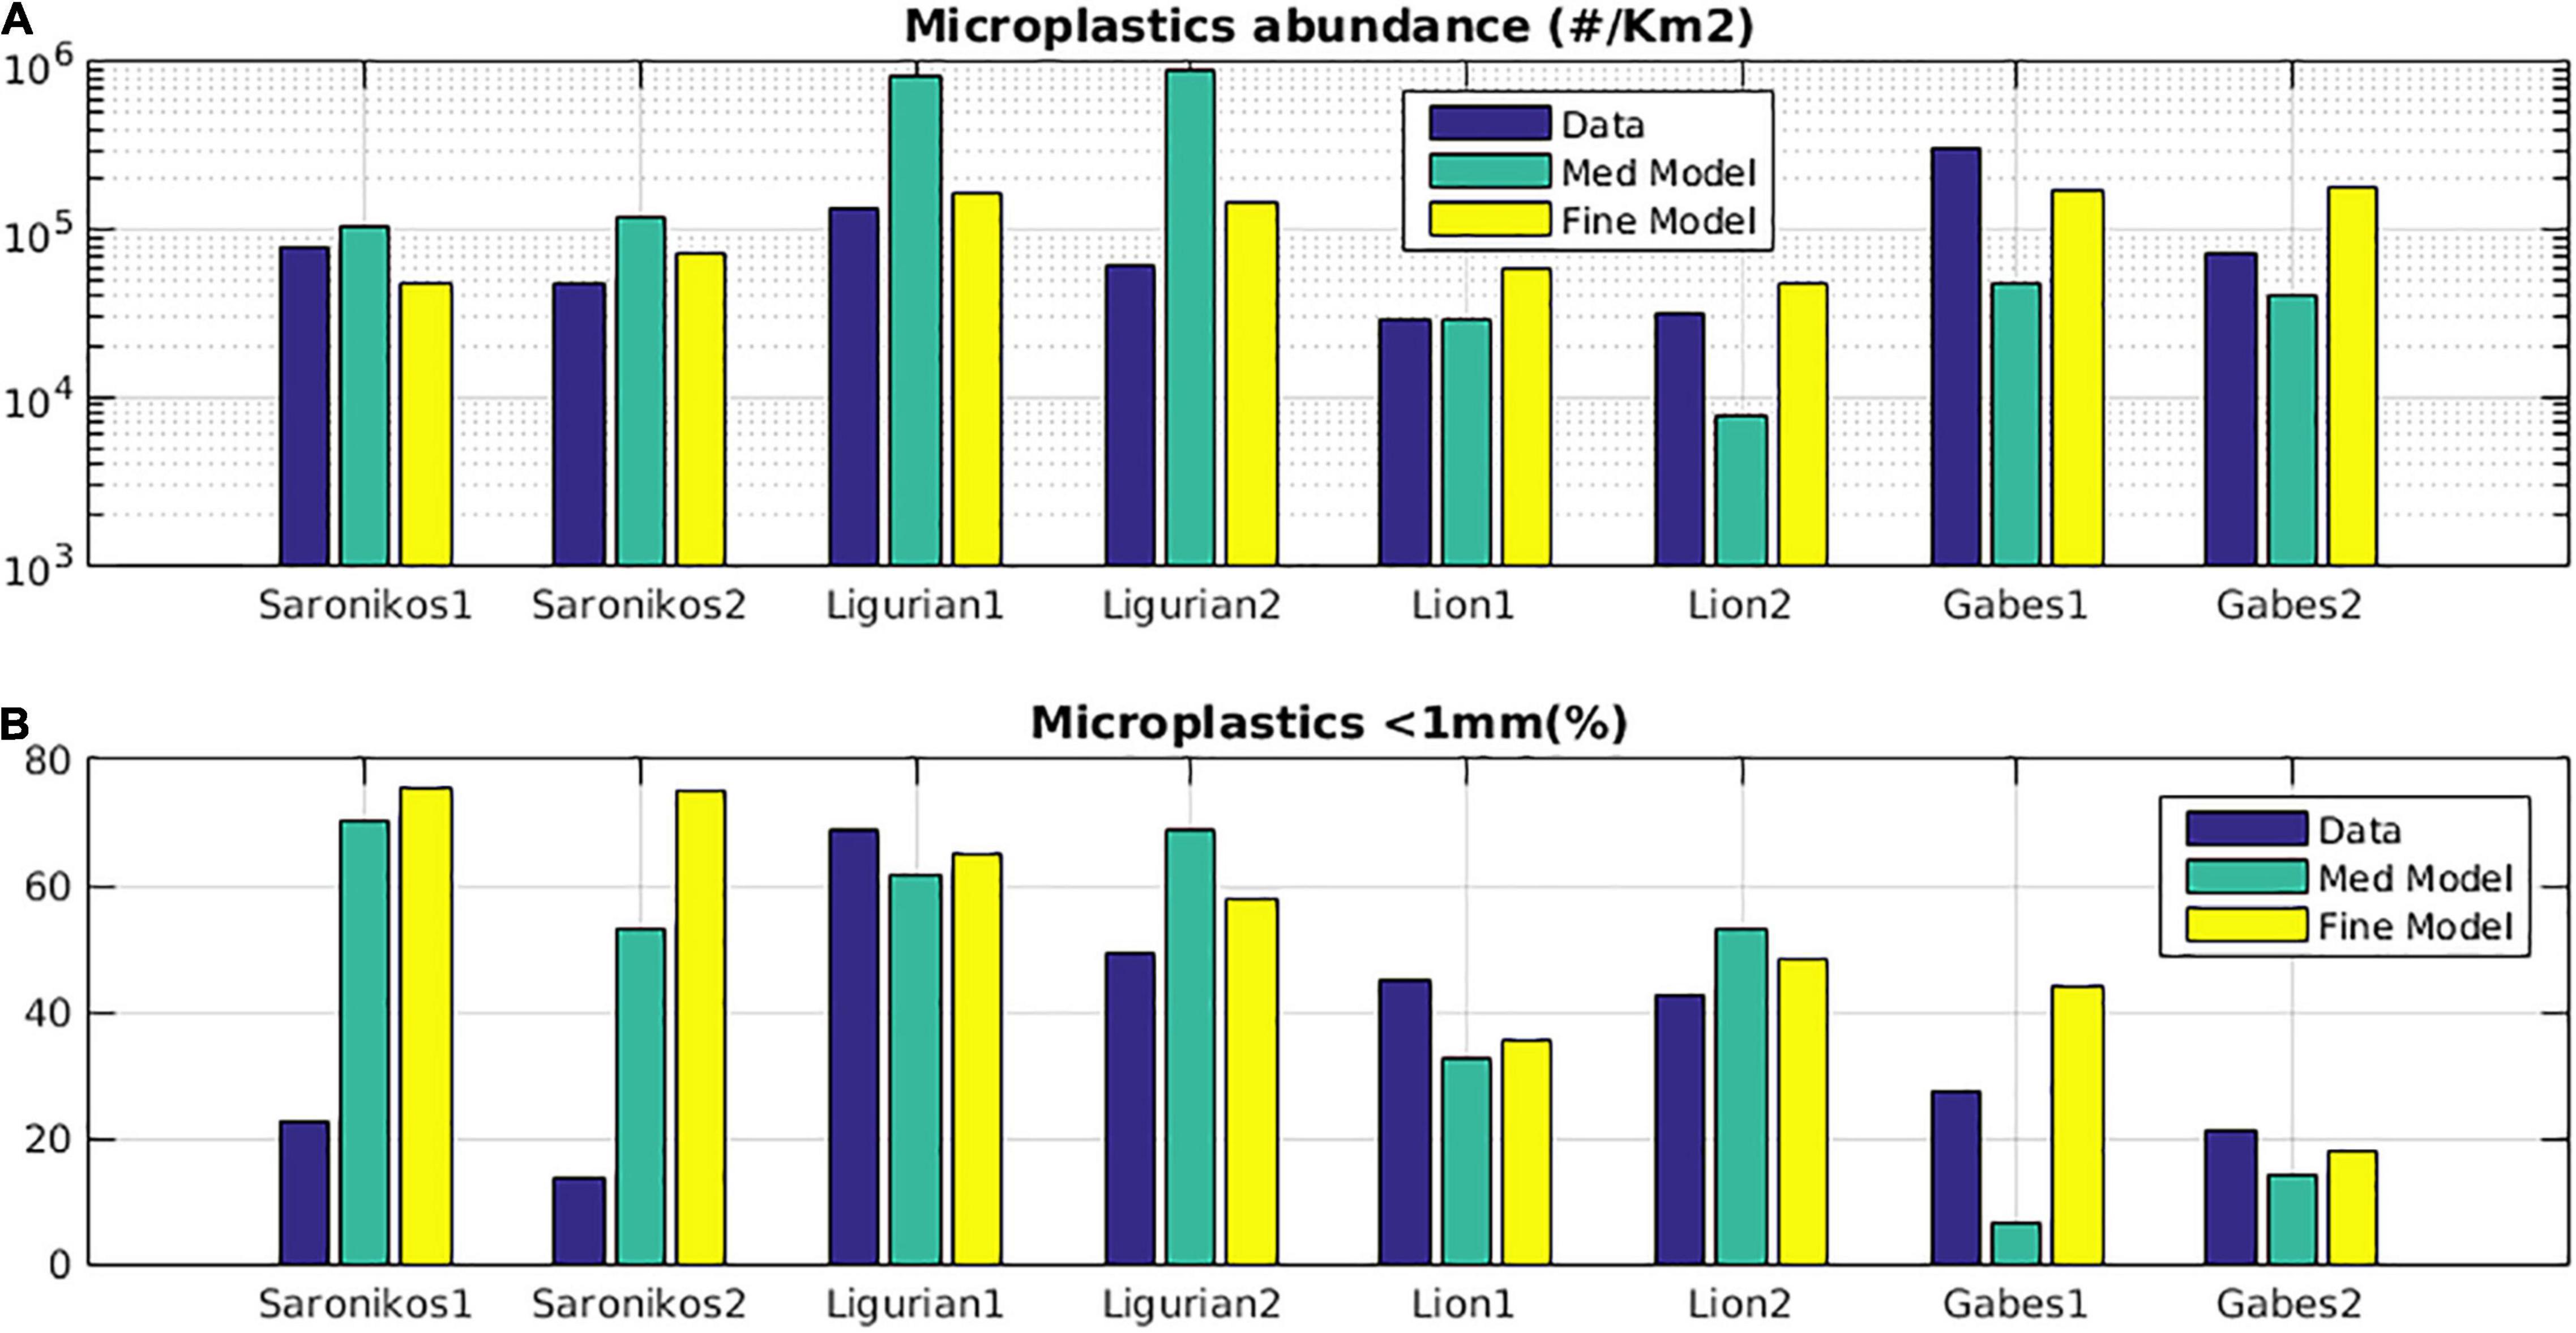
Figure 9. Microplastics (A) mean abundance (items/m2) and (B) small size (<1mm) contribution (%), simulated with the Mediterranean (Med model, green bars) and fine-resolution (Fine model, yellow bars) models, against in situ data (blue bars) collected in the four key study areas (Saronikos Gulf, Ligurian Sea, Gulf of Lion, and Gulf of Gabes), during the two campaigns.
The MPs abundance (mean = 0.8 × 10⁵ items/km2 during spring 2019 and 4.7 × 10⁴ items/km2 during autumn 2019), obtained from sampling in Saronikos Gulf, fall in the same range with outputs from campaigns during 2015 and 2016 (3.5 × 10² items/km2 – 9.2 × 10⁵ items/km2) (Adamopoulou et al., 2021). Interestingly, in the latter study, the maximum MPs concentration for the Aegean and Ionian Seas was not found in areas in the proximity of the anthropogenic sources, suggesting that the relationship between them is not easily predictable.
Ligurian Sea
In the Ligurian Sea, the simulated MPs abundance and small size contribution (Figure 4) appear higher close to the most important sources (Genova Metropolitan Area in the northern coast and La Spezia, Livorno on the eastern coastal area), following the pattern of the along-slope cyclonic circulation that results in the convergence of microplastics on the northwestern coastal areas. The decrease of small size contribution in the southeast is related to the inflow of larger size MPs, originating from the Tyrrhenian Sea (see Figure 1). Due to their stronger buoyancy, larger MPs are floating close to the surface, being able to travel long distances in the open sea. Thus, the distribution of small size MPs may be considered as an indicator on the effect from local sources.
The sampled MPs’ abundance was found higher for most stations in the first (autumn) campaign (0.134 items/m2 on average), as compared to the second (spring) campaign (0.061 items/m2 on average) (Figures 7, 9). The only exceptions were stations LSt1 and station LSt4, both at 0.5 miles from the coast that showed similar values in both campaigns. LSt4-5-6 sampling stations, located in the MPA of Portofino, confirmed to be the most MP-impacted of all in the Ligurian Sea, showing the highest MPs mean abundance in both campaigns (autumn 2018: 0.191 items/m2 on average spring 2019: 0.144 items/m2 on average). This was captured by the model (Figures 4, 7), showing also the highest MPs abundance in this area, receiving a significant amount of wastewater discharge (Figure 4) from Genova and nearby touristic areas. These findings are in line with previous studies on the same key study area that already indicate this MPA as a “hotspot” for marine plastic debris (Collignon et al., 2012; Fossi et al., 2012). The model also captured the relatively lower MPs concentration in LSt1-2-3 stations (autumn 2018: 0.070 items/m2 on average spring 2019: 0.031 items/m2 on average), being an area with limited sources, close to the MPA of Cinque Terre, while a slight overestimation was simulated during the second campaign in northwest stations close to Genova and Savona harbors (LSt10-11-12 and LSt7-8-9). The latter (LSt11, 1.5 miles from the coast) recorded the highest MPs abundance (0.259 items/m2) during the first campaign, followed by LSt6 (0.216 items/m2, 6 miles from the coast) and LSt5 (0.197 items/m2, 1.5 miles from the coast). High concentrations were also found in other LSt7-8-9 (0.127 items/m2 on average) and LSt10-11-12 (0.148 items/m2 on average) stations, close to Savona and Genova harbors, which, however were not repeated in the second (spring) campaign (LSt7-8-9: 0.039 items/m2 on average, LSt10-11-12: 0.022 items/m2 on average). In agreement with observations, the model simulated an overall decrease of MPs abundance during spring period, particularly when considering the average of stations area, which is attributed to stratification variability (see below discussion in section “Seasonal Variability”). The MPs small size (<1 mm) contribution, both from in situ data and model, generally followed the MPs abundance variability, being related to source inputs (Figures 8, 9).
Gulf of Lion
In the Gulf of Lion, main sources of MPs (>300 μm) were assumed to originate from major rivers runoff (Rhone, Herault, Aude, Orb, and Vidourle) in the area (Figure 5), as reported untreated wastewater for all cities was zero in UNEP/MAP (2011) report for WWT discharge. In the fine-resolution model, an additional point source was included in Cortiou WWTP location (Figure 5), with its magnitude being tuned based on a best fit with the in situ data (see Supplementary Figures 8, 9). The simulated MPs abundance appears higher in river runoff areas (Figure 5), with its distribution being also influenced by the westward predominant northern-current (Millot, 1991; Ourmieres et al., 2018), as part of the Lion-gyre cyclonic circulation that results in the convergence of MPs on the northwestern coastal areas. The simulated low small size (<1 mm) contribution in the southeast indicates an input of MPs, originating from the Ligurian Sea (see Figure 1 and Supplementary Figure 5).
During the first campaign (autumn 2018), an average MPs abundance (Figures 7, 9) of 0.029 items/m2 was found, ranging from 0.002 items/m2 (GLt5-6) to 0.077 items/m2 (GLt11). A similar average (0.032 items/m2) was found during the second campaign (spring 2019), with maximum values again recorded close to Cortiou WWTP (GLt12, 0.090 items/m2) and in the proximity of the Huveaune river plume (GLt7-8 0.050 and 0.042 items/m2, respectively). Minimum MPs abundance (0.007 items/m2) was found on the border of the Calanque National Park (GLt13). The simulated MPs abundance with the fine model (Figures 7, 9) was comparable with observations, showing similar mean values during both periods and higher MPs concentrations in the vicinity of Cortiou WWT and River Huveaune runoff. The simulated MPs small size (<1 mm) contribution generally follows the MPs abundance variability, showing a similar average with the in situ data, which does not seem to follow a clear pattern (Figures 8, 9).
The observed MPs abundance (mean = 2.9 × 10⁴ items/km2 during autumn 2018 and 3.1 × 10² items/km2 during spring 2019) in the Gulf of Lion is comparable with results reported from the same area between 2014 and 2016 (6 × 10⁴ – 1 × 10⁵ items/km2; Schmidt et al., 2018). In this latest study, Schmidt et al. (2018) found the highest value of MP concentration in seawater samples collected in the Bay of Marseille, including the area in proximity of Marseille-Cortiou WWTP, in agreement with the results observed in this study.
Gulf of Gabes
In the Gulf of Gabes, a high MPs abundance was simulated (∼0.1 #/m2 on average), despite the relatively low source inputs (Figure 6), mainly originating from river runoff and the Gabes port. The particularly low small size (<1 mm) contribution (∼21% on average) suggests that a large portion of the MPs in this area belong to the (floating) larger size classes that are advected from offshore areas, either from waves drift (see below discussion in section “Seasonal Variability”) or following the predominant circulation driven by the Atlantic-Ionian stream (Figure 6 and Supplementary Figure 5).
The observed MPs abundance was particularly high (0.310 items/m2 on average) during the first campaign (spring 2019) (Figure 9) and the highest found among all the area samplings. The peak concentration (0.669 items/m2) was found in GGt3, located close to the port, the urban and industrial area of Gabes, while the lowest concentration (0.060 items/m2) was found in station GGt4, a few kilometers offshore. During the second campaign (autumn 2019), MPs’ abundance was much lower (0.073 items/m2 on average), but still among the highest recorded in all areas. The simulated MPs abundance with the fine model was lying somewhere in between the two campaigns, capturing in most cases the observed horizontal variability (Figures 7–9).
The difference of about one order of magnitude between campaigns I (3.1 ± 2 × 10⁵ items/km2) and II (7.2 ± 8 × 10⁴ items/km2) suggests a significant seasonal variability in this area. This could be explained if we consider that the Gabes Gulf, compared to other Mediterranean systems, is characterized by stronger seasonal variability due to the water temperature and salinity (Bejaoui et al., 2019). Although, limited information is available in the literature (Table 1) about MPs in the sea water from Tunisian coasts, Zayen et al. (2020) recently reported the same values of MPs abundance (6.3 × 10⁴ items/km2) found in surface water samples collected in the same season (campaign II, autumn) in the Gabes Gulf.
Microplastics Abundance and Size Variability Among the Four Different Areas
Comparing the MPs abundance during the two sampling campaigns among the different areas (Figure 9), Gabes showed the highest mean concentrations (0.073–0.3 items/m2), followed by Ligurian Sea (0.061–0.134 items/m2), Saronikos Gulf (0.047–0.080 items/m2), and Gulf of Lion (0.029–0.032 items/m2).
A different pattern was found for MPs’ small size contribution, being higher in the Ligurian Sea and the Gulf of Lion and much lower in Gabes Gulf and Saronikos Gulf. The fine model simulation was able to capture the MPs abundance variability, with few adjustments in source inputs (decrease of wastewater in Ligurian Sea and increase of river inputs in Gulf of Lion). The small size contribution variability was also captured, with the exception of Saronikos Gulf, where an overestimation was simulated.
In Figure 10, the reference simulation may be compared with a simulation with no input of MPs from the model’s open boundaries (not shown). In the case of Saronikos, this change is quite small for both MPs abundance (−11%) and small size contribution (+6%). The Ligurian Sea shows a slightly stronger impact from inflowing MPs (abundance: −20%, small size +25%) that originate from the Tyrrhenian Sea (see Figure 1), while a stronger effect can be seen in the Gulf of Lion (abundance: −25%, small size +26%) and particularly the Gabes Gulf (abundance: −83%, small size +130%). In the Gulf of Lion, there is a significant input of MPs, carried by the cyclonic circulation and originating from the Ligurian Sea (see Figures 1, 5 and Supplementary Figure 5), while in the Gabes Gulf, the majority of MPs appear to originate from offshore areas and are mainly (floating) larger size classes, as suggested by the quite small contribution of size <1 mm. One may notice that the mean MPs abundance in the four areas closely follows the sources variability (Figure 10A), when no input of MPs is considered (i.e., only local sources). We should also note that when considering the average MPs abundance over the entire model domain, as in Figure 10, a slightly higher concentration is simulated in the Ligurian Sea, as compared to Gabes Gulf, which is not the case with the average in the sampling stations area (Figure 9).
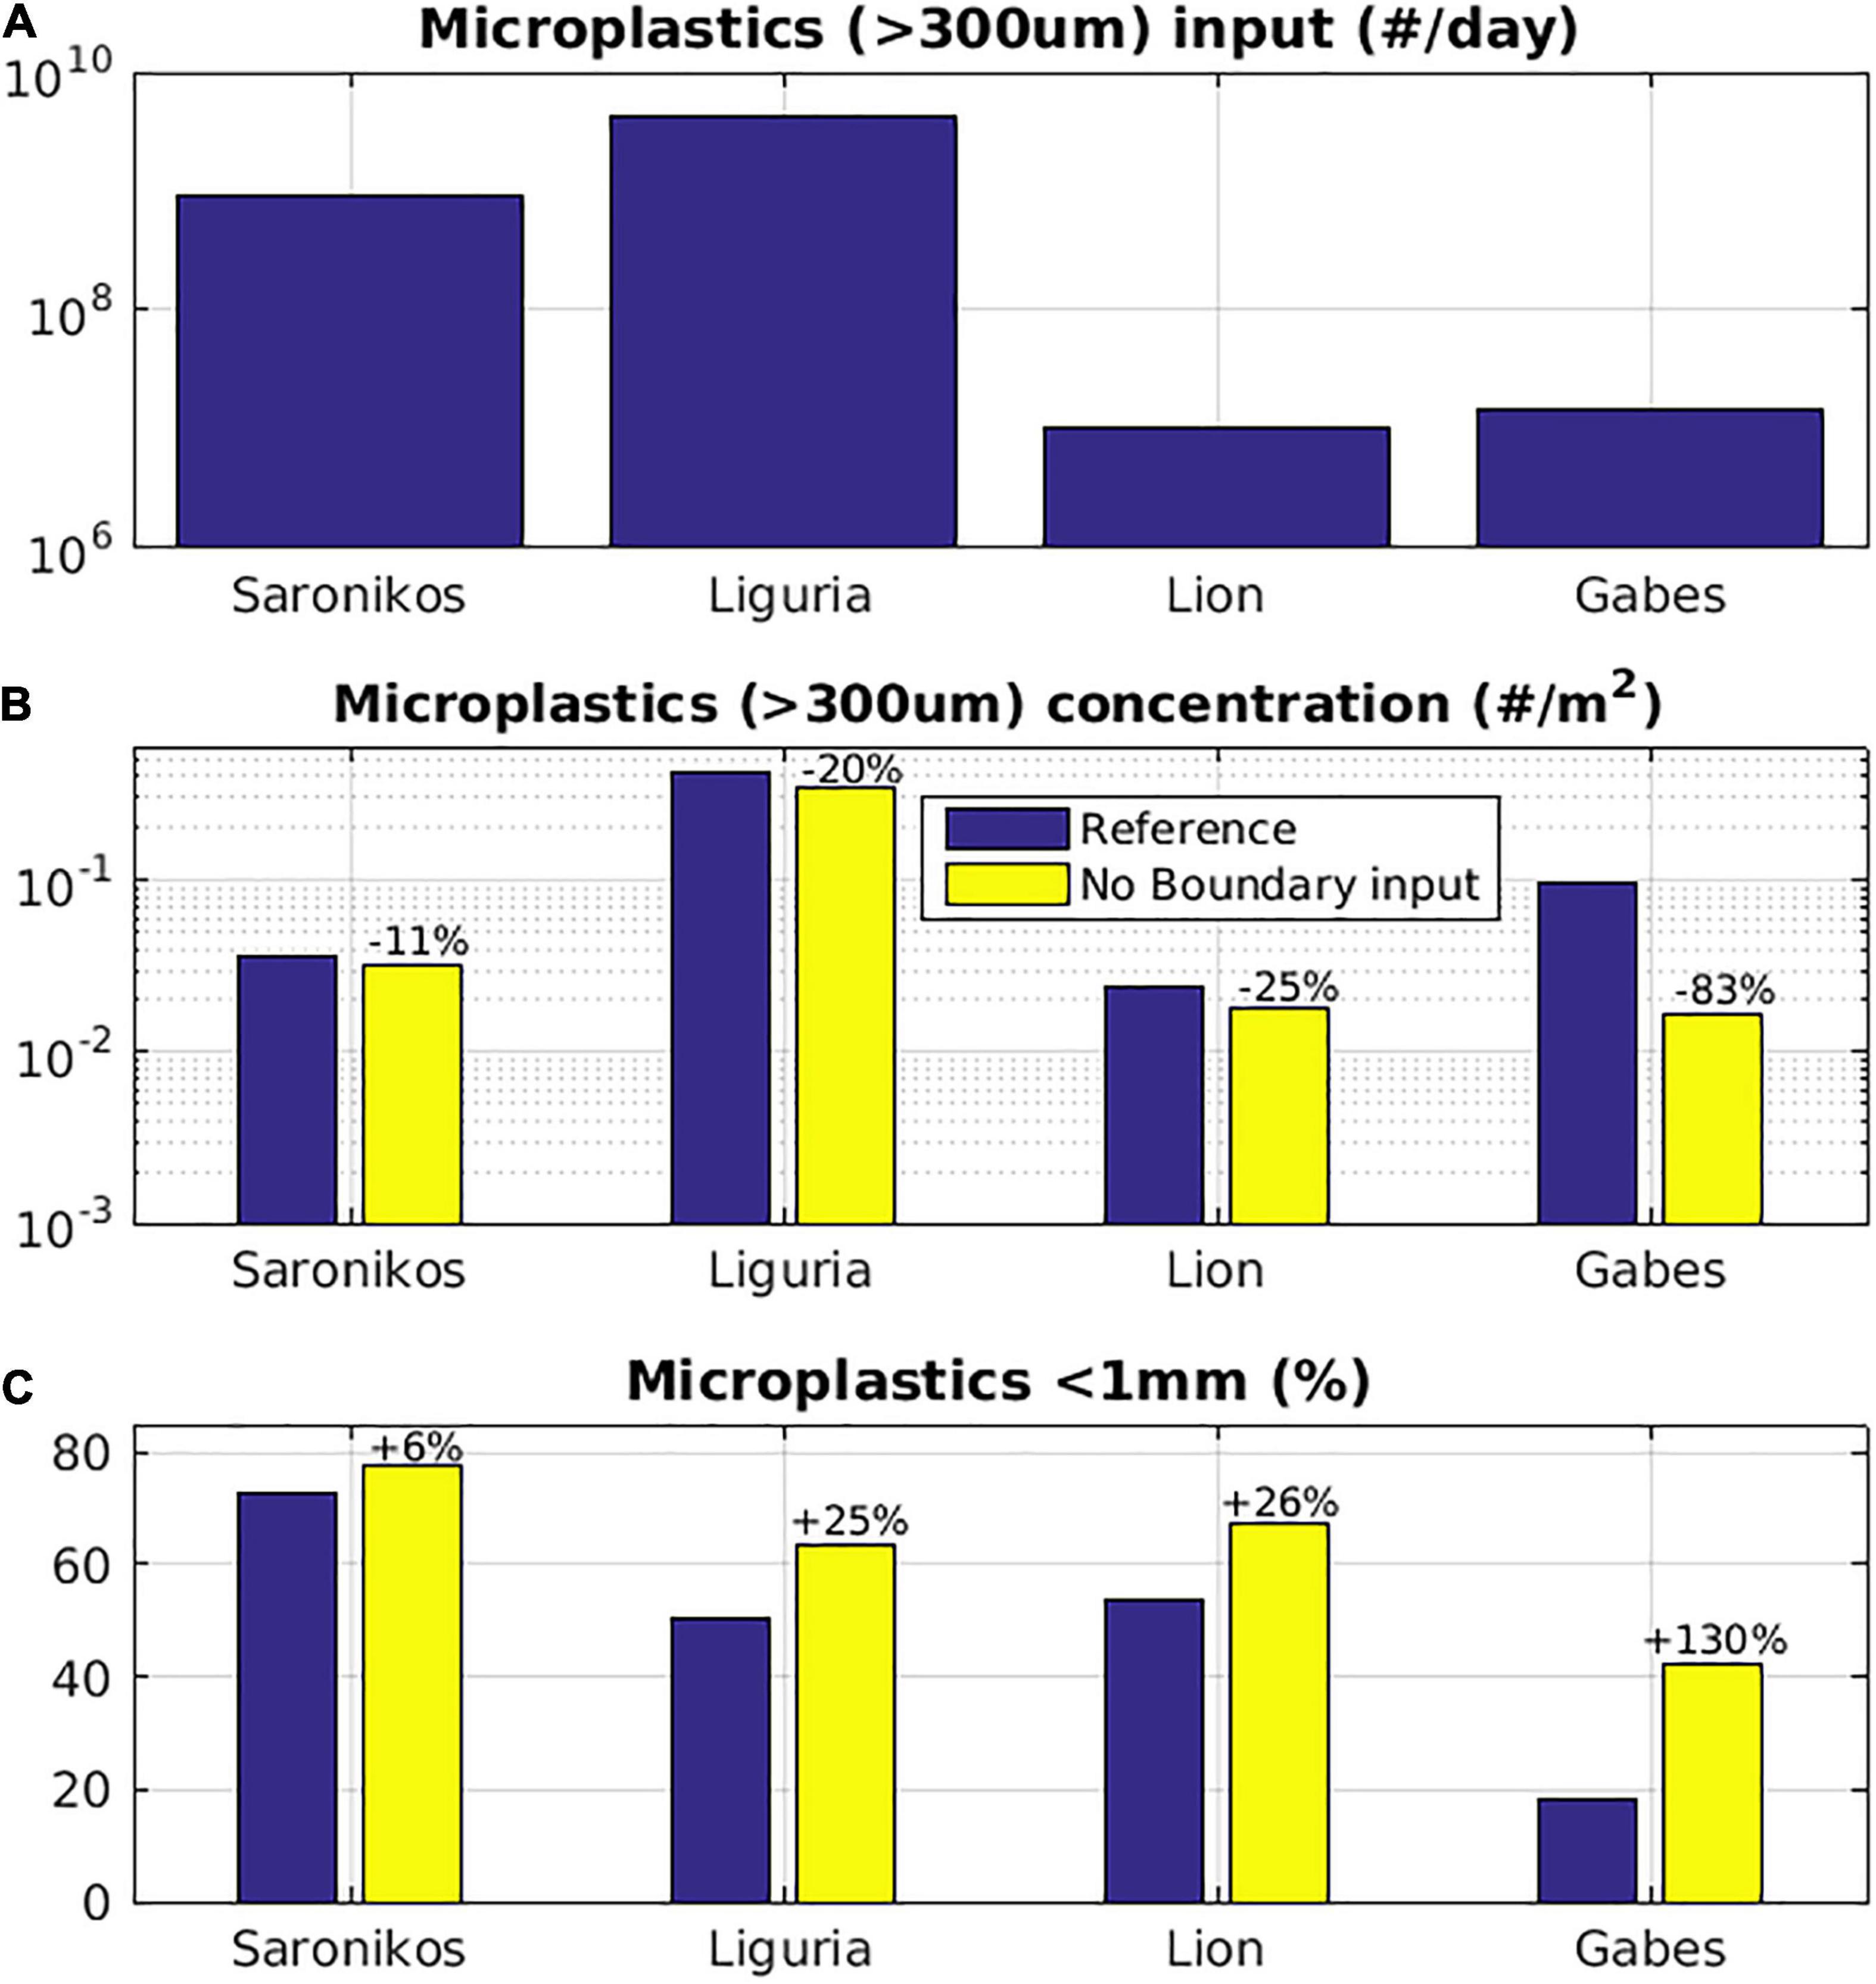
Figure 10. Microplastics (A) total input (items/day), mean (2018–2019) microplastics (B) concentration (items/m2) and (C) contribution <1 mm (%) in the four key study areas (Saronikos Gulf, Ligurian Sea, Gulf of Lion, and Gabes Gulf) with the fine-model reference simulation (blue bar) and a simulation without microplastics input from the open boundaries (yellow bar).
Seasonal Variability
In Figure 11, the seasonal variability of MPs abundance and small size contribution, averaged in the model domain and in the vicinity of the sampling stations, in the four different areas is shown. The reference simulation can be also compared with a simulation without any MPs input from the model’s open boundaries (dashed lines), identifying periods characterized by an increased inflow of MPs from other areas in the simulated variability. The latter is usually dominated by larger size MPs that are floating at surface, traveling longer distances and results in the relative decrease of MPs small size contribution in the model domain. Thus, in such events, the MPs small size contribution shows an opposite variability (negative correlation) with MPs abundance.
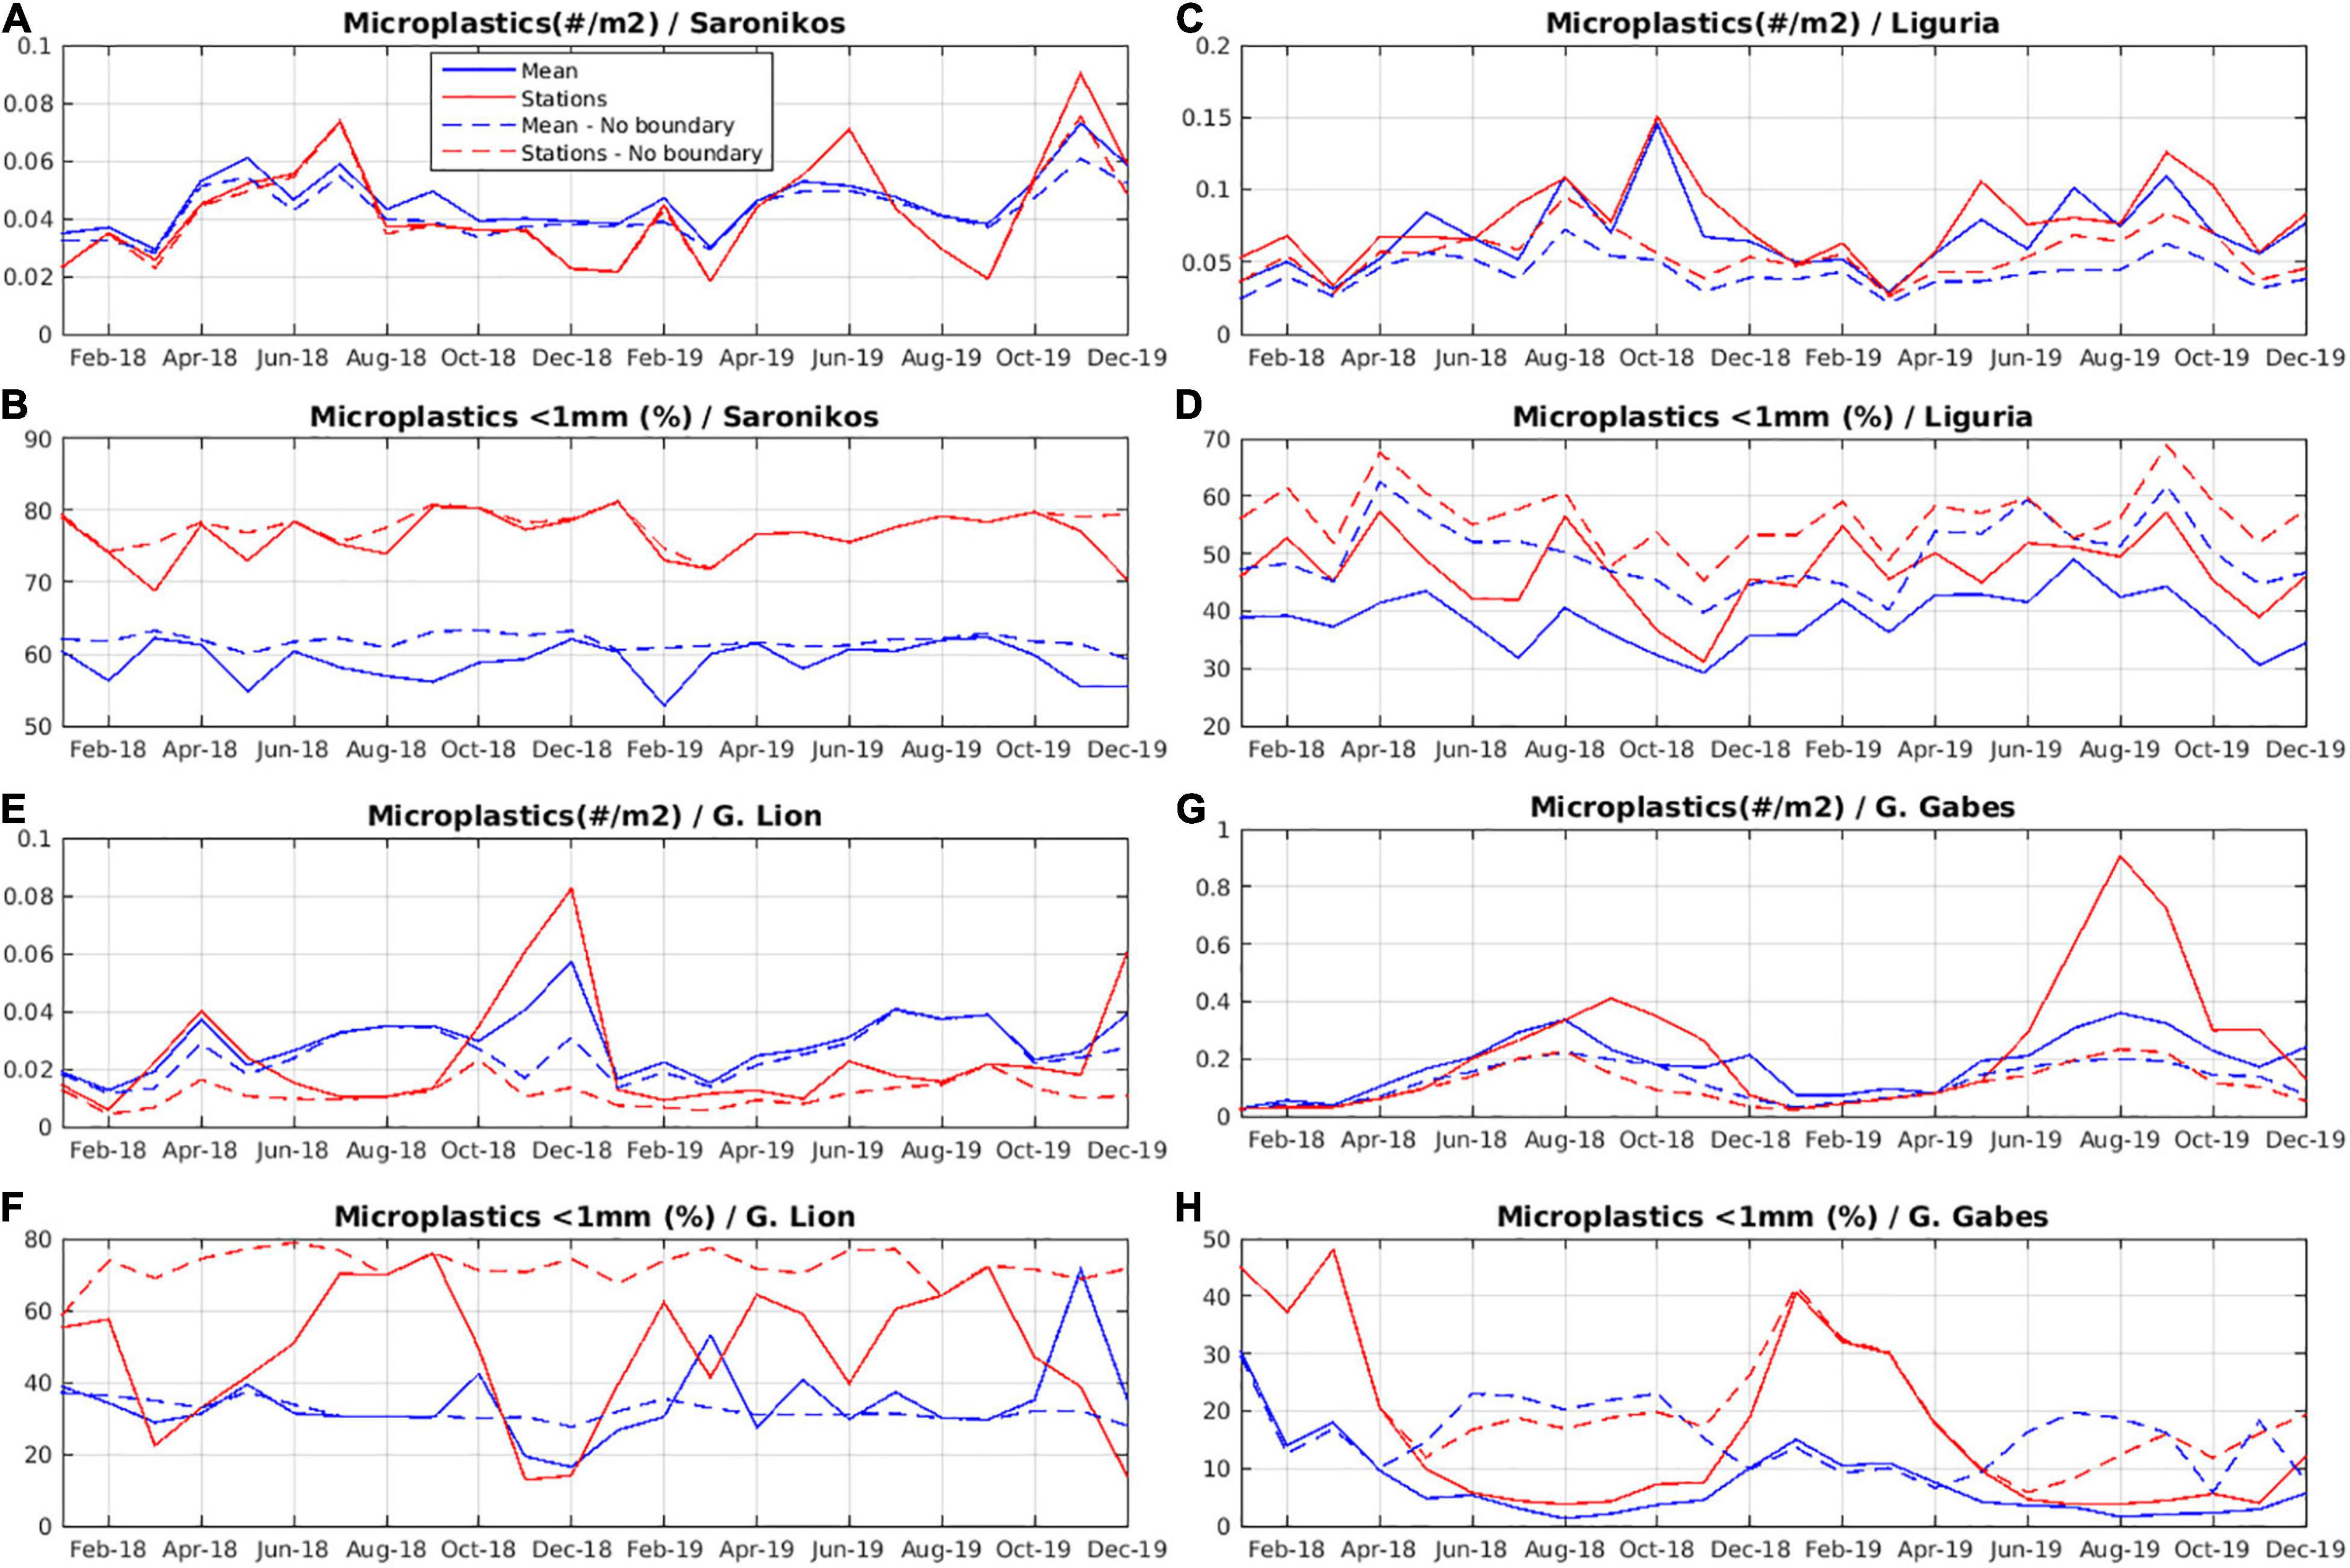
Figure 11. Variability over 2018–2019 period of microplastics concentration (items/m2) and microplastics <1 mm (%), averaged over the model domain (blue lines) and the stations area (red lines), in the reference simulation (solid lines) and a simulation without input of MPs along the open boundaries (dashed lines), in (A,B) Saronikos Gulf, (C,D) Ligurian Sea, (E,F) Gulf of Lion, and (G,H) Gabes Gulf.
In the Ligurian Sea, the seasonal variability appears to be mostly related to vertical mixing, as both MPs abundance and small size percentage are generally increasing during the more stratified period (April–October). This is consistent with the in situ data variability (Figures 7–9), showing a decrease of MPs abundance from September 2018 to April 2019. The MP abundance and small size contribution are slightly higher in the coastal area close to the stations, as compared to the entire area average.
In the Gabes Gulf, the seasonality of MPs appears to be strongly controlled by wind/wave direction that is shoreward during spring-summer period (see Supplementary Figure 7) resulting in the accumulation of primarily larger size MPs, as suggested by the strong decrease of small size contribution (Figure 11). This pattern is in agreement with the observed overall decrease of small size particles percentage from April to November 2019 (Figures 8, 9). However, the observed MPs abundance is also decreased during the second campaign (Figures 7, 9), opposite to the simulated seasonal variability. One may also notice that in the simulation with no input of MPs from the boundaries, an increase of small size contribution is simulated during summer, as floating larger MPs are more easily beached from the strong shoreward waves drift. The seasonal variability pattern is less clear in the Gulf of Lion and Saronikos Gulf, being driven by a combination of factors (wind/waves, circulation, and vertical mixing). In the Gulf of Lion, the seasonal variability close to the stations appears to be strongly influenced by the inflow of (larger) MPs from the southeast, being particularly noticeable in November–December 2018, which is consistent with the intensification of the Northern Current, known from observations (Millot, 1991). The mean MPs abundance is generally increasing during spring–summer period (April–September), which is mostly related to a relaxation of wind/wave magnitude (see Supplementary Figure 7) that results in a weaker offshore advection of larger MPs, as suggested by the decrease of small size contribution. In Saronikos Gulf, the contribution of inflowing MPs from offshore waters is much smaller, as the simulated MPs abundance in this semi-enclosed gulf is mainly originating from local sources. The seasonal variability pattern is not clear, though the mean MPs abundance, particularly in the vicinity of the sampling stations, appears to follow a generally increasing trend from winter to summer (January–July).
Microplastics Properties Variability
A total of 4,535 items were isolated from the samples collected during the two sampling campaigns in the four coastal areas. All of them were characterized for their shape and size (Figure 12). The majority of particles found were characterized as fragments that result to be the dominant shape independently of seasonal campaign and sampling area, in agreement with several studies on MPs, collected in similar regions of the Mediterranean, including the Ligurian Sea, Gulf of Lion, Gabes, and Saronikos Gulf (Fossi et al., 2017; Schmidt et al., 2018; Tziourrou et al., 2019; Zayen et al., 2020; Adamopoulou et al., 2021). The high prevalence of fragments in surface water suggests that the microplastics derived from degradation of waste, originating from population activities, especially in proximity of densely populated coastal areas, either through rivers or landfills (Collignon et al., 2012; Pedrotti et al., 2016; Schmidt et al., 2018; Simon-Sánchez et al., 2022). The macro- and mesoplastics are fragmented through the weathering, such as photo-oxidative degradation followed by thermal and/or chemical degradation and mechanical forces from wind and waves (Caldwell et al., 2019). As highlighted in Figure 12, the higher prevalence of isolated MPs falls in the range 1–3 mm for all sampling areas (both campaigns), except the Ligurian Sea (100 μm mesh size) that reports the higher abundance of particles below 1 mm especially in the first campaign.
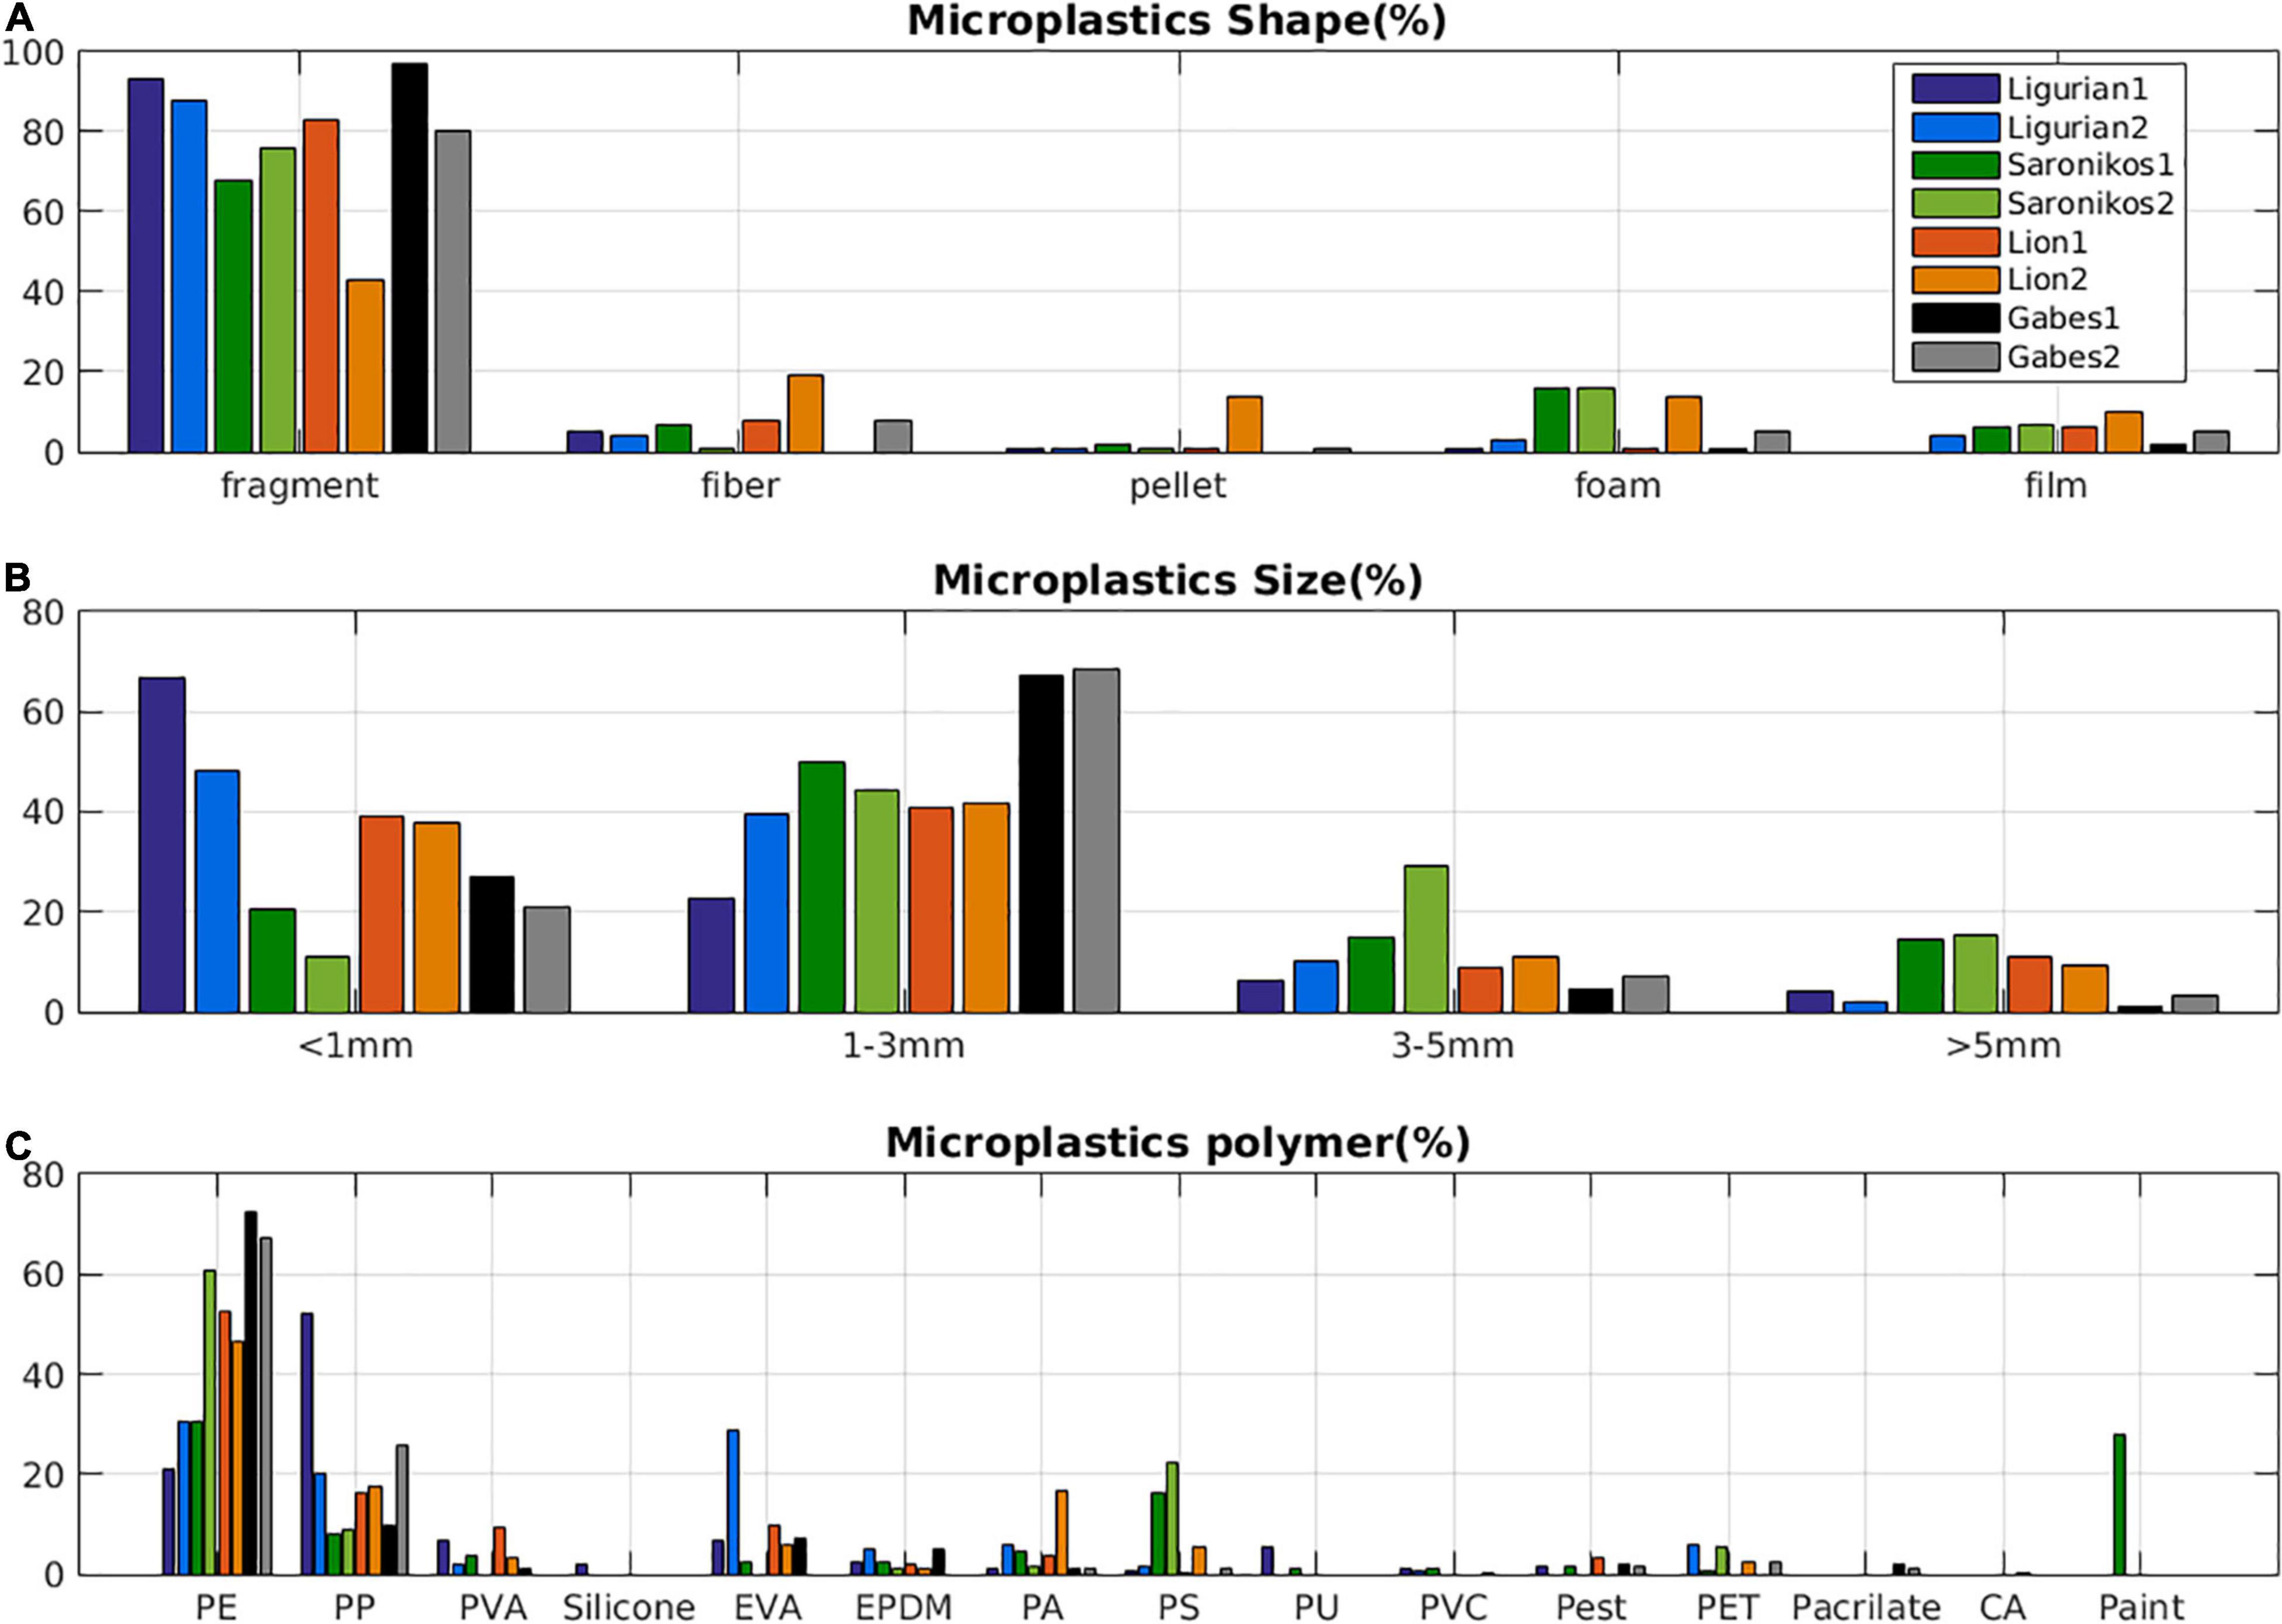
Figure 12. Percentage distribution (mean values) of microplastics (MPs) collected in the CLAIM Key study areas (Saronikos Gulf, Ligurian Sea, Gulf of Lion, and Gabes Gulf) during both campaigns, according to (A) different shape (microplastic shape %), (B) size (microplastic size %), and (C) polymer characterization through ATR FT-IR analysis (microplastics polymer %). polyethylene (PE), polypropylene (PP), polyvinyl alcohol (PVA), polyurethane (PU), ethylene vinyl acetate (EVA), ethylene propylene diene monomer (EPDM), polyamide (PA), polystyrene (PS), polyester (pestere), polyethylene terephthalate (PET), polyvinyl chloride (PVC), cellulose acetate (CA), and polyacrylic rubber (polyacr rubber).
These findings seem to be in line with recent studies that highlighted how the smaller mesh size can be determined by an increase in terms of MPs abundance and a decrease in particle size (Converton et al., 2019; Lindeque et al., 2020; Simon-Sánchez et al., 2022). Indeed, it was demonstrated in these studies that the large mesh size (500, 300, 200 μm) nets probably affect the abundance of small particles in the samples, without providing a wide range of microplastics size in the water column, compared to other smaller mesh sizes (i.e., 100 μm). Moreover, the 330 μm nets that are commonly used in microplastic monitoring campaigns and are recommended by the Marine Strategy Framework Direttive (MSFD) probably underestimate the MPs abundance, particularly for particles <330 μm (Converton et al., 2019; Lindeque et al., 2020). Converse to these observations, in this study, only a few particles (min 0.3% max 6% of the total identified items in both campaigns) were found to be smaller than 330 microns in all sampling areas (see the raw data provided in Supplementary Material), suggesting that probably the different configurations on the mesh size used (see section “Sampling Collection”) might not significantly affect the reported final MPs abundance.
About 70% of all isolated items were confirmed to be plastic. A great polymeric variety was found, considering all the investigated coastal areas of the Mediterranean Sea, without substantial differences between the seasons (campaigns I and II): 11 different polymer typologies were identified in the Gulf of Lion and in the Ligurian Sea, while 12 polymers were found in the Saronikos Gulf and Gabes Gulf. In general, the most abundant polymers detected in all the sampling sites and coastal areas were polyethylene (PE) and polypropylene (PP). These findings are in agreement with previous studies, which report that polyolefins (PE and PP) dominate sea surface samples of the Western and Eastern Mediterranean Sea (Suaria et al., 2016; Caldwell et al., 2019; Zayen et al., 2020). In 2019, global plastic production reached 368 million metric tons; about 40% of all polymers are used in packaging, with PE and PP accounting for the highest global plastic demand (Andrady, 2015). Therefore, the presence of these polymers in surface water samples may suggest the potential origin of the MPs analyzed by fragmentation of packaging items (PlasticEurope, 2015; Pedrotti et al., 2016; Fossi et al., 2017; Erni-Cassola et al., 2019), not only considering their use in the disposable packaging industry but also their properties. However, it is interesting to note how these most abundant polymers exhibit different trends in the analyzed surface water samples, resulting in higher PE frequency compared to PP in all sampling areas, except the Ligurian Sea during the campaign I (Figure 12). These findings, might be explained considering the different degradation behavior of PE and PP in sea water, due to a smaller aging sensitivity of PE, as compared to PP, causing a faster fragmentation in small particles of PP than PE (Gewert et al., 2015; Kedzierski et al., 2022). For these reasons, the PP concentration in surface water appears to increase with decreasing size range, as observed in the Ligurian Sea during campaign I (Figure 12), where, PP showed the higher MPs abundance of small size particles (<1 mm) among sampling areas and other regions of the Mediterranean Sea (Baini et al., 2018; Kedzierski et al., 2022). Frequent detection of these polymers can be also related to their low density and long residence time at the sea surface, conversely to other polymers that are more prone to rapid sinking (i.e., PVC). Other polymers, such as polystyrene (PS), ethylene vinyl acetate (EVA), polyvinyl alcohol (PVA), polyamide (PA), polyether urethane (PU), PVC, polyethylene terephthalate (PET), were also observed in low percentages.
It is noteworthy to mention that a high percentage (27.97%) of paint fragments was found during the first campaign in Saronikos Gulf, close to the industrial ports of Perama, the Piraeus ports and Psitalia WWTP. The identified particles probably belonged to different external sources (e.g., recreational boats and vessels) and not from contamination of the sampling boats. Thus, these particles were included in the final MPs abundance. Paint particles represent a significant fraction of MPs pollution in Saronikos Gulf, being recently documented (Adamopoulou et al., 2021; Gaylarde et al., 2021). Indeed, it has been recently accepted by the International Union for the Conservation of Nature (IUCN) that ships’ hull scrapings, marine coatings and anti-fouling systems are potential sources of marine MPs pollution (IMO, 2019).
Conclusion
In the present study, the variability of MPs (abundance, size, shape, etc.), obtained from surface water samples, collected during two campaigns over 2018–2019 in four coastal areas in the Mediterranean Sea (Saronikos Gulf, Ligurian Sea, Gulf of Lion, and Gabes Gulf), was investigated. A basin-scale Mediterranean coupled hydrodynamic/particle drift model simulation over 2018–2019 was used to provide a better understanding on the variability of MPs abundance/size and key drivers in the four different areas. Moreover, high resolution models, nested in the Mediterranean basin-scale model, were downscaled in the four areas to better resolve the MPs distribution and fine-tune existing source inputs, in order to obtain a better fit with the observations. Different size classes of MPs were considered in the model, taking into account biofouling induced sinking, as a possible mechanism of MPs removal from the surface.
The model simulations provided useful insight on the key processes, controlling the MPs distribution. The basin-scale simulation revealed a strong decrease of microplastics abundance and small size contribution from coastal areas near source inputs to offshore areas, which is mostly related to biofouling induced sinking of the smaller size classes. A significant impact of waves drift was also found, particularly in the Gulf of Lion and Gulf of Gabes that are characterized by quite strong predominant wind/waves.
Field data confirm that the Mediterranean Sea is a hot spot for the contamination of microplastics, as previously showed by many authors (Lebreton et al., 2012; Cózar et al., 2015; Baini et al., 2018; Caldwell et al., 2019; Llorca et al., 2020) with values generally in line with those reported in the literature (Table 1). Comparing the MPs abundance among the four different areas, the Gabes Gulf showed the highest mean MP abundance (0.073–0.310 items/m2), followed by Ligurian Sea (0.061–0.134 items/m2), Saronikos Gulf (0.047–0.080 items/m2), and Gulf of Lion (0.029–0.032 items/m2).
The fine model simulation was able to capture this variability, with few adjustments in the source inputs (decrease of wastewater in Ligurian Sea and increase of river inputs in Gulf of Lion). A different pattern was found for MPs’ small size contribution, being higher in the Ligurian Sea and Gulf of Lion and much lower in Gabes Gulf and Saronikos Gulf. This variability was also captured by the model, with the exception of Saronikos Gulf, where an overestimation of small sized MPs was simulated. An interesting finding obtained from the model simulations was related to the relative contribution of MPs inflowing from remote areas. In agreement to Zayen et al. (2020), in Gabes Gulf, this contribution was particularly high, suggesting that most MPs originate from offshore areas and are mainly (floating) larger size classes, as suggested by the quite small contribution of size <1 mm particles. An important, but much smaller, contribution of non-local MPs was also simulated in the Gulf of Lion and Ligurian Sea. The significant contribution of MPs inflowing from remote origins in the key study areas suggests that taking into account non-local MPs, as with the implemented nested modeling approach, is necessary in order to realistically simulate MPs’ abundance on regional/local scale.
The adopted sources of plastics in the Mediterranean were based on currently available data. However, these are characterized by large uncertainties in both their amount and distribution. Inputs from river runoff were based on a global empirical function (Lebreton et al., 2017), using only one Mediterranean river (River Po), while its strong dependence on mismanaged plastic production may result in an underestimation/overestimation in high-income/developing countries (Mai et al., 2020). This was probably the case with particularly low inputs from river runoff along the Spanish/French coast, including the Gulf of Lion, where existing observations (Schmidt et al., 2018) suggest an important underestimation. With regard to inputs from coastal cities untreated wastewater discharge, a uniform MPs concentration of (influent) wastewater was considered for the entire Mediterranean, in the absence of available data from different countries. In reality, the wastewater MPs concentration is expected to show a significant variability, depending on population density, economic status, consumption rates for personal care products, etc. (Uddin et al., 2020). Moreover, an annual mean concentration was used, not considering wastewater discharge seasonal variability, which might be important, particularly in more touristic areas. This model limitation might partly explain the deviation in some cases (e.g., Saronikos and Gabes Gulf) between the simulated and observed variability of MPs abundance during the two sampling campaigns. In the Ligurian Sea, untreated wastewater was most likely overestimated, possibly due to upgraded treatment facilities along the Italian coast, with regard to those reported in the UNEP/MAP (2011). Despite those limitations, using a comprehensive wastewater discharge dataset (UNEP/MAP, 2011) contributed to the reasonable agreement of the simulated microplastics distribution with in situ data on basin scale (see also Tsiaras et al., 2021). An even better agreement was achieved with the fine model simulations after a few adjustments in source inputs (decrease of wastewater in Ligurian Sea and increase of river inputs in the Gulf of Lion).
Studies reported in the literature are often carried out with different methodologies, from the field work to the laboratory analysis, since there is still no general consensus on the methodology used, thus making it really difficult to compare results between studies on MPs pollution in the marine environment. Within this context, there is a need to standardize methods for sampling and analyzing marine MPs for monitoring purposes. In this perspective, it is clear that there is still a lack of knowledge on MPs presence in the marine environment and therefore more data and investigations need to be done. The modeling tools, proposed in this study, showed reasonable skill in reproducing the MPs variability, providing useful insight on MPs dynamics in the marine environment. The implemented approach with nested particle tracking models seems promising and could be easily adopted in other coastal areas, offering a useful modeling tool for the assessment of plastic pollution on basin and regional scales to further develop environmental management action for the mitigation of plastic pollution in the Mediterranean Sea.
Data Availability Statement
The raw data supporting the conclusions of this article will be made available by the authors, without undue reservation.
Author Contributions
KT designed the modeling study, performed the simulations, and wrote the manuscript initial draft. EC, CG, SM, RM, VP, FG, and MF collected and processed the samples, and reviewed the manuscript. YH and SK collated plastics sources and observational data and contributed to the writing of the manuscript. All authors contributed to the article and approved the submitted version.
Funding
This study was financially supported by the EC H2020 CLAIM project H2020-BG492 2016–2017 (grant agreement no. 774586).
Conflict of Interest
The authors declare that the research was conducted in the absence of any commercial or financial relationships that could be construed as a potential conflict of interest.
Publisher’s Note
All claims expressed in this article are solely those of the authors and do not necessarily represent those of their affiliated organizations, or those of the publisher, the editors and the reviewers. Any product that may be evaluated in this article, or claim that may be made by its manufacturer, is not guaranteed or endorsed by the publisher.
Supplementary Material
The Supplementary Material for this article can be found online at: https://www.frontiersin.org/articles/10.3389/fmars.2022.784937/full#supplementary-material
Footnotes
References
Adamopoulou, A., Zeri, C., Garaventa, F., Gambardella, C., Ioakeimidis, C., and Pitta, E. (2021). Distribution Patterns of Floating Microplastics in Open and Coastal Waters of the Eastern Mediterranean Sea (Ionian, Aegean, and Levantine Seas). Front. Mar. Sci. 8:699000. doi: 10.3389/fmars.2021.699000
Anastasopoulou, A., and Fortibuoni, T. (2019). “Impact of Plastic Pollution on Marine Life in the Mediterranean Sea,” in Plastics in the Aquatic Environment - Part I. The Handbook of Environmental Chemistry, Vol. 111, eds F. Stock, G. Reifferscheid, N. Brennholt, and E. Kostianaia (Cham: Springer).
Andrady, A. L. (2015). Plastics in the Oceans in Plastics and Environmental Sustainability. Hoboken: John Wiley and Sons, Inc, 295–318.
Arthur, C., Baker, J., and Bamford, H. (2009). Proceedings of the international research workshop on the occurrence, effects and fate of microplastic marine debris. Sept 9–11, 2008, NOAA Technical Memorandum NOS-OR&R30. Washington, D.C: NOAA.
Avio, C. G., Pittura, L., d’Errico, G., Abel, S., Amorello, S., Marino, G., et al. (2020). Distribution and characterization of microplastic particles and textile microfibers in Adriatic food webs: General insights for biomonitoring strategies. Environ. Pollut. 258:113766. doi: 10.1016/j.envpol.2019.113766
Baini, M., Fossi, M. C., Galli, M., Caliani, I., Campani, T., Finoia, M. G., et al. (2018). Abundance and characterization of microplastics in the coastal waters of Tuscany (Italy): The application of the MSFD monitoring protocol in the Mediterranean Sea. Mar. Pollut. Bull. 133, 543–552. doi: 10.1016/j.marpolbul.2018.06.016
Baretta, J. W., Ebenhöh, W., and Ruardij, P. (1995). The European regional seas ecosystem model, a complex marine ecosystem model. Netherlands J. Sea Res. 33, 233–246. doi: 10.1016/0077-7579(95)90047-0
Boucher, J., and Friot, D. (2017). Primary Microplastics in the Oceans: A Global Evaluation of Sources. Gland: IUCN, 43.
Bayo, J., Lopez-Castellanos, J., and Olmos, S. (2020). Membrane bioreactor and rapid sand filtration for the removal of microplastics in an urban wastewater treatment plant. Mar. Pollut. Bull. 156:111211. doi: 10.1016/j.marpolbul.2020.111211
Bejaoui, B., Ben Ismail, S., Othmani, A., Hamida, O. B. B., Chevalier, C., Feki-Sahnoun, W., et al. (2019). Synthesis review of the Gulf of Gabes (eastern Mediterranean Sea, Tunisia): Morphological, climatic, physical oceanographic, biogeochemical and fisheries features. Est. Coast. Shelf Sci. 219:006. doi: 10.1016/j.ecss.2019.01.006
Bergamasco, A., and Malanotte-Rizzoli, P. (2010). The circulation of the Mediterranean Sea: a historical review of experimental investigations. Adv. Oceanogr. Limnol. 1, 11–28. doi: 10.1080/19475721.2010.491656
Blumberg, A. F., and Mellor, G. L. (1983). Diagnostic and prognostic numerical circulation studies of the South Atlantic Bight. J. Geophys. Res. 88, 4579–4592.
Brach, L., Deixonne, P., and Bernard, M. (2018). Anticyclonic eddies increase accumulation of microplastic in the North Atlantic subtropical gyre. Mar. Pollut. Bull. 126, 191–196. doi: 10.1016/j.marpolbul.2017.10.077
Browne, M. A., Dissanayake, A., Galloway, T. S., Lowe, D. M., and Thompson, R. C. (2008). Ingested microscopic plastic translocates to the circulatory system of the mussel, Mytilus edulis (L). Environ. Sci. Technol. 42, 5026–5031. doi: 10.1021/es800249a
Caldwell, J., Petri-Fink, A., Rothen-Rutishauser, B., and Lehner, R. (2019). Assessing meso- and microplastic pollution in the Ligurian and Tyrrhenian Seas. Mar. Pollut. Bull. 149:110572. doi: 10.1016/j.marpolbul.2019.110572
Carlson, D. F., Suaria, G., Aliani, S., Fredj, E., Fortibuoni, T., Griffa, A., et al. (2017). Combining Litter Observations with a Regional Ocean Model to Identify Sources and Sinks of Floating Debris in a Semi-enclosed Basin: the Adriatic Sea. Front. Mar. Sci. 4:78. doi: 10.3389/fmars.2017.0007
Cincinelli, A., Martellini, T., Guerranti, C., Scopetani, C., Chelazzi, D., and Giarrizzo, T. (2019). A potpourri of microplastics in the sea surface and water column of the Mediterranean Sea. Trends Analy. Chem. 110, 321–326. doi: 10.1016/j.trac.2018.10.026
Collignon, A., Hecq, J. H., Glagani, F., Voisin, P., Collard, F., and Goffart, A. (2012). Neustonic microplastic and zooplankton in the North Western Mediterranean Sea. Mar. Pollut. Bull. 64, 861–864. doi: 10.1016/j.marpolbul.2012.01.011
Collignon, A., Hecq, J.-H., Galgani, F., Collard, F., and Goffart, A. (2014). Annual variation in neustonic micro- and meso-plastic particles and zooplankton in the Bay of Calvi (Mediterranean–Corsica). Mar. Pollut. Bull. 79, 293–298. doi: 10.1016/j.marpolbul.2013.11.023
Compa, M., Alomar, C., Mourre, B., March, D., Tintoré, J., and Deudero, S. (2020). Nearshore spatio-temporal sea surface trawls of plastic debris in the Balearic Islands. Mar. Environ. Res. 158:104945. doi: 10.1016/j.marenvres.2020.104945
Converton, G. A., Pearce, M. C., Gurney-Smith, H. J., Chastain, G. S., Ross, Ross, P. S., et al. (2019). Size and shape matter: a preliminary analysis of microplastic sampling technique in seawater studies with implications for ecological. Sci. Total Env. 667, 124–132. doi: 10.1016/j.scitotenv.2019.02.346
Cózar, A., Echevarria, F., Gonzalez-Gordillo, J. I, Irigoien, X., Ubeda, B., Hernández-León, S., et al. (2014). Plastic debris in the open ocean. Proc. Nat. Acad. Sci. 111, 10239–10244. doi: 10.1073/pnas.1314705111
Cózar, A., Sanz-Martìn, M., Martì, E., González-Gordillo, J. I, Ubeda, B., Gálvez, J. A., et al. (2015). Plastic Accumulation in the Mediterranean Sea. PLoS One 10:e0121762. doi: 10.1371/journal.pone.0121762
Coyle, R., Hardiman, G., and O’ Driscoll, K. (2020). Microplastics in the marine environment: A review of their sources, distribution processes, uptake and exchange in ecosystems. Case Stud. Chem. Environ. Engin. 2:100010. doi: 10.1016/j.cscee.2020.100010
Cubarenko, I., Bagaev, A., Zobkov, M., and Esiukova, E. (2016). On some physical and dynamical properties of microplastic particles in marine environments. Mar. Pollut. Bull. 108, 105–112. doi: 10.1016/j.marpolbul.2016.04.048
Digka, N., Tsangaris, C., Kaberi, H., Adamopoulou, A., and Zeri, C. (2018). “Microplastic abundance and polymer types in a mediterranean environment,” in Proceedings of the International Conference on Microplastic Pollution in the Mediterranean Sea, (Cham: Springer), 17–24.
de Lucia, G. A., Caliani, I., Marra, S., Camedda, A., Coppa, S., Alcaro, L., et al. (2014). Amount and distribution of neustonic microplastic off the western Sardinian coast (Central-Western Mediterranean Sea). Mar. Environ. Res. 100, 10–16. doi: 10.1016/j.marenvres.2014.03.017
Desforges, J.-P. W., Galbraith, M., Dangerfield, N., and Ross, P. S. (2014). Widespread distribution of microplastics in subsurface seawater in the NE Pacific Ocean. Mar. Pollut. Bull. 79, 94–99. doi: 10.1016/j.marpolbul.2013.12.035
El Zrelli, R., Rabaoui, L., Ben Alaya, M., Daghbouj, N., Castet, S., Besson, P., et al. (2018). Seawater quality assessment and identification of pollution sources along the central coastal area of Gabes Gulf (SE Tunisia): evidence of industrial impact and implications for marine environment protection. Mar. Pollut. Bull. 127, 445–452. doi: 10.1016/j.marpolbul.2017.12.012
Eriksen, M., Lebreton, L. C. M., Carson, H. S., Theil, S., Moore, C. J., Borerro, J. C., et al. (2014). Plastic pollution in the world’s oceans: more than 5 trillion plastic pieces weighing over 250,000 tons afloat at sea. PLoS One 9:e111913. doi: 10.1371/journal.pone.0111913
Erni-Cassola, G., Zadjelovic, V., Gibson, M. I., and Christie-Oleza, J. A. (2019). Distribution of plastic polymer types in the marine environment A meta-analysis. J. Hazard. Mater. 369, 691–698. doi: 10.1016/j.jhazmat.2019.02.067
Faure, F., Saini, C., Potter, G., Galgani, F., de Alencastro, L. F., and Hagmann, P. (2015). An evaluation of surface micro- and mesoplastic pollution in pelagic ecosystems of the Western Mediterranean Sea. Environ. Sci. Pollut. Res. 22, 12190–12197. doi: 10.1007/s11356-015-4453-3
Fauziah, S., Liyana, I., and Agamuthu, P. (2015). Plastic debris in the coastal environment: The invincible threat? Abundance of buried plastic debris on Malaysian beaches. Waste Manag. Res. 33, 812s–882s. doi: 10.1177/0734242X15588587
Fazey, F. M. C., and Ryan, P. G. (2016). Biofouling on buoyant marine plastics: An experimental study into the effect of size on surface longevity. Environ. Pollut. 210, 354–360. doi: 10.1016/j.envpol.2016.01.026
Freeman, S., Booth, A. M., Sabbah, I., Tiller, R., Dierking, J., Klun, K., et al. (2020). Between source and sea: the role of wastewater treatment in reducing marine microplastics. J. Environ. Manag. 266:110642. doi: 10.1016/j.jenvman.2020.110642
Frias, J. P. G. L., and Nash, R. (2019). Microplastics: Finding a consensus on the definition. Mar. Pollut Bull. 138, 145–147. doi: 10.1016/j.marpolbul.2018.11.022
Fossi, M. C., Panti, Guerranti, C., Coppola, D., Giannetti, M., Marsili, L., et al. (2012). Are baleen whales exposed to the threat of microplastics? A case study of the Mediterranean fin whale (Balaenoptera physalus). Mar. Pollut. Bull. 64, 2374–2379. doi: 10.1016/j.marpolbul.2012.08.013
Fossi, M. C., Marsili, L., Baini, M., Giannetti, M., Coppola, D., Guerranti, C., et al. (2016). Fin whales and microplastics: the Mediterranean Sea and the Sea of Cortez scenarios. Environ. Pollut. 209, 68–78. doi: 10.1016/j.envpol.2015.11.022
Fossi, M. C., Romeo, T., Baini, M., Panti, C., Marsili, L., Campan, T., et al. (2017). Plastic Debris Occurrence, Convergence Areas and Fin Whales Feeding Ground in the Mediterranean Marine Protected Area Pelagos Sanctuary: a Modeling Approach. Front. Mar. Sci. 4:167. doi: 10.3389/fmars.2017.00167
Gago, J., Filgueiras, A., Pedrotti, M. L., Suaria, G., Tirelli, V., Andrade, J., et al. (2018). Standardised protocol for monitoring microplastics in seawat. er. JPI-Oceans Baseman Proj. 2018:33. doi: 10.25607/OBP-605
Gaylarde, C. C., Neto, J. A. B., and da Fonseca, E. M. (2021). Paint fragments as polluting microplastics: a brief review. Mar. Pollut. Bull. 162:111847. doi: 10.1016/j.marpolbul.2020.111847
Gerritse, J., Leslie, H. A., de Tender, C. A., Devriese, L. I., and Vethaak, A. D. (2020). Fragmentation of plastic objects in a laboratory seawater microcosm. Sci. Rep. 10:10945. doi: 10.1038/s41598-020-67927-1
GESAMP (2019). Guidelines for the Monitoring and Assessment of plastic litter in the Ocean. Gesamp Report and Studies No. 99. New York, NY: GESAMP, 1–138.
Gewert, B., Plassmann, M. M., and MacLeod, M. (2015). Pathways for degradation of plastic polymers floating in the marine environment. Environ. Sci. Proc. Imp. 17, 1513–1521. doi: 10.1039/C5EM00207A
Gündoğdu, S. (2017). High level of micro-plastic pollution in the Iskenderun Bay NE Levantine coast of Turkey. EgeJFAS 34, 401–408. doi: 10.12714/egejfas.2017.34.4.06
Gündoğdu, S., and Çevik, C. (2019). Mediterranean dirty edge: high level of meso and macroplastics pollution on the Turkish coast. Environ. Pollut. 255:113351. doi: 10.1016/j.envpol.2019.1133
Gündogdu, S., Cem, C., Guzel, E., and Kilercioglu, S. (2018). Microplastics in municipal wastewater treatment plants in Turkey: a comparison of the influent and secondary effluent concentrations. Environ. Monit. Assess 190:626. doi: 10.1007/s10661-018-7010-y
Gunther, H., and Behrens, A. (2012). The WAM model. Validation document Version 4.5.4. Geesthacht: Institute of Coastal Research Helmholtz-Zentrum Geesthacht (HZG).
Güven, O., Gokdag, K., Jovanović, B., and Kıdeyş, A. E. (2017). Microplastic litter composition of the Turkish territorial waters of the Mediterranean Sea, and its occurrence in the gastrointestinal tract of fish. Environ. Pollut. 223, 286–294. doi: 10.1016/j.envpol.2017.01.025
Hatzonikolakis, Y., Giakoumi, S., Raitsos, D. E., Tsiaras, K., Kalaroni, S., Triantaphyllidis, G., et al. (2022). Quantifying Transboundary Plastic Pollution in Marine Protected Areas Across the Mediterranean Sea. Front. Mar. Sci. 8:762235. doi: 10.3389/fmars.2021.762235
Imhof, H. K., Sigl, R., Brauer, E., Feyl, S., Giesemann, P., Klink, S., et al. (2017). Spatial and temporal variation of macro-. meso- and microplastic abundance on a remote coral island of the Maldives. Indian Ocean. Mar. Pollut. Bull. 116, 340–347. doi: 10.1016/j.marpolbul.2017.01.010
IMO (2019). Hull Scrapings and Marine Coatings as a Source of Microplastics International Maritime Organization. London: IMO.
Kaandrop, M. L. A., Dijkstra, H. A., and van Sebille, E. (2020). Closing the Mediterranean Marine Floating Plastic Mass Budget:Inverse Modeling of Sources and Sinks. Environ. Sci. Technol. 54, 11980–11989. doi: 10.1021/acs.est.0c01984
Kaiser, D., Kowalski, N., and Waniek, J. J. (2017). Effects of biofouling on the sinking behavior of microplastics. Environ. Res. Lett. 12:124003. doi: 10.1088/1748-9326/aa8e8b
Kalaroni, S., Tsiaras, K., Petihakis, Economou-Amilli, A., and Triantafyllou, G. (2020a). Modelling the Mediterranean Pelagic Ecosystem using the POSEIDON ecological model. Part I : Nutrients and Chlorophyll-a dynamics. Deep-Sea Res. PT II 2020:104647. doi: 10.1016/j.dsr2.2019.104647
Kalaroni, S., Tsiaras, K., Petihakis, G., Economou-Amilli, A., and Triantafyllou, G. (2020b). Modelling the Mediterranean Pelagic Ecosystem using the POSEIDON ecological model. Part II: Biological dynamics. Deep-Sea Res. PT II 171:104711. doi: 10.1016/j.dsr2.2019.104711
Kane, A., Clare, M., Miramontes, E., Wogelius, R., Tothwell, J., Garreau, P., et al. (2020). Seafloor microplastic hotspots controlled by deep-sea circulation. Science 368, 1140–1145. doi: 10.1126/science.aba5899
Kedzierski, M., Palazot, M., Soccalingame, L., Falcou-Prefol, M., Gorsky, G., Galgani, F., et al. (2022). Chemical composition of microplastics floating on the surface of the Mediterranean Sea. Mar. Pollut. Bull. 174:113284. doi: 10.1016/j.marpolbul.2021.113284
Kim, I. S., Chae, D. H., Kim, S. K., Choi, S., and Woo, S. B. (2015). Factors influencing the spatial variation of microplastics on high-tidal coastal beaches in Korea. Arch. Environ. Contam. Toxicol. 69, 299–309. doi: 10.1007/s00244-015-0155-6
Kiørboe, T. (2003). Marine snow microbial communities: scaling of abundances with aggregate size. Aquat. Microb. Ecol. 33, 67–75. doi: 10.3354/ame033067
Koelmans, A. A., Kooi, M., Lavender-Law, K., and van Sebille, E. (2017). All is not lost: deriving a top-down mass budget of plastic at sea. Environ. Res. Lett. 12:114028. doi: 10.1088/1748-9326/aa9500
Kontoyiannis, H. (2010). Observations on the circulation of the Saronikos Gulf: a Mediterranean embayment sea border of Athens, Greece. J. Geophys. Res. Oceans 115:9500. doi: 10.1029/2008JC005026
Kooi, M. H., van Nes, E., Scheffer, M., and Koelemans, A. A. (2017). Ups and Downs in the Ocean: Effects of Biofouling on Vertical Transport of Microplastics. Environ. Sci. Technol. 51, 7963–7971. doi: 10.1021/acs.est.6b04702
Korres, G., Hoteit, I., and Triantafyllou, G. (2007). Data assimilation into a Princeton Ocean Model of the Mediterranean Sea using advanced Kalman filters. J. Mar. Syst. 65, 84–104. doi: 10.1016/j.jmarsys.2006.09.005
Kukulka, T., Proskurowski, G., Moret-Ferguson, S., Meyer, D. W., and Law, K. L. (2012). The effect of wind mixing on the vertical distribution of buoyant plastic debris. Geophys. Res. Lett. 39:L07601. doi: 10.1029/2012GL051116
Kvale, K., Prowe, A. E. F., Chien, C.-T., Landolfi, A., and Oschlies, A. (2020). The biological microplastic particle sink. Sci. Rep. 10:16670.
Lebreton, L. C. M., Greer, S. D., and Borrero, J. C. (2012). Numerical modelling of floating debris in the world’s oceans. Mar. Pollut. Bull. 64, 653–661. doi: 10.1016/j.marpolbul.2011.10.027
Lebreton, L., van der Zwet, J., Damsteeg, J., Slat, B., Andrady, A., and Reisser, J. (2017). River plastic emissions to the world’s oceans. Nat. Comm. 8:15611. doi: 10.1038/ncomms15611
Lindeque, P. K., Cole, M., Coppock, R. L., Lewis, C. N., Miller, R. Z., Watts, A. J. R., et al. (2020). Are we underestimating microplastic abundance in the marine environment? A comparison of microplastic capture with nets of different mesh-size. Environ. Pollut. 265:114721. doi: 10.1016/j.envpol.2020.114721
Llorca, M., Alvarez-Munosz, D., Abalos, M., Rodriguez-Mozaz, S., Santos, L. H. M. L. M., Leon, M., et al. (2020). Microplastics in Mediterranean coastal area: toxicity and impact for the environment and human health. Trends Environ. Analyt. Chem. 27:e00090. doi: 10.1016/j.teac.2020.e00090
Liubartseva, S., Coppini, G., Lecci, R., and Clementi, E. (2018). Tracking plastics in the Mediterranean: 2D Lagrangian model. Mar. Pollut. Bull. 129, 151–162. doi: 10.1016/j.marpolbul.2018.02.019
Long, M., Moriceau, B., Gallinari, M., Lambert, C., Huvet, A., Raffray, J., et al. (2015). Interactions between microplastics and phytoplankton aggregates: impact on their respective fates. Mar. Chem. 175, 39–46. doi: 10.1016/j.marchem.2015.04.003
Macias, D., Stips, A., and Hanke, G. (2021). Model based estimate of transboundary litter pollution on Mediterranean coasts. Mar. Pollut. Bull. 2021:113121. doi: 10.1016/j.marpolbul.2021.113121
Maes, T., Barry, J., Leslie, H., Vethaak, D., Nicolaus, E., Law, R., et al. (2018). Below the surface: Twenty-five years of seafloor litter monitoring in coastal seas of North West Europe (1992–2017). Sci. Total Environ. 630, 790–798. doi: 10.1016/j.scitotenv.2018.02.245
Magni, S., Binelli, A., Pittura, L., Avio, C. G., Della Torre, C., Parenti, C. C., et al. (2019). The fate of microplastics in an Italian Wastewater Treatment Plant. Sci. Total Environ. 652, 602–610. doi: 10.1016/j.scitotenv.2018.10.269
Mai, L., Sun, X.-F., Xia, L.-L., Bao, L.-J., Liu, L.-Y., and Zeng, E. Y. (2020). Global Riverine Plastic Outflows. Environ. Sci. Technol. 54, 10049–10056. doi: 10.1021/acs.est.0c02273
Mansui, J., Molcard, A., and Ourmieres, Y. (2015). Modelling the transport and accumulation of floating marine debris in the Mediterranean basin. Mar. Pollut. Bull. 91, 249–257. doi: 10.1016/j.marpolbul.2014.11.037
Maximenko, N. A., Hafner, J., and Niiler, P. P. (2012). Pathways of marine debris derived from trajectories of Lagrangian drifters. Mar. Pollut. Bull. 65, 51–62. doi: 10.1016/j.marpolbul.2011.04.016
Millot, C. (1991). Mesoscale and seasonal variabilities of the circulation in the Western Mediterranean. Dyn. Atmos. Oceans 15, 179–215. doi: 10.1016/0377-0265(91)90020-G
Morgana, S., Ghigliotti, L., Estévez-Calvar, N., Stifanese, R., Wieckzorek, A., Doyle, T., et al. (2018). Microplastics in the Arctic: a case study with sub-surface water and fish samples off Northeast Greenland. Environ. Pollut. 242, 1078–1086. doi: 10.1016/j.envpol.2018.08.001
Morris, R. J. (1980). Floating plastic debris in the Mediterranean. Mar. Pollut. Bull. 11:125. doi: 10.1016/0025-326X(80)90073-9
Napper, I. E., and Thompson, R. C. (2020). Plastic debris in the marine environment: history and future challenges. Glob. Chall. 4:1900081. doi: 10.1002/gch2.201900081
NOAA (2016). National Centers for Environmental Information, State of the Climate: Global Climate Report for Annual 2016, published online January 2017. Available online at https://www.ncdc.noaa.gov/sotc/global/201613 (accessed date February 15, 2022)
Ourmieres, Y., Mansui, J., Molcard, A., Galgani, F., and Poitou, I. (2018). The boundary current role on the transport and stranding of floating marine litter: the French Riviera case. Contin. Shelf Res. 155, 11–20.
Panti, C., Giannetti, M., Baini, M., Rubegni, F., Minutoli, R., and Fossi, M. C. (2015). Occurrence, relative abundance and spatial distribution of microplastics and zooplankton NW of Sardinia in the Pelagos Sanctuary Protected Area, Mediterranean Sea. Environ. Chem. 12, 618–626. doi: 10.1071/EN14234
Patrício Silva, A. L., Prata, J. C., Walker, T. R., Duarte, A. C., Ouyang, W., Barcelò, D., et al. (2021). Increased plastic pollution due to COVID-19 pandemic: challenges and recommendations. Chem. Eng. J. 405:126683. doi: 10.1016/j.cej.2020.126683
Pedrotti, M. L., Petit, S., Elineau, A., Bruzaud, S., Crebassa, J.-C., Dumontet, B., et al. (2016). Changes in the Floating Plastic Pollution of the Mediterranean Sea in Relation to the Distance to Land. PLoS One 11:e0161581. doi: 10.1371/journal.pone.0161581
PlasticEurope (2015). Plastics - the Facts 2015. An analysis of European plastics production, demand and waste data. Bruxelles: Plastics Europe.
PlasticEurope (2020). Plastics – the Facts 2020 An analysis of European plastics production, demand and waste data. Bruxelles: Plastics Europe.
Pollani, A., Triantafyllou, G., Petihakis, G., Konstantinos, N., Dounias, K., and Koutitas, C. (2001). The Poseidon operational tool for the prediction of floating pollutant transport. Mar. Pollut. Bull. 43, 270–278. doi: 10.1016/S0025-326X(01)00080-7
Prata, J. C., da Costa, J. P., Duarte, A. C., and Rocha-Santos, T. (2019). Methods for sampling and detection of microplastics in water and sediment: a critical review. Trends Analyt. Chem. 110, 150–159. doi: 10.1007/s11356-018-1692-0
Ruiz-Orejón, L. F., Sardá, R., and Ramis-Pujol, J. (2016). Floating plastic debris in the Central and Western Mediterranean Sea. Mar. Environ. Res. 120, 136–144. doi: 10.1016/j.marenvres.2016.08.001
Ruiz-Orejón, L. F., Sardá, R., and Ramis-Pujol, J. (2018). Now, you see me: High concentrations of floating plastic debris in the coastal waters of the Balearic Islands (Spain). Mar. Environ. Res. 133, 636–646.
Ruiz-Orejón, L. F., Mourre, B., Sardá, R., Tintoré, J., and Ramis-Pujol, J. (2019). Quarterly variability of floating plastic debris in the marine protected area of the Menorca Channel (Spain). Environ. Poll. 252, 1742–1754. doi: 10.1016/j.envpol.2019.06.063
Rummel, C. D., Löder, M. G. J., Fricke, N. F., Lang, T., Griebeler, E.-M., Janke, M., et al. (2016). Plastic ingestion by pelagic and demersal fish from the North Sea and Baltic Sea. Mar. Pollut. Bull. 102, 134–141. doi: 10.1016/j.marpolbul.2015.11.043
Savriama, Y., Stige, L. C., Gerber, S., Perez, T., Alibert, P., and David, B. (2015). Impact of sewage pollution on two species of sea urchins in the Mediterranean Sea (Cortiou, France): Radial asymmetry as a bioindicator of stress. Ecol. Indic. 54, 39–47. doi: 10.1016/j.ecolind.2015.02.004
Scheffer, M., Baveco, J. M., DeAngelis, D. L., Rose, K. A., and van Nes, E. H. (1995). Super-individuals a simple solution for modelling large populations on an individual basis. Ecol. Modell. 80, 161–170. doi: 10.1016/0304-3800(94)00055-M
Schmidt, N., Thibault, D., Galgani, F., Paluselli, A., and Sempéré, R. (2018). Occurrence of microplastics in surface waters of the Gulf of Lion (NW Mediterranean Sea). Prog. Oceanogr. 163, 214–220. doi: 10.1016/j.pocean.2017.11.010
Shabaka, S. H., Marey, R. S., Ghobashy, M., Abushady, A. M., Ismail, G. A., and Khairy, H. M. (2020). Thermal analysis and enhanced visual technique for assesssment of microplastics in fish from an Urban Harbor, Mediterranean Coast of Egypt. Mar. Pollut. Bull. 159:111465. doi: 10.1016/j.marpolbul.2020.111465
Simon-Sánchez, L., Grelaud, M., Franci, M., and Ziveri, P. (2022). Are research methods shaping our understanding of microplastic pollution? A literature review on the seawater and sediment bodies of the Mediterranean Sea. Environ. Pollut. 292:118275. doi: 10.1016/j.envpol.2021.118275
Song, Y. K., Hong, S. H., Jang, M., Han, G. M., Jung, S. W., and Shim, W. J. (2017). Combined Effects of UV Exposure Duration and Mechanical Abrasion on Microplastic Fragmentation by Polymer Type. Environ. Sci. Technol. 51, 4368–4376. doi: 10.1021/acs.est.6b06155
Soto-Navarro, J., Jordá, G., Deudero, S., Alomar, C., Amores, A., and Compa, M. (2020). 3D hotspots of marine litter in the Mediterranean: a modeling study. Mar. Pollut. Bull. 155:111159. doi: 10.1016/j.marpolbul.2020.111159
Suaria, G., Avio, C. G., Mineo, A., Lattin, G. L., Magaldi, M. G., Belmonte, G., et al. (2016). The Mediterranean plastic soup: synthetic polymers in Mediterranean surface waters. Sci. Rep. 6:37551. doi: 10.1038/srep37551
Talvitie, A., Mikola, A., Setala, O., and Heinonen, M. (2017). How well is microlitter purified from wastewater? A detailed study on the stepwise removal of microlitter in a tertiary level wastewater treatment plant. Water Res. 109, 164–172. doi: 10.1016/j.watres.2016.11.046
Tedetti, M., Longhitano, R., Garcia, N., Guigue, C., Ferretto, N., and Goutx, M. (2012). Fluorescence properties of dissolved organic matter in coastal Mediterranean waters influenced by a municipal sewage effluent (Bay of Marseilles, France). Environ. Chem. 9, 438–449. doi: 10.1071/EN12081
Torre, M., Digka, N., Anastasopoulou, A., Tsangaris, C., and Mytilineou, C. (2016). Anthropogenic microfiber pollution in Marine Biota. A new and simple methodology to minimize airborne contamination. Mar. Pollut. Bull. 113, 55–61. doi: 10.1016/j.marpolbul.2016.07.050
Tsiaras, K., Hatzonikolakis, Y., Kalaroni, S., Pollani, A., and Triantafyllou, G. (2021). Modeling the pathways and accumulation patterns of micro- and macro-plastics in the Mediterranean. Front. Mar. Sci. 2021:743117. doi: 10.3389/fmars.2021.743117
Tsiaras, K. P., Hoteit, I., Kalaroni, S., Petihakis, G., and Triantafyllou, G. (2017). A hybrid ensemble-OI Kalman filter for efficient data assimilation into a 3-D biogeochemical model of the Mediterranean. Ocean Dyn. 67, 673–690.
Tziourrou, P., Megalovasilis, P., and Karapanagioti, H. K. (2019). Characteristics of microplastics on two beaches affected by different land uses in Salamina Island in Saronikos Gulf, east Mediterranean. Mar. Pollut. Bull. 149:110531. doi: 10.1016/j.marpolbul.2019.110531
Uddin, S., Fowler, S. W., and Behbehani, M. (2020). An assessment of microplastic inputs into the aquatic environment from wastewater streams. Mar. Pollut. Bull. 160:111538. doi: 10.1016/j.marpolbul.2020.111538
UNEP/MAP (2011). Inventory of municipal wastewater treatment plants of coastal Mediterranean cities with more than 2,000 inhabitants (2010). UNEP(DEPI)/MED WG.357/Inf.7, 29 March 2011. Athina: UNEP/MAP.
UNEP/MAP (2015). Updated report on marine litter assessment in the Mediterranean. UNEP(DEPI)/MED) WG.421/Inf.18. Athina: UNEP/MAP.
Van Cauwenberghe, L., Devriese, L., Galgani, F., Robbens, J., and Janssen, C. R. (2015). Microplastics in sediments: a review of techniques, occurrence and effects. Mar. Environ. Res. 193, 65–70. doi: 10.1016/j.marenvres.2015.06.007
van der Hal, N., Assaf, A., and Dror, A. (2017). Exceptionally high abundances of microplastics in the oligotrophic Israeli Mediterranean coastal waters. Mar. Pollut. Bull. 116:52. doi: 10.1016/j.marpolbul.2016.12.052
van Sebille, E., Wilcox, C., Lebreton, L., Maximenko, N., Hardesty, B. D., van Franeker, J. A., et al. (2015). A global inventory of small floating plastic debris. Environ. Res. Lett. 10:124006. doi: 10.1088/1748-9326/10/12/124006
Veiga, J. M., Fleet, D., Kinsey, D., Nilsson, P., Vlachogianni, T., Werner, S., et al. (2016). Identifying sources of marine litter, MSFD GES TG Marine Litter Thematic Report, JRC Technical Report, EUR (2016), Vol. 28309. EU Science Hub: JRC Technical Report, 10.2788/018068.
Wakkaf, T., El Zrelli, R., Kedzierskid, M., Baltia, R., Shaieke, M., Mansourg, L., et al. (2020). Characterization of microplastics in the surface waters of an urban lagoon (Bizerte lagoon, Southern Mediterranean Sea): Composition, density, distribution, and influence of environmental factors. Mar. Pollut. Bull. 160:111625. doi: 10.1016/j.marpolbul.2020.111625
Zambianchi, E., Trani, M., and Falco, P. (2017). Lagrangian transport of marine litter in the Mediterranean Sea. Front. Mar. Sci. 5:5. doi: 10.3389/fenvs.2017.00005
Zayen, A., Sayadi, S., Chevalier, C., Boukthir, M., Ben Ismail, S., and Tedetti, M. (2020). Microplastics in surface waters of the Gulf of Gabes, southern Mediterranean Sea: Distribution, composition and influence of hydrodynamics. Est. Coast. Shelf Sci. 242:106832. doi: 10.1016/j.ecss.2020.106832
Keywords: microplastics, ocean modeling, biofouling, marine pollution, Mediterranean
Citation: Tsiaras K, Costa E, Morgana S, Gambardella C, Piazza V, Faimali M, Minetti R, Zeri C, Thyssen M, Ben Ismail S, Hatzonikolakis Y, Kalaroni S and Garaventa F (2022) Microplastics in the Mediterranean: Variability From Observations and Model Analysis. Front. Mar. Sci. 9:784937. doi: 10.3389/fmars.2022.784937
Received: 28 September 2021; Accepted: 11 February 2022;
Published: 10 March 2022.
Edited by:
Jun She, Danish Meteorological Institute (DMI), DenmarkReviewed by:
Lucia Fanini, Institute of Marine Biological Resources and Inland Waters, Hellenic Center for Marine Research, GreeceTomaso Fortibuoni, Istituto Superiore per la Protezione e la Ricerca Ambientale (ISPRA), Italy
Luis Francisco Ruiz-Orejón, Joint Research Centre, Italy
Muhammad Reza Cordova, Center for Oceanographic Research, Indonesian Institute of Sciences, Indonesia
Copyright © 2022 Tsiaras, Costa, Morgana, Gambardella, Piazza, Faimali, Minetti, Zeri, Thyssen, Ben Ismail, Hatzonikolakis, Kalaroni and Garaventa. This is an open-access article distributed under the terms of the Creative Commons Attribution License (CC BY). The use, distribution or reproduction in other forums is permitted, provided the original author(s) and the copyright owner(s) are credited and that the original publication in this journal is cited, in accordance with accepted academic practice. No use, distribution or reproduction is permitted which does not comply with these terms.
*Correspondence: Kostas Tsiaras, ktsiaras@hcmr.gr