CoastNet Dataset From Mondego, Tejo and Mira Estuaries: Multiparametric Measurements During 2020
 Paola Castellanos1*
  Ana C. Brito1,2
  Paula Chainho1,4
  Bernardo R. Quintella3,5
  Luis da Costa1
  Susana França1,3
  Henrique Cabral6
  José Lino Costa1,3
- 1MARE-Centro de Ciências do Mar e do Ambiente, Faculdade de Ciências da Universidade de Lisboa, Lisboa, Portugal
- 2Departamento de Biologia Vegetal, Faculdade de Ciências da Universidade de Lisboa, Lisboa, Portugal
- 3Departamento de Biologia Animal, Faculdade de Ciências da Universidade de Lisboa, Lisboa, Portugal
- 4EST Setubal-CINEA, Instituto Politécnico de Setúbal, Setúbal, Portugal
- 5MARE-Centro de Ciências do Mar e do Ambiente, Universidade de Évora, Évora, Portugal
- 6INRAE, Centre Nouvelle-Aquitaine Bordeaux, UR EABX (Ecosystèmes Aquatiques et Changements Globaux), Cestas, France
Introduction
The Portuguese Coastal Monitoring Network (CoastNet) is a Research Infrastructure (RI) that is part of the Portuguese Roadmap of RIs of Strategic Relevance (FCT, 2020). It was designed to improve the understanding of Portuguese coastal ecosystems functioning through the development of a remote coastal monitoring system. One of the key features of CoastNet lies in the possibility to aggregate data from different sources (e.g. historical data, in-situ buoys, satellite) and to make them publicly available at CoastNet's Geoportal (http://geoportal.coastnet.pt), where all users can explore, visualize and download all datasets. CoastNet has four main lines of action: (i) Coastal Remote Sensing System, constituted by a satellite data center, providing higher-level products, such as sea-surface temperature, sea surface height and ocean color remote sensing data; (ii) Environmental and Biological Monitoring System, including the deployment of a set of sensors to collect real-time measurements of environmental and biological in-situ data at the Mondego, Tejo and Mira estuaries (Figure 1); (iii) Portuguese Coastal Tracking Network, involving the deployment of several lines of biotelemetry acoustic receivers, located at strategic locations, to detect tagged marine animal; and (iv) a web-based platform (Geoportal), which integrates the data from different sources and provides open access to the information. This interface allows users to do simple operations, such as to visualize time-series for a selected period, superimpose data of different parameters, create transects and animations. Currently, CoastNet provides a crucial contribution for the improvement of the permanent monitoring programs on transitional and coastal waters. The unique nature of CoastNet's Environmental and Biological Monitoring System (EBMS) is highlighted by its capacity to provide continuous in-situ data collected in an autonomous mode and constitutes a fundamental tool to comply with the European Union (EU) Policy regulations on water quality (e.g. Water Framework Directive, Marine Strategy Framework Directive). Such Directives require a detailed assessment of the state of the environment, a definition of “good environmental status” at a regional level and the establishment of clear environmental targets and monitoring programs by each EU Member State. The CoastNet's monitoring capacity also contributes to fulfill the urgent need identified by the Portuguese Strategy for the Sea for an automatic collection of biological and environmental data in the marine environment, which is also key for licensing purposes and to develop local ecosystem models. The present work aims to: (i) release the continuous in-situ measurements for public use; (ii) describe the content of this dataset; and iii) provide an overview of the temporal (daily and seasonal) and spatial variation of the physico-chemical parameters.
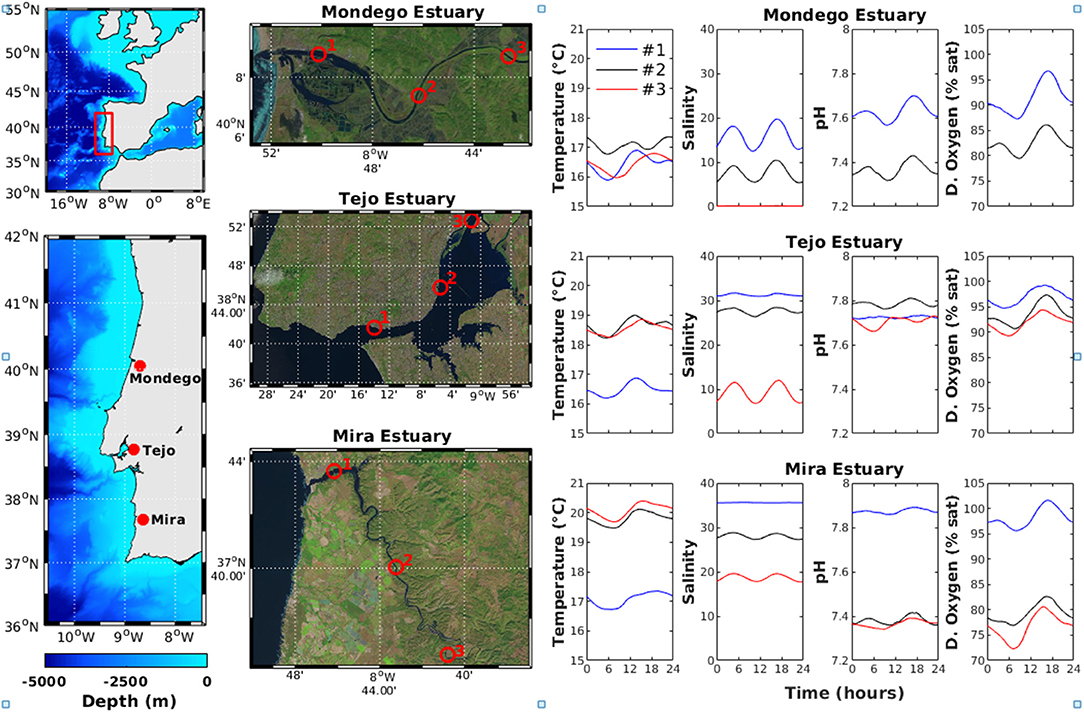
Figure 1. Location of the three estuaries and the three sondes in each of them (left). Intraday means of Temperature, Salinity, pH and Oxygen (saat%) at buoys 1 to 3 (blue, black and redlines, respectively).
Methods
The CoastNet in-situ monitoring system is composed of eight buoys and one immovable structure, three in each of the three above-mentioned estuaries, with the locations being specifically designed in order to cover the estuarine longitudinal gradient (Figure 1). Their IDs and location coordinates are displayed in Table 1 (Supplementary Material). The immovable structure was placed in the Mondego estuary (Mondego#2). Each of these buoys initiated the process of collecting data at different starting dates, which depended on the mooring deployment (Table 1). The datasets presented herein were collected during the whole year of 2020, from January 1st to December 31th, although the system is still continuously collecting data. Nevertheless, data from June 2019 onwards is also available at the geoportal (see Table 1).

Table 1. Coordinates of the nine locations and their respective starting dates.
Eight YSI/EXO2 multisensor sondes for estuary and ocean monitoring (www.ysi.com/exo) were installed in each location, except in Mondego#3, which is equipped with a Hobo conductivity sensor and data logger. This sonde is a cost-effective logger for measuring salinity, conductivity and temperature in saltwater environments (www.onsetcomp.com). Multisensor sondes are registering the following parameters: Temperature (°C), Salinity, pH and Dissolved Oxygen (%sat and mg/l). The specifications for these sondes and sensors are available in the “In-situ Sensors Technical Documentation” (see http://geoportal.coastnet.pt/). This monitoring system is carrying out measurements just below the surface every 15 min. All collected data are locally stored in data loggers and transmitted to the geoportal through the local mobile phone network four times per day (~6 h) for Near Real-Time data. It is worthwhile mentioning that the stand-alone sonde at Mondego#3 is not capable of transmitting near real-time data but data is regularly downloaded from the logger and uploaded to the geoportal.
Alterations in the electrochemical sensors installed in the multisensor sondes may result from the composition of the water, changes in the environmental conditions or device characteristics. These slowly varying changes in instrument background or sensitivity are often called sensor drifts. Like any other analytical instrument, these sensors require regular calibration to account for these changes and to ensure their correct functioning.
The design of the CoastNet in-situ monitoring system compensates for these drifts with two complementary strategies. First, sensors are frequently recalibrated using standard solutions during periodic maintenance of the buoys, sondes and sensors, which occur every two to three months. This interval was specifically calculated to ensure that the signals exceeded by far the drift of the sensors, allowing a maximum drift of 5%, while typically lower than that. It is also reasonable in terms of costs and logistics. Second strategy is through drift compensation (or correction), where the basic idea is to eliminate the variation in the sensor signal ascribed to sensor drift. This drift compensation method is based on the following criteria: the sensor drift follows an approximately linear course with time, where each sensor has a unique drift characterization and the drift should be modeled and compensated by means of a simple computational approach (Haugen et al., 2000). It is also of utmost importance to allow this drift correction without information loss.
When accessing the Geoportal, the user will find the “in-situ Sensor” folder on the left-hand side of the screen with both options: Near Real-Time and Time-Series data. The data presented in this Report are part of the Time-Series data, which is considered the most accurate dataset. Data were extracted directly from the data loggers during the calibrations in the field to recover the complete sets of data, since mobile network coverage failures do not always allow data transmission at the established frequency. The drifts in the recorded data were also corrected based on the differences found during sensor calibrations. These differences are divided by the number of data in the period, giving the slope for the measurement interval. Subtle changes in the sensors or the standards conditions might also lead to an offset addition (Equation 1). The final drift correction is then performed by subtracting (or adding) the drift component from the raw data for the period in analysis, from zero in the moment of the former calibration to the entire difference at the end of the period, following the equation below:
where Dcorr is the new value after correction, I is the index of the data within the series and Draw the raw value as obtained from the loggers. The slope of the drift curve is also included. It is assumed that the drift is additive and that the magnitude of the perturbation is independent of the signal level. Every individual sensor data is provided with a unique time-dependent drift curve. See works of Panchuk et al. (2016), Rudnitskaya (2018), and Kovacs et al. (2020) for a thorough discussion about drift corrections.
Moreover, Data Quality Control was also ensured by independent in-situ measurements. This monitoring system has now finished its first phase of implementation. Correction and validation procedures are still under development, which should be acknowledged when using these data. In the future, datasets will be reanalyzed at an annual basis to correct for any inconsistencies, ensuring confidence in measurements. Gaps in the dataset occur as a consequence of incrustations or mud accumulation over the sensors (sending incoherent data, which are then excluded), during periods of sonde or buoy displacement and also during approximately 45 min periods every two or three months for the maintenance and calibration procedures. Outliers in the data are also excluded. Exceptions are (i) the period between 14/11/2019 and 20/02/2020 in the Tejo#2 buoy, when the sonde was removed for inland maintenance; (ii) the period between 23/06/2020 and 12/08/2020 in the Tejo#1 buoy, when the buoy and mooring infrastructure were removed due to bottom dredging activities at the surrounding areas; and (iii) the period between 09/07/2020 and 06/12/2020 in the Mondego#3 buoy, when an internal battery problem induced the sonde to stop registering data.
Data Description
The dataset presented in this article include the following parameters: Temperature (°C), Salinity, pH and Dissolved Oxygen (% of air saturation and concentration in mg/l). It is important to keep in mind that the Mondego#3 buoy withholds a different sonde, which is only registering Temperature and Salinity. The figures included herein present the overall intraday variation of these physico-chemical water parameters (Figure 1), as well as the time-series obtained from the nine sondes deployed in the Tejo (Figure 2), Mondego (Supplementary Figure 1) and Mira (Supplementary Figure 2). The within-day values were computed as running-means with a 24 h regular window, considering the whole dataset.
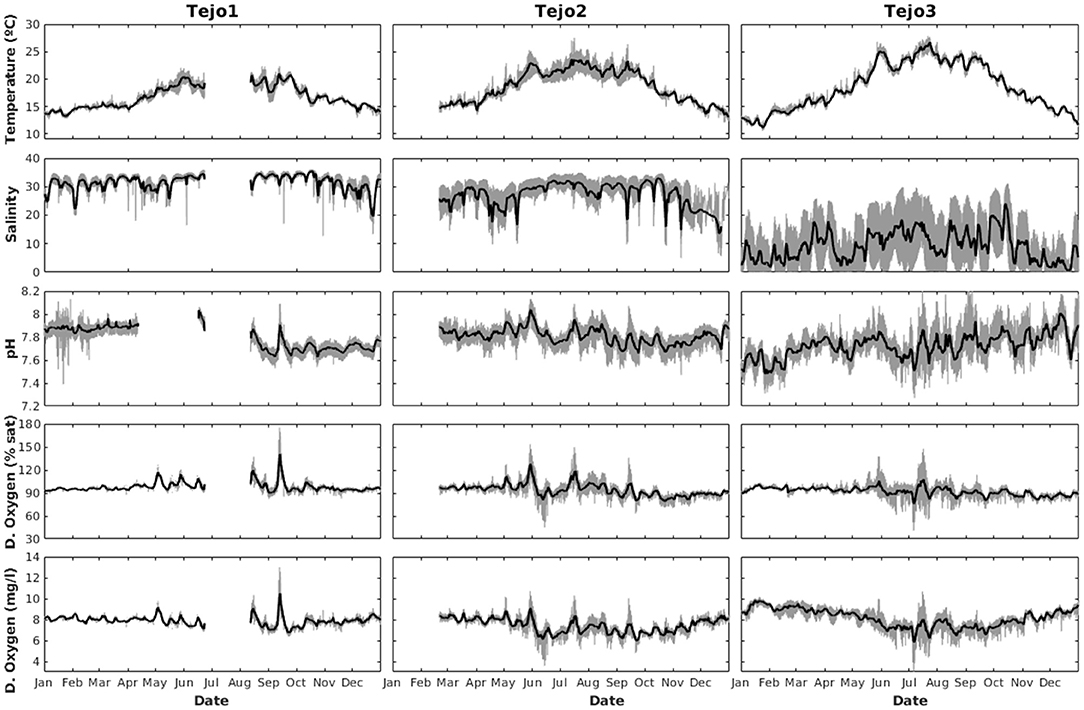
Figure 2. Time-series of Temperature (°C), Salinity, pH and Dissolved Oxygen (sat% and mg/l) at the Tejo Estuary (gray lines) and its 24h running-mean (black lines).
Regarding the intraday variation, there are two clear patterns observed. First, the night-day effect is visible, especially in the two physico-chemical parameters that are strongly dependent on the irradiance intensity, i.e. Temperature and Dissolved Oxygen (Figure 1). Generally, Temperature increases from 6 AM onwards, reaching a peak between 1 and 2 PM, following the natural daily variation of irradiance in a specific location, caused by the rotation of the planet. Dissolved Oxygen increases during daytime, also from 6 AM onwards, reaching a peak at around 6 PM. This is likely to be caused by increased photosynthesis that releases oxygen to the environment. However, the effect of Temperature increase on oxygen concentrations should not be neglected. Second, tidal range has a key role in the variation of the other physico-chemical parameters, namely Salinity and pH. These parameters strongly depend and follow the intrusion of seawater and its mixing with freshwater. Moreover, the Portuguese coast is usually presenting two daily peaks defined by the semidiurnal tidal range. In the Mondego estuary, the most stable Salinity values are observed at the upstream buoy, where the freshwater influence is high. On the opposite, in the Mira estuary, the most stable salinity values are observed in the most coastal buoy, where offshore waters have a strong influence. Nevertheless, both effects interact, affecting the variation of all physic-chemical parameters. The datasets of the continuous monitoring also highlight the effects of the river flow and volume of the water body mass on the resilience of the environmental conditions in estuarine water bodies, showing lower daily and seasonal fluctuations in the Tejo estuary when compared to the others.
Annual datasets show the seasonal variability such as the marked annual variability on Temperature, with summer maxima and winter minima. During 2020 temperature ranged from 8.82°C in Mondego#1 during winter (January) to 28.76°C in Mira#3 during summer (July). The maxima are higher on the buoys #2 and #3 in all estuaries, in opposition to the buoys #1, which are nearer to the sea and therefore under higher influence of the upwelling process in the coastal waters. The minima, on the other hand, are lower in the northernmost estuary (Mondego). The time-series of temperature also show a higher variability within tidal frequencies in the buoys #1 and #2 in the Tejo and Mondego estuaries, while only in buoy #1 in the Mira. This phenomenon is centered around summertime, when the horizontal gradients intensify due to the difference between the warm waters of the shallow upper-estuaries and the cold upwelled waters near the coast.
The Salinity data also showed seasonality and horizontal gradients. The observed values ranged from near-zero several times along the year in Tejo#3 and most of the time in Mondego#3, both in the upper-estuary, to the maxima of 37.31 in Mondego#1, observed in June. While the drier period attains the peak in October, the moment of greater river discharges occurred at the end of December when a marked decrease in the salinity values was observed in all three estuaries. The variability within tidal frequencies in these time-series are different from the previous temperature case, attesting for differences in the salinity gradients of the three estuaries. In the Mira estuary, the data from Mira#1 buoy showed a marine predominance and lower variability while higher and similar was observed in the other two buoys. In the Tejo, although Tejo#1 buoy data also presented a relatively lower variability, the variability increased from buoy #2 to #3. On the other hand, in Mondego the buoys #1 and #2 presented a high variability in those frequencies, while the Mondego#3 buoy recorded mostly freshwater.
The pH data showed distinct patterns in relation to temperature and salinity data. Typically, the values vary more along the estuary, with values around 8 near the sea and a decrease toward the uppermost locations. The observed values of pH range from 6.62 in Mira#2 (December) to 8.43 in Mondego#1 (July). Both values, however, occurred in isolated events. A higher variability was seen in lower frequencies as a direct response to variations in river discharges and the ocurrence of lower pH values in freshwaters. As expected, these intense value oscillations were more commonly seen in the buoys of the upper-estuary.
As it also occurred with the pH, the dissolved oxygen data had a higher variability in the subtidal (low) frequencies in the upper-estuary, rather than in the tidal frequencies. Nonetheless, when considering the concentrations in mg/l, a clear seasonal pattern arises with a larger content of dissolved oxygen in the water during winter, due to the greater solubility in colder waters, and with the opposite occurring during summer. The dissolved oxygen data during the measurement period, in terms of % of air saturation, ranged from 26.68% (November) to 183.29% (May), both in Mira#3. Dissolved oxygen concentrations ranged from 2.16 mg/l, measured in November at Mira#3 to 13.55 mg/l, measured in July in Mondego#1.
In general, this dataset allows the description of spatial and temporal variations of physical-chemical water parameters in three Portuguese estuaries. These data provide an overview on time scales from hours to months and cover the salinity gradient in each estuarine system. Given its unique nature at the national level, the dataset presented herein, which is publicly available at CoastNet's Geoportal, is a valuable contribution toward understanding the ecosystem functioning in estuaries.
Data Availability Statement
Publicly available datasets were analyzed in this study. This data can be found here: http://geoportal.coastnet.pt.
Author Contributions
PCa is the leader of the article, responsible for the compilation of the data. AB was the one who verified the quality of the data. PCh and LC responsible for the frequency of sensor calibration. BQ and SF were responsible for the installation of the all sensors. HC and JC are the principal investigators of the Coast Net infrastructure. All authors contributed to the article and approved the submitted version.
Funding
This publication was financed by Portuguese national funds through FCT - Fundação IP under project reference UIDB/04292/2020, and by the European Union's Horizon 2020 Research and Innovation Programme under grant agreement N810139: Project Portugal Twinning for Innovation and Excellence in Marine Science and Earth Observation - PORTWIMS. The CoastNet Research Infrastructure (http://coastnet.pt) was funded by the Foundation for Science and Technology (FCT) and the European Regional Development Fund (FEDER), through LISBOA2020 and ALENTEJO2020 regional operational programmes, in the framework of the National Roadmap of Research Infrastructures of strategic relevance (PINFRA/22128/2016). This study also received further support from FCT through MARE's strategic programme (UID/MAR/04292/2019). AB, SF, PC, and BQ were funded by FCT through the Scientific Employment Stimulus Programme: CEECIND/00095/2017, CEECIND/02907/2017, 2020.01797.CEECIND, and 2020.02413.CEECIND, respectively.
Conflict of Interest
The authors declare that the research was conducted in the absence of any commercial or financial relationships that could be construed as a potential conflict of interest.
Publisher's Note
All claims expressed in this article are solely those of the authors and do not necessarily represent those of their affiliated organizations, or those of the publisher, the editors and the reviewers. Any product that may be evaluated in this article, or claim that may be made by its manufacturer, is not guaranteed or endorsed by the publisher.
Acknowledgments
We would like to thank for all the support provided by the Lisbon Port Administration (Administração do Porto de Lisboa), Figueira da Foz Port Administration (Administração do Porto da Figueira da Foz) and the INCD - National Distributed Computing Infrastructure.
Supplementary Material
The Supplementary Material for this article can be found online at: https://www.frontiersin.org/articles/10.3389/fmars.2021.707089/full#supplementary-material
Supplementary Figure 1. Time-series of Temperature (°C), Salinity, pH, Oxygen (sat% and mg/l) at the Mondego Estuary (gray lines) and its 24h running-mean (black lines).
Supplementary Figure 2. Time-series of Temperature (°C), Salinity, pH, Oxygen (sat% and mg/l) at the Mira Estuary (gray lines) and its 24h running-mean (black lines).
References
FCT (2020). Portuguese Roadmap of Research Infrastructures- 2020 Update. Fundação para a Ciência e a Tecnologia, 110pp. ISBN: 978-972-667-357-6. Available online at: https://www.fct.pt/media/docs/Portuguese_Roadmap_Infrastructures2020.pdf
Haugen, J., Tomic, O., and Kvaal, K. (2000). A calibration method for handling the temporal drift of solid state gas-sensors. Analytica Chimica Acta 407, 23–39. doi: 10.1016/S0003-2670(99)00784-9
Kovacs, Z., Szöllosi, D., Zaukuu, J. Z., Bodor, Z., Vitális, F., Aouadi, B., et al. (2020). Factors influencing the long-term stability of electronic tongue and application of improved drift correction methods. Biosensors. 10, 74. doi: 10.3390/bios10070074
Panchuk, V., Lvova, L., Dmitry Kirsanov, D., Gonçalves, C. G., Natale, D. I., et al. (2016). A extending electronic tongue calibration lifetime through mathematical drift correction: case study of microcystin toxicity analysis in waters. Sensor Actu Chem. doi: 10.1016/j.snb.07045
Keywords: near real-time (NRT), essential ocean variables (EOV), estuaries, dataset, ecosystem-based management
Citation: Castellanos P, Brito AC, Chainho P, Quintella BR, da Costa L, França S, Cabral H and Costa JL (2021) CoastNet Dataset From Mondego, Tejo and Mira Estuaries: Multiparametric Measurements During 2020. Front. Mar. Sci. 8:707089. doi: 10.3389/fmars.2021.707089
Received: 08 May 2021; Accepted: 26 October 2021;
Published: 02 December 2021.
Edited by:
Angel Borja, Technological Center Expert in Marine and Food Innovation (AZTI), SpainReviewed by:
Pablo Muniz, Universidad de la República, UruguayPaula Canal-Verges, University of Southern Denmark, Denmark
Copyright © 2021 Castellanos, Brito, Chainho, Quintella, da Costa, França, Cabral and Costa. This is an open-access article distributed under the terms of the Creative Commons Attribution License (CC BY). The use, distribution or reproduction in other forums is permitted, provided the original author(s) and the copyright owner(s) are credited and that the original publication in this journal is cited, in accordance with accepted academic practice. No use, distribution or reproduction is permitted which does not comply with these terms.
*Correspondence: Paola Castellanos, pcossa@fc.ul.pt