Climate Services Transformed: Decision-Making Practice for the Coast in a Changing Climate
 Judy Lawrence
 Scott Stephens2
  Robert G. Bell
 Rebecca Priestley
- 1Climate Change Research Institute, Te Herenga Waka – Victoria University of Wellington, Wellington, New Zealand
- 2National Institute of Water and Atmospheric Research, Hamilton, New Zealand
- 3Centre for Science in Society, Te Herenga Waka – Victoria University of Wellington, Wellington, New Zealand
Climate services play an important role in informing decision makers about how to reduce the impact of climate-related hazards, by building capacity through access to relevant data and information globally and regionally. Different types of climate services include long-term warning systems, projections, monitoring/triggers and signals, risk evaluation tools, and behavior change tools. However, climate services are often promoted as “improving uptake” and “translating and communicating science” This framing, which assumes that climate services are developed by scientists and “provided” to users, has limitations for decision makers designing actions to address changing coastal hazard risk driven by sea-level rise. Acting upon the IPCC 1.5 Degree Special Report imperative for urgent actions to reduce exposure and vulnerability at the coast will require a transformation in the way climate services are developed and delivered, in tandem with an understanding of the decision-making and policy context. Tools and policies must explicitly address deepening uncertainty and changing risk over long timeframes. Their use also must be compatible with the jurisdiction’s institutional frameworks and decision-making practice and relevant to user needs as changing risks unfold. Attention to both short- and long-term decisions are paramount to avoid lock-in and path dependency of decisions taken today, and to ensure relevance for the timeframes of investments in infrastructure and settlements. This requires actionable science and usable tools developed through multi-disciplinary efforts by scientists, co-producing them with decision agencies and communities. We give examples of different types of climate services developed with users and draw out some universal lessons learned in developing and applying them in New Zealand.
Introduction
In 2011, the World Meteorological Organization issued a global framework for climate services focused on assisting decision makers. The framework envisaged that the development of climate services would involve engagement between users and providers and would lead to a reduction in the impact of climate-related hazards and an increase in the benefits from benign climate conditions. Inherent in the framework was the building of capacity, and open access to relevant data and information globally and regionally, resulting in a shift in risk reduction (Hewitt et al., 2012).
However, the literature reports that in UK and USA the public does not feel well informed about, and has difficulty understanding sea-level rise (SLR) (Thomas et al., 2015; Covi and Kain, 2016), despite ample evidence of SLR causing coastal flooding now, the low uncertainty bounds around SLR to 2050, and the current and projected impacts of SLR on people and their assets (Kulp and Strauss, 2019; Paulik et al., 2020). A New Zealand study confirmed these findings (Priestley et al., 2021) and showed that the public mistakenly overestimates the scientifically plausible amount of SLR by 2100 and incorrectly identifies melting sea ice as its primary causal mechanism.
A review in 2016 of lessons learned and future prospects for climate services (Brasseur and Gallardo, 2016) highlighted that there was insufficient awareness by stakeholders of their vulnerability to climate change, a lack of relevant products and services, and inappropriate product formats and delivery mechanisms. In a paper focusing on SLR, Hinkel et al. (2019) highlighted the lack of systematic analyses of users’ needs, in particular, in different decision contexts and the users’ level of risk and uncertainty tolerances. The principal reason for these disconnections between climate services and users, was a “top down” framing of climate services by those providing them, on the assumption that users did not understand the contextual issues – creating a disjunct between science outputs and decision-making needs and outcomes. Furthermore, there was a lack of understanding by scientists that their users and requirements were diverse, and that a range of formats and products were needed. A tension was highlighted between the different timeframes of the scientists and users and whether the analytical tools available (predominantly statistical and projections) could provide the certainty that decision makers say they need, within the institutional decision and legal frameworks in which they operate. Users typically work within a context that demands certainty which is often reflected in short-term and reactive decision-making processes. Lastly, the delivery mechanisms were not tuned to user needs. The 2016 review identified the need for a more nuanced architecture for climate services with attention to tailoring climate services to different users and delivering climate services at difference scales – global, national, and subnational. Furthermore, it highlighted the need for more diverse teams producing climate services and distributing and communicating the products. The review highlighted the need to build the capability of users and scientists in designing policies to reduce the risks of climate change and develop the enabling conditions necessary for climate resilient decisions, such as legislation and funding mechanisms, that support the implementation of policies.
The current focus on “improving uptake” and “translating and communicating science,” assumes a business model where climate services are developed by scientists and “provided” to users (Cavelier et al., 2017). This approach assumes that “client” needs have been assessed and that services provided will realize those needs. It can also follow a “deficit model” approach to science communication (Irwin, 2014), where knowledge holders (in this case scientists) assume that providing accurate and up to date information to users (correcting their “knowledge deficit”) is enough to ensure rational decision making with regard to climate risk.
This approach has severe limitations for decision makers assessing climate risks and designing actions to address changing coastal risks from sea-level rise, for example. In their paper on managing the risks of SLR, Kopp et al. (2019) discuss the need for usable science to inform decision making that must address long lag-times, irreversible losses, and deep uncertainty. For intra and intergenerational decisions to be made at different spatial scales, they stress the importance of multidisciplinary understanding across natural and social sciences, engineering, decision science, and political economy.
In New Zealand we have found that the factors discussed by Kopp et al. (2019) are necessary for climate services to address uncertainty and ongoing changing risk and enable actions to be taken pre-emptively, to avoid and reduce the worsening impacts of SLR. For example, this understanding informed the move to provide SLR projections as increments of SLR (Stephens et al., 2017), rather than specific projection scenarios. It has enabled SLR to be directly linked to local adaptation thresholds (Kool et al., 2020). This approach enables coastal hazard and risk assessments to be scenario-neutral, rather than having to make decisions on what RCP to use. This facilitates a direct line of enquiry by stakeholders to what the adaptation thresholds might be in different parts of low-lying localities. Scenarios for SLR can then be used to bracket the timing of the adaptation threshold and enable stress-testing of the lifetime and efficacy of short-term actions and longer-term adaptation options (Stephens et al., 2017)1.
If the institutional frameworks and decision-making practice are compatible with the problem space (change and deepening uncertainty), both short- and long-term decisions can help avoid lock-in and path dependency (Haasnoot et al., 2013). Integrating the timeframes of investments in infrastructure and settlements can also assist (Kool et al., 2020). Multi-disciplinary efforts by scientists working together closely and co-productively with decision agencies, their professional advisors, and communities enables knowledge acquisition for developing a range of approaches and understanding values and preferences. However, Hinkel et al. (2019) point out that the preferences of users may not always lead to good outcomes, due to biases, partial knowledge, and conventions.
Here, we present different types of climate services such as long-term warning systems, projections, monitoring/triggers and signals, risk evaluation tools, and behavior change tools, illustrating them with New Zealand examples, including a red-alert tide calendar to pre-warn of potential coastal flooding days in low-lying areas; sea-level rise exceedance nomographs; serious games to embed understanding of uncertainty and changing risk that can bridge to the application of dynamic adaptive pathways planning (DAPP) (see section “Dynamic Adaptive Pathways Planning”); national-scale application of a risk-evaluation tool to identify what is at risk and its cost; information defining asset exposure and flooding likelihood relevant to the banking and insurance industries as they enter the new transparent disclosure regimes; and lessons from the application of DAPP processes. From these examples grounded in real-world practice, we draw out universal lessons learned in developing and applying them.
Warning of Coastal Flooding
Coastal flooding is a major global hazard with records of historical events back to 1200 AD killing hundreds of thousands of people and causing billions of dollars of damage to property and infrastructure (Pugh, 1987; Lagmay et al., 2015; Needham et al., 2015; Haigh et al., 2016). Globally, it has been estimated that up to 310 million people are already exposed to a 1 in 100-year flood from the sea (Jongman et al., 2012; Hinkel et al., 2014; Muis et al., 2016). In New Zealand, this includes 72,000 people, or 1.5% of the population (Paulik et al., 2020). The number of people exposed to such flooding will markedly increase globally. It has been estimated that 0.2–4.6% of global population will be flooded annually under 25–123 cm (RCP2.6–RCP8.5) of global mean SLR without additional adaptations (Hinkel et al., 2014). Furthermore globally, 630 million exposed people currently live on land below projected annual flood levels for 2100 (Kulp and Strauss, 2019). Flooding can occur during very high tides (Ray and Foster, 2016), or during storm-surges and any associated wave overtopping, combined with higher tides when low atmospheric pressure and strong winds drive the sea onto land (Tebaldi et al., 2012). Sometimes these processes can combine to produce very high storm-tides. Improved understanding of extreme sea level and coastal flooding events and the role of higher spring tides (Stephens et al., 2020) and their consequences is therefore important.
To understand and manage this risk exposure, government agencies, environmental and emergency managers and the insurance and banking sectors, all require knowledge of the likely frequency and magnitude of extreme storm-tide and wave overtopping events, how they compound with multiple drivers, and their clustering in time and space. Forecasts of the timing and magnitude of coastal hazards allow coastal or emergency managers to design appropriate responses, so they can significantly reduce risk and warn the communities affected. Two simple decision-relevant examples used in New Zealand are the “red-alert” tide calendar and sea-level exceedance nomographs.
The “Red-Alert” Tide Calendar
Stephens et al. (2014) was developed to support coastal management decisions (see Supplementary Material). It is a simple and practical tool that clearly communicates dates of higher-than-normal high tides to indicate when low-lying land is particularly vulnerable to coastal flooding (Figure 1). The red-alert tide calendar works well in regions where the variability of extreme sea levels is influenced substantially by the height of high tide (as in important precursor of for coastal flooding), rather than just by storm surges and associated waves) – such as in regions that do not experience tropical cyclones (hurricanes). In this respect, tides dictate the occurrence of extreme coastal sea levels over much of the world (Merrifield et al., 2013; Rueda et al., 2017; Stephens et al., 2020) with storm surges being a secondary effect. On that basis, the annual or 3 monthly red-alert calendars highlight the highest tide days so users can watch for adverse weather forecasts (onshore winds, low barometric pressure, wind waves and swell) leading up to the red-alert tide days (Stephens et al., 2014). The calendar is based on the premise that most extreme storm-tides are driven by more common moderate storm-surges combined with high perigean-spring (“king”) high tides, in tide-dominated locations, for example, within the United Kingdom and New Zealand (Haigh et al., 2016; Stephens et al., 2020). Extreme storm-tide elevations in New Zealand are highly correlated with and linearly related to mean spring high-tide elevation, noting spring-tide ranges (meso-tidal) at main coastal cities/towns vary from 1.4 to 3.8 m (Stephens et al., 2020). Climate-change impacts on extreme storm surge and waves are predicted to be modest in the New Zealand region (Cagigal et al., 2020).
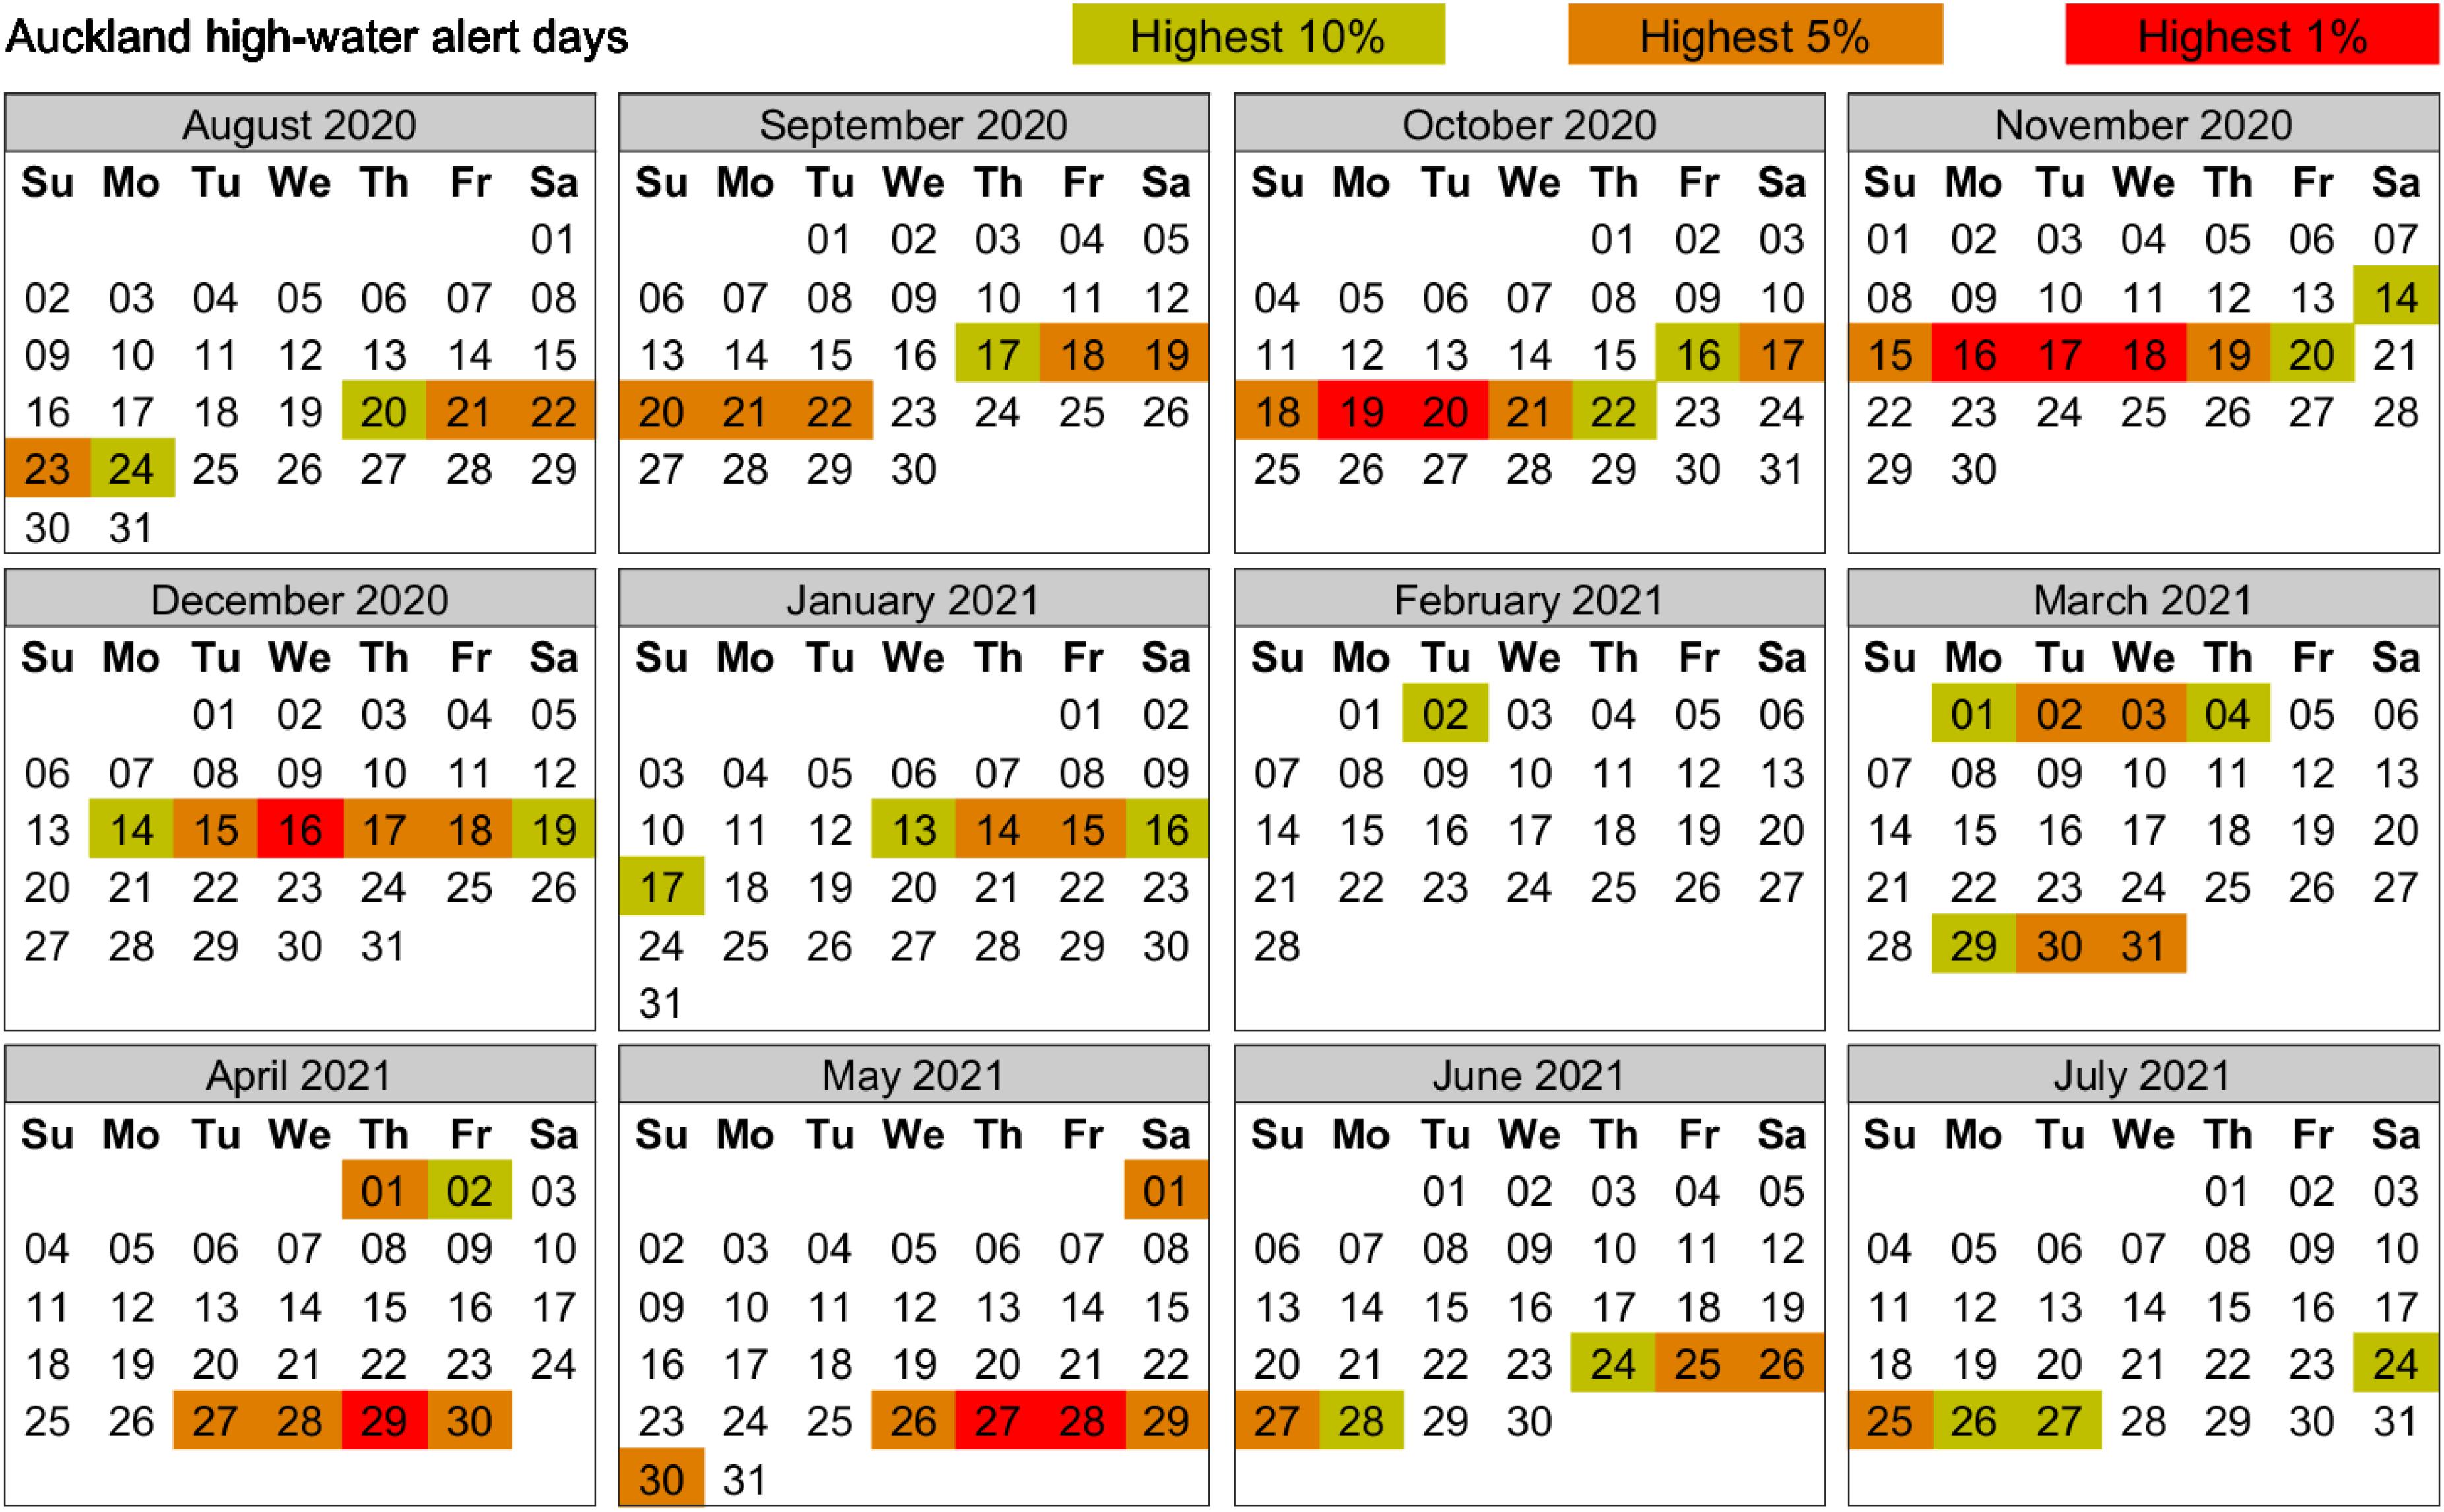
Figure 1. Red-alert tide calendar at Auckland, New Zealand. Color bars above show the highest 10% (green), 5% (brown) and 1% (red) of predicted high tides for that year.
Tides are routinely predictable using tidal harmonic analysis of sea-level gauge records or global ocean tide models (Ray, 1999; Matsumoto et al., 2000; Egbert and Erofeeva, 2002; Lyard et al., 2006). This means that red-alert tide calendars can be tailored and applied regionally and used as an early warning system for increased risk of coastal flooding in low-lying areas relative to local spring tide levels.
Red-alert tide calendars are highly visual and easily interpreted, and do not require technical expertise or interpretation of large amounts of data or text (Figure 1). Providing several alert thresholds allows users to use their experience to ‘‘tune in’’ to the calendar, by correlating the alert level with the severity of past local consequences. Thus, the high-water calendar can be used, for example, by local fishers making decisions on where to moor vessels, or by emergency managers, knowing that even a moderate swell event could cause significant flooding if it coincides with a red-alert date. The high-water calendar is easily updated and displayed on a web site or can be sent electronically for local distribution. There is demand now to upload these calendars months ahead of a new calendar year. The red-alert tide calendar has also spawned a citizen science programme in Auckland (New Zealand) through the King Tides Auckland Initiative (2020)2 which is aligned to the global network of King Tide Projects (e.g., Australia, Hawaii, Oregon). This initiative focuses on public engagement and awareness around the highest red-alert days each year, encouraging citizens to “snap the coast” at the designated time of the high tide and upload the photograph to the public web site. This forward-thinking public engagement initiative allows both scientists and citizens to utilize these red-alert tide days and visualize the impacts rising sea level may have on their communities in the future (Román-Rivera and Ellis, 2018).
Sea-Level Exceedance Nomographs
Are another simple tool for visually demonstrating the effect of SLR on the frequency of present-day high-water thresholds (Figures 2, 3). High-water exceedance nomographs can be used to assess the increase in the frequency of high waters exceeding present-day thresholds for different rises in mean sea level, under the assumption that future modification to tidal characteristics is relatively small (Bell, 2007, 2010). This is reasonable for open coast locations as an approximation to convey the key message of changes and onset of semi-permanent high-tide inundation. However, the nomographs should be used with caveats, particularly in estuaries and shallow semi-enclosed bays, where tidal ranges may change significantly either way, depending on sedimentation rates and morphology, which require detailed modeling to ascertain the changes over time. In the case where tidal changes over time are modest, the entire present-day high-water exceedance curve can be raised vertically by different values of SLR. Rueda et al. (2017); Stephens et al. (2014), and Stephens et al. (2018) showed that tide-dominated coastal flooding regimes will be more sensitive to SLR influenced by increasing frequency of extreme storm-tide events, compared to storm surge-dominated regions exposed to hurricanes, typhoons or tropical cyclones. This is particularly the case in New Zealand, where the tide is the key determinant of extreme storm-tide levels or wave overtopping. Sea-level exceedance nomographs have been found to simplify communication for users where a 0.5 m SLR would result in 60% of all high tides exceeding the present-day spring-tide mark (MHWS-10) (Figure 2 circles), which is exceeded currently by only 10% of high tides. This assumes that changes in tidal characteristics with rising sea level are not markedly different, as indicated by Devlin et al. (2017). Even higher percentages of high-tide exceedances will occur, relative to present-day spring tides, in areas with smaller tide ranges (micro-tidal regions), for a given increment of SLR (Bell, 2007, 2010).
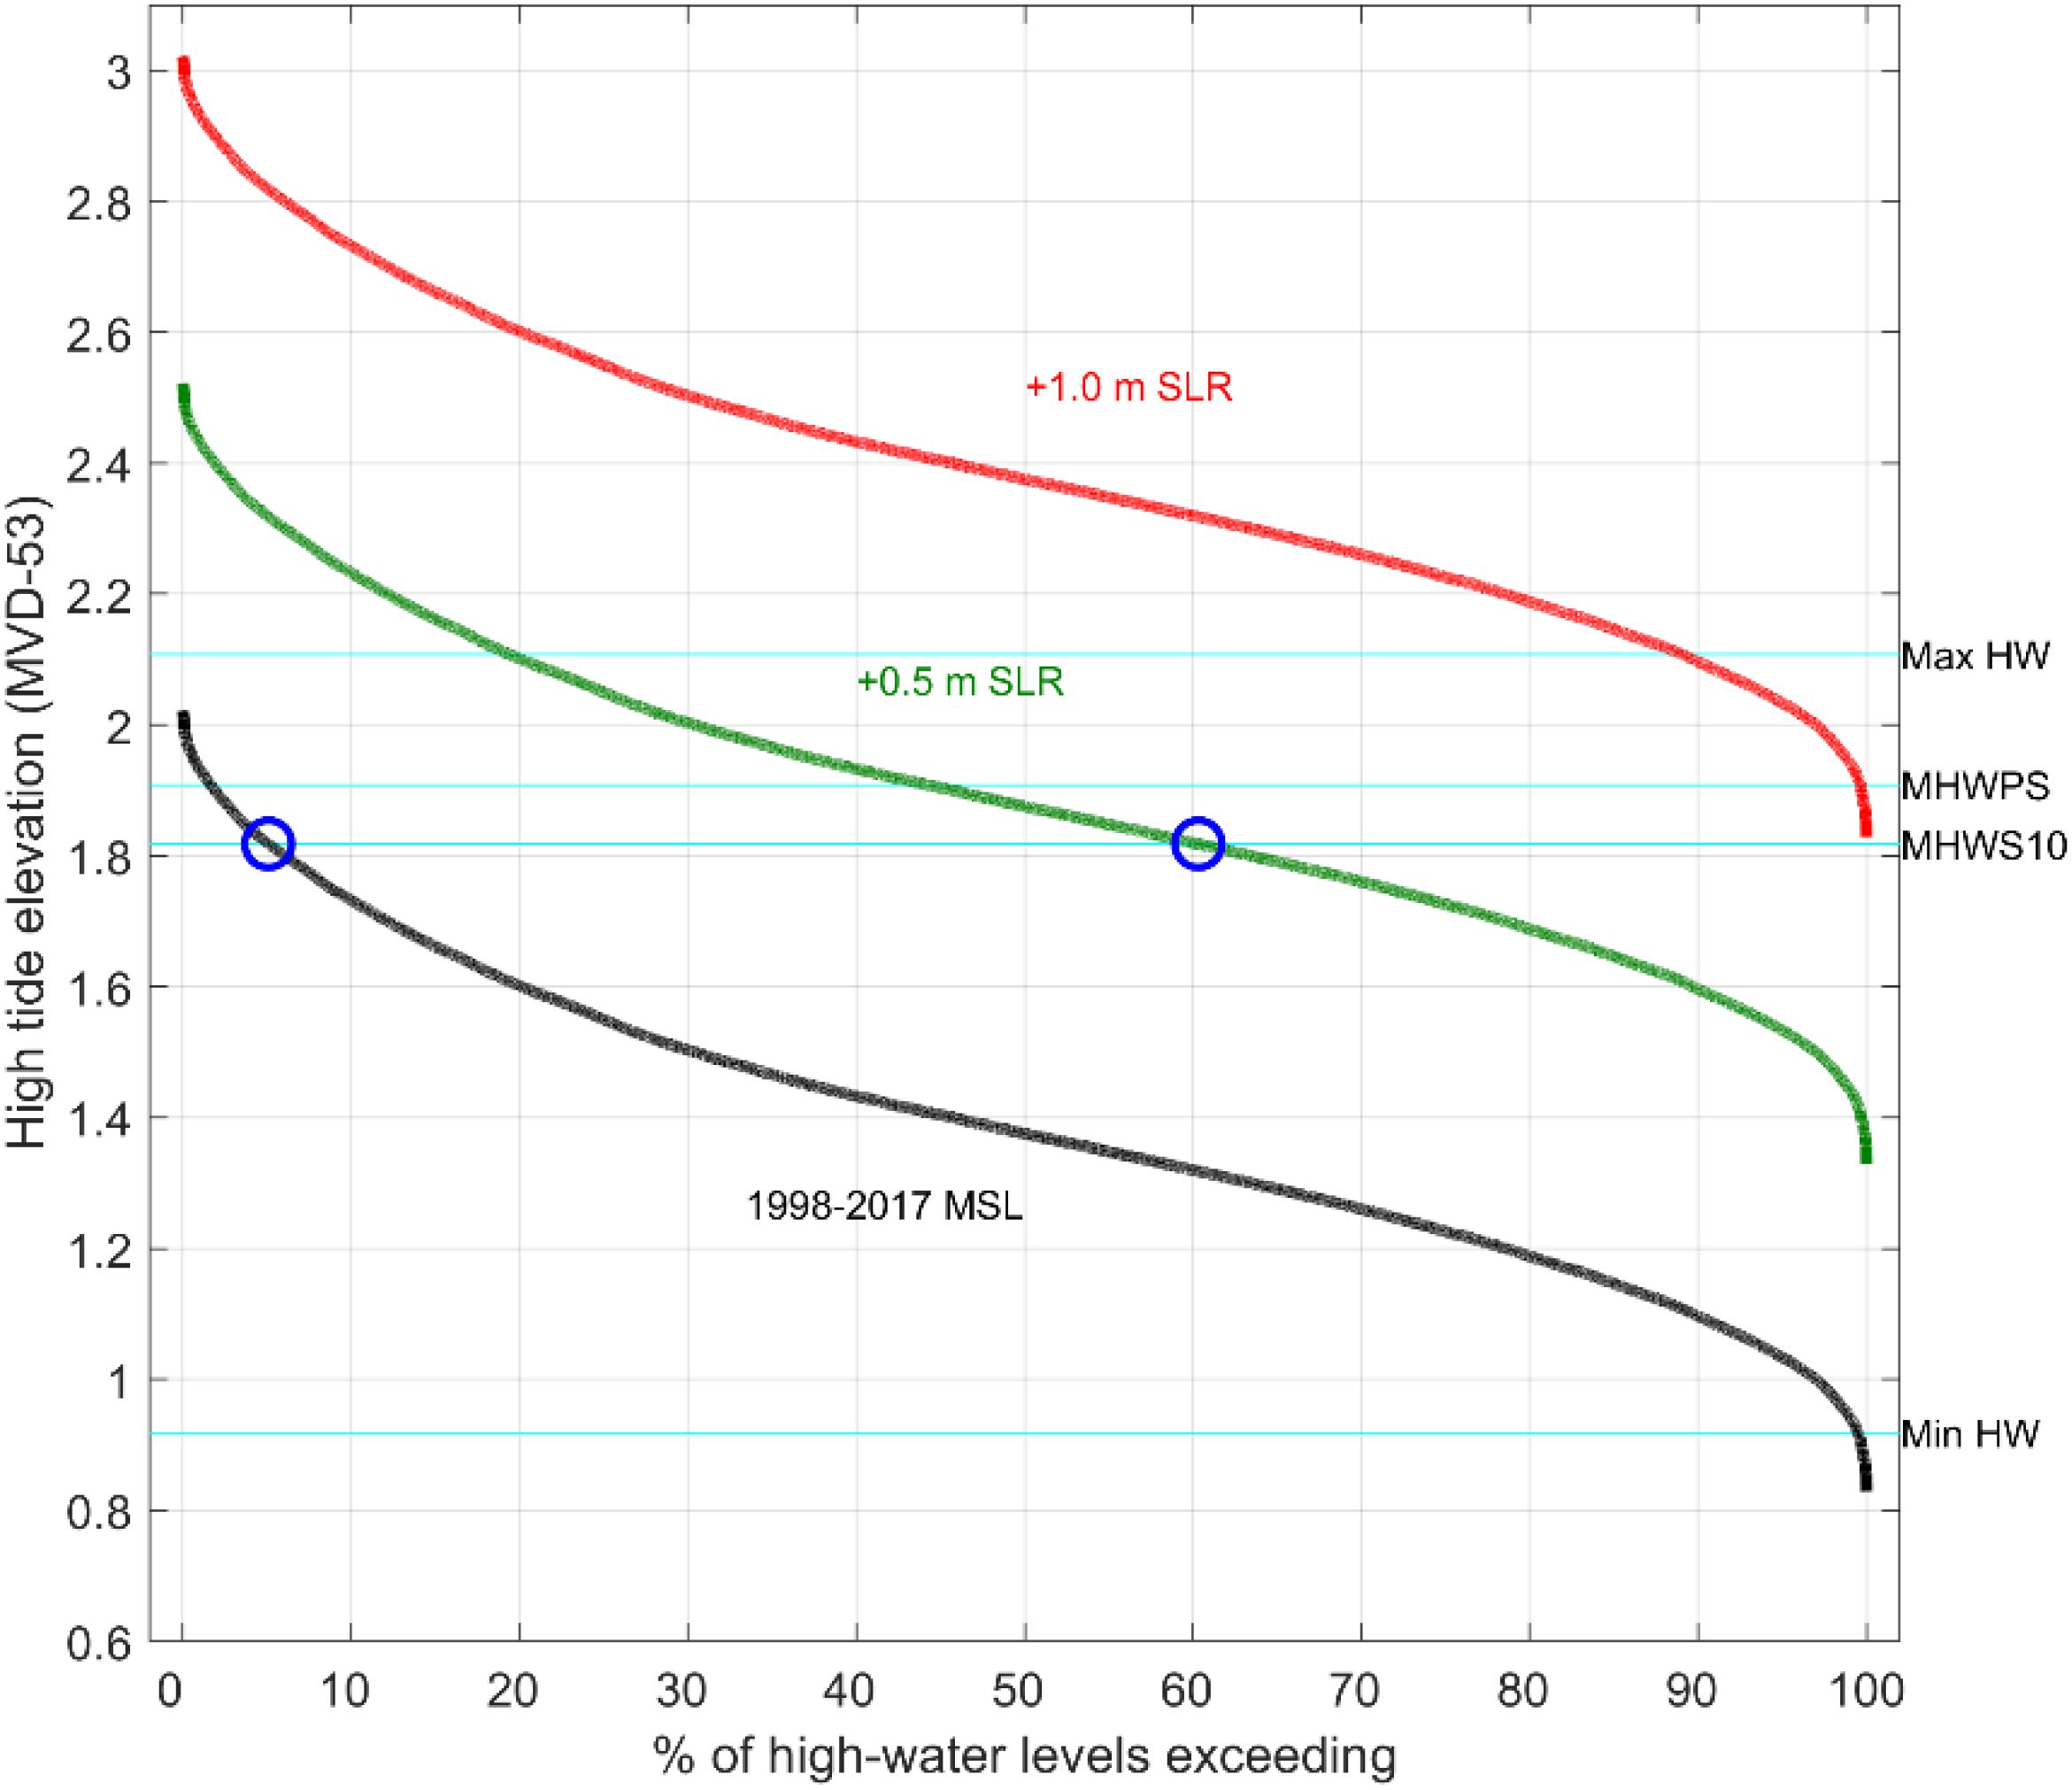
Figure 2. Tidal high-water exceedance nomographs for Tararu (Thames, Coromandel, New Zealand), at present-day mean sea level (MSL) and also offset by + 0.5 and + 1.0 m sea-level rise. Max HW, maximum predicted astronomical tide, MHWPS, mean high-water perigean springs, MHWS10, high-tide height exceeded by the highest 10% of all predicted high tides, Min HW, minimum predicted astronomical tide. (MVD-53 is the regional vertical datum).
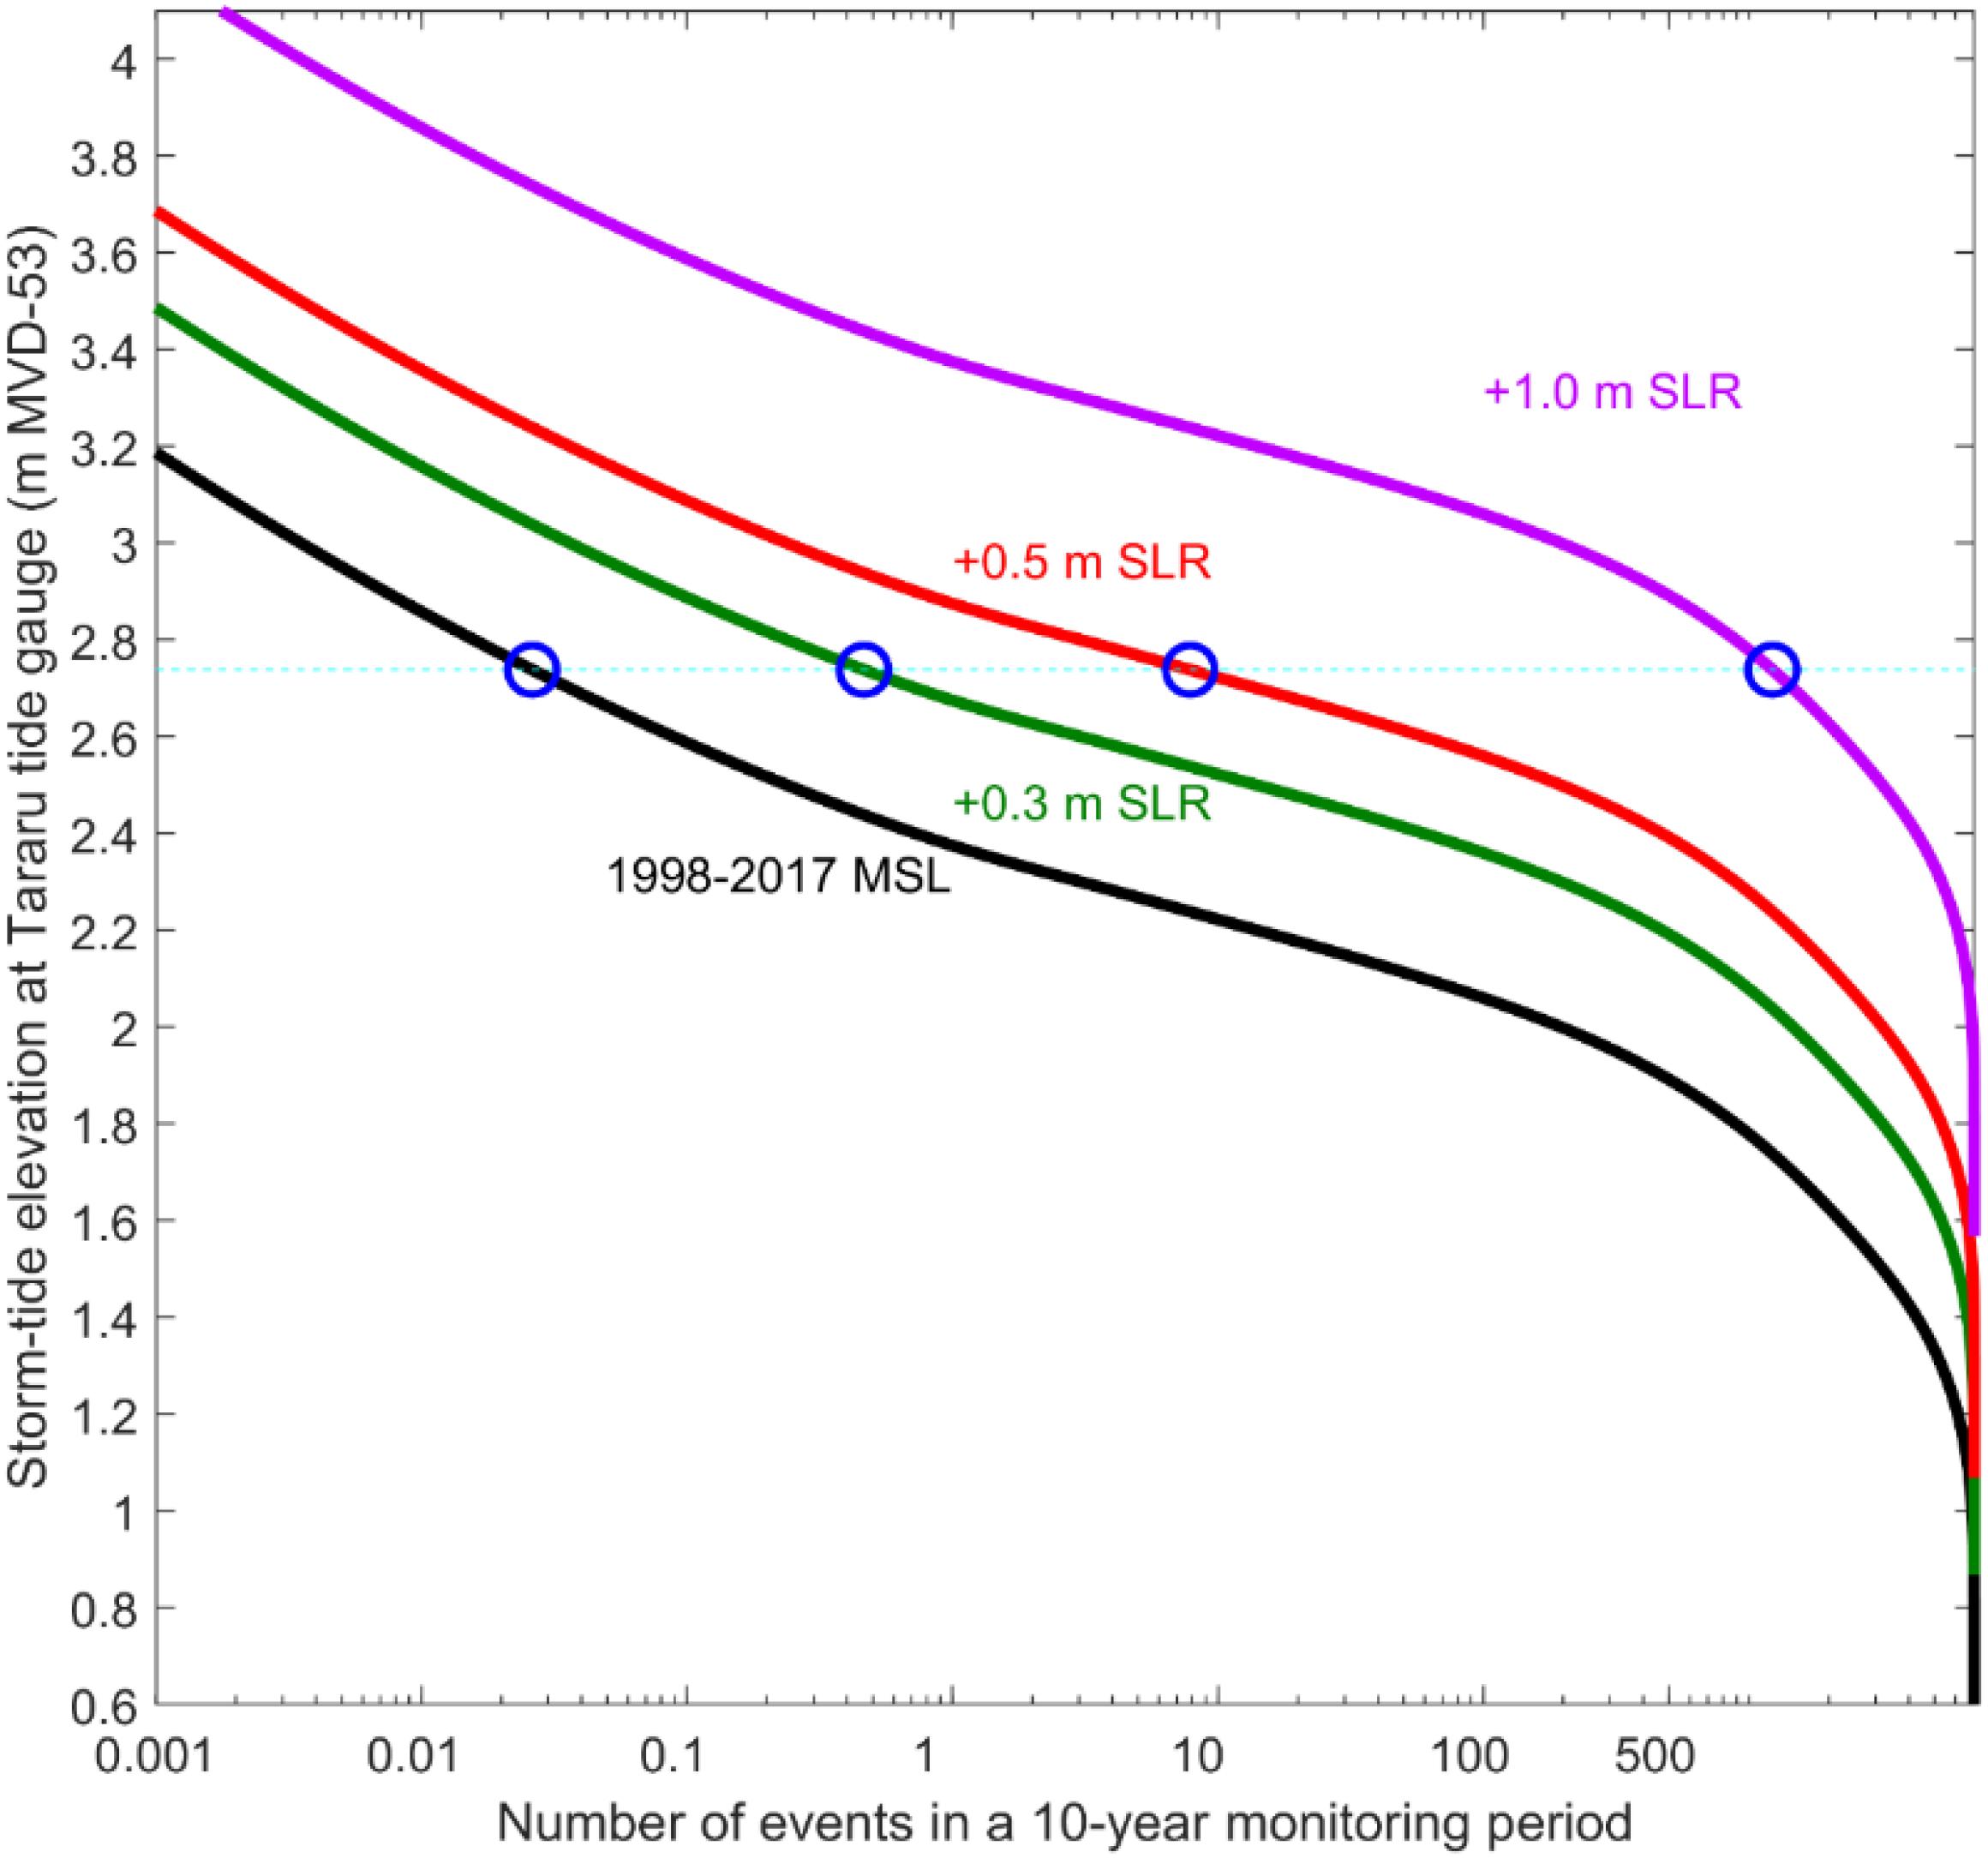
Figure 3. Change in frequency of storm-tide flooding with SLR at Tararu, Thames, Coromandel, New Zealand. The nomographs are derived by transforming the high-water exceedance curve in Figure 2 following methods in Stephens et al. (2018).
Red alert tide days, rising high-tide exceedance and flood frequency nomographs present long-lead-time warning information in a way that is readily usable. In particular, the red-alert tide calendars were tested and revised with a range of users over a period of a few years, largely at local government levels of decision making, with users’ input reflected in the alerts and thresholds finally adopted. The simplicity of the tools, which each convey a single idea on potential and increasing frequency of coastal flooding, is shown in Figures 1–3. This has engendered increased confidence by users in the application of the science underpinning the calendars and nomographs, based on feedback from users, particularly in understanding the increasing frequency of coastal flooding as the first tangible impact of SLR.
Building an Integrated Understanding of Coastal Flooding and Decision Making
Climate services are often provided as discrete pieces of information for an area at risk or particular type of hazard. However, adaptation to climate change and increasing capacity to manage climate and other risks, reinforces the need for sets of information relevant to different stages of the decision-making process. This would support a broader array of risk management planning and implementation activities, beyond traditional climate services (Lawrence et al., 2019a; Jacobs and Street, 2020) for example, where changing risks have significant consequences and where they are foreseeable. It would also address the problems when information on climate change hazards, their impacts and risks into the future become intertwined in ways that create barriers for developing alternative options/pathways for adaptive management. For example, when the hazard is merged with the risk. The latter is an expression of what is exposed, its vulnerability, and agents and communities’ preferences. The former is a technical analysis, while the latter is deliberative and political. Furthermore, the sheer volume of information (quantitative or quantitative) that individuals or groups are asked to assimilate in many assessments can generate default qualitative decisions that lead to mal-adaptive actions that can lock in current risk and make it harder and costlier to address as the climate changes intensify. Three examples of climate services have been developed and/or applied in New Zealand that can help address these outcomes – serious games, DAPP and bespoke services for the finance sector.
Serious Games
Are designed to educate, train, and inform (Michael and Chen, 2005) and can be computer or board based. They have been developed and used globally across many domains of interest including military strategy, health planning, public policy and public awareness raising. Their use in climate change decision-making processes has helped to build understanding of risk and develop capacity to act that is robust across many different potential outcomes (Lawrence and Haasnoot, 2017). Serious games enable complex strands of information from different sources (e.g., technical values, objectives, changing risk over time) to be considered systematically, by testing how different outcomes can be achieved in the face of the uncertainty presented by a changing climate and associated hazards (Flood et al., 2018). While serious games are abstractions from reality and as such enable place-based interests to be suspended, they retain the central decision-making tensions present in the real world, by creating a simplified decision-making experience that can embed learning for real-world decision making.
Four different types of serious games have been developed in New Zealand as climate change services (Table 1; see Supplementary Material).
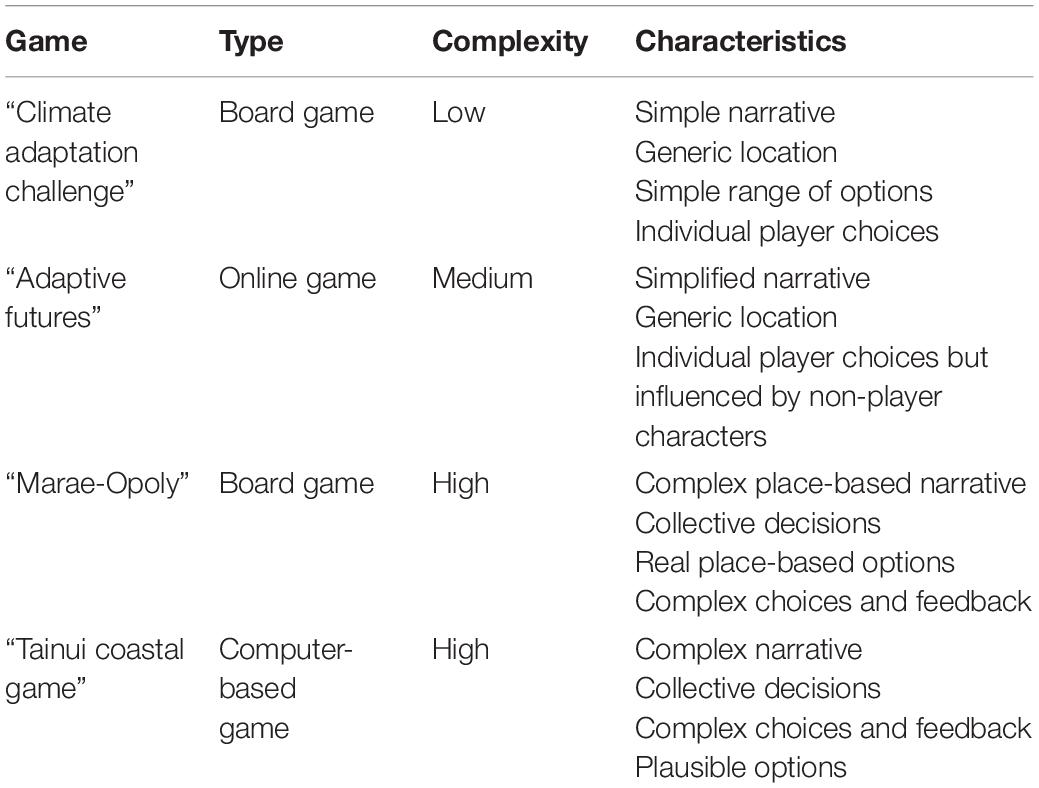
Table 1. Game complexity typologies.
(a) Simple serious games where the player makes the decision in the absence of other groups or players – the player acts toward their own desired outcomes with feedbacks on the choices made, from the game.
(b) Games where there are other non-player characters or groups (of players) representing other interests which seek to influence the choices – at different levels of complexity not tied to a specific place.
(c) Bespoke games designed for specific locations, people and sets of decisions.
(d) Computer simulated games with climate model data driving the feedback on choices made by single or many players.
All games, however, are designed using the same set of steps (Figure 4). What varies is the level of detail provided through the game to the participants, the complexity of the storyline and whether they are computer simulated. Tier 1 games are short games (5--10 min) designed to convey a set of simple messages using a simple storyline and a generic location. They are co-designed with technical partners and key stakeholder groups. They do not need detailed numerical data and rely on abstracted scientific knowledge. An example is the NIWA flood adaptation and SLR game3. Tier 2 games use more complex decision questions and have nuanced storylines that are supported by more detailed data and information. Such games can be placed-based and constructed from quantitative data, but the presentation of the information remains simplified to be more accessible. In the Coastal Adaptive Futures tier 2 game (Blackett et al., 2019) community representatives contributed real-world issues relevant to decision- making context. While tier 1 and 2 games provide learning and dialogue opportunities, tier 3 games are bespoke, for supporting real-life decision making in place. The Marae-Opoly Game is a tier 3 game designed for a particular place, with real alternatives, finances and used to support the development of DAPP (Colliar and Blackett, 2018) (see Supplementary Material).
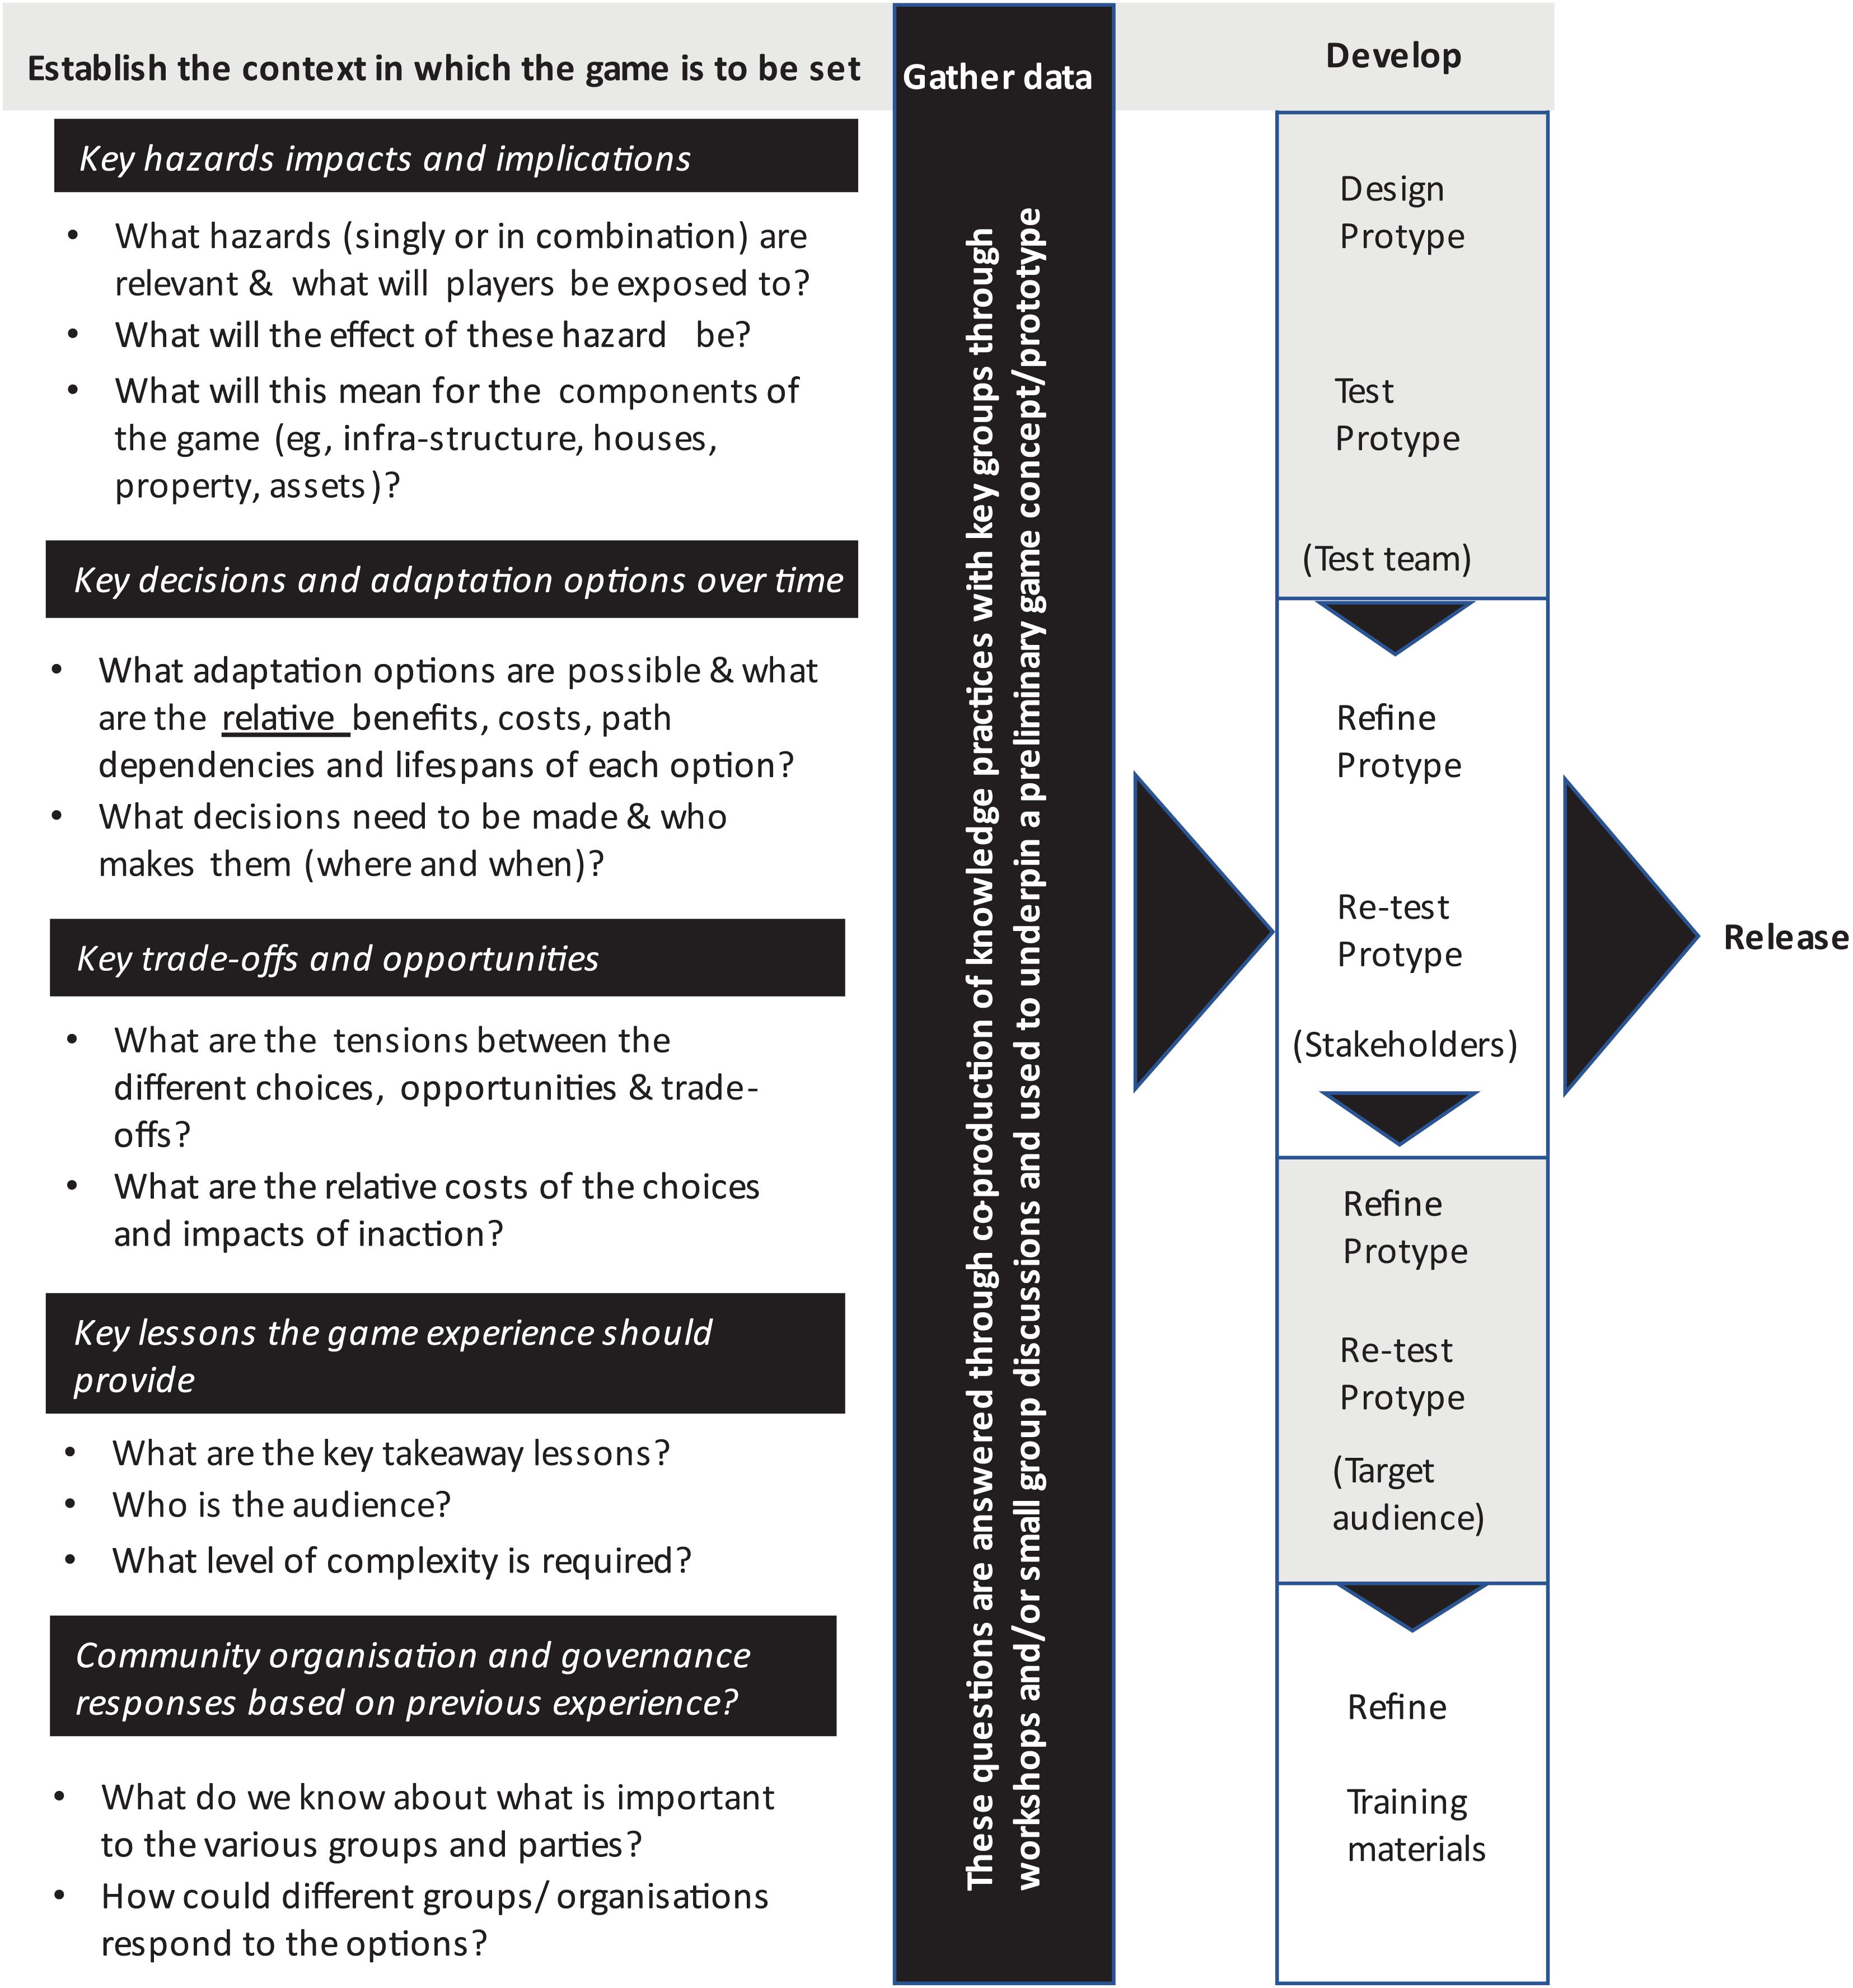
Figure 4. Process for developing and testing serious games.
These games build on the Te Ara River Game and Tainui Coastal Game developed in 2015 based on the Dutch Delta Game (Haasnoot et al., 2013)4, the evaluation of their uptake (Lawrence and Haasnoot, 2017) and its application in the Hutt River flood risk management plan (Lawrence et al., 2019a). The games and their use with DAPP applications have motivated the development of signals and triggers for monitoring DAPP pathways by decision makers (Stephens et al., 2018).
For games to be effective in priming long-term thinking and adaptive action in a climate change setting, they require multi-disciplinary perspectives, and an ability to reduce and reframe complexity in a way that makes it possible to navigate choices over time (Simpson et al., 2021). Clarity of outcomes, values, objectives of different interests, options effectiveness, and costs and trade-offs are essential elements of any decision context. Since the information and expertise required will seldom be held in one knowledge basket, different disciplinary, value and cultural perspectives are necessary to inform the assessment of climate change risk (Blackett et al., 2019). This changes the face of what we know as climate services, from discrete to integrated information and learning processes to support assessments.
For games to be effective as learning devices, understanding decision tensions relevant to the intended audience, is needed to capture enough of their life experiences and scenarios of the future, to generate a meaningful experience that can be robust over time as risks change. Our experience in developing and using games has been iterative as we test and refine their effectiveness in different settings (see tier 1–3 examples above). Figure 4 shows the process employed to develop and test serious games with users.
Several examples (see Supplementary Material and Supplementary Figure 1) illustrate how serious games played in decision contexts can prime decision makers and communities to enable them to plan and adapt to changing climate risks. They generate learning about what climate change impacts could be, the changing nature of the risk to those affected, the limits of different adaptation options and the values and preferences of other people and organizations. They do this by enabling thinking beyond the normal range of preferences in a setting where failure is hypothetical and leads to testing previously unconsidered or rejected strategies. By considering all aspects of the system at risk, serious games provide a simple way of looking at the whole system in an integrated way, by looking at the wider societal consequences of taking different courses of action over different timeframes and what it takes to implement an end objective that is highly challenging for current generations, such as managed retreat. Bespoke games, can be used to develop adaptation pathways, building from the options chosen in the game, or lead to the application of the DAPP planning process to build up pathway’s options with signals and triggers of change between different pathways (Colliar and Blackett, 2018) as conditions change (see Supplementary Material).
By using games to experiment with different audiences and in different decision settings, those providing the climate services can learn how their information can be more relevant to different decision processes. For example, the long-term planning for a marae5 threatened by SLR became a catalyst for a wider conversation about climate services, their funding, and responsibility for them and opened up the space to discuss how the wider community might benefit from short-term and long-term actions to adapt to sea-level rise.
The games applications highlighted the value of developing climate services with the affected agents and communities and challenged assumptions made about the ability of the users to apply the services received and source data and other climate information (quantitative and qualitative) in a usable form. They also enabled other tools to be used effectively, by increasing understanding of changing climate risk and enabling discussion of adaptation options when using DAPP in a way that embeds values and preferences into the decision outcomes.
Dynamic Adaptive Pathways Planning
Climate services took a turn toward adaptive risk management tools for decision making under changing climate conditions following Kwadijk et al. (2010), who demonstrated the value of shifting from a pressures/state/impact model for addressing sea-level rise, to an anticipatory tipping point model. Usability of climate services (Kopp et al., 2019) is at the center of the climate services in this paper. Usability, is a critical criteria for the design of any climate service. This implies that the information is robust across a range of futures and is relevant to the decision space of the users. But how can this information inform the decision process in a way that reduces the uncertainty and changing risk at the coast and facilitates engagement with stakeholders?
This is where DAPP can provide a decision process to integrate the climate information when assessing adaptation options and alternative pathways in the face of the accelerating, compounding and cascading climate change hazards and risk.
Dynamic adaptive pathways planning mirrors choices made on a metro map (Figure 5), testing each option for travel to a destination against different operating conditions over time (scenarios). By making choices for short-term options where there is greater certainty of outcome, the DAPP can identify signals (warnings) and triggers (decision points) with enough lead-time to implement alternative options on the pathway chosen or to switch to another pathway to reach the objective. The process is based on the principle that there is uncertainty about the future in some respects and that locking in a particular pathway will result in path dependency from which it becomes more difficult over time to shift, due to the advancing hazard risk. Leaving options open in the future by taking short-term decisions that enable option/pathway change later, gives flexibility to reassess the options and chart a different course depending on how the future turns out. This iterative and adaptive process addresses both uncertainty of outcome and the rate of change. Its application in coastal and river flooding contexts is now well-tested in many locations globally (Haasnoot et al., 2013, 2018; Ranger et al., 2013; Kingsborough et al., 2016; Bloemen et al., 2019; Lawrence et al., 2019a).
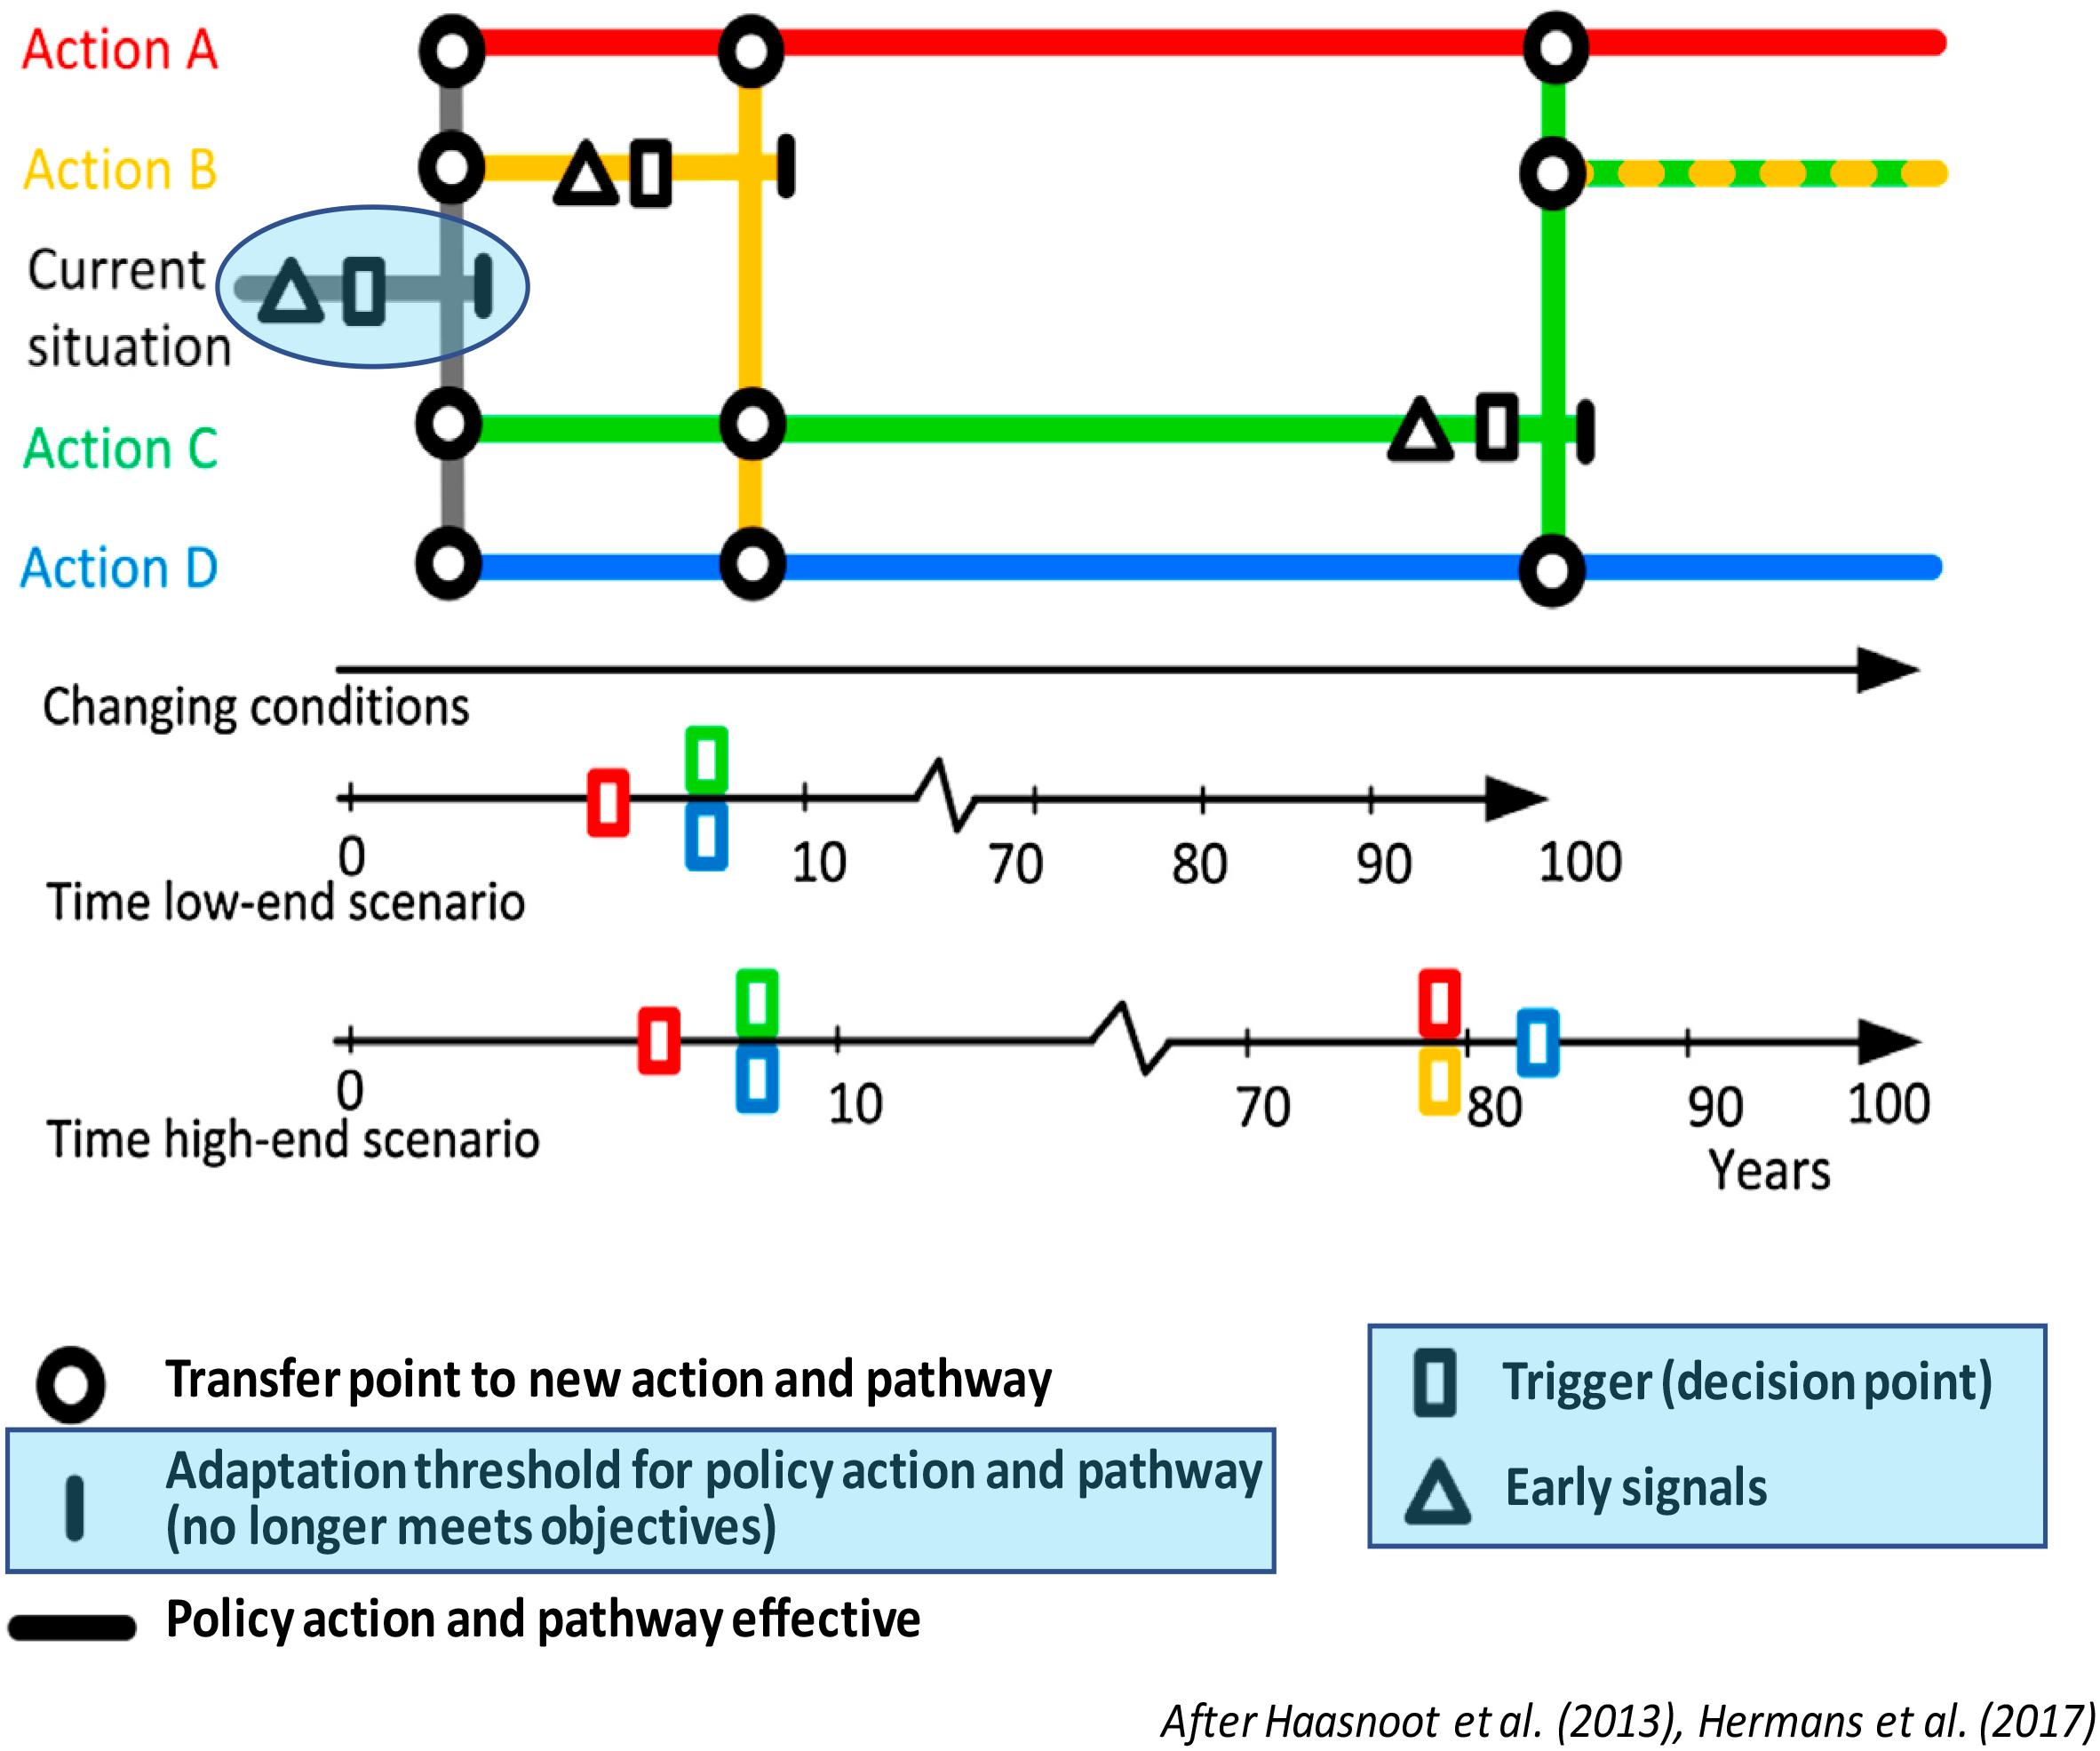
Figure 5. Adaptive pathways showing signals, triggers, and pathways.
The recent shift in approach for undertaking coastal mapping and risk assessments, toward providing SLR projections in terms of increments of SLR (Stephens et al., 2018), rather than specific projection scenarios referred to in the introduction, has enabled SLR to be aligned with local adaptation thresholds (Kool et al., 2020), thus allowing signals (to warn of changes in conditions) and triggers (for deciding on alternative options and pathways) (Haasnoot et al., 2013) to be integrated into coastal hazard and risk assessments by bracketing the timing of the adaptation thresholds and for stress-testing the shelf-life and efficacy of short-term actions and longer-term adaptation options using DAPP.
In New Zealand, the application of serious games with local government officials has led to experimentation with DAPP in real-life decision making (Lawrence and Haasnoot, 2017; Lawrence et al., 2019a) and the inclusion of DAPP as a primary adaptive decision-making process in the national coastal hazards and climate change guidance (MFE, 2017; Lawrence et al., 2018). Furthermore, this has spawned the tailored development of the DAPP, again in real-life decision settings at the coast (OECD, 2019), through development of signals and triggers for decisions based on the robust science that underpins the red tide alert and coastal flood frequency climate services and the development and application of real options analysis to pathways planning in fluvial and coastal flooding contexts (Lawrence et al., 2019a). A multi-disciplinary team within New Zealand and with international colleagues has enabled climate services to be integrated for application by decision makers.
Bespoke Climate Services for the Finance Sector
The New Zealand Government has introduced legislation for mandatory disclosures of climate-related risks by companies and financial institutions which comes into effect in 2023. It requires all banks, asset managers and insurance companies with more than NZ$1 billion in assets to disclose their climate risks, in line with the emerging global standard from the Task Force on Climate-related Financial Disclosures (TCFD). This will require banks to consider the transition, physical and liability risk when lending and offering insurance to households and small and medium size enterprises. This matters most to domestic real estate, which is the largest item on the balance sheet of New Zealand banks, and agricultural and small businesses. Figuring out what climate risks banks are exposed to is not a simple task. Banks and insurance companies will need to scale up their ability to estimate flooding risk from extreme rain, storms and SLR on residential housing6.
The RiskScape tool (Schmidt et al., 2011) developed in New Zealand can help address TCFD requirements (Figure 6). RiskScape combines datasets of hazard, exposure (i.e., elements-at-risk), and vulnerability, in a state-of-the-art software engine that quantifies risk of exposure or impact at national- to local-scales (Figure 6). RiskScape has been used in New Zealand at a national scale to enumerate the built-environment land and assets, and their geometric quantities directly exposed to coastal flooding (Paulik et al., 2020). Paulik et al. (2020) evaluated a 1% annual exceedance probability (AEP) storm-tide levels and sea-level rise. A present-day 1% AEP storm-tide event is quite large and rare, by definition, but will be exceeded with rapidly increasing frequency as sea-level rises (Hunter, 2012; Sweet and Park, 2014; Stephens et al., 2018). A 1% AEP event, when added to SLR estimates, provides suitable scenarios to meet New Zealand Coastal Policy Statement objectives that require coastal-flood hazards to be identified to avoid increasing risk over “at least the next 100 years” (DoC., 2010; MFE, 2017).
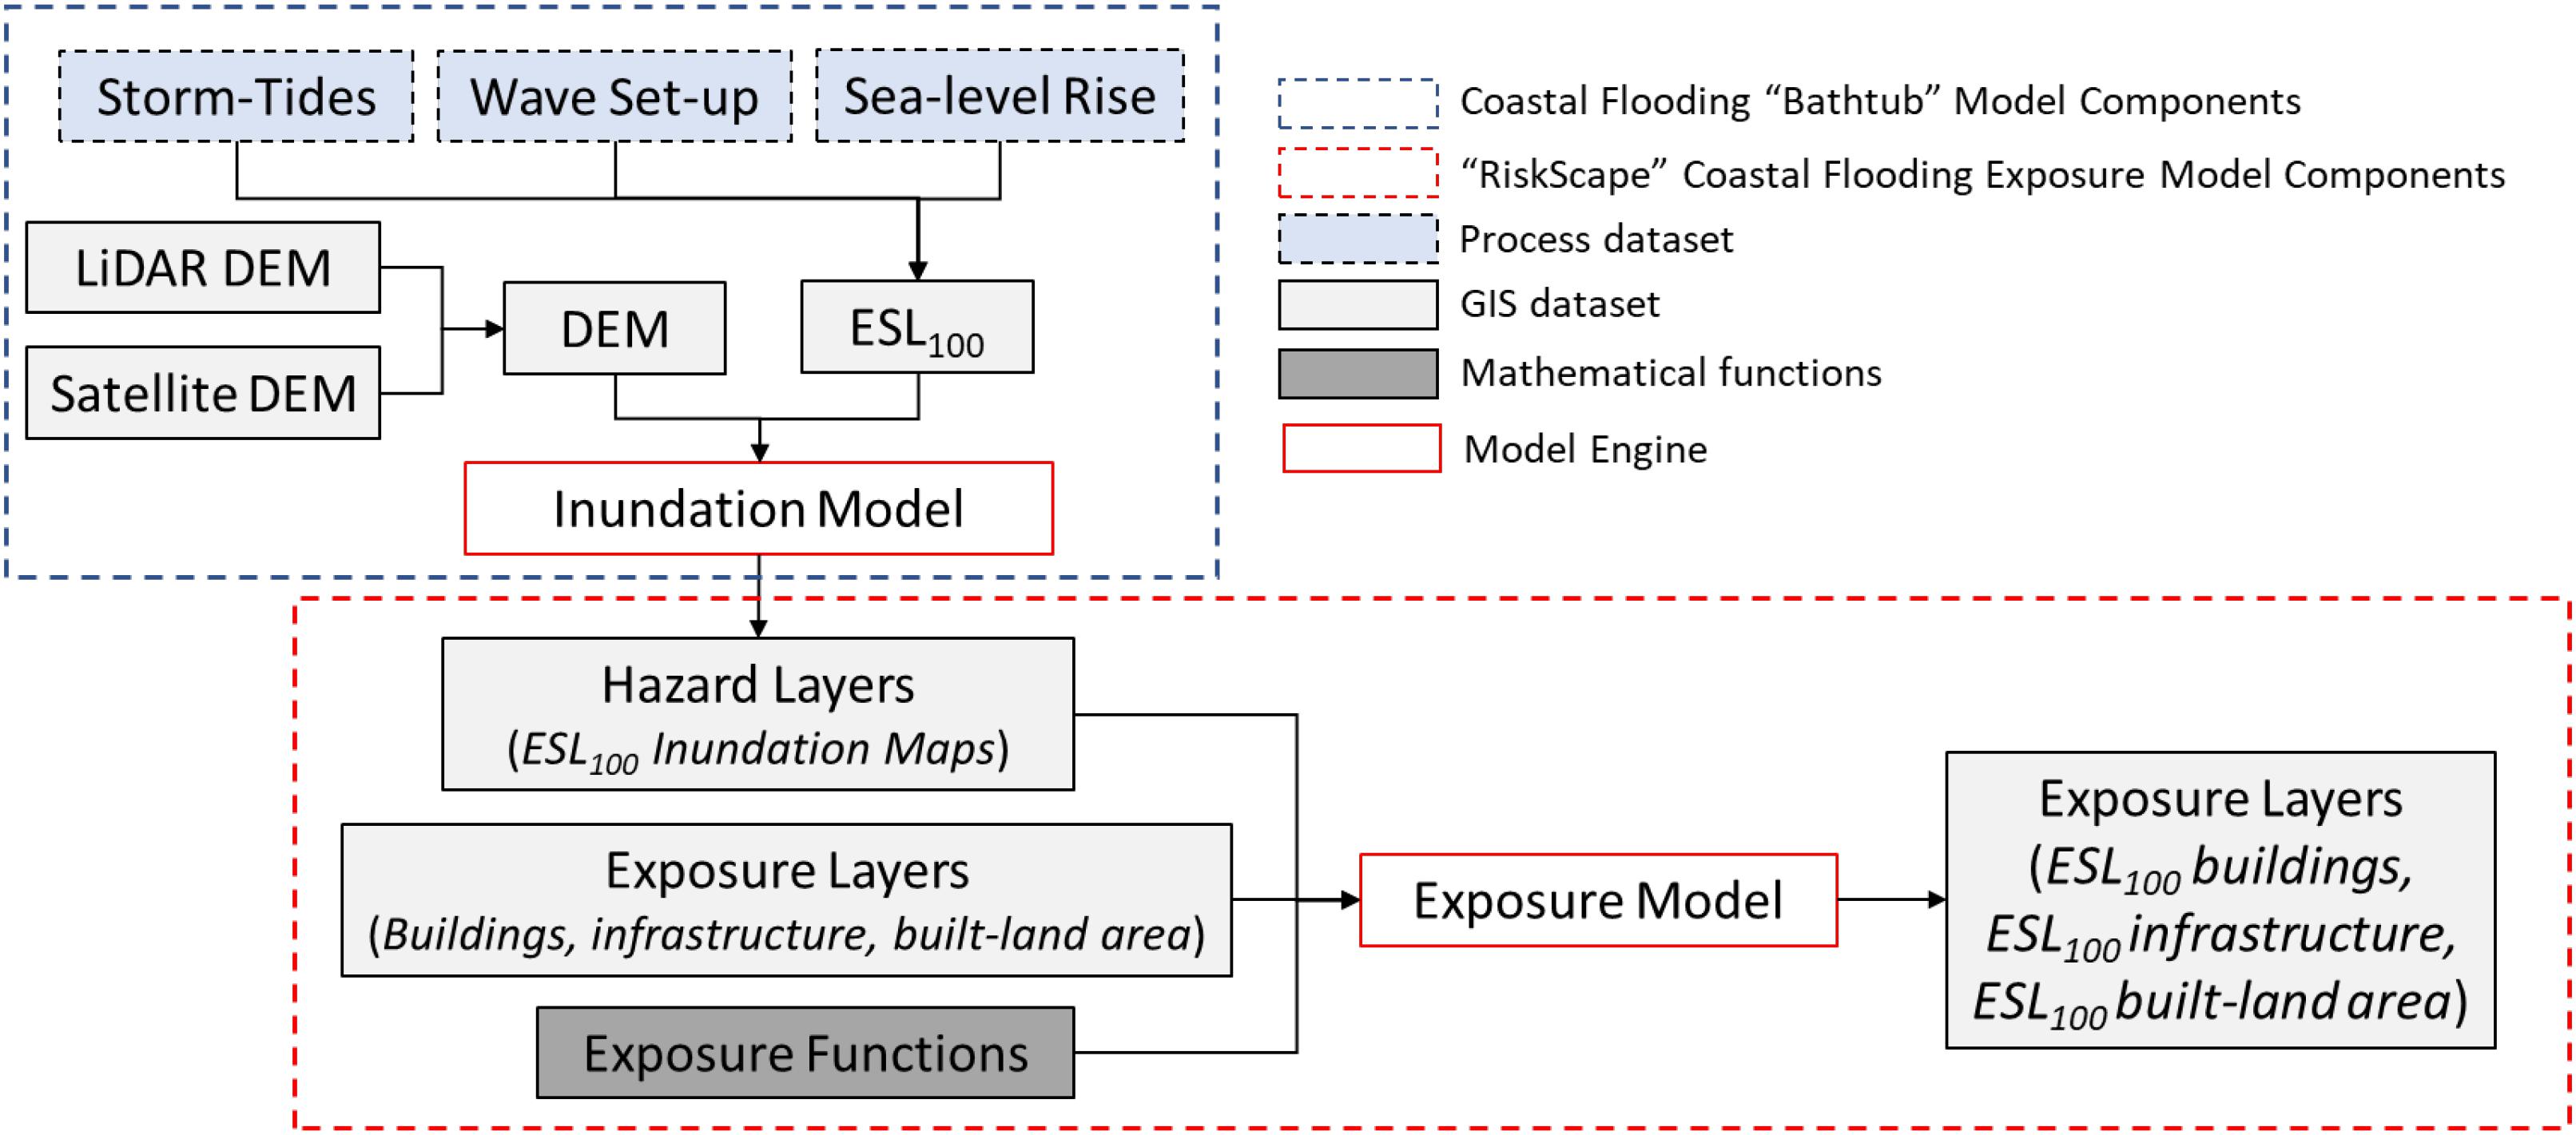
Figure 6. RiskScape model framework applied by Paulik et al. (2020). ESL100 = 100-year average recurrence interval extreme sea-level. DEM = digital elevation model. Adapted from Paulik et al. (2020).
However, meeting TCFD requirements requires scenarios tailored to shorter-term decision making, typically ≤ 30 years which is the typical domestic real estate mortgage lifetime. Discussions with the banking industry indicate that a 10% AEP storm-tide flooding event is a more relevant event to model for TCFD requirements than a 1% AEP event – a 10% AEP event is likely to occur 3 times over a 30-year mortgage (although could occur more or less frequently depending on climate variability).
A key element of climate change planning is understanding the potential timing of impacts. Stephens et al. (2017) provided a table of the approximate years, from possible earliest to latest, when specific SLR increments (meters above the IPCC AR5 1986–2005 baseline epoch) could be reached for various scenarios of SLR for the wider New Zealand region – the table is included in national guidance for coastal climate change adaptation (MFE, 2017; Lawrence et al., 2018). Table 2 provides SLR projections designed to meet TCFD requirements out to 0.3 m SLR. For a fast SLR rate [RCP8.5 H+, MFE (2017)] 0.3 m is projected to be reached by 2054, which is slightly more than a 30-year mortgage lifetime from now – this will take longer under a slow SLR scenario.
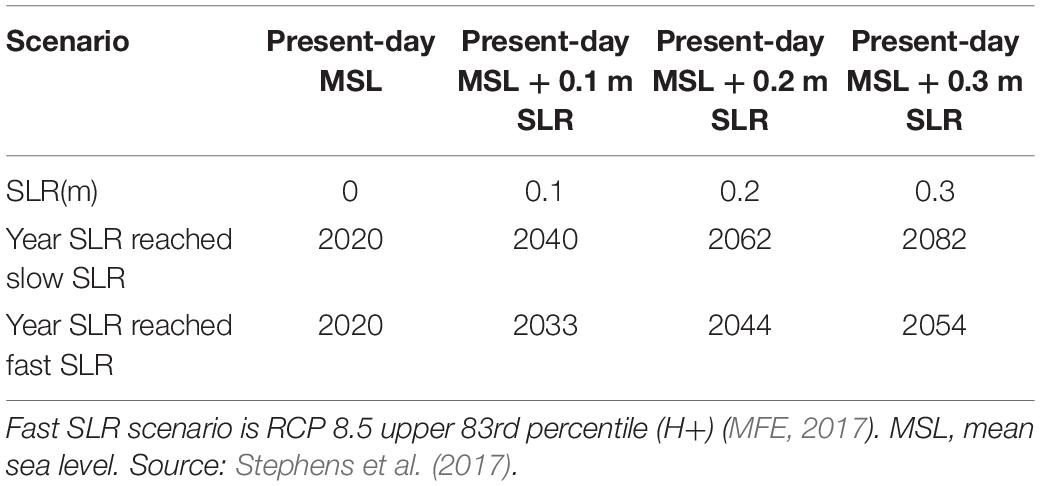
Table 2. Expected year to reach 0, 0.1, 0.2, and 0.3 m SLR relative to 2020 base year, for fast and slow SLR scenarios Slow SLR scenario is RCP 2.6 median.
Discussion
Climate services are not an end in themselves. They are for motivating and supporting decisions which fit within the prevailing governance and institutional frameworks in each jurisdiction. The applications demonstrated in this paper have been applied to decisions for reducing climate change risks. Typically, hazard and risk reduction has been set in static institutional contexts. For example, a hazard is identified in one place at one time or as an event that happens and creates a disaster from which recovery and rebuild is the usual track to follow. Climate change challenges that approach. While extreme events will continue to occur, and some with greater frequency and intensity, hazards at the coast will exacerbate the risk by being ongoing (sea-level rise) for centuries even if emissions are reduced to achieve 1.5 degrees (Paris Agreement). SLR is already exacerbating the high tidal effects discussed above. Where there is a tidal footprint in groundwater, water tables are rising and creating coastal flooding; this will continue and create an existential threat in many low-lying parts of the world.
These characteristics of climate change impacts reveal that for effective adaptive planning, new institutional arrangements and planning practice are required. To date planning and legal mechanisms to reduce climate change risks have proven inadequate (Lawrence, 2015), for example: warnings of flood risk on property titles; mixed jurisdictional authority between the two levels of local government has hindered regional planning which could have enabled territorial local government to prohibit further exposure in risk prone areas; and special legislation to increase housing development has allowed risk reduction provisions where they exist, to be sidestepped. This is despite national coastal hazards and climate change guidance that embeds DAPP and the New Zealand Coastal Policy Statement which requires councils to take a precautionary approach, including the place of managed retreat as an adaptation option. The New Zealand government is currently (June 2021) developing a Strategic Planning Act and a Climate Change Adaptation Act to provide the enablers for adaptation, such as, new funding and legal instruments to address existing land uses and managed retreat and the integration of DAPP and strategic risk management into the new statutory regime. Both climate services and the institutional arrangements must be in sync with the dynamics of change at the coast.
The on-the-ground experience presented here, demonstrates the type of climate services that are useful and effective for addressing the risks of climate change in coastal areas, in particular, for addressing the ongoing changing risks and the long-term uncertainties related to sea-level rise. These risks are changing rapidly, and physical and social thresholds are approaching. Decisions are being taken now that continue investment in at-risk coastal areas and expose more people and assets to harm. Developing climate services in isolation from users, and “selling” them as “services” confuses supply with demand. It risks development of unusable services that can divert effort on adaptation to purely tweaking business-as-usual approaches. This has potentially significant maladaptive outcomes that will make adaptation in the future hard to implement and very costly.
Our experience is that it is extremely effective for applied researchers to work closely and on a regular basis with end-users who can spot gaps in the climate service knowledge or systems. This enables decision problems to be researched quickly, tested with the users and useful tools delivered for adaptation decision making. The benefits of the climate service, though, can take time for uptake. For example, the red-alert tide calendar was initially slow to be taken up, but then pressure built up from a range of users, wanting next year’s calendar to use for coastal emergency management planning. The catalysts for uptake of DAPP approaches were: (i) a series of changes to New Zealand’s resource-management legislation in 2004, 2010, and 2017 (requiring councils, when developing land-use plans, to have particular regard to the effects of climate change, develop 100-year strategies for adapting existing development and manage significant risks from natural hazards); (ii) by the publication of academic papers (Haasnoot et al., 2018; Stephens et al., 2018; Lawrence et al., 2019a,b) and policy reports and reviews which primed understanding through training and development of DAPP (Lawrence and Haasnoot, 2017); (iii) development of council climate change strategies (e.g., Greater Wellington Regional Council 2015)7; (iv) integration of DAPP in national coastal hazards guidance (MFE, 2017); and (v) a sequence of damaging coastal storms and floods in 2018. The role of the media in informing the public about climate change and SLR has also motivated political attention to the adaptation solutions space (Haasnoot et al., 2020). The process can be categorized as creating interest, increasing awareness, and experimenting in real-life decision contexts, through a reinforcing set of parallel activities to enable uptake of the climate services set out in this paper.
User relevance has evolved as an effectiveness criterion for the funding of national research. New Zealand has two research models that bring researchers and users closer together on climate service production. First, a consultation and involvement model funded for researchers and users to interact closely on decision-relevant research to fill knowledge gaps or develop decision tools that meet user needs Lawrence and Manning (2012) with a focus on smaller resource-poor councils or for research of general relevance across many councils. The development of the DAPP approach and the use of Real Options Analysis developed from this model. Second, a co-production model, through which researchers and users jointly produce climate services. The Tauranga City Council sea-level rise flood tool (see Supplementary Figure 2) was developed in this way. Researchers advised on appropriate storm-tide and SLR scenarios then used a dynamic model to predict flooding for several scenarios, which were mapped. Tauranga City Council then ground-truthed the maps and constructed an interactive web-based tool.
The games applications have created a key learning environment for decision makers when addressing coastal hazards, and the risks they bring for communities, sectors and government – greater understanding of the formal and informal rules that constrain or facilitate different types of adaptation; the role that values and aspirations play in decision making and how contested worldviews and competition for resources can be resolved in acceptable ways; how feedback from decision choices influence how paths can change as conditions change; how actions can be staged over time and funding prioritized; that risk cannot be totally removed and residual risk managed. The freedom to experiment and test different strategies within the rules and constraints of the game is perhaps one of the key strengths of the gaming approach. Players can fail and learn from that failure with no real consequences. However, if the rules are constructed to reflect a simplified version of reality, those lessons can be applied in the real world where choices do have implications.
Conclusion
Making decisions in a dynamically changing environment poses significant challenges to coastal managers and decision makers. Assessment, planning, design of adaptations in coastal settings have been historically driven by impact/response models of decision making which have proven inadequate for a changing coastal setting where SLR is becoming the dominant driver of change (Le Cozannet et al., 2015).
The use of multiple reinforcing climate services that warn, monitor, review, and update, anticipate, build understanding and a capacity to act, operating within a fit for purpose institutional framework, can enable risks to be anticipated and deliver more robust decisions that are grounded in real-world practice. Synergies between these applications is giving a more nuanced understanding of what climate services are and how they can best be delivered. This has built trust in science where tools are clear, simple and address the users’ problems (Schneider et al., 2020). The lessons learned in the application of the climate services discussed here have the prospect of shifting the perspectives about ongoing SLR (Table 3) and thus contributing further to the climate services field.
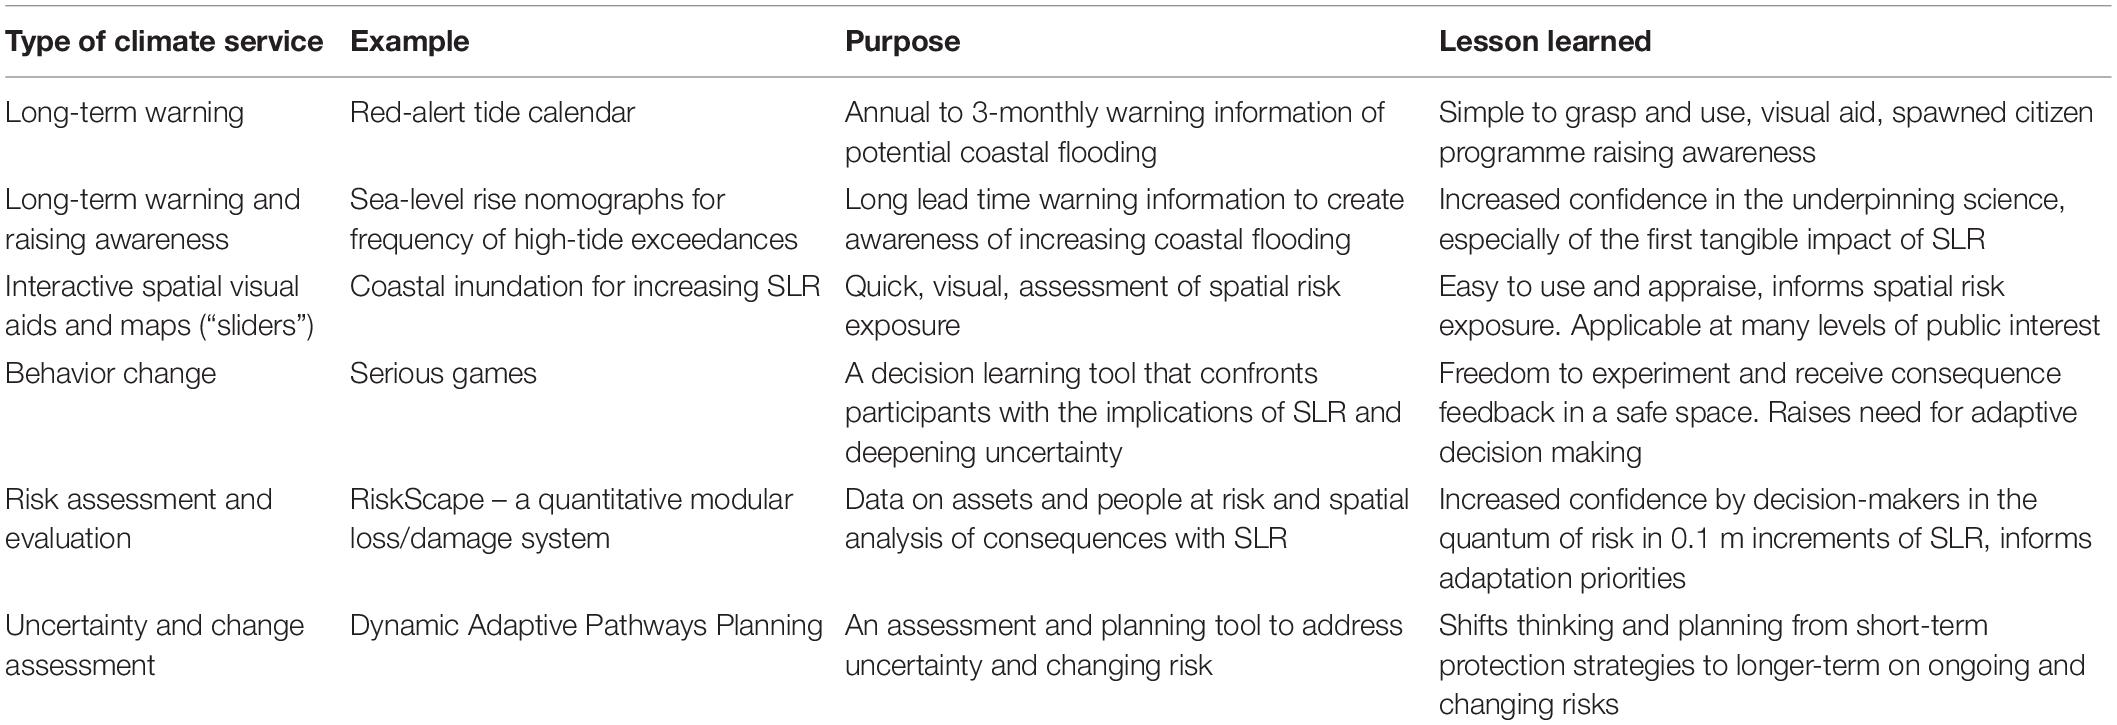
Table 3. Type of climate service with examples, purpose and lessons learned.
However, climate services by them selves are insufficient for addressing SLR. Increasingly, the role of the institutional context, multi-disciplinary practice and engagement with users and communities affected, are being recognized as essential for leveraging changed practice toward the use of adaptive processes supported by more relevant decision tools. For example, we have identified that the following institutional enablers have universal relevance.
• The critical importance of transparent and enabling governance arrangements (including Memoranda of Understanding with the parties) prior to starting strategy development.
• The value of a regional/local government partnership for coastal strategy development.
• The value of engaging collaboratively with communities by providing a “safe space” for deliberation, resulting in social learning about the practical issues around resilience efforts.
• The need for wider community engagement to encapsulate views on managing the risk and side-effects of options.
• The importance of considering a 100-year timeframe for vulnerability and risk assessments (using narratives and scenarios) and distilling the emergence of adaptation thresholds (i.e., when agreed objectives around levels of service and risk would no longer be met).
• Understanding how coastal hazard and risk/vulnerability assessments and the options/pathways assessment process using DAPP can be integrated and scaled, depending on the level of uncertainty and the planning situation.
• The value of an adaptive pathways approach for shifting thinking from short-term protection strategies to a longer-term focus on ongoing and changing risks.
• The risk of underestimating the time needed for developing the implementation plan, which includes regulatory planning, governance, funding, design and costings, triggers for monitoring and review.
• The importance of building capacity to employ the services, especially where resources are slim and there are few experts to work alongside decision makers.
Embedding new practice into “the way we do things around here,” however, is often hampered by the slowness of policy decision making, which can swing wildly depending on political philosophy at national and local levels. This is a problem for consistency and alignment of values and outcomes which require bipartisan “agreement,” adequate capacity building and the use of policy commitment devices (Boston and Lawrence, 2018). Climate services alone will not serve decisionmakers in the dynamic coastal space without the alignment of institutional frameworks across relevant domains of interest to increase the ability to implement adaptation options.
Author Contributions
JL conceived the manuscript as a contribution to the Workshop on WCRP Grand Challenge and Climate Services BRGM Orleans France 12–13 November 2019. JL and SS developed the outline of the manuscript and wrote the first draft with input from RB, PB, and RP. All authors are accountable for the content of the manuscript.
Funding
JL, RB, SS, and PB were supported through the Resilience to Nature’s Challenges National Science Challenge “Enabling Adaptation” programme funded by the New Zealand Ministry of Business, Innovation and Employment (GNDGNS-RNC040) through the University of Auckland. JL, RB, and RP also received funding from the NZ SeaRise Endeavour Project through Victoria University of Wellington (RTUV1705). PB was partly funded from the Deep South National Science Challenge (Contract CO1X1445), the Natural Hazards Research Platform (CO5X0907). PB and RB were partly funded from the NIWA Strategic Science Investment Funding (SSIF) (CAVA 1904).
Conflict of Interest
The authors declare that the research was conducted in the absence of any commercial or financial relationships that could be construed as a potential conflict of interest.
Publisher’s Note
All claims expressed in this article are solely those of the authors and do not necessarily represent those of their affiliated organizations, or those of the publisher, the editors and the reviewers. Any product that may be evaluated in this article, or claim that may be made by its manufacturer, is not guaranteed or endorsed by the publisher.
Acknowledgments
We acknowledge the many stakeholders involved in applying and refining the climate services presented in this paper. We also acknowledge the input to the research over many years by Derek Goring (retired, formerly of NIWA) and Doug Ramsay (NIWA) on development of red-alert tide calendars for New Zealand and Kosrae, Federated States of Micronesia. We thank Marjolijn Haasnoot, Deltares, Delft, Netherlands and University of Utrecht, Utrecht, Netherlands for reviewing an earlier draft of this manuscript and making useful suggestions. We thank the two reviewers for their feedback which improved the final manuscript.
Supplementary Material
The Supplementary Material for this article can be found online at: https://www.frontiersin.org/articles/10.3389/fmars.2021.703902/full#supplementary-material
Footnotes
- ^ Refer Table 1 and Figure 5 of Stephens et al. (2017)
- ^ Retrieved from: https://auckland.kingtides.org.nz/
- ^ https://niwa.co.nz/natural-hazards/our-services/serious-games-as-a-tool-to-engage-people
- ^ https://www.deltares.nl/en/software/sustainable-delta-game/
- ^ A Maori community meeting house
- ^ https://theconversation.com/new-zealand-will-make-big-banks-insurers-and-firms-disclose-their-climate-risk-its-time-other-countries-did-too-146392
- ^ Available at http://www.gw.govt.nz/assets/council-reports/Report_PDFs/2017.194a1.pdf
References
Bell, R. G. (2007). “Use of exceedance curves for defining MHWS and future sea-level rise,” in Proceedings of the 18th Australasian Coastal & Ocean Engineering Conference 2007 and the 11th Australasian Port and Harbour Conference 2007 (Coasts & Ports 2007), Australia.
Bell, R. G. (2010). “Tidal exceedances, storm tides and the effect of sea-level rise,” in Proceedings of 17th Congress of the Asia and Pacific Division of the IAHR, Auckland.
Blackett, P., Davies, K., Davies, B., Holland, P., and Cradock-Henry, N. (2019). Adaptive Futures: an Interactive Serious Game for Decision-Making and Coastal Hazards. Prepared for Natural Hazards Research Platform. NIWA Client Report No. 2019328HN. New Zealand: NIWA
Bloemen, P., van der Steen, M., and van der Wal, Z. (2019). Designing a century ahead: climate change adaptation in the Dutch Delta. Policy Soc. 38, 58–76. doi: 10.1080/14494035.2018.1513731
Boston, J., and Lawrence, J. (2018). Funding climate change adaptation: the case for a new policy framework. Policy Q. 14, 40–49. doi: 10.4324/9780203073384-10
Brasseur, G. P., and Gallardo, L. (2016). Climate services: lessons learned and future prospects. Earth Future 4, 79–89. doi: 10.1002/2015ef000338
Cagigal, L., Rueda, A., Castanedo, S., Cid, A., Perez, J., Stephens, S. A., et al. (2020). Historical and future storm surge around New Zealand: from the 19th century to the end of the 21st century. Int. J. Climatol. 40, 1512–1525. doi: 10.1002/joc.6283
Cavelier, R., Borel, C., Charreyron, V., Chaussade, M., and Le Cozannet, G. (2017). Conditions for a market uptake of climate services for adaptation in France. Clim. Serv. 6, 34–40. doi: 10.1016/j.cliser.2017.06.010
Colliar, J., and Blackett, P. (2018). Tangoio Climate Change Adaptation Decision Model: a Process for Exploring Adaptation Pathways for Tangoio Marae. Prepared for Maungaharuru-Tangitû Trust and Deep South National Science Challenge. NIWA Client Report 2018242HN. New Zealand: NIWA
Covi, M. P., and Kain, D. J. (2016). Sea-level rise risk communication: public understanding, risk perception, and attitudes about information. Environ. Commun. 10, 612–633. doi: 10.1080/17524032.2015.1056541
Devlin, A. T., Jay, D. A., Talke, S. A., Zaron, E. D., Pan, J., and Lin, H. (2017). Coupling of sea level and tidal range changes, with implications for future water levels. Sci. Rep. 7:17021.
Egbert, G. D., and Erofeeva, S. Y. (2002). Efficient inverse modeling of barotropic ocean tides. J. Atmos. Ocean. Technol. 19, 183–204. doi: 10.1175/1520-0426(2002)019<0183:eimobo>2.0.co;2
Flood, S., Cardock-Henry, N. A., Blackett, P., and Edwards, P. (2018). Adaptive and interactive climate futures: systematic review of ‘serious games’ for enagement and decision-making. Environ. Res. Lett. 13:063005. doi: 10.1088/1748-9326/aac1c6
Haasnoot, M., Biesbroek, R., Lawrence, J., Muccione, V., Lempert, R., and Glavovic, B. (2020). Defining the solution space to accelerate climate change adaptation. Reg. Environ. Change 20:37.
Haasnoot, M., Kwakkel, J., Walker, W., and ter Maat, J. (2013). Dynamic adaptive policy pathways: a method for crafting robust decisions for a deeply uncertain world. Global Environ. Change 23, 485–498. doi: 10.1016/j.gloenvcha.2012.12.006
Haasnoot, M., van t’ Klooster, S., and van Alphen, J. (2018). Designing a monitoring system to detect signals to adapt to uncertain climate change. Glob. Environ. Change 52, 273–285. doi: 10.1016/j.gloenvcha.2018.08.003
Haigh, I. D., Wadey, M. P., Wahl, T., Ozsoy, O., Nicholls, R. J., and Brown, J. M. (2016). Spatial and temporal analysis of extreme sea level and storm surge events around the coastline of the UK. Sci. Data 3:160107.
Hermans, L. M., Haasnoot, M., ter Maat, J., and Kwakkel, J. H. (2017). Designing monitoring arrangements for collaborative learning about adaptation pathways. Environ. Sci. Policy 69, 29–38. doi: 10.1016/j.envsci.2016.12.005
Hewitt, C., Mason, S., and Walland, D. (2012). The global framework for climate services. Nat. Clim. Change 2, 831–832. doi: 10.1038/nclimate1745
Hinkel, J., Church, J. A., Gregory, J. M., Lambert, E., Le Cozannet, G., Lowe, J., et al. (2019). Meeting user needs for SLR information: a decision analysis perspective. Earth’s Future 7, 320–337. doi: 10.1029/2018ef001071
Hinkel, J., Lincke, D., Vafeidis, A. T., Perrette, M., Nicholls, R. J., and Tol, R. S. (2014). Coastal flood damage and adaptation costs under 21st century sea-level rise. Proc. Natl. Acad. Sci. U.S.A. 111, 3292–3297. doi: 10.1073/pnas.1222469111
Hunter, J. (2012). A simple technique for estimating an allowance for uncertain sea-level rise. Clim. Change 113, 239–252. doi: 10.1007/s10584-011-0332-1
Irwin, A. (2014). From deficit to democracy (re-visited). Public Underst Sci. 23, 71–76. doi: 10.1177/0963662513510646
Jacobs, K. L., and Street, R. B. (2020). The next generation of climate services. Clim. Serv. 20:100199. doi: 10.1016/j.cliser.2020.100199
Jongman, B., Ward, P. J., and Aerts, J. C. J. H. (2012). Global exposure to river and coastal flooding: long term trends and changes. Glob. Environ. Change 22, 823–835. doi: 10.1016/j.gloenvcha.2012.07.004
Kingsborough, A., Borgomeo, E., and Hall, J. W. (2016). Adaptation Pathways in practice: Mapping options and reade-offs for London’s water resources. Sustain. Cities Soc. 27, 386–397. doi: 10.1016/j.scs.2016.08.013
Kool, R., Lawrence, J., Bell, R. G., and Drews, M. (2020). Preparing for sea-level rise through adaptive managed retreat. Infrastructures 5:90.
Kopp, R. E., Gilmore, E. A., Little, C. M., Lorenzo-Trueba, J., Ramenzoni, V. C., and Sweet, W. V. (2019). Usable science for managing the risks of sea-level rise. Earth’s Future 7, 1235–1269. doi: 10.1029/2018ef001145
Kulp, S. A., and Strauss, B. H. (2019). New elevation data triple estimates of global vulnerability to sea-level rise and coastal flooding. Nat. Commun. 10:4844.
Kwadijk, J., Haasnoot, M., Mulder, J., Hoogvliet, M., Jeuken, A., Van der Krogt, R., et al. (2010). Using adaptation tipping points to prepare for climate change and sea level rise: a case study in the Netherlands. Wiley Interdiscip. Rev. Clim. Change 1, 729–740. doi: 10.1002/wcc.64
Lagmay, A. M. F., Agaton, R. P., Bahala, M. A. C., Briones, J. B. L. T., Cabacaba, K. M. C., Caro, C. V. C., et al. (2015). Devastating storm surges of Typhoon Haiyan. Int. J. Disaster Risk Reduct. 11, 1–12. doi: 10.1016/j.ijdrr.2014.10.006
Lawrence, J. (2015). The Adequacy of Institutional Frameworks and Practice for Climate Change Adaptation Decision Making. PhD thesis. New Zealand: Victoria University of Wellington.
Lawrence, J., and Haasnoot, M. (2017). What it took to catalyse a transition towards adaptive pathways planning to address climate change uncertainty. Environ. Sci. Policy 68, 47–57. doi: 10.1016/j.envsci.2016.12.003
Lawrence, J., and Manning, M. (2012). Developing Adaptive Risk Management for Our Changing Climate. A Report of Workshop Outcomes Under an Envirolink Grant. NZCCRI 2012 report 2012-1 June 2012. New Zealand: Victoria University of Wellington.
Lawrence, J., Bell, R., and Stroombergen, A. (2019a). A hybrid process to address uncertainty and changing climate risk in coastal areas using dynamic adaptive pathways planning, multi-criteria decision analysis & real options analysis: a New Zealand application. Sustain. Special Issue 11, 1–18.
Lawrence, J., Bell, R., Blackett, P., Stephens, S., and Allan, S. (2018). National guidance for adapting to coastal hazards and sea-level rise: Anticipating change, when and how to change pathway. Environ. Sci. Policy 82, 100–107. doi: 10.1016/j.envsci.2018.01.012
Lawrence, J., Haasnoot, M., McKim, L., Atapattu, D., Campbell, G., and Stroombergen, A. (2019b). “From theory to practice: a timeline of interventions by a change agent with the developers and users of Dynamic Adaptive Policy Pathways (DAPP),” in Decisionmaking Under Deep Uncertainty: From Theory to Practice, eds V. Marchau, W. Walker, and P. Bloeman (Berlin: Springer).
Le Cozannet, G., Rohmer, J., Cazenave, A., Idier, D., and van De Wal, R. (2015). Evaluating uncertainties of future marine flooding occurrence as sea-level rises. Environ. Model. Softw. 73, 44–56. doi: 10.1016/j.envsoft.2015.07.021
Lyard, F., Lefevre, F., Letellier, T., and Francis, O. (2006). Modelling the global ocean tides: modern insights from FES2004. Ocean Dyn. 56, 394–415. doi: 10.1007/s10236-006-0086-x
Matsumoto, K., Takanezawa, T., and Ooe, M. (2000). Ocean tide models developed by assimilating TOPEX/POSEIDON altimeter data into hydrodynamical model: a global model and a regional model around Japan. J. Oceanogr. 56, 567–581.
Merrifield, M. A., Genz, A. S., Kontoes, C. P., and Marra, J. J. (2013). Annual maximum water levels from tide gauges: contributing factors and geographic patterns. J. Geophys. Rese. Oceans 118, 2535–2546. doi: 10.1002/jgrc.20173
MFE (2017). Coastal Hazards and Climate Change: Guidance for Local Government. Wellington: Ministry for the Environment Publication ME1341.
Michael, D., and Chen, S. (2005). Serious Games: Games That Educate, Train, and Inform, 1st Edn. USA: Course Technology PTR.
Muis, S., Verlaan, M., Winsemius, H. C., Aerts, J. C. J. H., and Ward, P. J. (2016). A global reanalysis of storm surges and extreme sea levels. Nat. Commun. 7:11969.
Needham, H. F., Keim, B. D., and Sathiaraj, D. (2015). A review of tropical cyclone-generated storm surges: global data sources, observations, and impacts. Rev. Geophys. 53, 545–591. doi: 10.1002/2014rg000477
OECD (2019). Responding to Rising Seas: OECD Country Approaches to Tackling Coastal Risks. France: OECD Publishing.
Paulik, R., Stephens, S. A., Bell, R. G., Wadhwa, S., and Popovich, B. (2020). National-scale built-environment exposure to 100-year extreme sea levels and sea-level rise. Sustainability 12:1513. doi: 10.3390/su12041513
Priestley, R. K., Milfont, T. L., and Heine, Z. (2021). Public understanding of climate change-related sea-level rise. PLoS One 16:e0254348. doi: 10.1371/journal.pone.0254348
Ranger, N., Reeder, T., and Lowe, J. (2013). Addressing ‘deep’ uncertainty over long-term climate in major infrastructure projects: four innovations of the thames estuary 2100 Project. EURO J. Decis. Process. 1, 233–262. doi: 10.1007/s40070-013-0014-5
Ray, R. D. (1999). A Global Ocean Tide Model From TOPEX/POSEIDON Altimetry: GOT99.2. NASA Technical Memorandum TM-1999-209478 (Greenbelt, MD: Goddard Space Flight Center), 58.
Ray, R. D., and Foster, G. (2016). Future nuisance flooding at Boston caused by astronomical tides alone. Earths Future 4, 578–587. doi: 10.1002/2016ef000423
Román-Rivera, M. A., and Ellis, J. T. (2018). The king tide conundrum. J. Coast. Res. 34, 769–771. doi: 10.2112/jcoastres-d-18a-00001.1
Rueda, A., Vitousek, S., Camus, P., Tomás, A., and Espejo, A. (2017). A global classification of coastal flood hazard climates associated with large-scale oceanographic forcing. Sci. Rep. 7:5038.
Schmidt, J., Matcham, I., Reese, S., King, A., Bell, E., and Henderson, R. (2011). Quantitative multi-risk analysis for natural hazards: a framework for multi-risk modelling. Nat. Hazards 58, 1169–1192. doi: 10.1007/s11069-011-9721-z
Schneider, P., Lawrence, J., Glavovic, B., Ryan, E., and Blackett, P. (2020). The rising tide of adaptation action: comparing two coastal regions of Aotearoa-New Zealand. Climate Risk Manag. 30:100244. doi: 10.1016/j.crm.2020.100244
Simpson, N., Mach, K. J., Constable, A., Hess, J., Hogarth, R., and Howden, M. (2021). A framework for complex climate change risk assessment. One Earth 4, 489–501.
Stephens, S. A., Bell, R. G., and Haigh, I. D. (2020). Spatial and temporal analysis of extreme storm-tide and skew-surge events around the coastline of New Zealand. Nat. Hazards Earth Syst. Sci. 20, 783–796. doi: 10.5194/nhess-20-783-2020
Stephens, S. A., Bell, R. G., Ramsay, D., and Goodhue, N. (2014). High-water alerts from coinciding high astronomical tide and high mean sea level anomaly in the Pacific Islands region. J. Atmos. Ocean. Technol. 31, 2829–2843. doi: 10.1175/jtech-d-14-00027.1
Stephens, S. A., Bell, R., and Lawrence, J. (2017). Applying principles of uncertainty within coastal hazard assessments to better support coastal adaptation. J. Mar. Sci. Eng. 5:40. doi: 10.3390/jmse5030040
Stephens, S., Bell, R., and Lawrence, J. (2018). Developing signals to trigger adaptation to sea-level rise. Environ. Res. Lett. 13:104004. doi: 10.1088/1748-9326/aadf96
Sweet, W. V., and Park, J. (2014). From the extreme to the mean: Acceleration and tipping points of coastal inundation from SLR. Earths Future 2, 579–600. doi: 10.1002/2014ef000272
Tebaldi, C., Strauss, B. H., and Zervas, C. E. (2012). Modelling SLR impacts on storm surges along US coasts. Environ. Res. Lett. 7:014032.
Keywords: climate services, sea-level rise, coastal hazards, adaptive planning, coastal flooding, policy
Citation: Lawrence J, Stephens S, Blackett P, Bell RG and Priestley R (2021) Climate Services Transformed: Decision-Making Practice for the Coast in a Changing Climate. Front. Mar. Sci. 8:703902. doi: 10.3389/fmars.2021.703902
Received: 01 May 2021; Accepted: 16 July 2021;
Published: 03 August 2021.
Edited by:
Goneri Le Cozannet, Bureau de Recherches Géologiques et Minières, FranceReviewed by:
Pushpa Dissanayake, University of Kiel, GermanyDewi Le Bars, Royal Netherlands Meteorological Institute, Netherlands
Copyright © 2021 Lawrence, Stephens, Blackett, Bell and Priestley. This is an open-access article distributed under the terms of the Creative Commons Attribution License (CC BY). The use, distribution or reproduction in other forums is permitted, provided the original author(s) and the copyright owner(s) are credited and that the original publication in this journal is cited, in accordance with accepted academic practice. No use, distribution or reproduction is permitted which does not comply with these terms.
*Correspondence: Judy Lawrence, judy.lawrence@vuw.ac.nz