North Atlantic Western Boundary Currents Are Intense Dissolved Organic Carbon Streams
 Marcos Fontela
 Fiz F. Pérez
 Herlé Mercier
 Pascale Lherminier
- 1Instituto de Investigaciones Marinas (IIM-CSIC), Vigo, Spain
- 2Centre of Marine Sciences (CCMAR), University of Algarve, Faro, Portugal
- 3Laboratoire d’Océanographie Physique et Spatiale, UMR 6523 CNRS-IFREMER-IRD-University of Brest, Plouzané, France
In the North Atlantic, there are two main western boundary currents related to the Atlantic Meridional Overturning Circulation (AMOC): the Gulf Stream flowing northward and the Deep Western Boundary Current (DWBC) flowing southward. Here we analyze data from the OVIDE section (GO-SHIP A25 Portugal-Greenland 40–60°N) that crosses the DWBC and the northward extension of the Gulf Stream, the North Atlantic Current. We show that North Atlantic western boundary currents play a key role in the transport of dissolved organic matter, specifically dissolved organic carbon (DOC). Revisited transports and budgets of DOC with new available data identify the eastern Subpolar North Atlantic (eSPNA) as an important source of locally produced organic matter for the North Atlantic and a key region in the supply of bioavailable DOC to the deep ocean. The East Greenland Current, and its upstream source the East Reykjanes Ridge Current on the eastern flank of the mid-Atlantic ridge, are export pathways of bioavailable DOC toward subtropical latitudes. The fast overturning and subsequent remineralization of DOC produced in the autotrophic eSPNA explains up to 38% of the total oxygen consumption in the deep North Atlantic between the OVIDE section and 24°N. Carbon budgets that do not take into account this organic remineralization process overestimates the natural uptake of carbon dioxide (CO2) from the atmosphere by one third. The inclusion of DOC transports in regional carbon budgets reconciles the estimates of CO2 uptake in the North Atlantic between model and observations.
Introduction
Western boundary currents are strong and narrow currents confined to the western sides of ocean basins. In the North Atlantic, the Gulf Stream is the western boundary current of the anticyclonic subtropical gyre and the North Atlantic Current (NAC) is its northeastward extension (Arhan, 1990; Rossby, 1996). At depth, the Deep Western Boundary Current (DWBC) transports North Atlantic Deep Water (NADW) at the exit of the cyclonic subpolar gyre toward to world ocean (Schott and Brandt, 2007). The conversion of the warm and salty waters of the NAC into colder and fresher waters of the DWBC in the eastern Subpolar North Atlantic (eSPNA) is the main driver of the Atlantic Meridional Overturning Circulation (AMOC) (Daniault et al., 2016; Lozier et al., 2019).
The trans-Atlantic section OVIDE (A25 GO-SHIP, 40–60°N) crosses the northeastward pathway of the NAC and two southward western boundary currents, one located at the eastern flank of the Reykjanes Ridge [East Reykjanes Ridge Current (ERRC)] and another at the eastern Greenland slope [East Greenland Current (EGC) Figure 1] (Lherminier et al., 2007, 2010). These boundary currents are the continuations of the NAC toward the Labrador Sea that are joined by the DWBC fed by the overflows from the Nordic Seas (Daniault et al., 2016). While it is known that upper ocean western boundary currents are inorganic nutrient streams (Pelegrí et al., 1996, 2006; Williams et al., 2006, 2011), their influence in the organic nutrient transport remains uncertain. The role of the organic matter cycling, dissolved organic carbon (DOC) and nitrogen (DON), in the biogeochemistry of the North Atlantic has been recently revisited based on OVIDE data. An inverse model approach determined that DOC carried to subpolar latitudes from the tropics by the NAC is exported from the deep water formation regions toward the subtropical Atlantic within the lower limb of the AMOC (Fontela et al., 2016). A subsequent reevaluation identified the eSPNA as an important source of organic nutrients (DON) by itself (Fernández-Castro et al., 2019). More quantitative assessments are necessary since production, export and remineralization of organic nutrients (DON and DOP, dissolved organic phosphorus) influence the large-scale inorganic nutrient budgets (Torres-Valdés et al., 2009).
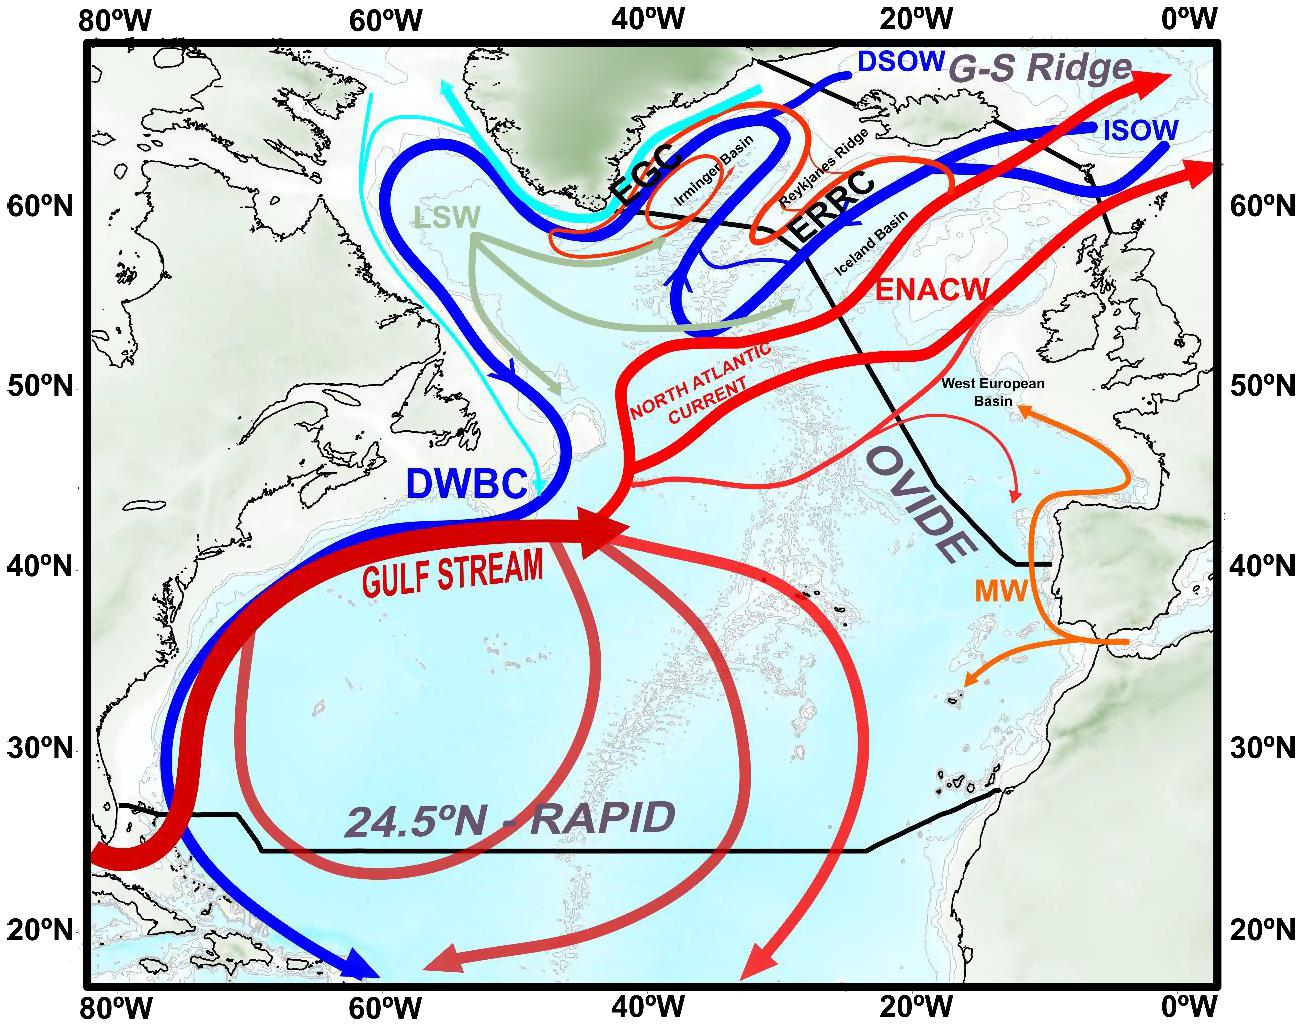
Figure 1. Schematic map of the North Atlantic large scale circulation. Warm and salty (cold and fresh) currents represented in red (blue and cyan). Intermediate circulation of Mediterranean Water (Labrador Sea Water) represented in orange (gray). Tracks for the OVIDE section, and 24.5°N–RAPID and Greenland-Scotland (G-S) Ridge are indicated (black lines). The eastern Subpolar North Atlantic (eSPNA) domain is comprehended between the OVIDE section and the G-S Ridge (black line). Abbreviations for the water masses are: DSOW, Denmark Strait Overflow Water; ISOW, Iceland-Scotland Overflow Water; LSW, Labrador Sea Water; ENACW, Eastern North Atlantic Central Water; MW, Mediterranean Water. Abbreviations for the main currents are: EGC, East Greenland Current; ERRC, East Reykjanes Ridge Current; DWBC, Deep Western Boundary Current formed by the southward spreading of LSW, ISOW, and DSOW. Schematic diagram of the large-scale circulation adapted from Daniault et al. (2016).
Dissolved organic carbon produced in surface waters (Carlson, 2002) can be vertically exported to depth through overturning circulation, deep convection and subduction (Tian et al., 2004; Carlson et al., 2010; Hansell et al., 2012; Fontela et al., 2016). This carbon export alters the partial pressure of carbon dioxide (pCO2) in surface waters and therefore influences air-sea carbon dioxide (CO2) exchanges. In fact, the carbon sequestration mediated by DOC represents around a third of the North Atlantic CO2 sink (Fontela et al., 2016). Estimates of atmospheric CO2 uptake by the North Atlantic (18–49°N) ranges between 200 Tg-C⋅year–1 for observation-based estimates of surface ocean partial pressure of CO2 (pCO2) (Takahashi et al., 2009; Landschützer et al., 2014) to 300 Tg-C⋅year–1 for inversion models (Mikaloff Fletcher et al., 2007; Gruber et al., 2009; Gerber and Joos, 2010). Therefore, there is an important mismatch of 100 Tg-C⋅year–1 between models and observations in the latitude band 18–49°N. To date, no study has addressed what is the contribution of western boundary currents in the organic matter transport and the CO2 uptake.
Materials and Methods
OVIDE Sampling Program
The OVIDE section, a high-resolution hydrographic survey from Portugal to Greenland, is repeated biennially during spring-summer since 2002 (Figure 1). Cruise data are available from the CLIVAR Carbon Hydrographic Data Office, (CCHDO) and sea scientific open data edition (SEANOE) (OVIDE Group, 2020). DOC was sampled during the 2002 (10 June–12 July) and 2016 (17 June–31 July) cruises. Around 30 full-depth hydrographic stations separated by a mean distance of 100 kilometers were sampled for DOC. Each cruise has a total of about 300 DOC samples. During the 2016 cruise, samples for DOC (30 mL) were dripped directly from the Niskin bottles into pre-combusted (450°C, 24 h) amber glass flasks that were acid-cleaned and dried prior to each station. After acidification with phosphoric acid (H3PO4), the samples were stored frozen until analysis. Sampling procedure for the 2002 cruise was reported in Álvarez-Salgado et al. (2013). During the sampling process there was no filtration. Indeed, it was previously shown that there is no difference between filtered and unfiltered samples at the μmol⋅kg–1 resolution at depths larger than 1000 m (Hansell and Carlson, 2001). This is because the probability of inclusion of particulate material in the small volume (30 mL) of the sample is very low. In consequence, we can assume that the total organic carbon (TOC) measured represents the DOC pool. DOC was measured by high temperature catalytic oxidation with a Shimadzu TOC-V analyzer (Álvarez-Salgado et al., 2013), with a measurement error of ±1–2 μmol⋅kg–1. The accuracy was tested daily with certified deep seawater reference materials (CRM) provided by D.A. Hansell (University of Miami, United States). The measurements of CRM in 2002 (44.5 ± 1.1 μmol⋅kg–1, n = 17) and 2016 (43.7 ± 1.8 μmol⋅kg–1, n = 37) are in agreement with the expected range (43–45 μmol⋅kg–1).
Additionally, a modeled [DOC] was calculated following Fontela et al. (2016) methodology based on the inversion of an extended Optimum Multiparameter (eOMP) analysis of twelve Source Water Types (SWT) (García-Ibáñez et al., 2015) that resolves the water mass [DOC] characterization ([DOC]SWT). The coupling of the resultant [DOC]SWT with the water mass fractions that composes a sample according to the eOMP allows us to estimate a modeled [DOC] value ([DOC]eOMP) for samples without measured DOC (Supplementary Table 1).
In the present study, we discuss the cycling of the bioavailable DOC pool: eDOC, where the prefix “e” comes from excess DOC (Santana-Falcón et al., 2017). The [eDOC] is defined as the difference between the DOC and a fixed background refractory concentration ([eDOC] = [DOC]-[DOCrefractory], where [DOCrefractory] = 40 ± 1 μmol⋅kg–1). The eDOC pool includes the labile, semi-labile and semi-refractory fractions of DOC, with lifetimes between days and decades (Hansell, 2013). Then, the eDOC concept is useful to express relevant biogeochemical processes at decadal timescale because it is directly proportional to the bioavailability of the DOC. The background refractory DOC was taken in accordance with the concentration of the deep-water [DOC] (Hansell, 2013).
Transports and Budgets
Transports at OVIDE are computed combining the absolute velocity field orthogonal to the section (v) with the in situ densities (ρi.s.) and the interpolated tracer concentration (Eq. 1) (Álvarez et al., 2004; Lherminier et al., 2010; Zunino et al., 2014; Fontela et al., 2016, 2019; Pérez et al., 2018). In the OVIDE section, the available resolution of the standard tracers: temperature, salinity, dissolved oxygen and macronutrients, and its velocity field is at least six times larger than for DOC. Therefore, the DOC distribution was interpolated ([DOC]interp) to the higher resolution of the OVIDE section with a triangulation algorithm (Delaunay, 1934; Figure 2). The net transports represent the full-depth water column and the tracers considered are the interpolated fields of [DOC] and [eDOC] from the measurements, and from the water mass reconstruction [DOC]eOMP and [eDOC]eOMP.
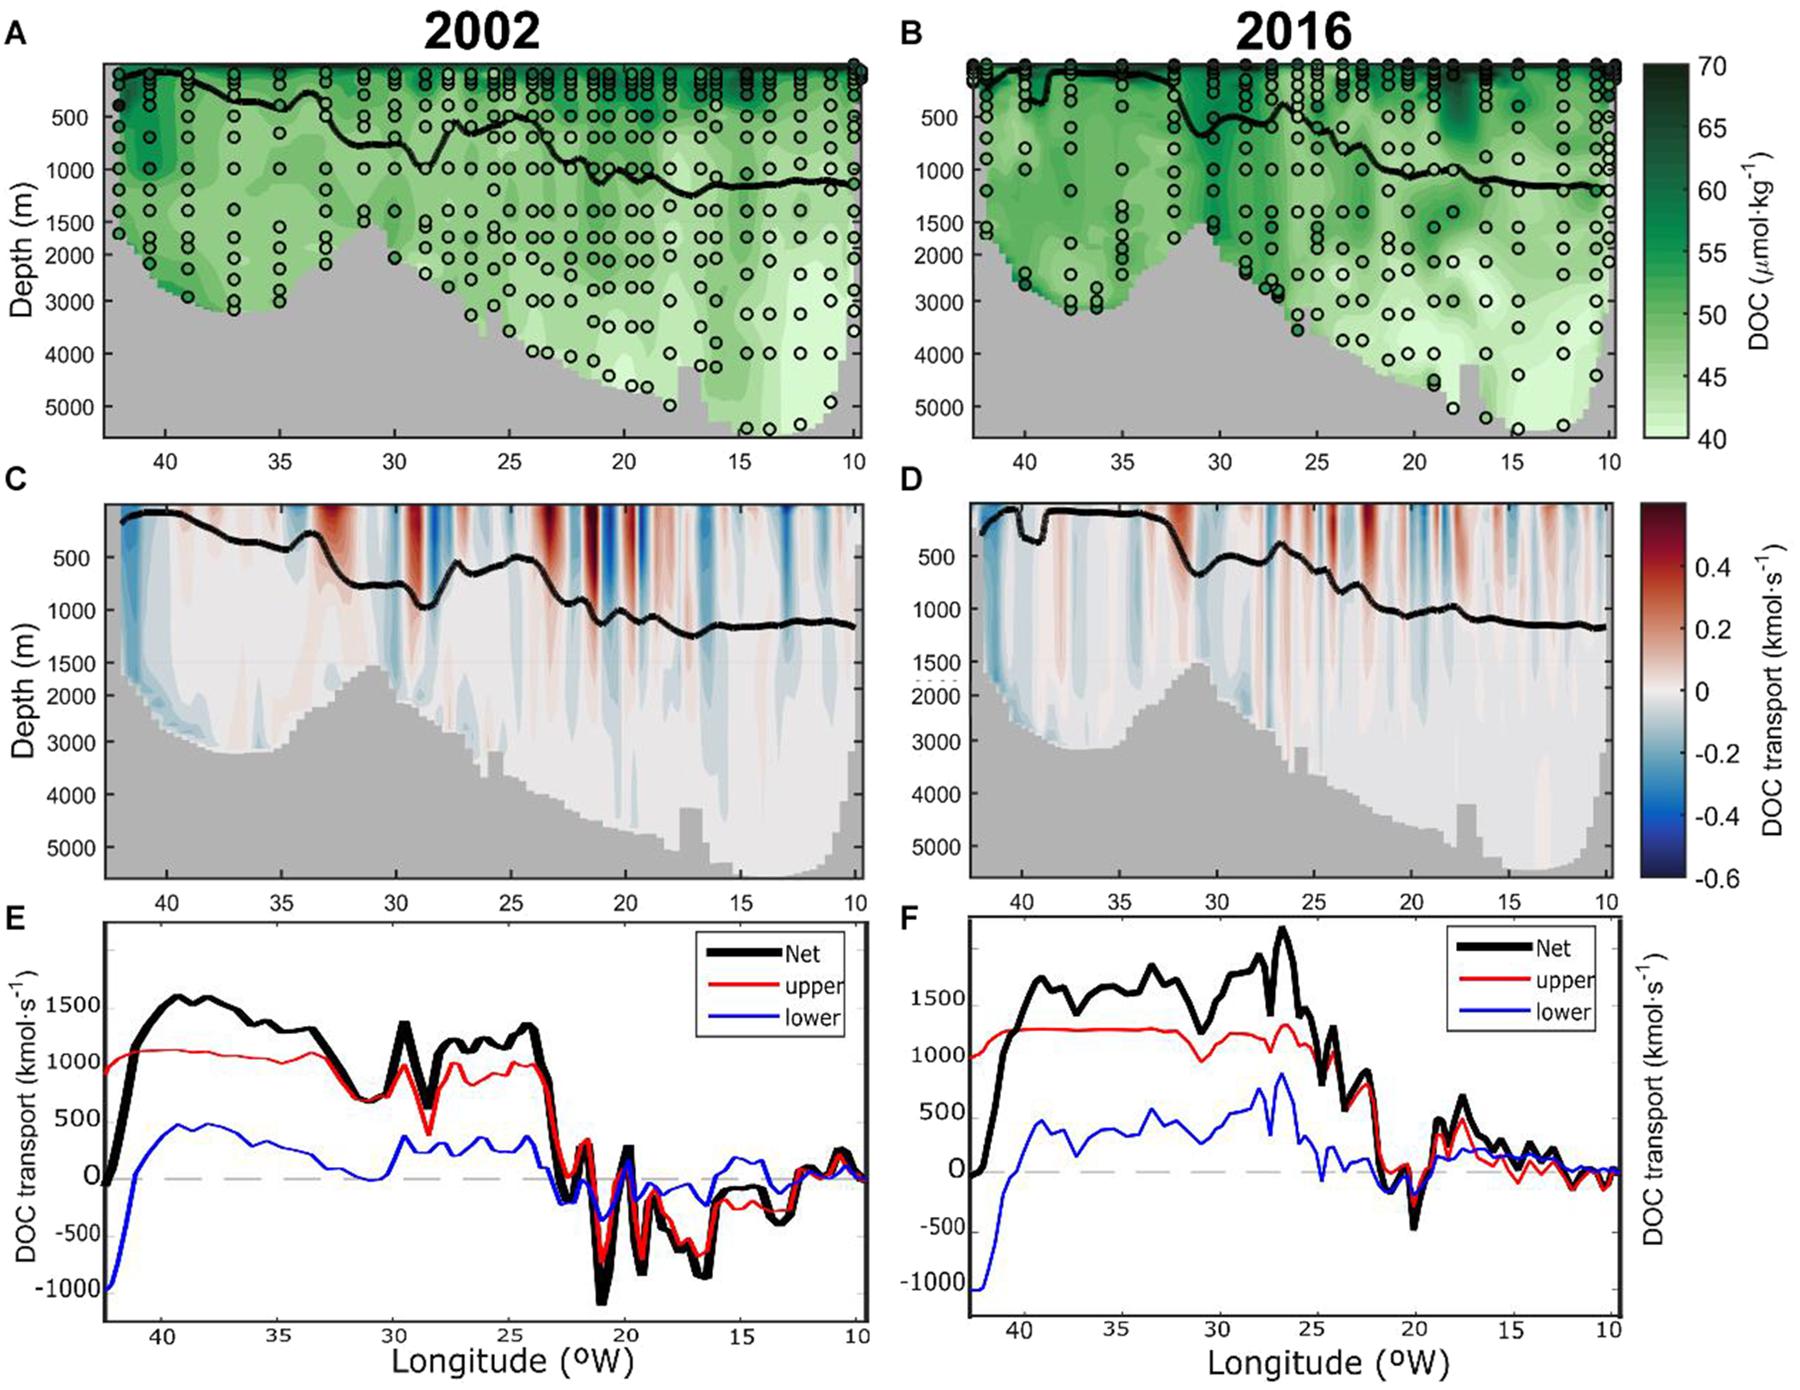
Figure 2. Vertical distribution of dissolved organic carbon (DOC, in μmol⋅kg–1) along the OVIDE section (A) 2002 and (B) 2016 from Greenland (left) to the Iberian Peninsula (right). Sampling points for DOC are indicated by open circles. Transports of DOC (kmol⋅s–1), orthogonal to the OVIDE section, in (C) 2002 and (D) 2016. Positive (negative) values represents northward (southward) transports. Isopycne σAMOC (potential density referred to 1000 dbar, solid black line) separating the upper and lower limbs of AMOC is also shown. Note that the depth scale is not linear. Accumulative sum of the depth-integrated DOC transports (kmol⋅s–1) from the Iberian Peninsula (right) to Greenland (left) in (E) 2002 and (F) 2016. The net transport (black line) is the sum of the upper (red line) and lower limb (blue line) transports. Note that this accumulated transport starts at 0 kmol⋅s–1 in the easternmost position and finishes at the westernmost position where it equals the net transport across the OVIDE section.
Errors were computed using a perturbation method based on normally distributed perturbations of the velocity and the tracer field. The perturbations were generated taking into account the error covariance matrix for the velocities (Mercier, 1986) and the measurement error for the DOC. Final transport errors are the standard deviations of a thousand transport perturbation simulations. The potential density level at which the maximum cumulative southward transport occurs is the limit between the upper and lower limbs of the AMOC (σAMOC) (Lherminier et al., 2007; Mercier et al., 2015). Density criteria for AMOC separation, rather than depth levels, is preferred because it captures the full overturning in the eSPNA by entirely accounting for the flows in the upper and lower branches of the AMOC that are in reverse directions at overlapping depths but of different densities (Mercier et al., 2015; Lozier et al., 2019). This isopycnal level is 32.18 kg⋅m–3 for 2002 and 32.17 kg⋅m–3 for 2016. The integration of transports from surface to σAMOC is the tracer transport in the upper limb. The integration of transport between σAMOC and the bottom is the tracer transport in the lower limb. Transports at the Greenland-Scotland (G-S) Ridge and 26°N are computed as in Pérez et al. (2013) and Fontela et al. (2016) and updated with recent data available for the subarctic exchanges (Østerhus et al., 2019) and the RAPID/MOCHA Time Series array (we will refer from now on asRAPID) (Smeed et al., 2018). The transport across σAMOC is an output of our model in the eSPNA, and is assumed zero in the subtropical box. More details about the transport computations can be found in the Supplementary Tables 2, 3. The eDOC budget in the eSPNA, as the volume comprised in between the OVIDE section and the G-S Ridge, is the net balance between eDOC consumption due to biological activity and lateral advection. Budget errors were computed by error propagation as the square root of the sum of all squared errors. Mass conservation is ensured with the same net northward transport (0.65 Sv) across the two boundaries of the eSPNA. In the southward limit the net northward transport is the mean of the transport across OVIDE for the cruises 2002 (0.25 Sv) and 2016 (1.05 Sv). At the G-S Ridge the mean net transport resultant from the data available is 0.2 Sv (Supplementary Table 2). In order to ensure mass conservation, the difference (0.45 Sv) has been added to the larger and most variable flux across the G-S Ridge, that is, the Eastern North Atlantic Central water (ENACW) mass (Østerhus et al., 2019) (Supplementary Table 2). Because transport of volume is balanced, a decrease (increase) in a tracer transport implies a sink (source). Other sources of eDOC, as for example atmospheric deposition or input from rivers, are not considered due their low contributions (Fontela et al., 2016; Fernández-Castro et al., 2019).
Results
DOC Distribution and Transports
The vertical distributions of [DOC] along the OVIDE section for the years 2002 and 2016 (Figures 2A,B) are similar, with high values at the surface ([DOC] > 60 μmol⋅kg–1) decreasing with depth. The lowest [DOC] is found in the deepest part of the section over the Iberian Abyssal Plain (>4000 m depth), with values close to [DOCrefractory]. There is an increase in [DOC] of intermediate waters (∼1000–2000 m) from East to West (Supplementary Figure 1). Thick vertical strips with high [DOC] are observed in the ERRC and EGC currents. Above the eastern flank of the Reykjanes Ridge, high [DOC] is more evident in 2016 than in 2002. At the Greenland slope (45°W) there is a higher [DOC] in 2002 than in 2016.
The transport distribution of DOC at the OVIDE section (Figures 2C,D) follows the orthogonal velocity field: positive (negative) transport indicates northward (southward) direction. The main currents are visible in the longitudinal distribution of the depth-integrated accumulated transport of DOC from the Iberian Peninsula to Greenland (Figures 2E,F). The σAMOC isopycnal sets the limit between the upper waters with a net northward transport of DOC and the bottom waters with a net southward transport of DOC (Figures 2E,F). The net transport of DOC obtained by summing the contributions of the upper and lower limbs is southward: −65 ± 31 kmol⋅s–1 and −35 ± 57 kmol⋅s–1 for 2002 and 2016, respectively. The transports are usually surface intensified, while in the ERRC and EGC they are remarkably barotropic. At the western boundary currents, the intensified southward transports associated with Iceland Scotland Overflow Water (ISOW) over the eastern flank of the Reykjanes Ridge (Figures 2E,F) and Denmark Strait Overflow Water (DSOW) in the Irminger Basin are also identified (Spall and Price, 1998; Lherminier et al., 2007; Zunino et al., 2017). For the year 2002 the southward transport of ISOW over the eastern flank of the Reykjanes Ridge is interrupted by a recirculation feature that is not visible in 2016. The NAC is a wide DOC stream in northward direction (Figures 2E,F). The transport of DOC by the NAC is larger in the upper limb, but its deep extension also reaches the lower limb, especially at their northernmost branches (Daniault et al., 2016). Conversely, the EGC is a narrow and powerful DOC stream in southward direction in the lower limb of the AMOC (Figures 2E,F).
The net transport of eDOC is also southward and quite similar: −73 ± 19 and −76 ± 27 kmol⋅s–1, for 2002 and 2016, respectively. The longitudinal distribution of the depth-integrated accumulated transport of eDOC from the Iberian Peninsula to Greenland for 2002 and 2016 are shown in Figure 3, along with the modeled transport. Following the transport evolutions from east to west, there is a first zone (∼10–20°W) where accumulated transports differ between 2002 and 2016, with 2016 (2002) showing a net northward (southward) transport. This difference disappears to the West, where the main feature is the steep increase in accumulated northward transport (positive) that dominates from longitude 20°W to ∼25°W (NAC) with similar patterns in 2002 as 2016. Then, in the eastern flank of the Reykjanes Ridge (Figure 3), 2002 and 2016 cruises are again different: in 2002 there is a plateau with little change in accumulated transport, while in 2016 there is a steep decrease that corresponds with a notable southward transport at the eastward flank of the Reykjanes Ridge. In the Irminger Sea, the accumulated transports are similar for both years until the western boundary. Reaching Greenland (∼40°W), there is a steep decrease in accumulated transport linked to the dominant EGC in southward direction. The agreement between the transports computed with the measured concentrations and the ones modeled with the water masses distribution (dashed lines in Figure 3) is reasonable, especially for the 2002 cruise. In 2016, the evolution of the measured and modeled accumulated transports differs mainly between 30 and 25°W, above the eastern flank of the Reykjanes Ridge, and then the difference remains constant until the end of the section. In 2002 the difference in net transports is concentrated exclusively in the westernmost southward current. Even so, the net eDOC transport using the water mass model reconstruction is −6 ± 24 and 16 ± 41 kmol⋅s–1 for the 2002 and 2016, respectively. The differences in net transport between both methodologies are evident (67 and 92 kmol⋅s–1).
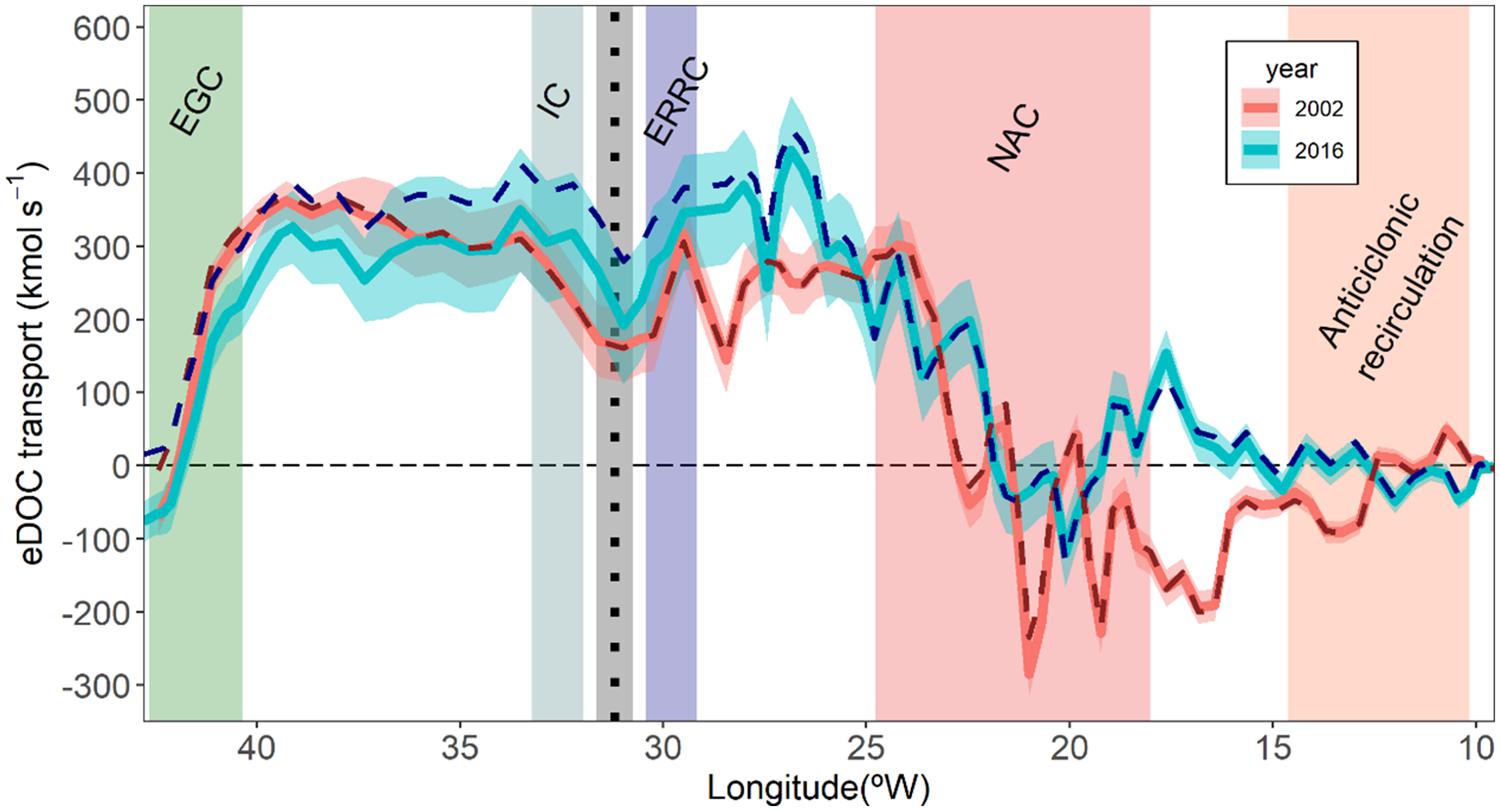
Figure 3. Depth-integrated accumulated transports of eDOC (kmol⋅s–1) from the Iberian Peninsula (right) to Greenland (left) for the occupations of the OVIDE section 2002 (blue lines) and 2016 (red lines). Note that this accumulated transport starts at 0 kmol⋅s–1 in the easternmost position and finishes at the westernmost position where it equals the net transport across the OVIDE section. Solid lines are the transports with the measured samples while dashed lines are the transports with the modeled eOMP characterization. The band around the measured transports represents the accumulated standard deviation error. The position of the Reykjanes Ridge is represented with the black dashed line and the gray vertical bar. The positions of the main currents crossed by the OVIDE section is represented with colored bands and the acronyms: EGC, East Greenland Current; IC, Irminger Current; ERRC, East Reykjanes Ridge Current; NAC, North Atlantic Current and the anticyclonic recirculation.
eDOC Budget
eDOC transports across the eSPNA are summarized in Figure 4 combining the results from 2002 to 2016 cruises. Northward transport of eDOC by the upper limb of the AMOC is 215 ± 33 kmol⋅s–1. Southward transport of eDOC across the section in the lower limb of the AMOC is 290 ± 34 kmol⋅s–1. The mean velocity-weighted [eDOC] advected northward in the upper limb of the AMOC across the OVIDE section is 11.6 ± 1.8 μmol⋅kg–1, while the mean velocity-weighted [eDOC] advected southward in the lower limb is 16.2 ± 1.9 μmol⋅kg–1 (Figure 4). This means an enrichment in eDOC of 4.6 ± 2.6 μmol⋅kg–1 along the AMOC North of OVIDE section. Accordingly, we find a net southward eDOC transport of −75 ± 33 kmol⋅s–1 (28 Tg-C⋅year–1) across the section. Through the G-S Ridge, 96 ± 11 kmol⋅s–1 of eDOC are transported northward, while −94 ± 7 kmol⋅s–1 are flowing southward as overflow waters. Accordingly, there is an insignificant net eDOC transport across the G-S Ridge. Across the eSPNA there is an increase of 2.8 μmol⋅kg–1 in the average velocity-weighted [eDOC] in the upper limb between OVIDE (11.6 ± 1.8 μmol⋅kg–1) and the G-S Ridge (14.4 ± 1.7 μmol⋅kg–1) (Figure 4). The intense overturning circulation inside the eastern-SPNA (11.6 ± 1.4 Sv) shows an even higher average velocity-weighted [eDOC] (16.5 ± 2.9 μmol⋅kg–1) that results in a downward eDOC transport of 196 ± 35 kmol⋅s–1 (74 Tg-C⋅year–1). The net eDOC budget in the eSPNA is the sum of the advection terms and amounts to 77 ± 49 kmol⋅s–1. At 24.5°N the eDOC circulation is characterized by an upper-limb northward transport of 239 kmol⋅s–1 (17 Sv) and an almost negligible lower-limb southward transport of only 7 kmol⋅s–1 (16.8 Sv), resulting in a net northward eDOC transport of 232 kmol⋅s–1 (87 Tg-C⋅year–1). The velocity-weighted [eDOC] of the upper limb of the AMOC at RAPID (13.6 μmol⋅kg–1) is slightly higher than that found at the OVIDE section, while a large decrease in the velocity-weighted [eDOC] of the lower-limb of the AMOC of 15.8 μmol⋅kg–1 is observed between OVIDE (16.2 μmol⋅kg–1) and RAPID (0.4 μmol⋅kg–1). Because volume transports are balanced, a decrease in eDOC transport is the consequence of a eDOC sink that we identify as consumption due to remineralization mediated by microbiological plankton respiration, the net eDOC transport decrease in the lower limb of the AMOC between OVIDE and RAPID implies an eDOC consumption of 283 kmol⋅s–1 (107 Tg-C⋅year–1). The expected eDOC consumption (sink) in the upper layer between RAPID and OVIDE is balanced with eDOC production (source) in the euphotic layer.
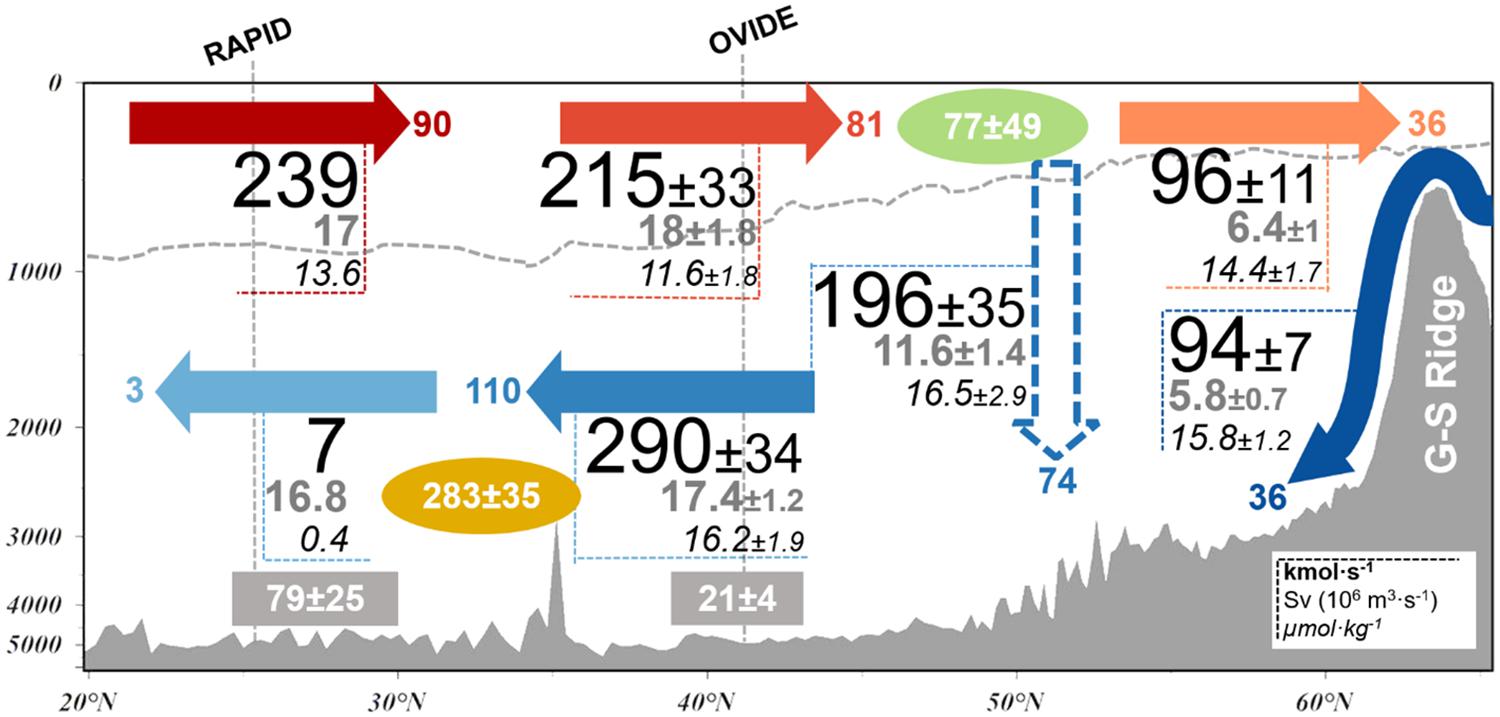
Figure 4. Mean eDOC budget in the North Atlantic (24.5–65°N) for the years 2002 and 2016. The schema represents the eDOC transport (kmol⋅s–1 in bold black numbers and Tg-C⋅year–1 in color at the arrows tips), volume transport (Sv, gray numbers below eDOC transport) and mean [eDOC] (μmol⋅kg–1, italicized numbers below volume transport) between the RAPID section (left), the OVIDE section (middle) and the G-S Ridge (right). The net production of eDOC is in the green ellipse (kmol⋅s–1) and the net consumption in the orange ellipse (kmol⋅s–1). The separation between upper and lower AMOC limbs is represented with the gray dashed line. Values inside the gray rectangular boxes represent the mean apparent oxygen utilization (AOU, in μmol⋅kg–1) in the lower limb. The downward export in the eSPNA inferred from the observed values is represented with the dashed arrow. Associated uncertainties (±) are given when available.
Discussion
Basin-scale repetitions of DOC measurements in the global ocean are scarce. Here we show DOC measurements along two occupations of a North Atlantic section separated in time by 14 years (2002–2016). The distribution of DOC (Figures 2A,B) shows differences in the surface layer and in the western boundary currents. The main circulation features of the northern North Atlantic described with OVIDE data are visible in the DOC transport (Figures 2E,F): the anticyclonic recirculation toward subtropical latitudes near the Iberian Peninsula (15–10°W) (Pollard et al., 1996; Paillet and Mercier, 1997), the three main branches of the NAC (25–15°W) and the strong DWBC (Daniault et al., 2016). In the West European Basin the transport differences between 2002 and 2016 (Figure 3, 20–10°W) are the consequence of a westward displacement in the usual southward anticyclonic recirculation south of the NAC. The mean top-to-bottom transport in the West European Basin (east of 19°W) in the year 2002 is 15 Sv, close to the mean climatological value of −13 ± 2 Sv (Daniault et al., 2016), in contrast with the top-to-bottom transport of 0.8 Sv for 2016. This is consistent with the increase in subarctic water from the Labrador Sea and the following shift of the subpolar front toward southern locations in 2016 (Holliday et al., 2020).
The transport of eDOC by the EGC is larger than the transport by the ERRC, but both currents act as significant organic carbon streams in southward direction. The influence of the ERRC as an intense organic carbon stream is more evident in 2016. The core of the ISOW flowing southward across OVIDE section is located just at the eastern flank of the Reykjanes Ridge. An exceptionally large ISOW transport has been reported in June 2014 at this location (García-Ibáñez et al., 2018), so we suggest that the anomaly of eDOC (Supplementary Figure 2) is driven by this enhanced southward ISOW transport that has been sustained, at least, until 2016. Despite the overall coincidence between the accumulated transports computed with the measured and the modeled concentrations (Figure 3), possible bias in the reconstruction of tracer transports with the water mass composition approach (Fontela et al., 2016; de la Paz et al., 2017) must be carefully evaluated in strong barotropic western boundary currents (Supplementary Figure 2). The mean transport at the eastern flank of the Reykjanes Ridge across OVIDE section is southward and dominated by the ERRC (Daniault et al., 2016). An important question about these findings is why was the [DOC] in the ERRC not as barotropic in the 2002 as in 2016? We suggest that this was because the circulation was more intense in 2016 than in 2002 (Figure 2C), due in particular to the recent increase in southward ISOW transport (García-Ibáñez et al., 2018). We suggest that an intense ISOW flow in the ERRC (as in 2016 cruise) increases the amount of DOC enriched waters from upstream locations (south of Iceland) affecting the vertical DOC distribution. Nevertheless, the view of the ERRC as a continuous flow along the eastern flank of the ridge has been recently questioned by Petit et al. (2019) who showed that the ERRC intensity and properties strongly vary in latitude by constant exchange of mass and properties with the Iceland Basin and across the Ridge, resulting in a maximum top-to-bottom barotropic transport at OVIDE latitudes. The fact that the northward recirculation feature of summer 2002 does not appear in the climatological mean circulation (Daniault et al., 2016) is also an example of the tenuous significance of a biogeochemical budget constructed with a single summer cruise. The averaging of repeated sections improves the assessment of long-term biogeochemical budgets and reduces their uncertainties (Ganachaud and Wunsch, 2002; Fontela et al., 2019).
With respect to the previous published budgets (Fontela et al., 2016; Fernández-Castro et al., 2019) there are some differences in volume fluxes because we used the most recent transport estimates at the G-S Ridge (Østerhus et al., 2019) and RAPID (Smeed et al., 2018). Furthermore, the net transport across OVIDE section or G-S Ridge have not been forced to be zero (Fernández-Castro et al., 2019), and the necessary mass conservation is ensured by imposing the same net northward transport across the two boundaries of the eSPNA. The DOC in the eSPNA, rather than being in balance as suggested by the initial modeled approach (Fontela et al., 2016), is confirmed as a net southward source of recently produced DOC (77 ± 49 kmol⋅s–1). This result is in line with the southward export of organic matter from the eSPNA (Fernández-Castro et al., 2019).
In the eSPNA, there is a gain of 4.9 μmol⋅kg–1 in the mean velocity-weighted [eDOC] that is conveyed into the lower limb (16.5 ± 0.6 μmol⋅kg–1) compared to that at OVIDE (11.6 ± 0.5 μmol⋅kg–1); and there is also a gain of 2.8 μmol⋅kg–1 in the mean velocity-weighted [eDOC] of the northward flow through the G-S Ridge (14.4 ± 4.5 μmol⋅kg–1). These results point to an increase in [eDOC] due to local DOC production of 77 ± 49 kmol⋅s–1. The coupling between production and export of DOC in the North Atlantic reflects the export of locally produced DOC (Roshan and DeVries, 2017). This result agrees within uncertainties with the magnitude of the net DOC production (111 ± 45 kmol⋅s–1) reported by Fernández-Castro et al. (2019). Thus, the relatively fast overturning circulation conveys the recently produced [eDOC] that is afterward exported toward subtropical latitudes.
The export of bioavailable DOC toward subtropical latitudes has impacts in the heterotrophic communities downstream. The consumption of DOC in the lower limb (283 kmol⋅s–1) between subpolar and subtropical latitudes is 70% larger than previously reported (Fontela et al., 2016). This result supposes that the magnitude of DOC exported via deep water formation previously considered for the whole Atlantic Ocean (227 kmol⋅s–1, 0.086 PgC⋅year–1) (Hansell, 2013) should be revised up. Globally, there is an increasing consensus for the DOC export out of surface waters of around 2 PgC⋅year–1 (Hansell et al., 2009; Letscher et al., 2015; Roshan and DeVries, 2017), but only a tenth of that DOC (∼530 kmol⋅s–1) reaches depths greater than 500 m (Hansell et al., 2009). Thus, the AMOC plays a key role at global scale providing >50% of the deep-ocean bioavailable DOC.
The northward advection of subtropical waters and the inorganic nutrient availability in the eSPNA are closely related (Johnson et al., 2013; Hátún et al., 2017). Following stoichiometric relationships, DOC transports are expected to be concurrent with organic nutrient (DON/DOP) transports (Hopkinson and Vallino, 2005). In contrast with the inorganic nutrients, advection of subtropical waters into the eSPNA would bring higher loads of dissolved organic nutrients. This can be seen in the large [DOC] of ENACW (Supplementary Table 1, Fontela et al., 2016) and in the mean velocity-weighted [eDOC] of the AMOC upper limb. Organic nutrient streams can be biologically assimilated whatever the depth, although the consumption of dissolved organic matter is favored in euphotic zones (Letscher et al., 2015). On the contrary, inorganic nutrient streams are subsurface features that require the induction into the euphotic zone in order to be biologically assimilated (Williams et al., 2006). The large primary production in the eSPNA is maintained by the transport of inorganic nutrient streams mediated by the NAC (Pelegrí et al., 1996; Fontela et al., 2019). Taking into account that the origin of DOC is biological production (Carlson, 2002), the net production of DOC (77 ± 49 kmol⋅s–1) set the eSPNA as a net autotrophic region. This result agrees within uncertainties with the net autotrophy found in the eSPNA through biogeochemical assessments in Maze et al. (2012) (107 kmol⋅s–1) and Fontela et al. (2019) (119 kmol⋅s–1). The short transit times of the circulation of a water parcel around the subpolar gyre (3 ± 1 year) (Fernández-Castro et al., 2019) coupled with the process of overturning and the existence of strong western boundary currents converts the eSPNA in a hotspot for the export of bioavailable DOC into the deep ocean and toward subtropical latitudes.
The apparent oxygen utilization (AOU) quantifies the total oxygen consumption since the last time the water mass was at the surface (where it is assumed to be at oxygen saturation). AOU can be converted to carbon-equivalents (AOU-Ceq) with the molar ratio ΔC/ΔO2 = -0.72 proposed by Anderson (1995). The ratio between the decrease in eDOC along the pathway of the AMOC (ΔeDOC = 15.8 μmol⋅kg–1, Figure 4) and the increase in AOU-Ceq (ΔAOU-Ceq = (21–79 μmol⋅kg–1)∗ ΔC/ΔO2, 41.8 μmol⋅kg–1) can be used to quantify the relative significance of eDOC export for the biological pump in terms of oxygen consumption. The contribution of eDOC to total oxygen consumption trough respiration between subpolar and subtropical latitudes is 38 ± 7%. This ratio is slightly above the 33 ± 6% found in Fontela et al. (2016), but it is in agreement regardless the new consideration of the eSPNA as a source of recently produced DOC. The contribution of DOC oxidation to oxygen consumption reveals the bioavailability of the eDOC and the relatively short transit time of the recently formed DOC across the autotrophic eSPNA.
The North Atlantic (18–49°N) uptakes a considerable amount of atmospheric CO2. Observation-based estimates (200 Tg-C⋅year–1, Takahashi et al., 2009; Landschützer et al., 2014) and ocean inverse transport estimates (300 Tg-C⋅year–1, Mikaloff Fletcher et al., 2007; Gruber et al., 2009; Gerber and Joos, 2010) differ in 100 Tg-C⋅year–1 (Figure 5). Furthermore, inversion models are able to discriminate the gas exchange of natural CO2 from the anthropogenic contribution, with a consensus around 200 Tg-C⋅year–1 for the natural uptake of CO2 (Mikaloff Fletcher et al., 2007; Gruber et al., 2009). The methodology to estimate the uptake of natural CO2 in inversion models do not include the DOC divergence, which is assumed small (Mikaloff Fletcher et al., 2007). Our findings claim that DOC divergence in the North Atlantic lower limb is relevant enough to be considered (Figure 5). We argue that the DOC consumption of 107 Tg-C⋅year–1 found here is transformed in dissolved inorganic carbon (DIC) through remineralization in the dark ocean. That source of DIC is then erroneously assigned to uptake from the atmosphere in the inversion models. Here we show that around a third of the total uptake (half of the natural uptake) diagnosed by the inverse models is due the DOC circulation with the AMOC. If inversion model estimates included this source of DIC from DOC in their divergences, there would be agreement with observations (Figure 5). Note that this interpretation reconciles the sink estimates between inverse models (300 Tg-C⋅year–1 minus the 107 Tg-C⋅year–1 DOC remineralization) and observations (200 Tg-C⋅year–1) (Takahashi et al., 2009; Landschützer et al., 2014). Therefore, models that do not include organic carbon transports overestimate the natural uptake of CO2 from the atmosphere in the North Atlantic.
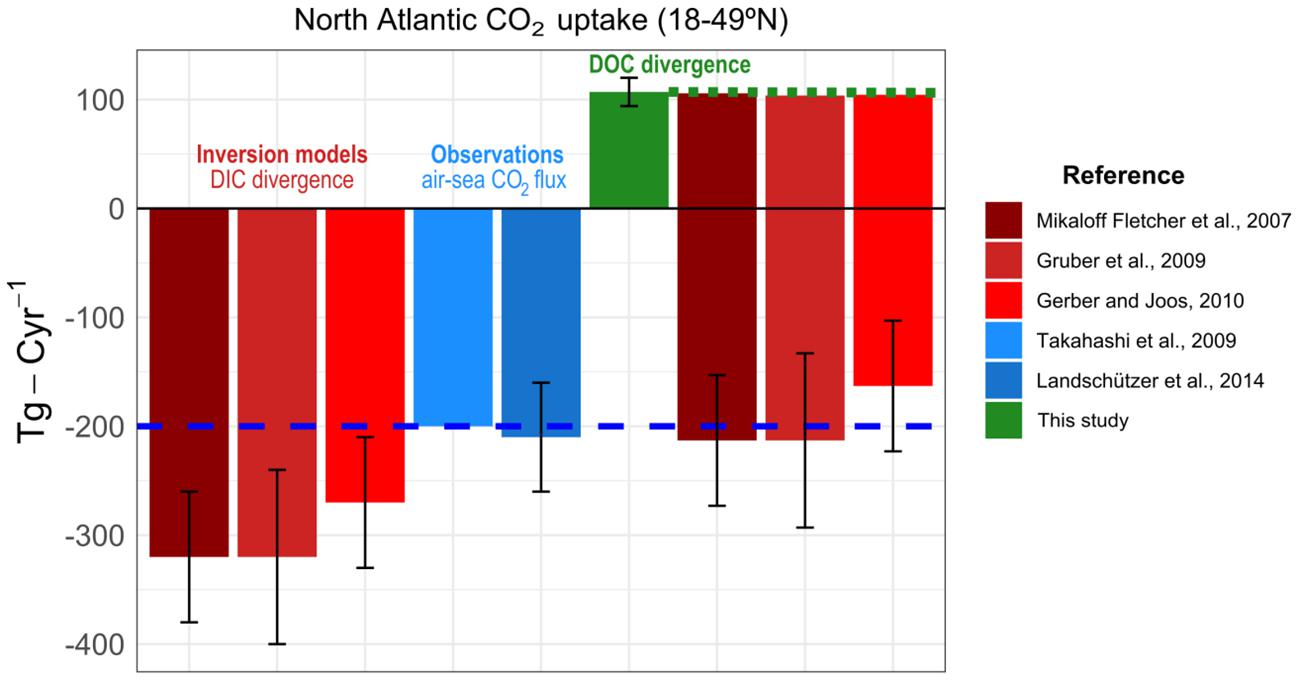
Figure 5. North Atlantic CO2 uptake (18–49°N) in ocean inversion models and observations. From left to right, graph bar of CO2 uptake (Tg-C⋅year–1) estimated trough ocean inversion models based in DIC divergences (red colors, Mikaloff Fletcher et al., 2007; Gruber et al., 2009; Gerber and Joos, 2010) and trough partial pressure of CO2 in the air-sea interface (blue colors, Takahashi et al., 2009; Landschützer et al., 2014). The magnitude of DOC divergence (this study) is represented in the green bar. Horizontal blue dashed line represents the air-sea CO2 flux (200 Tg-C⋅year–1) that includes the DIC divergence in the interior ocean. When considering the DOC divergence, the inversion model estimates (the three last red bars) are consistent with air-sea CO2 flux observations.
Conclusion
Here, we present a quantitative assessment of the key role that Western Boundary Currents have in the transport of DOC in the North Atlantic mediated by the AMOC. The western boundary currents are intense organic carbon streams responsible for the export of bioavailable DOC recently formed in the autotrophic waters of the subpolar North Atlantic. The overturning created by the light-to-dense deep water formation conveys and exports a considerable magnitude of eDOC (196 ± 35 kmol⋅s–1). Fundamentally the EGC, and its upstream source, the ERRC in the eastern flank of the Reykjanes Ridge, feed the export pathway of bioavailable DOC toward subtropical latitudes.
With almost 40% of the oxygen consumption explained by DOC remineralization, bioavailable DOC exported from subpolar latitudes fuels heterotrophic communities in deep-sea downstream subtropical zones and explains part of the connection between sources and sinks of energy in the North Atlantic carbon cycle. The remineralization of DOC to DIC in the lower limb of the AMOC is a relevant biogeochemical process that should be included in inverse modeling approaches to avoid the overestimation of the natural uptake of CO2 from the atmosphere. The inclusion of DOC transports in regional carbon assessments reconcile the estimates of CO2 uptake in the North Atlantic between observations and inverse models.
Data Availability Statement
OVIDE data is available from CLIVAR, Carbon Hydrographic Data Office (http://cchdo.ucsd.edu/) and SEANOE (Sea scientific open data edition) (http://www.seanoe.org, doi: 10.18142/140). The measurements of DOC for OVIDE/BOCATS 2016 can be found in Digital.CSIC repository (https://digital.csic.es/handle/10261/154341). The data from the RAPIDMOC monitoring project are funded by the Natural Environment Research Council and are freely available from www.rapid.ac.uk/rapidmoc.
Author Contributions
MF and FP wrote the manuscript and analyzed the data. MF prepared all the figures. All authors have contributed to the acquisition of data, have participated in the results discussion, and have reviewed the manuscript and supporting information.
Funding
For this work MF was funded by the Spanish Ministry of Economy and Competitiveness (BES-2014-070449) supported by the Spanish Government and co-funded by the Fondo Europeo de Desarrollo Regional 2007–2012 (FEDER) and by Portuguese national funds from FCT – Foundation for Science and Technology through project UID/Multi/04326/2019 and CEECINST/00114/2018. FP was supported by the BOCATS2 Project (PID2019-104279GB-C21) and ARIOS project (CTM2016-76146-C3-1-R) both co-funded by the Spanish Government and the Fondo Europeo de Desarrollo Regional (FEDER). This project has received funding from the European Union’s Horizon 2020 Research and Innovation Program under grant agreement no. 820989 (project COMFORT, Our common future ocean in the Earth system–quantifying coupled cycles of carbon, oxygen, and nutrients for determining and achieving safe operating spaces with respect to tipping points). HM was supported by the French Centre National de la Recherche Scientifique.
Conflict of Interest
The authors declare that the research was conducted in the absence of any commercial or financial relationships that could be construed as a potential conflict of interest.
Acknowledgments
The authors are grateful to the Captains, crew, technicians, and scientists for their support during all the OVIDE cruises. The authors thank all who contributed to the acquisition and data analysis. The authors acknowledge support of the publication fee by the CSIC Open Access Publication Support Initiative through its Unit of Information Resources for Research (URICI).
Supplementary Material
The Supplementary Material for this article can be found online at: https://www.frontiersin.org/articles/10.3389/fmars.2020.593757/full#supplementary-material
References
Álvarez, M., Pérez, F. F., Bryden, H., and Ríos, A. F. (2004). Physical and biogeochemical transports structure in the North Atlantic subpolar gyre. J. Geophys. Res. C Ocean 109:2015. doi: 10.1029/2003jc002015
Álvarez-Salgado, X. A., Nieto-Cid, M., Álvarez, M., Pérez, F. F., Morin, P., and Mercier, H. (2013). New insights on the mineralization of dissolved organic matter in central, intermediate, and deep water masses of the northeast North Atlantic. Limnol. Oceanogr. 58, 681–696. doi: 10.4319/lo.2013.58.2.0681
Anderson, L. A. (1995). On the hydrogen and oxygen content of marine phytoplankton. Deep. Res. Part I 42, 1675–1680. doi: 10.1016/0967-0637(95)00072-E
Arhan, M. (1990). The North Atlantic Current and Subarctic Intermediate Water. J. Mar. Res. 48, 109–144. doi: 10.1357/002224090784984605
Carlson, C. A. (2002). “Production and Removal Processes,” in Biogeochemistry of Marine Dissolved Organic Matter, eds D. A. Hansell and C. A. Carlson (San Diego: Academic Press), doi: 10.1016/b978-012323841-2/50006-3
Carlson, C. A., Hansell, D. A., Nelson, N. B., Siegel, D. A., Smethie, W. M., Khatiwala, S., et al. (2010). Dissolved organic carbon export and subsequent remineralization in the mesopelagic and bathypelagic realms of the North Atlantic basin. Deep. Res. Part II Top. Stud. Oceanogr. 57, 1433–1445. doi: 10.1016/j.dsr2.2010.02.013
Daniault, N., Mercier, H., Lherminier, P., Sarafanov, A., Falina, A., Zunino, P., et al. (2016). The northern North Atlantic Ocean mean circulation in the early 21st century. Prog. Oceanogr. 146, 142–158. doi: 10.1016/j.pocean.2016.06.007
de la Paz, M., García-Ibáñez, I., Steinfeldt, R., Ríos, A. F., and Pérez, F. F. (2017). Ventilation versus biology: What is the controlling mechanism of nitrous oxide distribution in the North Atlantic? Global Biogeochem. Cycles 31, 745–760. doi: 10.1002/2016GB005507
Delaunay, B. (1934). Sur la sphère vide. A la mémoire de Georges Voronoï. Classe des sciences mathématiques et naturelles. Bull. l’Académie l’URSS 6, 793–800.
Fernández-Castro, B., Álvarez, M., Nieto-Cid, M., Zunino, P., Mercier, H., and Álvarez-Salgado, X. A. (2019). Dissolved Organic Nitrogen Production and Export by Meridional Overturning in the Eastern Subpolar North Atlantic. Geophys. Res. Lett. 46, 3832–3842. doi: 10.1029/2018GL080284
Fontela, M., García-Ibáñez, M. I., Hansell, D. A., Mercier, H., and Pérez, F. F. (2016). Dissolved Organic Carbon in the North Atlantic Meridional Overturning Circulation. Sci. Rep. 6:26931. doi: 10.1038/srep26931
Fontela, M., Mercier, H., and Pérez, F. F. (2019). Long-term integrated biogeochemical budget driven by circulation in the eastern subpolar North Atlantic. Prog. Oceanogr. 173, 51–65. doi: 10.1016/j.pocean.2019.02.004
Ganachaud, A., and Wunsch, C. (2002). Oceanic nutrient and oxygen transports and bounds on export production during the World Ocean Circulation Experiment. Glob. Biogeochem. Cycles 16, 5–1. doi: 10.1029/2000gb001333
García-Ibáñez, M. I., Pardo, P. C., Carracedo, L. I., Mercier, H., Lherminier, P., Ríos, A. F., et al. (2015). Structure, transports and transformations of the water masses in the Atlantic Subpolar Gyre. Prog. Oceanogr. 135, 18–36. doi: 10.1016/j.pocean.2015.03.009
García-Ibáñez, M. I., Pérez, F. F., Lherminier, P., Zunino, P., Mercier, H., and Tréguer, P. (2018). Water mass distributions and transports for the 2014 GEOVIDE cruise in the North Atlantic. Biogeosciences 15, 2075–2090. doi: 10.5194/bg-15-2075-2018
Gerber, M., and Joos, F. (2010). Carbon sources and sinks from an Ensemble Kalman Filter ocean data assimilation. Glob. Biogeochem. Cycles 24:3531. doi: 10.1029/2009GB003531
Gruber, N., Gloor, M., Mikaloff Fletcher, S. E., Doney, S. C., Dutkiewicz, S., Follows, M. J., et al. (2009). Oceanic sources, sinks, and transport of atmospheric CO2. Glob. Biogeochem. Cycles 23:GB1005. doi: 10.1029/2008GB003349
Hansell, D. A. (2013). Recalcitrant Dissolved Organic Carbon Fractions. Ann. Rev. Mar. Sci. 5, 421–445. doi: 10.1146/annurev-marine-120710-100757
Hansell, D. A., and Carlson, C. A. (2001). Biogeochemistry of total organic carbon and nitrogen in the Sargasso Sea: Control by convective overturn. Deep. Res. Part II Top. Stud. Oceanogr. 48, 1649–1667. doi: 10.1016/S0967-0645(00)00153-3
Hansell, D. A., Carlson, C. A., and Schlitzer, R. (2012). Net removal of major marine dissolved organic carbon fractions in the subsurface ocean. Glob. Biogeochem. Cycles 26:GB004069. doi: 10.1029/2011GB004069
Hansell, D. A., Carlson, C. A., Repeta, D. J., and Schlitzer, R. (2009). Dissolved organic matter in the ocean a controversy stimulates new insights. Oceanography 22, 202–211. doi: 10.5670/oceanog.2009.109
Hátún, H., Azetsu-Scott, K., Somavilla, R., Rey, F., Johnson, C., Mathis, M., et al. (2017). The subpolar gyre regulates silicate concentrations in the North Atlantic. Sci. Rep. 7, 1–9. doi: 10.1038/s41598-017-14837-4
Holliday, N. P., Bersch, M., Berx, B., Chafik, L., Cunningham, S., Florindo-López, C., et al. (2020). Ocean circulation causes the largest freshening event for 120 years in eastern subpolar North Atlantic. Nat. Commun. 11:585. doi: 10.1038/s41467-020-14474-y
Hopkinson, C. S., and Vallino, J. J. (2005). Efficient export of carbon to the deep ocean through dissolved organic matter. Nature 433, 142–145. doi: 10.1038/nature03191
Johnson, C., Inall, M., and Häkkinen, S. (2013). Declining nutrient concentrations in the northeast Atlantic as a result of a weakening Subpolar Gyre. Deep. Res. Part I Oceanogr. Res. Pap. 82, 95–107. doi: 10.1016/j.dsr.2013.08.007
Landschützer, P., Gruber, N., Bakker, D. C. E., and Schuster, U. (2014). Recent variability of the global ocean carbon sink. Glob. Biogeochem. Cycles 28, 927–949. doi: 10.1002/2014GB004853
Letscher, R. T., Knapp, A. N., James, A. K., Carlson, C. A., Santoro, A. E., and Hansell, D. A. (2015). Microbial community composition and nitrogen availability influence DOC remineralization in the South Pacific Gyre. Mar. Chem. 177, 325–334. doi: 10.1016/j.marchem.2015.06.024
Lherminier, P., Mercier, H., Gourcuff, C., Alvarez, M., Bacon, S., and Kermabon, C. (2007). Transports across the 2002 Greenland-Portugal Ovide section and comparison with 1997. J. Geophys. Res. Ocean. 112, 1–20. doi: 10.1029/2006JC003716
Lherminier, P., Mercier, H., Huck, T., Gourcuff, C., Perez, F. F., Morin, P., et al. (2010). The Atlantic Meridional Overturning Circulation and the subpolar gyre observed at the A25-OVIDE section in June 2002 and 2004. Deep. Res. Part I Oceanogr. Res. Pap. 57, 1374–1391. doi: 10.1016/j.dsr.2010.07.009
Lozier, M. S., Li, F., Bacon, S., Bahr, F., Bower, A. S., Cunningham, S. A., et al. (2019). A sea change in our view of overturning in the subpolar North Atlantic. Science 363, 516–521. doi: 10.1126/science.aau6592
Maze, G., Mercier, H., Thierry, V., Memery, L., Morin, P., and Perez, F. F. (2012). Mass, nutrient and oxygen budgets for the northeastern Atlantic Ocean. Biogeosciences 9, 4099–4113. doi: 10.5194/bg-9-4099-2012
Mercier, H. (1986). Determining the general circulation of the ocean: A nonlinear inverse problem. J. Geophys. Res. Ocean. 91, 5103–5109. doi: 10.1029/JC091iC04p05103
Mercier, H., Lherminier, P., Sarafanov, A., Gaillard, F., Daniault, N., Desbruyères, D., et al. (2015). Variability of the meridional overturning circulation at the Greenland-Portugal OVIDE section from 1993 to 2010. Prog. Oceanogr. 132, 250–261. doi: 10.1016/j.pocean.2013.11.001
Mikaloff Fletcher, S. E., Gruber, N., Jacobson, A. R., Gloor, M., Doney, S. C., Dutkiewicz, S., et al. (2007). Inverse estimates of the oceanic sources and sinks of natural CO2 and the implied oceanic carbon transport. Glob. Biogeochem. Cycles 21:GB1010. doi: 10.1029/2006GB002751
Østerhus, S., Woodgate, R., Valdimarsson, H., Turrell, B., De Steur, L., Quadfasel, D., et al. (2019). Arctic Mediterranean exchanges: A consistent volume budget and trends in transports from two decades of observations. Ocean Sci. 15, 379–399. doi: 10.5194/os-15-379-2019
OVIDE Group (2020). The OVIDE set of cruises. French Oceanographic cruises directory. France: OVIDE Group. Available Online at: doi: 10.18142/140
Paillet, J., and Mercier, H. (1997). An inverse model of the eastern North Atlantic general circulation and thermocline ventilation. Deep. Res. Part I Oceanogr. Res. Pap. 44, 1293–1328. doi: 10.1016/S0967-0637(97)00019-8
Pelegrí, J. L., Csanady, G. T., and Martins, A. (1996). The North Atlantic nutrient stream. J. Oceanogr. 52, 275–299. doi: 10.1007/BF02235924
Pelegrí, J. L., Marrero-Díaz, A., and Ratsimandresy, A. W. (2006). Nutrient irrigation of the North Atlantic. Prog. Oceanogr. 70, 366–406. doi: 10.1016/j.pocean.2006.03.018
Pérez, F. F., Fontela, M., García-Ibáñez, M. I., Mercier, H., Velo, A., Lherminier, P., et al. (2018). Meridional overturning circulation conveys fast acidification to the deep Atlantic Ocean. Nature 554, 515–518. doi: 10.1038/nature25493
Pérez, F. F., Mercier, H., Vázquez-Rodríguez, M., Lherminier, P., Velo, A., Pardo, P. C., et al. (2013). Atlantic Ocean CO2 uptake reduced by weakening of the meridional overturning circulation. Nat. Geosci. 6, 146–152. doi: 10.1038/ngeo1680
Petit, T., Mercier, H., and Thierry, V. (2019). New Insight Into the Formation and Evolution of the East Reykjanes Ridge Current and Irminger Current. J. Geophys. Res. Ocean 124, 9171–9189. doi: 10.1029/2019JC015546
Pollard, R. T., Griffiths, M. J., Cunningham, S. A., Read, J. F., Pérez, F. F., and Ríos, A. F. (1996). Vivaldi 1991 - A study of the formation, circulation and ventilation of Eastern North Atlantic Central Water. Prog. Oceanogr. 37, 167–172. doi: 10.1016/S0079-6611(96)00008-0
Roshan, S., and DeVries, T. (2017). Efficient dissolved organic carbon production and export in the oligotrophic ocean. Nat. Commun. 8, 1–8. doi: 10.1038/s41467-017-02227-3
Rossby, T. (1996). The North Atlantic Current and surrounding waters: At the crossroads. Rev. Geophys 34, 463–481. doi: 10.1029/96RG02214
Santana-Falcón, Y., Álvarez-Salgado, X. A., Pérez-Hernández, M. D., Hernández-Guerra, A., Mason, E., and Arístegui, J. (2017). Organic carbon budget for the eastern boundary of the North Atlantic subtropical gyre: Major role of DOC in mesopelagic respiration. Sci. Rep. 7:10129. doi: 10.1038/s41598-017-10974-y
Schott, F. A., and Brandt, P. (2007). Circulation and deep water export of the subpolar North Atlantic during the 1990‘s. Geophys. Monogr. Ser. 173, 91–118. doi: 10.1029/173GM08
Smeed, D. A., Josey, S. A., Beaulieu, C., Johns, W. E., Moat, B. I., Frajka-Williams, E., et al. (2018). The North Atlantic Ocean Is in a State of Reduced Overturning. Geophys. Res. Lett. 45, 1527–1533. doi: 10.1002/2017GL076350
Spall, M. A., and Price, J. F. (1998). Mesoscale variability in Denmark strait: The PV outflow hypothesis. J. Phys. Oceanogr. 28, 1598–1623. doi: 10.1175/1520-04851998028<1598:MVIDST<2.0.CO;2
Takahashi, T., Sutherland, S. C., Wanninkhof, R., Sweeney, C., Feely, R. A., Chipman, D. W., et al. (2009). Climatological mean and decadal change in surface ocean pCO2, and net sea-air CO2 flux over the global oceans. Deep. Res. Part II Top. Stud. Oceanogr. 56, 554–577. doi: 10.1016/j.dsr2.2008.12.009
Tian, R. C., Deibel, D., Rivkin, R. B., and Vézina, A. F. (2004). Biogenic carbon and nitrogen export in a deep-convection region: Simulations in the Labrador Sea. Deep. Res. Part I Oceanogr. Res. Pap. 51, 413–437. doi: 10.1016/j.dsr.2003.10.015
Torres-Valdés, S., Roussenov, V. M., Sanders, R., Reynolds, S., Pan, X., Mather, R., et al. (2009). Distribution of dissolved organic nutrients and their effect on export production over the Atlantic Ocean. Glob. Biogeochem. Cycles 23:3389. doi: 10.1029/2008GB003389
Williams, R. G., McDonagh, E., Roussenov, V. M., Torres-Valdes, S., King, B., Sanders, R., et al. (2011). Nutrient streams in the North Atlantic: Advective pathways of inorganic and dissolved organic nutrients. Glob. Biogeochem. Cycles 25:GB4008. doi: 10.1029/2010GB003853
Williams, R. G., Roussenov, V., and Follows, M. J. (2006). Nutrient streams and their induction into the mixed layer. Glob. Biogeochem. Cycles 20:2586. doi: 10.1029/2005GB002586
Zunino, P., Garcia-Ibañez, M. I., Lherminier, P., Mercier, H., Rios, A. F., and Pérez, F. F. (2014). Variability of the transport of anthropogenic CO2 at the Greenland-Portugal OVIDE section: Controlling mechanisms. Biogeosciences 11:2014. doi: 10.5194/bg-11-2375-2014
Keywords: dissolved organic carbon, North Atlantic, carbon budget, carbon dioxide, biogeochemistry, Atlantic Meridional Overturning Circulation
Citation: Fontela M, Pérez FF, Mercier H and Lherminier P (2020) North Atlantic Western Boundary Currents Are Intense Dissolved Organic Carbon Streams. Front. Mar. Sci. 7:593757. doi: 10.3389/fmars.2020.593757
Received: 17 August 2020; Accepted: 11 November 2020;
Published: 27 November 2020.
Edited by:
Zhiyu Liu, Xiamen University, ChinaReviewed by:
Shijian Hu, Institute of Oceanology, Chinese Academy of Sciences (CAS), ChinaAdam Thomas Devlin, The Chinese University of Hong Kong, China
Copyright © 2020 Fontela, Pérez, Mercier and Lherminier. This is an open-access article distributed under the terms of the Creative Commons Attribution License (CC BY). The use, distribution or reproduction in other forums is permitted, provided the original author(s) and the copyright owner(s) are credited and that the original publication in this journal is cited, in accordance with accepted academic practice. No use, distribution or reproduction is permitted which does not comply with these terms.
*Correspondence: Marcos Fontela, mmfontela@ualg.pt; Fiz F. Pérez, fiz.perez@iim.csic.es