Age, Growth, and Sexual Maturity of the Crocodile Shark, Pseudocarcharias kamoharai, From the Eastern Atlantic Ocean
 Richard Kindong
 Haozhan Wang5†
 - 1College of Marine Sciences, Shanghai Ocean University, Shanghai, China
- 2National Engineering Research Center for Oceanic Fisheries, Shanghai Ocean University, Shanghai, China
- 3Ministry of Education Key Laboratory of Sustainable Exploitation of Oceanic Fisheries Resources, Shanghai Ocean University, Shanghai, China
- 4Collaborative Innovation Center for Distant Water Fisheries, Shanghai, China
- 5Sansha Marine Environmental Monitoring Center Station, State Oceanic Administration, Haikou, China
To better manage fish stocks, fisheries scientists use various data, including age and growth, to inform stock assessments and provide management advice. However, many non-targeted species, important to the marine ecosystem, including Pseudocarcharias kamoharai still lack such studies which may impede comprehensive assessment of stock status. This study presents the age, growth, and sexual maturity of this species from the Tropical Eastern Atlantic Ocean by examining vertebral samples and reproductive tracts. All samples were collected by Chinese Tuna Fishery Scientific Observers between November 2012 and May 2020, with sizes ranging from 46 to 101 cm fork length (FL). Four age enhancement techniques applied on whole and sectioned vertebral centra were compared. Four growth models fitted to the age data were also compared and the corrected Akaike information criterion was used to select the most plausible model. Whole vertebral centra stained with alizarin red S solution showed clearer growth band-pairs, and age ranged from 2 to 10 years (females) and from 2 to 11 years (males). No significant differences were observed in growth and age composition by sex in the sample. The three-parameter von Bertalanffy growth function presented the best fit to describe the growth of combined sexes of this species (L∞ = 107.8 cm FL, k = 0.18 year–1). Male specimens attained age-at-50% maturity (4.55 years) earlier than females (5.91 years). The estimated longevities were 11.95 and 13.33 years for females and males, respectively. The present study provides useful life history information, intending to elucidate the biology of this poorly managed shark species.
Introduction
Pelagic longline fisheries primarily targeting tuna and swordfish in oceanic waters worldwide also catch important numbers of pelagic sharks, increasing concerns about the worsening status of their populations (Dulvy et al., 2008). The populations of most pelagic sharks have declined significantly because of intense fishing pressure as most shark species have low reproductive rates, grow slowly and mature late (Cortés et al., 2010; Geraghty et al., 2014). Moreover, shark fishing limits are yet to be fully implemented despite this growing fishing pressure. Preventive management measures, therefore, need to be implemented to ensure the conservation of these species. However, in the Atlantic Ocean, data for most pelagic shark species are still lacking to develop sound management plans, except for blue sharks, porbeagle, and shortfin mako sharks (International Commission for the Conservation of Atlantic Tunas (ICCAT), 2019).
The crocodile shark, Pseudocarcharias kamoharai (Matsubara, 1936), is an epipelagic and mesopelagic species and is the smallest living lamnoid belonging to the Pseudocarcharidae family attaining 106.27 cm in fork length [converted from TL to FL with the formula FL = (TL + 0.3496)/1.1513 in Gao et al. (2013)] (Lessa et al., 2015). P. kamoharai occurs in all oceanic waters, with a known depth range from the surface to at least 590 m; it exhibits a diel vertical migration toward the surface at night and away during the day (Compagno, 2001; Last and Stevens, 2009; Ebert et al., 2013). Despite its worldwide distribution, P. kamoharai has been rarely studied and little is known about its life-history due to lack of data mainly because it is caught as bycatch and discarded in tuna and swordfish fisheries worldwide (Fujita, 1981; Compagno, 2001; Romanov et al., 2008; Oliveira et al., 2010; Dai et al., 2011; Coelho et al., 2012) and in artisanal fisheries (Martínez-Ortiz et al., 2015). P. kamoharai is ovoviviparous, with uterine oophagy and 2–4 pups per litter (usually 4, two from each uterus), which can vary between 31.57 and 40.35 cm FL at the end of the gestation period (White, 2007; Oliveira et al., 2010; Lessa et al., 2015; Wu et al., 2020). Sexual maturity of both sexes are attained almost at similar body lengths; females mature at lengths between 69.79 and 89.77 cm FL and males from 63.27 and 78.5 cm FL (White, 2007; Oliveira et al., 2010; Dai et al., 2011; Wu et al., 2020). In the western Atlantic Ocean, Lessa et al. (2015) reported that age-at-first maturity for male specimens was achieved at 3.1 years and females at 5.1 years.
Pseudocarcharias kamoharai is rarely a targeted species in most commercial fisheries, but an increase in their catch has recently been observed; this may be because of their very large liver which is rich in squalene, hence attracting some fisheries (Kyne et al., 2019), or due to the shifting nature of fisheries (Romanov et al., 2008). Currently, there is no age and growth information for this species in the Tropical Eastern Atlantic (TEA) Ocean. Given that the species is usually discarded, their catch data are usually either not recorded or under-reported in logbooks making it impossible to estimate population status based on commercial fisheries catches. To better assess the stock status of a given species, age, growth, and reproduction information is needed to evaluate growth rates, mortality rates, life expectancy, and other relevant fisheries aspects (Campana, 2001, 2014; Goldman et al., 2012). Furthermore, a recent ecological risk assessment study by Murua et al. (2018) has ranked the P. kamoharai as high risk due to their high vulnerability to capture and low biological productivity rate. Thus, life-history studies and well-organized fisheries monitoring systems are essential to accurately determine the conservation status of P. kamoharai in oceanic waters worldwide (Kyne et al., 2019).
Considering the lack of life-history information concerning P. kamoharai in the TEA, especially concerning age, growth and sexual maturity, this study aims to (1) estimate the age of P. kamoharai specimens through the reading of growth band-pair counts deposited on vertebral centra; (2) compare age enhancement techniques to determine which can better assess the age of P. kamoharai; (3) compare and obtain best growth models for this species; (4) determine sexual maturity ages for both sexes; and (5) provide age, growth, and reproductive data for population status assessments important to guide management measures necessary for the conservation of the species.
Materials and Methods
Collection of Specimens
Pseudocarcharias kamoharai specimens caught by Chinese tuna longline vessels operating in the TEA Ocean (6.31°S–12.15°N,18.32°W–36.47°W; Table 1 and Figure 1) between November 2012 and May 2020 were recorded by onboard Chinese scientific observers. Samples used in this study were taken only from dead specimens hauled onboard; specimens that arrived onboard alive was released after the hook was removed. These dead specimens were dissected onboard, then reproductive organs were measured or vertebrae samples collected for subsequent analyses.
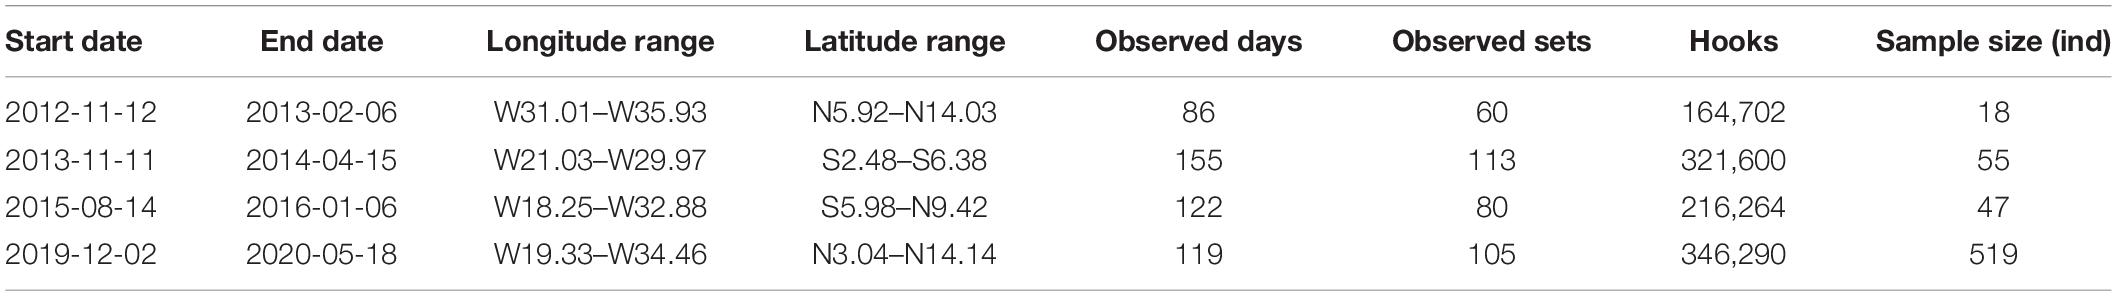
Table 1. Observer reports on the Tropical Eastern Atlantic longline fishing trips.
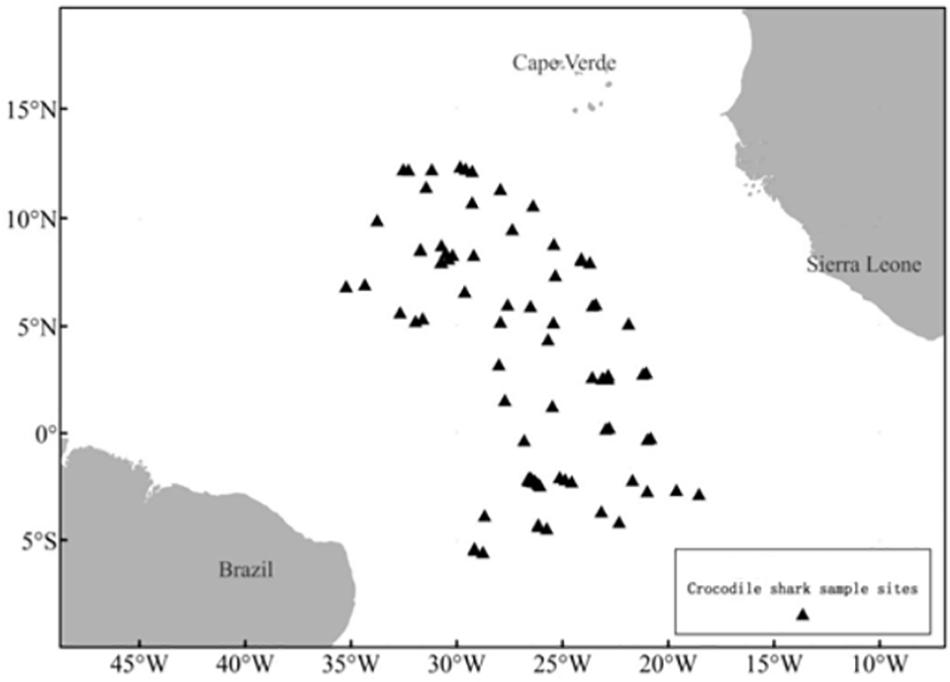
Figure 1. Set locations where P. kamoharai specimens were collected by the Chinese longline Fishery Observer in the Tropical Eastern Atlantic Ocean.
A total of 120 vertebrae were collected during three voyages done between November 2012 and January 2016, totaling 253 sets to perform aging analyses (Table 1). Another voyage was done between December 2019 and May 2020 with an observer on board to collect biological data including reproductive samples from captured P. kamoharai (Table 1). A total of 519 specimens were caught during this trip and their sexes identified onboard. The measurements of clasper length, uterus and oviducal glands width were also taken on board. For each specimen caught between December 2019 and May 2020, the maturity stages were also determined. The clasper length was measured to the nearest cm while the uterus and oviducal glands width were measured to the nearest mm with a Vernier calliper.
The sex and fork length (FL) of all specimens were recorded while onboard the longline vessels. In the present study, other reported length measurements used to size P. kamoharai such as total length (TL) were converted to the FL using the following formula FL = (TL + 0.3496)/1.1513 (Gao et al., 2013). For each specimen, the FL was measured in a straight line to the nearest lower cm. A set of five to eight vertebrae were extracted from the area below the anterior part of the first dorsal fin of each specimen collected between 2012 and 2016. These vertebrae samples were retained and stored frozen on board and returned to the laboratory for subsequent age determination.
Sample Processing and Preparation of Aging Structures
The frozen vertebrae samples were thawed and any excess tissue was removed using a scalpel. These vertebrae were later separated into individual centra, which were further used to estimate age. These centra were soaked into boiling water for approximately 3–7 min, to remove cartilaginous arches and other connective tissues around them. Centra still having remaining tissues were immersed in a solution of 5% sodium hypochlorite solution (commercial bleach) for about 5 min for complete cleansing. These centra were later rinsed with water for a few minutes to eliminate all the sodium hypochlorite and stored in ethanol at 75% until further use. Once each centrum was cleaned of all tissue and muscles, they were then air-dried from the ethanol for approximately 25 min to prepare them for the staining and sectioning processes (Supplementary Figure 1).
A series of experimental staining and sectioning methods were evaluated to determine the most appropriate technique for identifying growth bands. Primarily, to enhance the contrast between growth zones, whole vertebral centra were stained using three approaches: (1) stained with 0.01% alizarin red S solution (Dawson, 1926; Jolly et al., 2013); (2) immersed in 10% Cobalt nitrate (Co(NO3)2⋅6H2O) staining solution (Stevens, 1975), and (3) plunged into 10% Cobalt nitrate solution in acid alcohol, then in 1% ammonium sulfide solution (Cobalt nitrate ammonium sulfide, NH4)2S) staining (Hoenig and Brown, 1988). The usefulness of these staining techniques on the readability of growth band-pairs on the whole vertebral centra was compared. After staining, these centra were secured to a microscope slide, then examined under reflected and transmitted light using an Olympus DP71 microscope fitted with a digital camera.
The other method involved reading of growth bands through X-Ray (Cailliet et al., 2006) on whole and coronally sectioned unstained centra. These whole unstained centra were secured to a digital X-ray biological sample imaging system (Kodak DXS 4000 system) to take X-ray pictures. Whole centra were embedded in polyester resin and left to harden for 24 h, then coronal sections were performed dividing whole centra into two equal pieces to a 0.4 mm thickness each using an Isomet low-speed diamond-blade saw (Buehler, Lake Bluff, IL, United States) (Supplementary Figure 1; Matta et al., 2017). The sections revealed the corpus calcareum (bow-tie) and banding structure used to estimate age. After sectioning, each centrum was placed into a digital X-ray biological sample imaging system (Kodak DXS 4000 system) to take X-ray pictures.
Digital photographs of the processed vertebral centra were taken to count and mark growth bands. Photographs of each observed sample were observed and then digitally enhanced using the ImageJ software (Schindelin et al., 2015) by adjusting the contrast and brightness. The same software was used to mark the growth bands, as well as the pre-birth (PB) and birthmarks (BM), and also the centrum radius of each vertebral centrum.
Age Determination
Growth band pairs (defined as one translucent and one opaque band) were counted without the readers having prior knowledge of the length, sex, or previous age estimations of the fish while determining the age. According to a previous study on P. kamoharai by Lessa et al. (2015), the first two bands were considered to be the PB and BM. All vertebral centra were read by two independent readers and counts were accepted only if both readings were in agreement. If the count results of the first two readers were inconsistent, a third read was then performed. A vertebral centrum was discarded in the case where the three results were different. Counts that differed by two or more band pairs were rejected. If the estimated number of band pairs differed by one, then the centra were recounted and the final count was accepted if it agreed with one of the previous counts or rejected if the count did not match one of the previous two counts (Joung et al., 2015, 2018; Lessa et al., 2015). To avoid familiarity with any particular vertebral centrum, each growth band count was finished before starting the following one. At the end of all readings, only vertebral centrum whose band pair counts got two equal readings were considered for the age and growth analysis.
Precision and Error Analysis
The precision and error analyses among readings of the same vertebral centrum were assessed using: (IAPE) the index of average percent error (Beamish and Fournier, 1981) and (CV) coefficient of variation (Chang, 1982). Estimates of precision were calculated based on reads 1 and 2 (and 3 when appropriate). The equations used for IAPE (%) and CV (%) were as follows:
where N is the number of sharks aged, n is the number of readings, Xij is the count from the jth shark at the ith reading, s the mean count of the jth shark from i readings and Si is the standard deviation of i counts from the jth shark. The precision and error analysis, and a modified age-bias plot were done using the “FSA” package version 0.8.26 (Ogle, 2019) in the R statistical language environment version 3.6.3 (R Core Team, 2019).
Relationship Between Age and Growth Band Counts, FL and R
Lessa et al. (2015) used the Fraser-Lee method to back-calculate and evaluate whether the centra of P. kamoharai presented PB and birth growth marks. Lessa et al. (2015) reported that the first two visible growth bands starting from the focus of the centra represented the PB mark and the BM. A growth band was defined as a band-pair, containing one opaque and one translucent band (Cailliet et al., 2006). As per Lessa et al. (2015) hypothesis regarding age-based on annual growth bands and the exclusion of PB and BM on the final annual growth bands count, our study estimated the age of P. kamoharai to beA = X−2; where A is the annual actual growth mark counts and X is the total number of observed growth counts of the shark’s centrum reported by the readers. The annual deposition of bands for this species has been verified using marginal increment analysis by Lessa et al. (2015).
The relationship between the FL and the centrum radius (R) was estimated using three regression analyses (linear, power, and exponential equations); and the better fit was determined using the coefficient of determination (r2) and the corrected Akaike information criterion (AICc; Akaike, 1973; Burnham and Anderson, 2002). Equations of these three relationships are presented as follows:
where FL is the fork length (cm), R is the centrum radius (mm), x1, x2, x3, y1, y3 are regression coefficients, and y2 is the intercept. AICc, a size-adjusted bias correction was used, as the sample size was less than 200 (Zhu et al., 2009). AICc values of the three models were calculated and the model with relatively small AICc value was the best fit model. The expression of AICc is shown as follows:
where n is the total number of samples, and k is the total number of parameters + 1 for variance σ2. The model that has the lowest AICC value (AICmin) was chosen as the best fit for the data. The AIC difference (Δ) was calculated for each model (i = 1–3) and used to rank the remaining models as follows:
Models with Δ values from 0 to 2 had the highest support, whereas models in which Δ = 2–10 had considerably less support, and models with little or no support had Δ values > 10 (Burnham and Anderson, 2002). The probability of choosing the correct model was calculated using Akaike weights (wi) from the AICC differences for each model (Burnham and Anderson, 2002). The weights were calculated as follows:
where nm refers to the number of models used. An ANCOVA test was used to investigate possible differences between sexes in the relationship between R and FL (Zar, 2010).
Modeling Growth
The growth of P. kamoharai was modeled using four approaches. Applying multiple models has been suggested over the use of just one model (Cailliet et al., 2006), and is recommended as a development over a priori use of the von Bertalanffy growth model (Katsanevakis and Maravelias, 2008; Thorson and Simpfendorfer, 2009). Also, when using a multi-model approach, it is much more likely to obtain less biased growth estimates as compared to just using a single model (Cailliet et al., 2006).
The first model used was a three-parameter von Bertalanffy growth function (VBGF; von Bertalanffy, 1938, 1960) re-parameterized to estimate L0 (size at birth) instead of t0 (theoretical age at which the expected length is zero) (Cailliet et al., 2006) following Equation:
where Lt is the mean size (FL, cm) at age t (year), L∞ the maximum asymptotic size (FL), L0 is the size (FL, cm) at birth and k is the growth coefficient.
The second model used was a two-parameter VBGF, following the equation above, with L0 fixed to the size at birth of 39.5 cm FL described for this species considering observations in Wu et al. (2020).
The third and the fourth were the logistic and Gompertz Lt = L∞e(−L0e(−kt)) models, all modified from Ricker (1979). Models were fitted using the biologically relevant length-at-birth parameter (L0), instead of time at size zero parameter (t0; Cailliet et al., 2006).
To test the null hypothesis that there was no difference in growth parameters between male and female specimens, a likelihood ratio test (LRT; Kimura, 1980) was performed on the four growth models (Haddon, 2011). Additionally, the model goodness-of-fit was compared with the AICc with the model with the smallest AICc value being considered the best fit for the data. If no significant difference between male and female growth curves was detected for either dataset, then a common growth curve was produced.
Longevity
The theoretical longevity (tmax) for both female and male specimens was estimated following Fabens (1965). The respective equation for longevity based on the parameters of the VBGF following Fabens (1965) is as follows:
Reproductive Analyses
For both male and female specimens, the maturity stages were defined according to the previous study of P. kamoharai in the TEA (Wu et al., 2020). Reproductive organs were examined and categorized mainly according to the developmental stages of the ovaries and uteri in females, and claspers in males. Male sharks were classified into two stages and females into four stages, as detailed in Wu et al. (2020). Relationships between the FL and reproductive organs including clasper length, the width of the oviducal glands and uterus were determined.
The age at maturity was estimated by substituting the length-at-50% maturity estimated by Wu et al. (2020) into the selected best growth model. A paired sample t-test (Zar, 2010) was used to test for significant differences in the records of measured reproductive organs. Data processing and analyses and also plots were performed using MS-Excel 2013, ImageJ, and R environment version 3.6.3 (R Core Team, 2019).
Results
Sample Characteristics
A total of 639 P. kamoharai specimens was captured during the four voyages (Table 1). The largest female was caught during the first voyage in December 2012 having a length of 101 cm, bigger than the largest male, with a mean FL ± SD of 81.14 ± 7.96 cm while the mean FL ± SD for male specimens was 78.46 ± 6.28 cm. During all four voyages, specimens sampled for both sexes were predominantly between 70 and 89 cm FL; small specimens <60 cm FL were also obtained (Figure 2). The smallest specimen registered was a female of 46 cm FL caught in December 2019. Of the 639 specimens caught, vertebra centra used for age and growth analysis were obtained from 120 specimens collected between November 2012 and January 2016; and reproductive data were obtained from the remaining 519 specimens collected from December 2019 to May 2020.
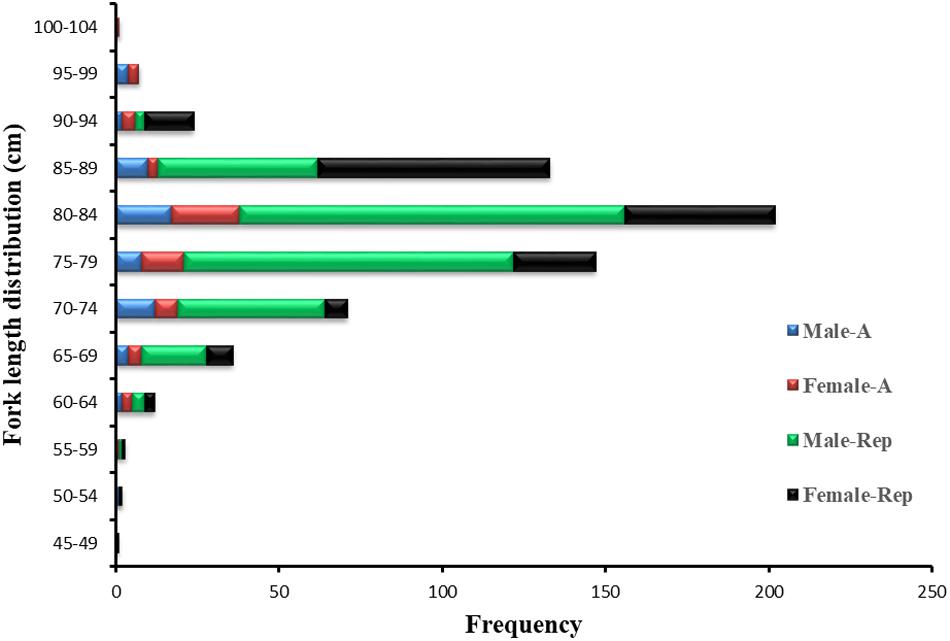
Figure 2. Length frequencies of male and female P. kamoharai specimens captured between November 2012 and May 2020. Blue bars represent male specimens for age study; Red bars, female specimens for age stu dy; Green bars, male specimens for reproduction study; Black bars, female specimens for reproduction study.
Staining Effects and Method Selection
The processed whole and coronally sectioned centra (Supplementary Figure 1) were viewed through X-Ray and microscope to determine P. kamoharai’s age. Staining with alizarin red S, cobalt nitrate, and cobalt nitrate ammonium sulfide (Figures 3a–c) had success rates of 93, 30, and 25%, respectively. The X-Ray approach on whole and coronal sections of the vertebral centra did not yield successful results (Figures 3d,e). Centra stained using alizarin red S were used for age determination since its success rate was higher, and counts/growth rings could be viewed clearly with transmitted white light (Figure 4).
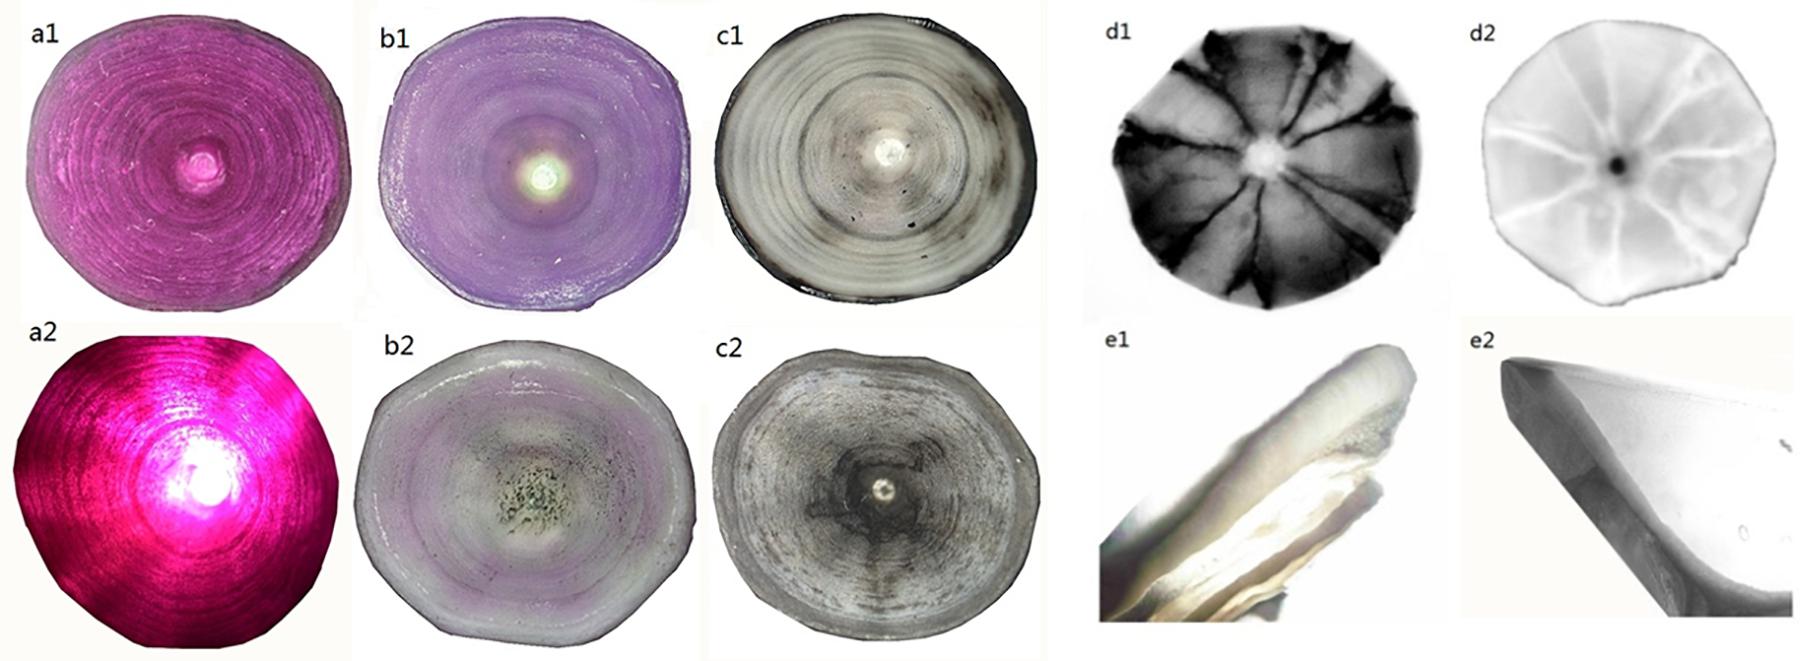
Figure 3. Images of P. kamoharai’s vertebrae with different enhancement techniques under varying light direction and source. Whole centrum (a–d) and coronally sectioned centrum (e). (a1) Alizarin red S staining method, viewed with reflected light; (a2) Alizarin red S staining method, viewed with transmitted light; (b1) Cobalt nitrate staining method, viewed with reflected light; (b2) Cobalt nitrate staining method, viewed with transmitted light; (c1) Cobalt nitrate and ammonium sulfide staining method, viewed with reflected light; (c2) Cobalt nitrate and ammonium sulfide staining method, viewed with transmitted light; (d1) whole centrum observed through X-Ray-negative phase; (d2) whole centrum observed through X-Ray-positive phase; (e1) sectioned centrum viewed with reflected light; (e2) sectioned centrum viewed with transmitted light.
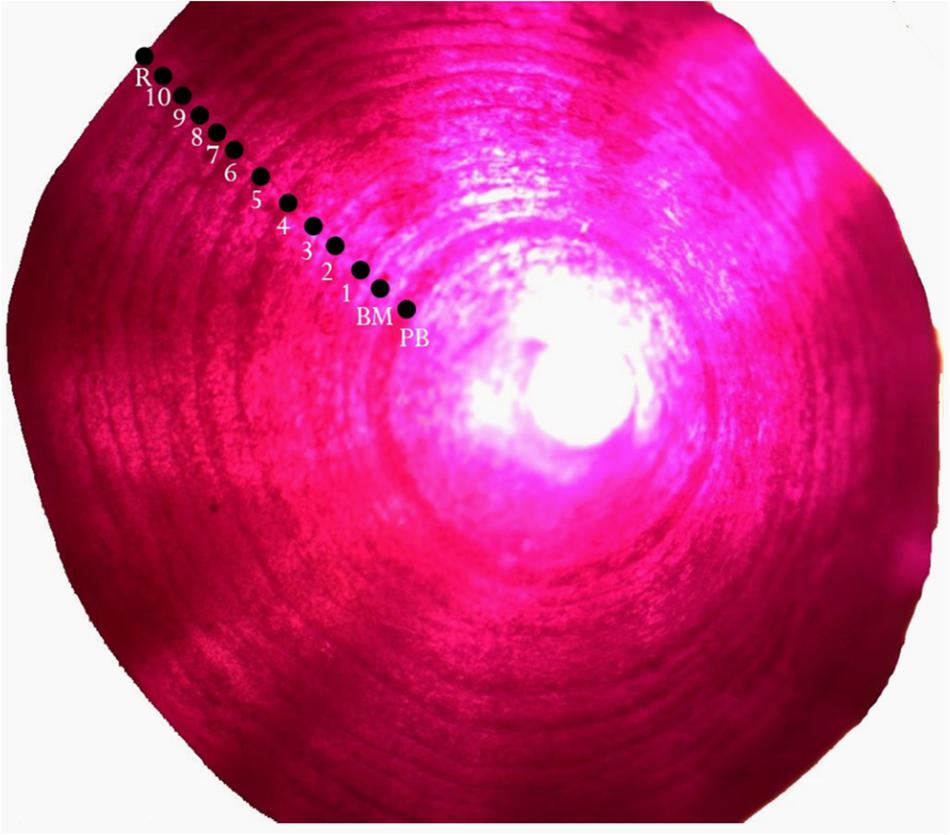
Figure 4. A whole vertebral centrum of a male P. kamoharai (91 cm FL) stained with Alizarin Red S showing growth band pairs; PM: Pre-Birth mark; BM: birthmark, R: centrum radius. Vertebral centrum observed through a microscope using transmitted light.
Age Determination, Precision and Error Evaluation
A total of 120 samples of vertebral centrum stained with alizarin red S were observed and read by two or three persons when necessary; 114 samples met the requirements (the same reading from at least two readers). Among the included centra, 60 were females (58-101 cm, FL; age 2–10) and 54 males (54-98 cm, FL; age 2–11). The age ranges obtained by counting the number of growth band-pairs starting from the corpus calcareum outwards were taken without considering band-pairs indicating the PB and BM. The CV and IAPE between the readings were 6.87 and 5.31%, respectively, signifying reproducibility in the age determination between the readers. Figure 5 shows high consistency in band pair readings between readers and the agreed age between the readers reveals a high agreement with no systematic bias (x2 = 75.2,d.f. = 59,P > 0.05)TL = 1.1513×FL−0.3496 The highest number of both male and female P. kamoharai specimens occurred at ages 6 and 7 years old (Figure 6). Male and female ratio at ages 6 and 7 showed no statistical difference (ANCOVA test; P = 0.949 > 0.05).
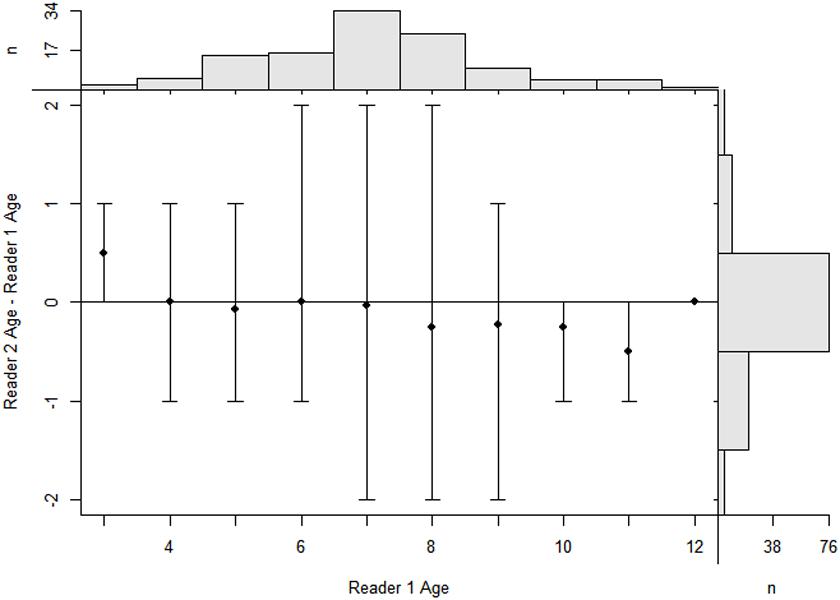
Figure 5. Age-bias plot of reader 1 estimates versus reader 2 estimates. Mean (dots) and range (intervals) of differences in vertebrae age estimates between two readers at the estimates for the first reader for P. kamoharai in the Tropical Eastern Atlantic Ocean. The agreement line, which is the horizontal line suggests, a difference in the two age estimates from readers. Marginal histograms are for age estimates of the first reader (top) and differences in age estimates between readers (right). The bar at a difference of zero represents the amount of perfect agreement between the sets of age estimates (n = 76).
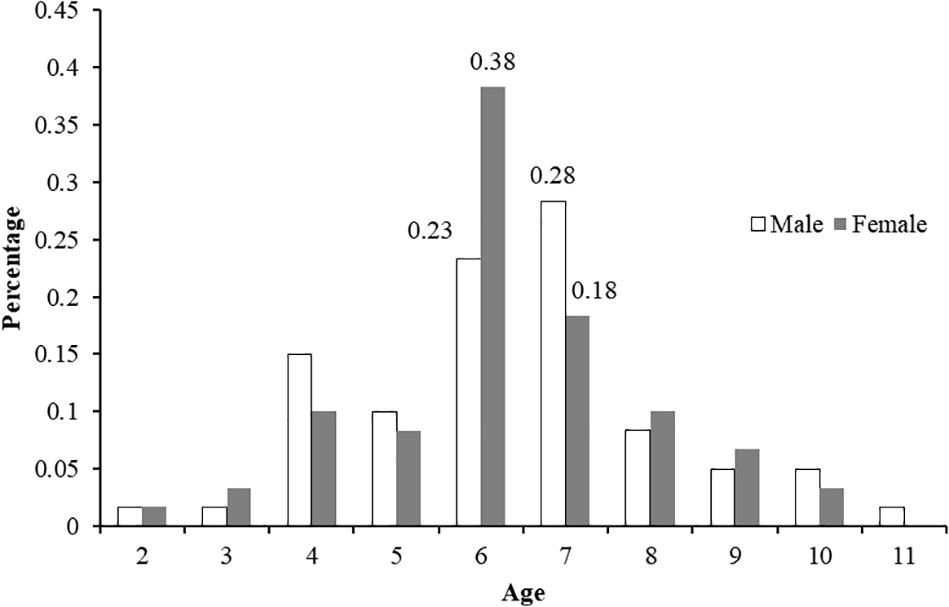
Figure 6. Age-frequency distributions (n = 114) for P. kamoharai caught in the Tropical Eastern Atlantic Ocean.
Relationship Between the Fork Length (FL) and Centrum Radius (R)
The ANCOVA test (P = 0.973 > 0.05) indicated that no significant difference existed between FL and R of both sexes as well as the interaction term between R and sexes. A single regression equation for combined sexes was obtained (FL = 11.12 R + 34.54, r2 = 0.55). The power function, linear function, and exponential function equations were used to analyze the relationship between FL and R of P. kamoharai. Results from these three models indicated slight differences in their correlation coefficients (r2). The correlation coefficient of the power function was slightly higher, while the AICc value of the exponential and power functions was larger than that of the linear function (Table 2). The AICc value of the linear function was the smallest, so in this study, the linear model best fitted the relationship between FL and R for P. kamoharai (Table 2). The relationship between the centrum radius for combined sexes and the FL was then plotted using the linear function (Figure 7).
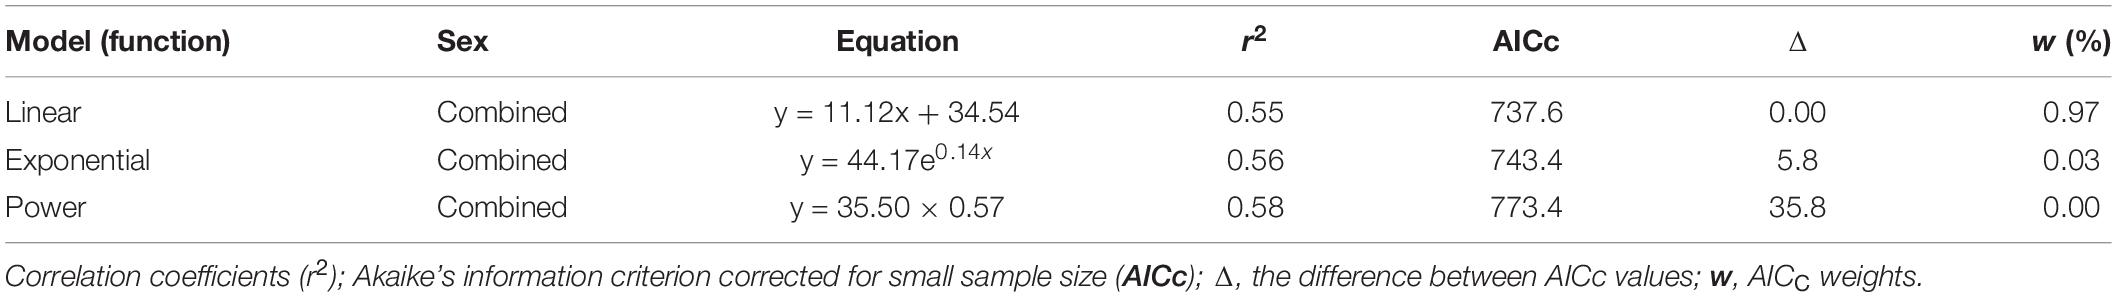
Table 2. Relationship between the fork length (FL) and centrum radius (R) for the combined sexes of P. kamoharai caught in the Tropical Eastern Atlantic.
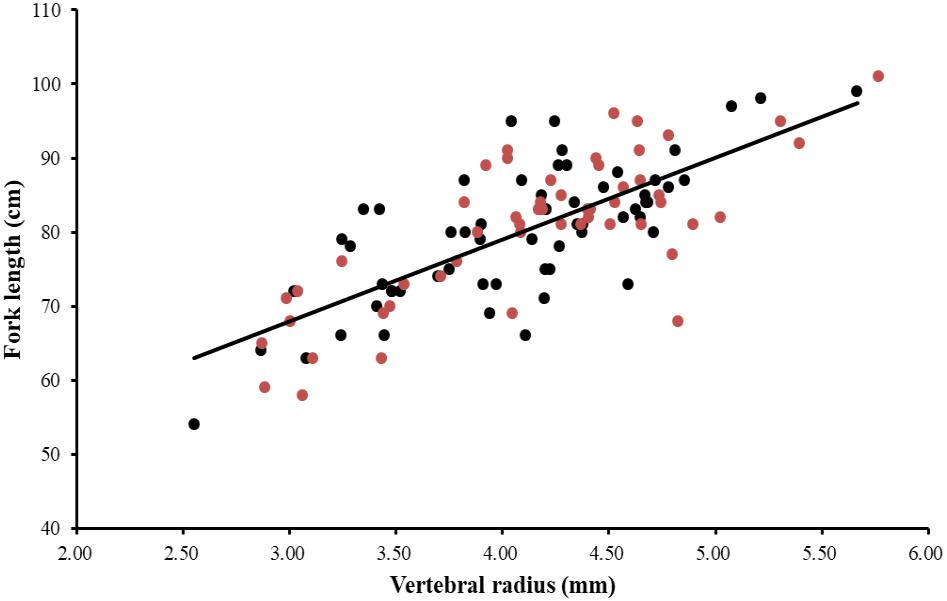
Figure 7. Relationship between the fork length (cm) and the centrum radius (mm) for the combined sexes of P. kamoharai specimens from the TEA Ocean (n = 114). Red dots represent observations of female specimens and black dots, male specimens while the solid line represents the linear regression equation FL = 11.12 R + 34.54, r2 = 0.55 for the combined sexes. FL = fork length and R = centrum radius.
Growth Modeling
The age and FL data of the 114 specimens (54 males and 60 females) were used to estimate the growth parameters by applying the four growth models previously defined. No significant differences were observed between sexes (maximum likelihood ratio, χ2 test = 115.31: P > 0.05) for all four growth functions applied to the observed length-at-age data for P. kamoharai (Table 3). The ΔAICc values for all four models are under 2 and have similar support, suggesting that all four models fit the observed length-at-age data for P. kamoharai in the TEA (Table 3 and Figure 8). The three parameters VBGF (3-VBGF) model is the most commonly used for shark species; in the present study, 3-VBGF had the smallest AICc value and had good support (Δ = 0, w = 33.4%) when compared to the other three growth functions. Besides, L8 estimated by the 3-VBGF was greater and closest to the known maximum size as compared to values reported by the other models, justifying the choice of this model in the present study. Furthermore, the L0 estimated with the 3-VBGF was closest to known values (L0 = 41.3 cm FL) besides the 2-VBGF where the L0 value was set. The observed mean length-at-age did not vary much between sexes. Analysis of modelled yearly growth increments G indicated similar growth between sexes. For both sexes, growth was greatest in the first three years after birth (Supplementary Table 1).
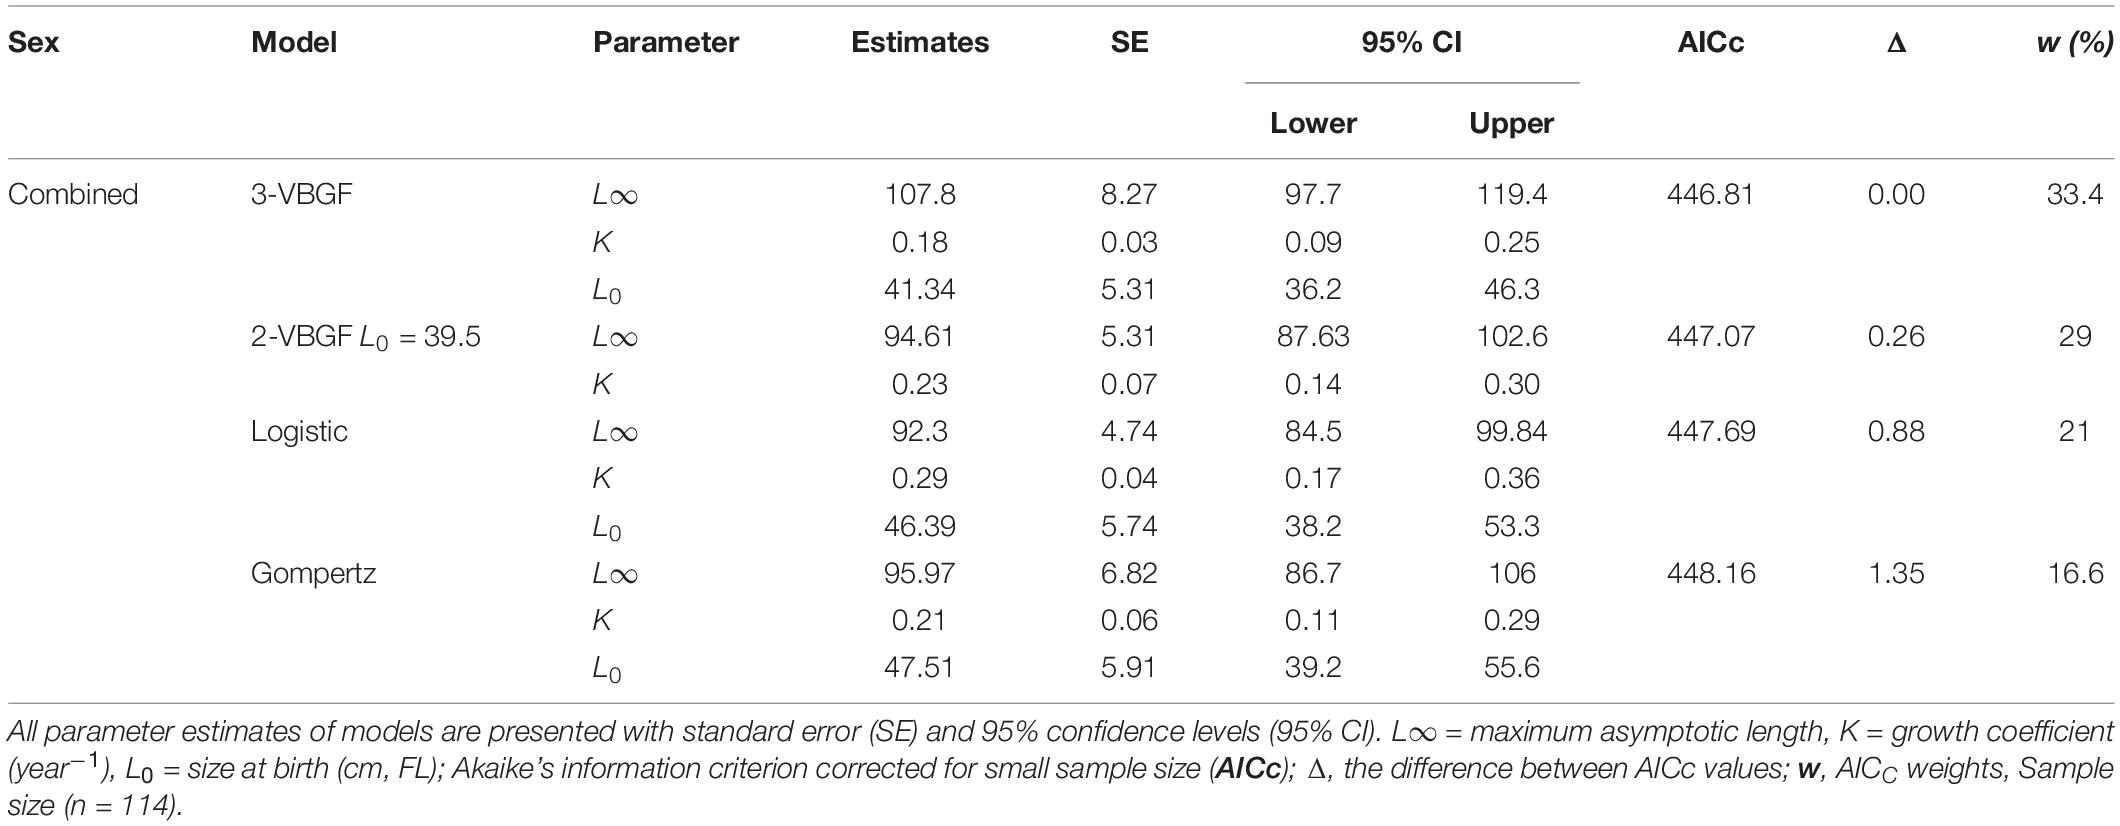
Table 3. Growth parameters estimated for P. kamoharai (combined sexes) in the TEA from four growth models fitted to length-at-age data.
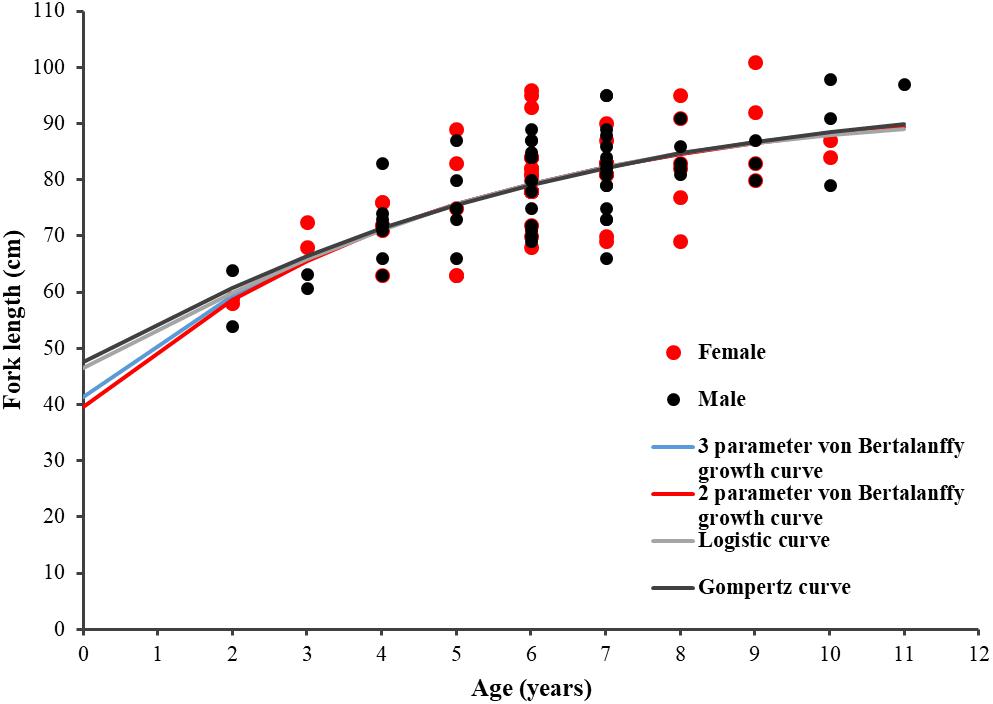
Figure 8. Length-at-age plot for P. kamoharai showing fittings of the four growth models for combined sexes. Red dots represent female specimens; Black dots represent male specimens. The blue line represents the fitting curve of the 3-parameter von Bertalanffy model; the red line represents the fitting curve of the 2-parameter von Bertalanffy model; the gray line represents the fitting curve of the logistic model, and the black line represents the fitting curve of the Gompertz model.
Observed Maximum Age and Theoretical Longevity
The estimated theoretical longevity of the P. kamoharai was greater than the observed maximum age. The longevity estimates, following the method of Fabens (1965), were 11.95 years for females, and 13.33 years for males.
Reproductive Analysis
The sex ratio of P. kamoharai specimens used for the study on reproductive characteristics was biased toward males (1F:1.91M). There was no significant difference in the width of the oviducal glands (t = 4.13, p = 0.68) and the uterus width (t = 4.03, p = 0.71) in both the left and right uteri. Most female specimens had widened uterus or oviducal glands at FL > 80 cm (Figure 9). Female specimens within the size range 50–68 cm were immature, and most females >86 cm were gravid. Apart from pregnant specimens that identified as mature, other female specimens with well-enlarged uteri widths and having countable oocytes were also deemed to be mature. A proportion of 97% of males was mature; having FL >72 cm had clasper lengths >9 cm, with sperm present in their sperm duct. No sperm was seen in the sperm ducts of immature specimens ranging between 58–70 cm FL; they had short claspers measuring <8 cm (Figure 10). Most males >77 cm had articulated claspers and were able to rotate anteriorly. The proportion of mature male and female specimens outnumbered immature specimens captured from December 2019 to May 2020 (Figures 9, 10).
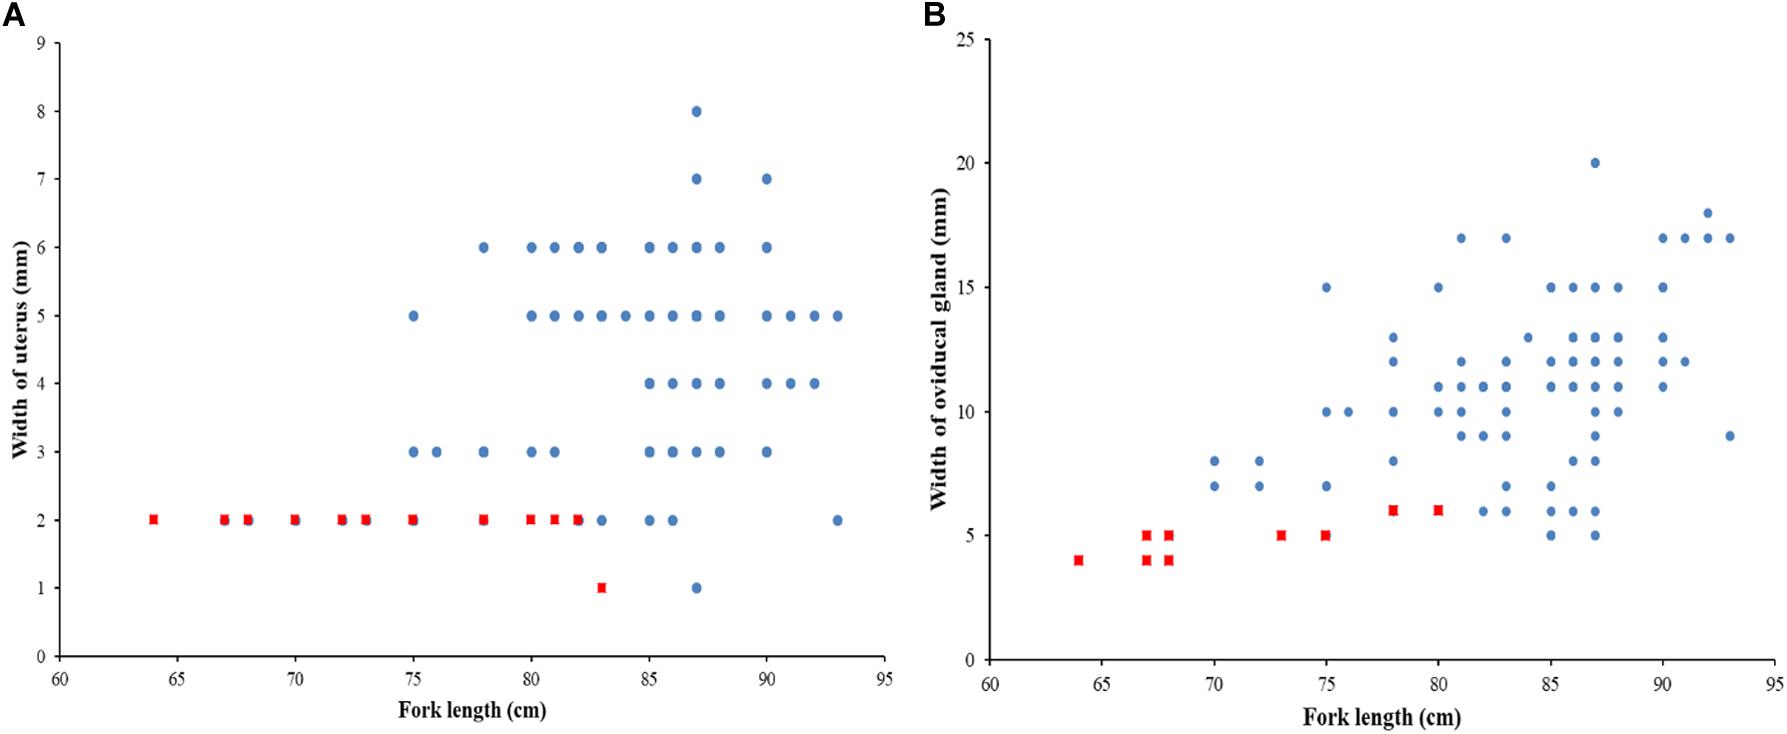
Figure 9. Relationship between fork length and, (a) width of the uterus; and (b) oviducal gland for P. kamoharai, from the Tropical Eastern Atlantic. Red dots represent immature specimens; Blue dots represent mature specimens.
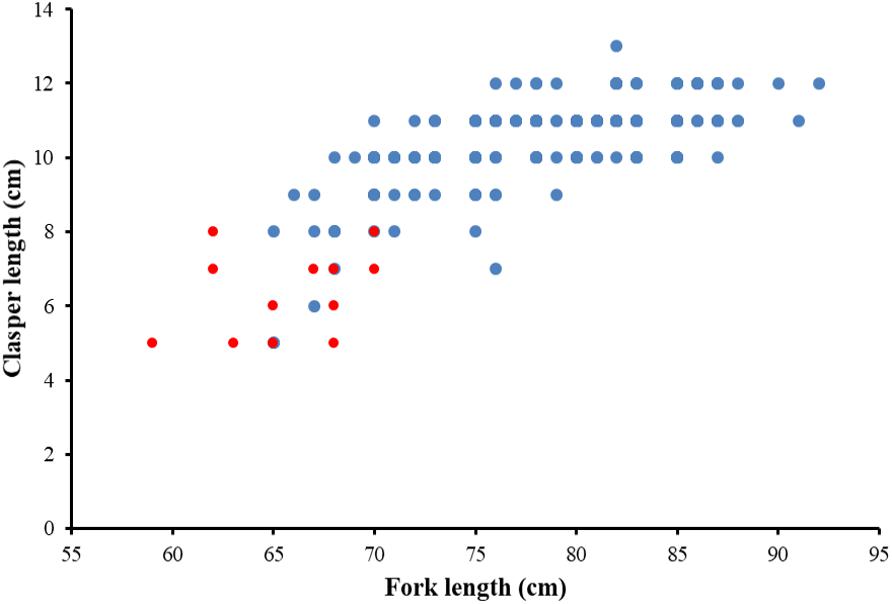
Figure 10. Relationship between clasper length and fork length for P. kamoharai, from the Tropical Eastern Atlantic. Red dots represent immature males while blue dots represent mature males.
The length-at-50% maturity (FL50) according to Wu et al. (2020) was 78.5 cm FL for males and 84.9 cm FL for females. Substituting these values in the best model fit according to the AICc result, that is, the three-parameter von Bertalanffy growth function (VBGF), age-at-50% maturity for males was 4.55 years and 5.91 years for females. Therefore, males of P. kamoharai attained maturity at earlier ages and smaller sizes than females.
Discussion
Sex Ratios and Size Distributions
As indicated by the differences in sex ratio, male P. kamoharai were more frequently captured than female specimens in the Eastern Atlantic. Wu et al. (2020) also reported male dominating catches in the same region corroborating our finding, meanwhile, in the south-western Atlantic, females dominated catches (Oliveira et al., 2010; Lessa et al., 2015). This change in sex ratio may simply imply that they segregate by size and sex in different regions or that the fishing gears have different selectivities since many smaller-sized species were observed in catches from the TEA than those reported in the south-western Atlantic (Oliveira et al., 2010; Lessa et al., 2015). The present study reported smaller specimens of sizes <66 cm FL, and the smallest specimen of P. kamoharai (46 cm FL) ever captured. In the tropical eastern Pacific Ocean, Dai et al. (2011) reported a dissimilar size range of P. kamoharai (66–102 cm FL), and also an unequal sex ratio in catches as presented in this study. They advised that this unevenness in catches might increase the risk of overexploitation of the species.
Age and Growth
Vertebrae are the most used structures to age sharks, though they are at times difficult to read on account of the poor contrast between opaque and translucent growth bands, especially for species such as the blue shark (Manning and Francis, 2005; Jolly et al., 2013; Andrade et al., 2019). Therefore, to enhance the readability of these growth patterns on elasmobranchs vertebrae, alternative methods such as staining and X-ray radiography are sometimes applied; image analysis and editing software are also used to enhance images and increase visual contrast between growth zones (Megalofonou et al., 2009; Ainsley et al., 2011; Jolly et al., 2013; Campana, 2014; Tribuzio et al., 2016; Matta et al., 2017; Andrade et al., 2019). In the current study, a comparison of age determination was made between unstained (longitudinal) and stained (whole centra) vertebral sections.
The X-ray radiography approach on whole and coronally sectioned centra for P. kamoharai failed to present clear growth bands in this study. Sectioned vertebral centra embedded in resin are the most widely used technique to age sharks (Matta et al., 2017; Andrade et al., 2019). Lessa et al. (2015) used sectioned vertebral centra on P. kamoharai specimens captured in the south-western Atlantic and obtained positive results, so its failure in the present study may be because of improper handling or processing of samples. Three staining approaches were also applied on whole centra to test which was the most suitable for aging this species. Among the three methods applied, Alizarin Red S staining which is a simple and efficient method yielded positive results. This approach requires lesser sample processing time, and because of the permeability of the stained vertebral centra, growth bands could easily be viewed under a microscope with either a reflected or transmitted white light. Therefore, Alizarin Red S staining as well as digital enhancing provided significant improvement to age reading by increasing the contrast of the growth band structure for P. kamoharai’s centra. Since vertebrae characteristics of small cartilaginous fishes are similar, we believe this method can provide some reference for the age identification of other small cartilaginous fishes.
The CV and the IAPE are widely used for precision analysis in aging studies. The CV and the IAPE obtained (6.87 and 5.31%, respectively) were lower than the maximum criteria of 7.6 and 5.5%, respectively, suggested between-reader age estimates (Campana, 2001). Lessa et al. (2015) estimated a smaller value (IAPE = 3.2%) for P. kamoharai in the south-western Atlantic. The precision analysis together with the age-bias plot presented in this study and previous age study on P. kamoharai supports the consistency of age estimations and their adequacy for the studied species. Furthermore, a good proportion of samples (n = 76) used for age determination had a perfect agreement between age estimates by readers.
Age validation was not done in the current study because of the lack of a year-round age data, so the implementation of validation techniques such as the mark-recapture was not feasible to validate the formation of year-round growth bands on the vertebral centra. However, the age study done on P. kamoharai by Lessa et al. (2015) verified an annual periodicity of growth band deposition for this species, which could apply to the age readings carried out in the present study. Lessa et al. (2015) proved that there is the presence of PB marks and BM in the vertebral centra of P. kamoharai specimens; this was adopted in our study. Again, Lessa et al. (2015) reported a maximum observed age for females at 13 and 8 years for males, meanwhile, our study presented a maximum observed age for males at 11 and 10 years for females. However, the implementation of a validation method in the future such as the mark-recapture technique would be important to clearly determine the longevity of this species since there exist differences in the observed ages of male and female sexes reported for different regions. The lack of specimens aged 1 and below may be related to the selectivity of the fishing gear used confirmed with the presence of few small-sized specimens. Therefore, it is of great importance to collect vertebral centra from embryos and immature P. kamoharai specimens for further age and growth analysis.
Comparison of Growth Models
Age and growth studies for most shark species have used the three-parameter VBGF (3-VBGF) to describe growth (Jolly et al., 2013; Drew et al., 2015; Lessa et al., 2015; Baje et al., 2018; Liu et al., 2018; Andrade et al., 2019). In this study, the 3-VBGF, as well as the other three models, presented good fit to the observed length-at-age data for P. kamoharai since their ΔAICc values were <2 showing all models had great support (Burnham and Anderson, 2002). Apart from having the lowest AICc and highest w values, the 3-VBGF was chosen because it provided values of L8 and L0 closest to known values, and its widely used in sharks’ studies. This result corroborates to the only age study on P. kamoharai by Lessa et al. (2015). No significant difference was observed between the age and FL of male and female P. kamoharai specimens; this corroborates with the report by Lessa et al. (2015). So, a single growth equation for sexes combined for this species’ was presented.
The combined sexes asymptotic lengths (L∞) estimated in this study (107.8 cm FL) slightly lesser than the report by Lessa et al. (2015) for combined-sex L∞ = (1.52 cm, FL). The estimated growth coefficient parameter k = 0.18/year was higher than k = 0.137/year presented by Lessa et al. (2015) for the same species in the south-western Atlantic Ocean. This difference may be a result of the small-sized specimens and amount of samples collected in our study as compared to the large number of specimens reported in Lessa et al. (2015). Also, growth models without small individuals or young ages are generally less accurate which may be another factor that influenced the changes in k. According to Branstetter (1987), the growth rate of species with a growth coefficient between 0.10 and 0.20 is considered moderate. Therefore, k = 0.18 means that P. kamoharai grows faster than other pelagic shark species with larger body sizes, such as the blue shark (k (males) = 0.13; k (female) = 0.12; Andrade et al., 2019), and the Shortfin Mako shark (k combined-sexes = 0.123; Liu et al., 2018). Our result suggests that the P. kamoharai in the TEA Ocean may have a faster growth rate than those in the south-western Atlantic Ocean. This may be due to the abundance in food availability and also due to differences in water temperature because temperature plays an important role in determining the growth rate of sharks (Simpfendorfer et al., 2002).
Maturity
Contrary to most teleosts that begin to mature at between 40 and 80% of their maximum length (Beverton and Holt, 1957), elasmobranchs mature at a much larger relative size of their maximum length (Holden, 1974), which increases the vulnerability of these species to overfishing (Murua et al., 2018). Moreover, Cortés (2000) reported that in many elasmobranchs, females tend to mature larger than male specimens. In the TEA region, the length-at-50% maturity (FL50) of P. kamoharai was 78.5 cm FL for males and 84.9 cm FL for females (Wu et al., 2020). This estimated FL50 were higher than the values 79.86 cm FL (females) and 69.79 cm FL (males) reported by Oliveira et al. (2010) from the south-western Atlantic Ocean. In this region, P. kamoharai specimens attained maturity a year later than those in the south-western Atlantic (3.1 years, males; 5.1 years, females; Lessa et al., 2015) corresponding to 4.55 years for males and 5.91 years for females. The difference in FL50 between males and females is a consequence of females maturing at larger lengths than males, but growing to a smaller asymptotic length. These differences in maturity estimate may reflect a sampling bias and regional differences in maturation.
In a study done by Cortés et al. (2010), the life-history patterns of >100 species were reviewed, and they reported that female sharks are generally larger than males, particularly in viviparous species such as the daggernose shark Isogomphodon oxyrhynchus, night shark Carcharhinus signatus, and the crocodile shark P. kamoharai (Lessa et al., 2000, 2015; Santana and Lessa, 2004). Pseudocarcharias kamoharai can be considered a medium-sized lifespan pelagic shark as compared to other elasmobranchs given their observed maximum age (13 years) as reported by Lessa et al. (2015) and theoretical longevity (13.33 years) as indicated in this study.
Conclusion
The experimental work done here shows that alizarin red S staining is a simple and effective method to identify the age and growth band-pairs of P. kamoharai. Hence, the age compositions, growth equations, and length and age-at-sexual maturity of P. kamoharai were successfully evaluated. The results showed that there was no significant difference in age composition between males and females P. kamoharai in this area of the Atlantic Ocean; and that this species grows faster than many other lamnoid species. The length-at-50% maturity for both sexes was attained at sizes greater than 83% (males) and 88.5% (females) of the maximum observed lengths and corresponding to 4.55 (males) and 5.91 years (females). This study fills in the blanks concerning the age, growth, and sexual maturity of P. kamoharai. The lack of a complete annual age data was missing to perform age validation for this species. However, future research may focus on collecting year-round age samples for all sizes to perform validation of the growth bands deposited in crocodile sharks of various ages using a mark-recapture approach.
Data Availability Statement
The raw data supporting the conclusions of this article will be made available upon request from the authors.
Ethics Statement
The animal study was reviewed and approved by Ministry of Education, Key Laboratory of Sustainable Exploitation of Oceanic Fisheries Resources, Shanghai, China.
Author Contributions
RK: conceptualization, software, writing – original draft, review, and editing. FW: formal analysis, investigation, and review. HW: conceptualization, methodology, investigation, and data curation. XD: validation, project administration, and supervision. ST: formal analysis, methodology, and funding acquisition. All authors contributed to the article and approved the submitted version.
Funding
This study was supported by the National Natural Science Foundation of China and the China National Fishery Observer Program.
Conflict of Interest
The authors declare that the research was conducted in the absence of any commercial or financial relationships that could be construed as a potential conflict of interest.
Acknowledgments
We are thankful for all China tuna longline observers for providing us samples used in various analyses. We are grateful to the editor and the two reviewers whose comments greatly reshaped this manuscript.
Supplementary Material
The Supplementary Material for this article can be found online at: https://www.frontiersin.org/articles/10.3389/fmars.2020.586024/full#supplementary-material
References
Ainsley, S. M., Ebert, D. A., and Cailliet, G. M. (2011). Age, growth, and maturity of the whitebrow skate. Bathyraja minispinosa, from the eastern Bering Sea. ICES J. Mar. Sci. 68, 1426–1434. doi: 10.1093/icesjms/fsr072
Akaike, H. (1973). A new look at the statistical model identification. IEEE Trans. Auto. Control 19, 716–723. doi: 10.1109/tac.1974.1100705
Andrade, I., Rosa, D., Munoz-Lechuga, R., and Coelho, R. (2019). Age and growth of the blue shark (Prionace glauca) in the Indian Ocean. Fish. Res. 211, 238–246. doi: 10.1016/j.fishres.2018.11.019
Baje, L., Smart, J. J., Chin, A., White, W. T., and Simpfendorfer, C. A. (2018). Age, growth and maturity of the Australian sharpnose shark Rhizoprionodon taylori from the Gulf of Papua. PLoS One 13:e0206581. doi: 10.1371/journal.pone.0206581
Beamish, R. J., and Fournier, D. A. (1981). A method for comparing the precision of a set of age determinations. Can. J. Fish. Aqua. Sci. 38, 982–983. doi: 10.1139/F81-132
Beverton, R. J. H., and Holt, S. J. (1957). On the dynamics of exploited fish populations. New York, NY: Springer Science & Business Media.
Branstetter, S. (1987). Age and Growth Validation of Newborn Sharks Held in Laboratory Aquaria, with Comments on the Life History of the Atlantic Sharpnose Shark, Rhizoprionodon terraenovae. Copeia 1987, 291–300. doi: 10.2307/1445764
Burnham, K. P., and Anderson, D. R. (2002). Avoiding pitfalls when using information-theoretic methods. J. Wildlife Manag. 66, 912–918. doi: 10.2307/3803155
Cailliet, G. M., Smith, W. D., Mollet, H. F., and Goldman, K. J. (2006). Age and growth studies of chondrichthyans fishes: the need for consistency in terminology, verification, validation, and growth function fitting. Environ. Biol. Fishes 77, 211–228. doi: 10.1007/978-1-4020-5570-6_2
Campana, S. E. (2001). Accuracy, precision, and quality control in age determination, including a review of the use and abuse of age validation methods. J. Fish Biol. 59, 197–242. doi: 10.1111/j.1095-8649.2001.tb00127.x
Campana, S. E. (2014). Age determination of elasmobranchs, with special reference to Mediterranean species: a technical manual. Rome: Food and Agriculture Organization of the United Nations.
Chang, W. Y. B. (1982). A statistical method for evaluating the reproducibility of age determination. Can. J. Fish. Aqua. Sci. 39, 1208–1210. doi: 10.1139/f82-158
Coelho, R., Fernandez-Carvalho, J., Lino, P. G., and Santos, M. N. (2012). An overview of the hooking mortality of elasmobranchs caught in a swordfish pelagic longline fishery in the Atlantic Ocean. Aqua. Living Res. 25, 311–319. doi: 10.1051/alr/2012030
Compagno, L. J. V. (2001). Sharks of the world: an annotated and illustrated catalogue of shark species known to date, Vol. 2. Bullhead, mackerel and carpet sharks (Heterodontiformes, Lamniformes and Orectolobiformes. FAO Spec. Cat. Fish. Purp. 1:269.
Cortés, E. (2000). Life history patterns and correlations in sharks. Rev. Fish. Sci. 8, 299–344. doi: 10.1080/10641260008951115
Cortés, E., Arocha, F., Beerkircher, L., Carvalho, F., Domingo, A., Heupel, M., et al. (2010). Ecological risk assessment of pelagic sharks caught in Atlantic pelagic longline fisheries. Aqua. Living Res. 23, 25–34. doi: 10.1051/alr/2009044
Dai, X. J., Zhu, J. F., Chen, X. J., Xu, L. X., and Chen, Y. (2011). Biological observations on thecrocodile shark Pseudocarcharias kamoharai. J. Fish Biol. 80, 1207–1212. doi: 10.1111/j.1095-8649.2011.03177.x
Dawson, A. B. (1926). A note on the staining of the skeleton of cleared specimens with Alizarin Red S[J]. Biotech. Histochem. 1, 123–124. doi: 10.3109/10520292609115636
Drew, M., White, W. T., Dharmadi, Harry, A. V., and Huveneers, C. (2015). Age, growth and maturity of the pelagic thresher Alopias pelagicus and the scalloped hammerhead Sphyrna lewini. J. Fish Biol. 86, 333–354.
Dulvy, N. K., Baum, J. K., Clarke, S., Compagno, L. J. V., Cortés, E., Domingo, A., et al. (2008). You can swim but you can’t hide: the global status and conservation of oceanic pelagic sharks and rays. Aqua. Conserv. Mar. Freshwater Ecosys. 18, 459–482. doi: 10.1002/aqc.975
Ebert, D. A., Fowler, S., and Compagno, L. (2013). Sharks of the World. Plymouth: Wild Nature Press.
Fabens, A. J. (1965). Properties and fitting of the von Bertalanffy growth curve. Growth 29, 265–289.
Fujita, K. (1981). Oviphagous embryos of the pseudocarchariid shark. Pseudocarcharias kamoharai, from the Central Pacific. Jap. J. Ichthyol. 28, 37–44.
Gao, C. X., Tian, S. Q., Dai, X. J., Wu, F., and Xu, Y. W. (2013). Preliminary analysis of the biology of the crocodile shark, Pseudocarcharias kamoharai in the tropical Eastern Atlantic Ocean. J. Shanghai Ocean Univ. 22, 1674–5566.
Geraghty, P. T., Macbeth, W. G., Harry, A. V., Bell, J. E., Yerman, M. N., and Williamson, J. E. (2014). Age and growth parameters for three heavily exploited shark species off temperate eastern Australia. ICES J. Mar. Sci. 71, 559–573. doi: 10.1093/icesjms/fst164
Goldman, K. J., Cailliet, G. M., Andrews, A. H., and Natanson, L. J. (2012). “Assessing the Age and Growth of Chondrichthyan Fishes.” Biology of Sharks and Their Relatives, eds J. C. Carrier, J. A. Musick, and M. R. Heithaus (New York: CRC Press).
Haddon, M. (2011). Modeling and quantitative measures in fisheries, 2nd Edn. London: Chapman & Hall.
Hoenig, J. M., and Brown, C. A. (1988). A Simple Technique for Staining Growth Bands in Elasmobranch Vertebrae. Bull. Mar. Sci. 42, 334–337.
Holden, M. J. (1974). “Problems in the rational exploitation of elasmobranch populations and some suggested solutions.” In Sea fisheries research, ed. F. R. Harden-Jones (New York, NY: John Wiley and Sons)
International Commission for the Conservation of Atlantic Tunas (ICCAT) (2019). Report for the biennial period, 2018-19 PART I (2018) - Vol. 2 English version SCRS. Spain: ICCAT.
Jolly, K. A., da Silva, C., and Attwood, C. G. (2013). Age, growth and reproductive biology of the blue shark Prionace glauca in South African waters. Afr. J. Mar. Sci. 35, 99–109. doi: 10.2989/1814232x.2013.783233
Joung, S. J., Chen, J. H., Chin, C. P., and Liu, K. M. (2015). Age and growth of the dusky shark. Carcharhinus obscurus, in the Northwest Pacific Ocean. Terres. Atmospher. Oceanic Sci. 26, 153–160. doi: 10.3319/TAO.2014.10.15.01(OC)
Joung, S. J., Lyu, G. T., Hsu, H. H., Liu, K. M., and Wang, S. B. (2018). Age and growth estimates of the blue shark Prionace glauca in the central South Pacific Ocean. Mar. Freshwater Res. 69, 1346–1354. doi: 10.1071/mf17098
Katsanevakis, S., and Maravelias, C. D. (2008). Modelling fish growth:multi-model inference as a better alternative to a priori using the von Bertalanffy equation. Fish Fish. 9, 178–187. doi: 10.1111/j.1467-2979.2008.00279.x
Kimura, D. K. (1980). Likelihood methods for the von Bertalanffy growth curve. Fish. Bull. U S A. 77, 765–773.
Kyne, P. M., Romanov, E., Barreto, R., Carlson, J., Fernando, D., Fordham, S., et al. (2019). Pseudocarcharias kamoharai. The IUCN Red List of Threatened Species 2019: e.T39337A2900108. Available online at: https://dx.doi.org/10.2305/IUCN.UK.20191 [accessed on 06 July 2020).
Last, P. R., and Stevens, J. D. (2009). Sharks and Rays of Australia. Second Edition. Collingwood: CSIRO Publishing.
Lessa, R., Andrade, H. A., De Lima, K. L., and Santana, F. M. (2015). Age and growth of the midwater crocodile shark Pseudocarcharias kamoharai. J. Fish Biol. 89:371–385. doi: 10.1111/jfb.12717
Lessa, R., Santana, F. M., Batista, V., and Almeida, Z. (2000). Age and growth of the daggernose shark Isogomphodon oxyrhynchus from northern Brazil. Mar. Freshwater Res. 51, 339–347. doi: 10.1071/mf99125
Liu, K. M., Sibagariang, R. D., Joung, S. J., and Wang, S. B. (2018). Age and Growth of the Shortfin Mako Shark in the Southern Indian Ocean. Mar. Coastal Fish. 10, 577–589. doi: 10.1002/mcf2.10054
Manning, M. J., and Francis, M. P. (2005). Age and growth of the blue shark (Prionace glauca) from the New Zealand Economic Exclusive Zone. New Zealand Fisheries Assessment Report 2005/26. Wellington: Ministry of Fisheries.
Martínez-Ortiz, J., Aires-da-Silva, A. M., Lennert-Cody, C. E., and Maunder, M. N. (2015). The Ecuadorian artisanal fishery for large pelagics: species composition and Spatio-temporal dynamics. PLoS One 10:e0135136. doi: 10.1371/journal.pone.0135136
Matta, E. M., Tribuzio, C. A., Ebert, D. A., Goldman, K. J., and Gburski, C. M. (2017). “Age and Growth of Elasmobranchs and Applications to Fisheries Management and Conservation in the Northeast Pacific Ocean,” in Advances in Marine Biology, Vol. 77, eds E. Shawn, Larson, and Dayv Lowry (Oxford: Academic Press), 179–220. doi: 10.1016/bs.amb.2017.06.002
Megalofonou, P., Damalas, D., and De Metrio, G. (2009). Biological characteristics of blue shark. Prionace glauca, in the Mediterranean Sea. J. Mar. Biol. Assoc. U K. 89, 1233–1242. doi: 10.1017/s0025315409000216
Murua, H., Santiago, J., Coelho, R., Zudaire, I., Neves, C., Rosa, D., et al. (2018). Updated Ecological Risk Assessment (ERA) for shark species caught in fisheries managed by the Indian Ocean Tuna Commission (IOTC). IOTC-2018-SC21-14_Rev1. Victoria: Indian Ocean Tuna Commission.
Oliveira, P., Hazin, F. H. V., Carvalho, F., Rego, M., Coelho, R., Piercy, A., et al. (2010). Reproductive biology of the crocodile shark. Pseudocarcharias kamoharai. J. Fish Biol. 76, 1655–1670. doi: 10.1111/j.1095-8649.2010.02606.x
R Core Team (2019). R: A language and environment for statistical computing. R Foundation for Statistical Computing. Vienna: R Core Team.
Ricker, W. E. (1979). Growth rates and models. Fish Physiol. 8, 677–743. doi: 10.1016/S1546-5098(08)60034-5
Romanov, E. V., Ward, P., Levesque, J. C., and Lawrence, E. (2008). Preliminary analysis of crocodile shark (Pseudocarcharias kamoharai) distribution and abundance trends in pelagic longline fisheries. IOTC Working Party on Environment and Bycatch (WPEB). Bangkok: WPEB.
Santana, F. M., and Lessa, R. (2004). Age determination and growth of the night shark (Carcharhinus signatus) off the northeastern Brazilian coast. Fish. Bull. 102, 156–167.
Schindelin, J., Rueden, C. T., Hiner, M. C., and Eliceiri, K. W. (2015). The ImageJ ecosystem: an open platform for biomedical image analysis. Mole. Reprod. Dev. 82, 518–529. doi: 10.1002/mrd.22489
Simpfendorfer, C. A., McAuley, R. B., Chidlow, J., and Unsworth, P. (2002). Validated age and growth of the dusky shark. Carcharhinus obscurus, from western Australian waters. Mar. Freshwater Res. 53, 567–573. doi: 10.1071/MF01131
Stevens, J. D. (1975). Vertebral rings as a means of age determination in the Blue Shark (Prionace glauca L.). J. Mar. Biol. Assoc. U K. 55, 657–665. doi: 10.1017/s0025315400017318
Thorson, J. T., and Simpfendorfer, C. A. (2009). Gear selectivity and sample size effects on growth curve selection in shark age and growth studies. Fish. Res. 98, 75–84. doi: 10.1016/j.fishres.2009.03.016
Tribuzio, C. A., Matta, M. E., Gburski, C. M., Atkins, N., and Bubley, W. J. (2016). Methods for the preparation of Spiny Dogfish (Squalus suckleyi) fin spines and vertebrae and an overview of age determinations. Mar. Fish. Rev. 78, 1–13.
von Bertalanffy, L. (1960). Principles and theory of growth, Fundamental Aspects of Normal and Malignant Growth. New York, NY: Elsevier Publishing Company, 137–259.
White, W. T. (2007). Biological observations on lamnoid sharks (Lamniformes) caught by fisheries in Eastern Indonesia. J. Mar. Biol. Assoc. U K. 87, 781–788. doi: 10.1017/s0025315407056391
Wu, F., Kindong, R., Dai, X. J., Sarr, O., Zhu, J. F., Tian, S. Q., et al. (2020). Aspects of the reproductive biology of the Blue and Crocodile sharks in the Tropical Eastern Atlantic Ocean. J. Fish Biol. 2020:jfb.14526. doi: 10.1111/jfb.14526
Keywords: asymptotic growth models, Pseudocarcharidae, reproductive biology, fishery management and conservation, vertebral aging
Citation: Kindong R, Wang H, Wu F, Dai X and Tian S (2020) Age, Growth, and Sexual Maturity of the Crocodile Shark, Pseudocarcharias kamoharai, From the Eastern Atlantic Ocean. Front. Mar. Sci. 7:586024. doi: 10.3389/fmars.2020.586024
Received: 23 July 2020; Accepted: 22 September 2020;
Published: 17 November 2020.
Edited by:
Mark Meekan, Australian Institute of Marine Science (AIMS), AustraliaReviewed by:
Kelsey James, Southwest Fisheries Science Center (NOAA), United StatesFabio Hissa Vieira Hazin, Federal Rural University of Pernambuco, Brazil
Copyright © 2020 Kindong, Wang, Wu, Dai and Tian. This is an open-access article distributed under the terms of the Creative Commons Attribution License (CC BY). The use, distribution or reproduction in other forums is permitted, provided the original author(s) and the copyright owner(s) are credited and that the original publication in this journal is cited, in accordance with accepted academic practice. No use, distribution or reproduction is permitted which does not comply with these terms.
*Correspondence: Xiaojie Dai, xjdai@shou.edu.cn; Siquan Tian, sqtian@shou.edu.cn
†These authors have contributed equally to this work