Marine Heatwave of Sea Surface Temperature of the Oyashio Region in Summer in 2010–2016
 Toru Miyama
 Shoshiro Minobe
 Hanako Goto
- 1Application Laboratory, Japan Agency for Marine-Earth Science and Technology, Yokohama, Japan
- 2Department of Earth and Planetary Sciences, Faculty of Science, Hokkaido University, Sapporo, Japan
- 3Department of Natural History Sciences, Graduate School of Science, Hokkaido University, Sapporo, Japan
The sea surface temperature (SST) of the Oyashio region in boreal summer abruptly increased in 2010 and high summertime SST repeated every year until 2016. Observations and an ocean reanalysis show that this marine heatwave occurred not only at the surface but also at deeper depths down to 200 m. Furthermore, salinity in summer also increased in parallel with the temperature. The rises in temperature and salinity indicate the strengthening of the Kuroshio water influence. The sea surface height and velocity show that the southward intrusion of the Oyashio near the coast in summer weakened from 2010 accompanied by an increase in anticyclonic eddies from the Kuroshio Extension. The much more frequent existence of anticyclonic eddies to the east of the first intrusion of the Oyashio in summer is closely associated with the weakening of the first intrusion and the strengthening of the second intrusion. It is suggested that the rise in the water temperature could increase a catch of yellowtail (Seriola quinqueradiata) in northern Japan.
Introduction
Marine heatwave is an event of anomalous warm sea surface temperatures (SST) from several days to years (Hobday et al., 2016). Recently, marine heatwaves have attracted considerable scientific and public interests. Marine heatwaves, combined with the global warming, can have substantial impacts on marine ecosystems. The frequency of marine heatwaves has significantly increased over the past century, with a 54% increase in annual marine heatwave days globally from 1925 to 2016 (Oliver et al., 2018). Marine heatwaves can also be a harbinger of near-future ocean conditions in a warmer world.
A prime example of marine heatwaves is “the blob,” which occurred in 2014–2016 in the Northeastern Pacific Ocean (Bond et al., 2015; Lorenzo and Mantua, 2016; Hu et al., 2017), and is characterized by anomalous SST at more than 3°C than normal, exceeding four standard deviations. The blob caused substantial damage to marine ecosystems, including anomalously low near-surface chlorophyll biomass (Whitney, 2015) and massive deaths of sea lions, whales, and seabirds (Welch, 2016). On the other hand, animals favoring warm water temperatures, such as warm-water thresher sharks and ocean sunfish, appeared as far north as the Alaska coast (Welch, 2016).
In the North Pacific Ocean, marine heatwaves in recent years were not limited to the eastern side of the basin, but have also occurred in the western side of the basin with significant impacts on the marine ecosystem there. For example, it has often been reported by mass media and official fisheries statistics in Japan that warm water fishes such as Japanese amberjack or yellowtail (Seriola quinqueradiata) are more frequently caught in the coastal region in northern Japan in the 2010s than before (Makino and Sakurai, 2012). Conversely, cold fishes such as saury (Cololabis saira) decreased drastically after 2010 (Kuroda and Yokouchi, 2017).
Consistently, in the early and middle 2010s, warm SST anomalies prevailed in the North Pacific off the island of Hokkaido in Japan (Figure 1A; in and around the black box). Interestingly, as shown later, this western North Pacific marine heatwave was often limited only in summer. Furthermore, SST anomaly off Hokkaido in summer over the western North Pacific was stable during 2010–2016 in contrast to the relatively high variability before that, indicating a new normal of warm SST (Figure 1B explained in section Results).
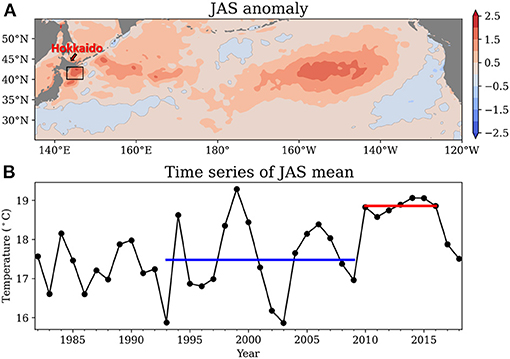
Figure 1. (A) Anomaly of the 2010–2016 mean SST in July–September to the 1993–2009 mean (color; °C). (B) Time series from 1982 to 2018 of the July–September mean SST (°C) averaged over the box (143–147°E 40–43°N) enclosed in black lines in (A). The blue line shows the 1993–2009 mean; the red line shows the 2010–2016 mean. OISST version 2 (see section Data) was used for these figures.
Recent conditions in the western North Pacific Ocean were studied by a few papers. Kuroda et al. (2015) studied the observational data from 1993 to 2011 and reported the increasing trend of sea-surface height in the region of strong SST anomalies near the coast of Hokkaido, and they suggested that this trend is related to the Oyashio path change from a nearshore path to an offshore path, which was caused by the wind-stress changes over the North Pacific Ocean. By analyzing August and September data, i.e., the season of warm SST anomalies, from 1993 to 2014, Kuroda and Yokouchi (2017) found that positive SST trend off Hokkaido is related to more frequent anticyclonic eddies. Especially for the period 2010–2014, they suggested that the same eddy occupied the region in 3 of 5 years in association with retreated Oyashio intrusion compared with the period 1993–1997. These studies mainly focused on the variability near the surface. The analysis of subsurface water properties by Kuroda et al. (2015) was limited to a single repeat observation line for annual mean.
Qiu et al. (2017) conducted an analysis of SST and head budget analysis of the upper 250 m depth in the western Oyashio Extension region (36–43°N, 141–150°E) and found that eddy advection was important in decadal variability in this region. They did not show the difference with seasons in the decadal variability.
Although these studies give us important information on recent changes and their possible mechanisms in the western North Pacific, previous studies have focused on linear trend or decadal variability. In this study, we paid attention to the apparent change from 2010 in Figure 1. We also studied the difference of the summer season from the other seasons, which was not discussed in the previous studies. The purpose of this paper is, therefore, to investigate the anomalous oceanic conditions in summer from 2010 compared with other seasons. In particular, we analyzed the three-dimensional subsurface temperature and salinity field by utilizing an eddy-resolving assimilation dataset of the FRA-JCOPE2 reanalysis (Miyazawa et al., 2009). The reanalysis of FRA-JCOPE2 allows us to understand the three-dimensional structure of the marine heatwave in the 2010s in the western North Pacific Ocean.
This paper is organized as follows. Data used in this study are described in section Data. The results are shown in section Results. The results are summarized and discussed in section Summary and Discussion.
Data
In this study, we analyzed temperature, salinity, air-sea heat flux, sea surface height (SSH), and velocity data.
For SST, Optimal Interpolation SST (OISST) version 2 (Reynolds et al., 2007) was used. This SST dataset is a satellite observation based on measurements by the Advanced Very High-Resolution Radiometer (AVHRR). The horizontal grid size is 0.25°.
For air-sea heat flux, the ERA5 reanalysis (Copernicus Climate Change Service, 2017) with a 0.25° horizontal grid size was used. The net downward heat flux was calculated as a sum of surface net solar radiation, net thermal radiation, surface latent heat flux, and surface sensible heat flux.
For SSH, Global Ocean Gridded Level 4 Sea Surface Heights of Copernicus Marine Environment Monitoring Service (CMEMS; http://marine.copernicus.eu/) was used. The data is based on the observation of multi-mission satellite altimeters. The horizontal grid size is 0.25°.
The SSH dataset was also used to describe eddies through the eddy-tracking product of AVISO+ (https://www.aviso.altimetry.fr/en/data/products/value-added-products/global-mesoscale-eddy-trajectory-product.html). The daily paths and locations of cyclonic and anticyclonic eddies from 1993 to 2016 were used.
Temperature, salinity, and velocity from the FRA-JCOPE2 reanalysis (Miyazawa et al., 2009) were also used. This reanalysis dataset is the product assimilating satellite data and in-situ water temperature and salinity data into an ocean circulation model. The horizontal grid size is 1/12° × 1/12°. The data from 1993 to 2018 was used.
In this study, we used data from July, August, and September (JAS) for averages for summer. Similarly, we used data from January to March (JFM), April to June (AMJ), and October to November (OND) for averages for winter, spring, and fall, respectively. For the heat flux in summer, the average from June to August was used, assuming that the change in the air-sea heat flux occurs 1 month earlier than the response of the ocean.
Data from 1993 to 2018 were analyzed, unless stated otherwise. The analysis period was decided because the observed SSH product and the FRA-JCOPE2 reanalysis are only available from 1993, though some data (for example, SST) before 1993 are available. We defined anomalies as deviations from the 1993–2009 climatologies.
Results
Observed Sea Surface Temperature
Figure 2 shows the SST anomaly of the 2010–2016 mean from the 1993–2009 mean in each season. The anomaly in Figure 2C of JAS is the same as that of Figure 1A but magnified to show the detailed structure of the anomaly near Japan. The warming in the 2010s has a distinct seasonality. The temperature increase was particularly large in summer to the southeast off Hokkaido within the black box (143–147°E, 40–43°N). By contrast, SST decreased in most of the same region in winter.
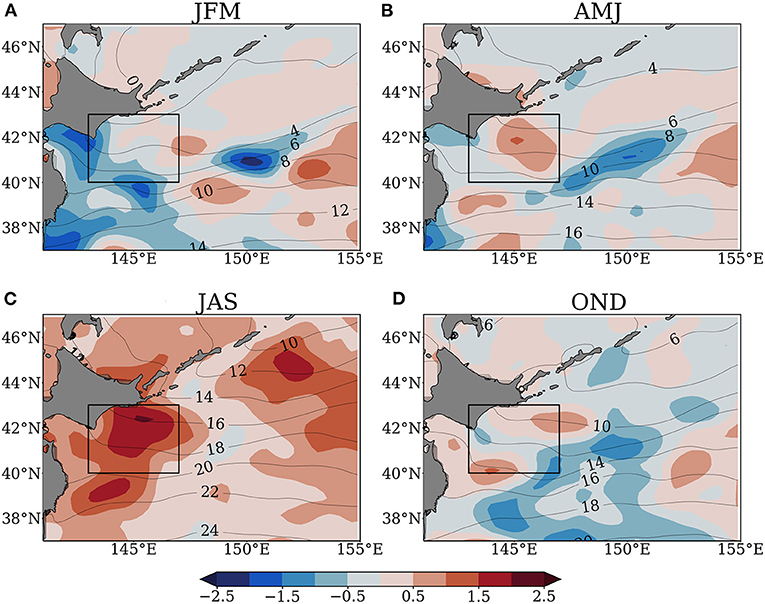
Figure 2. Anomaly of the 2010–2016 mean SST in each season from the 1993–2009 mean (color; °C), and the 2010–2016 mean SST (contour; °C). (A) In JFM. (B) In AMJ. (C) In JAS. (D) In OND.
The summertime SST abruptly increased in 2010 and the marine heatwave repeated until 2016. Figure 1B shows that the time series of the SST in JAS averaged over the aforementioned box southeast off Hokkaido in Figure 1 (the same box in Figure 2). The SSTs from 2010 to 2016 were continuously higher by more than 1°C than its climatology, 17.5°C, defined for the period between 1993 and 2009 (the blue line) and the SST average between 2010 and 2016 is 18.9°C. The difference between the averages of 1993–2009 and 2010–2016 was statistically significant with Welch's t-test (p = 3.2 × 10⁻⁵ < 0.01) with an assumption of year each being independent. From 2017 to 2018, the SST anomaly returned to the values close to the 1993–2009 climatology.
Although this study used values from 1993 to 2009 as the climatology according to the availability of the other data, the OISST data are available form 1982 (Figure 1B). The average between 1982 and 2009 (17.4°C) was similar to the one between 1993 and 2009. Although there were a few years when the temperature was warmer than the climatology by more than 1°C between 1982 and 2009, consecutive warming like in 2010–2016 did not occur in the past.
Figure 3 shows the anomaly of SST for each year (2010–2016) from the 1993–2009 average. Warming occurred at a similar location southeast off Hokkaido in each year. The SST anomaly in 2012 was located slightly westward of those in the other years and how this feature is associated with other variables will be described later.
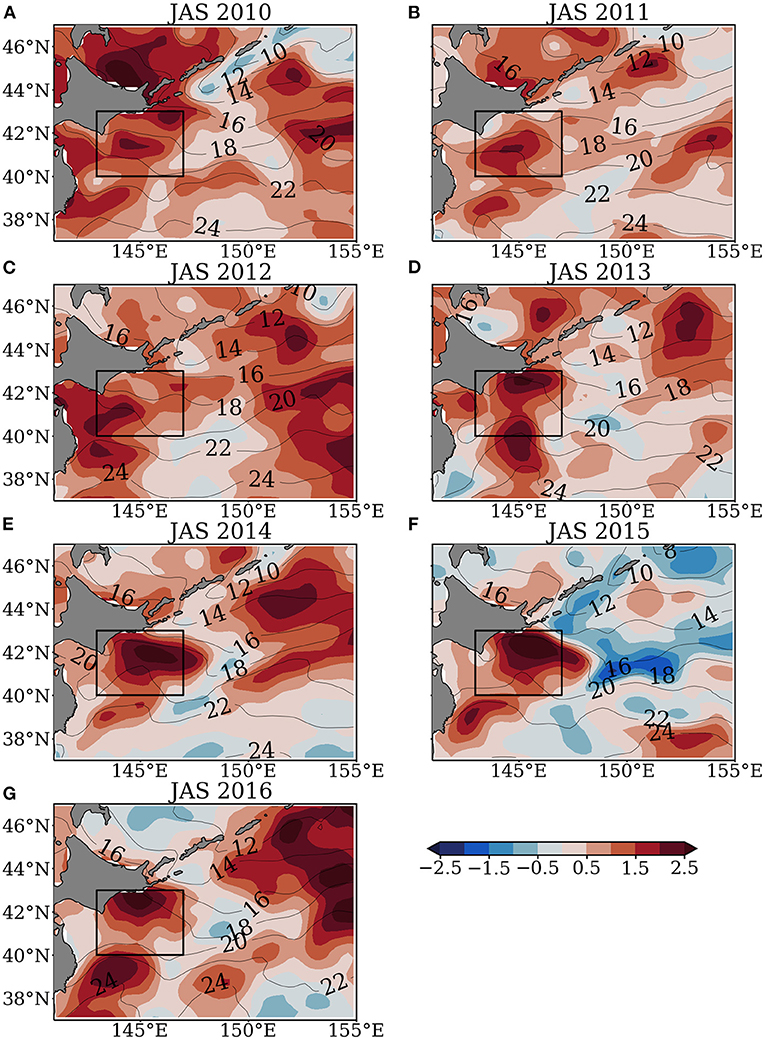
Figure 3. Anomaly of the JAS-mean each year (2010–2016) from the 1993–2009 mean (color; °C) and SST in JAS each year (contour; °C).
Hobday et al. (2016) proposed a definition of marine heatwave as the event where temperature exceed an upper locally determined threshold (90th percentile relative to the local long-term climatology) for at least a five-day period, with no more than two below-threshold days. From daily time series for SST averaged over the box (143–147°E 40–43°N), Figure 4 shows marine heatwave events in JAS season from 2010 to 2016 using the definition of Hobday et al. (2016). For climatology, 30-year baseline period of 1983–2012 was used as in Hobday et al. (2016). The red filled areas in Figure 4 indicate the periods of the identified marine heatwaves. In JAS season of all years from 2010 to 2016, marine heatwave events occurred, corresponding to the anomalous SST warming in this region.
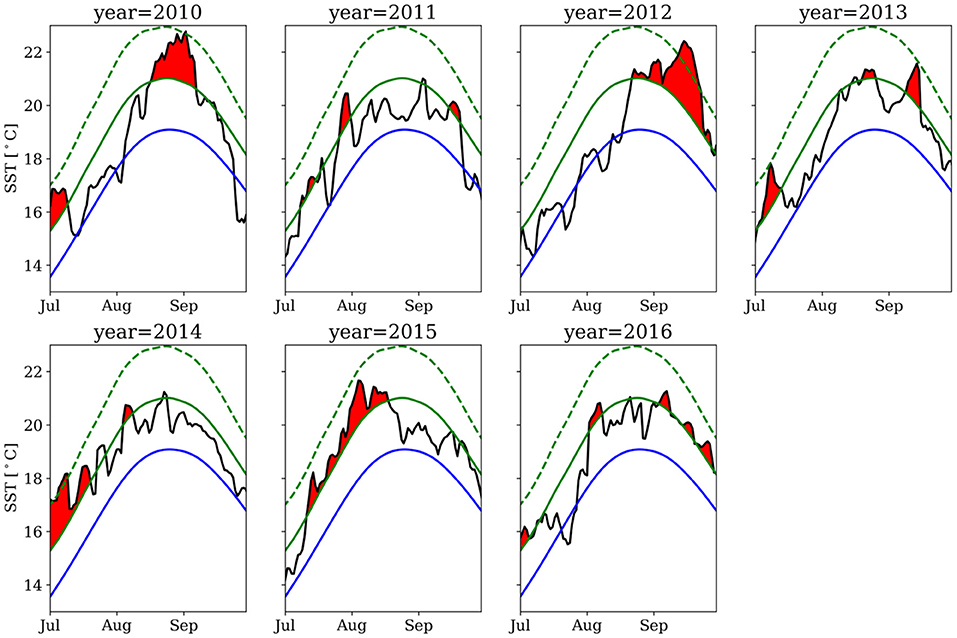
Figure 4. The climatology (blue line), 90th percentile marine heatwave threshold (green solid line), and time series (black line) for SST (°C) averaged over the box (143–147°E 40–43°N). The red filled area indicates the period associated with the identified marine heatwaves. The green line is the twice of the 90th percentile difference from the mean climatology value for the defining Categories II events. Each panel shows time series in JAS of each year from 2010 to 2016.
Hobday et al. (2018) further proposed a categorization scheme for marine heatwaves. Multiples of the 90th percentile difference (2× twice, 3× three times, etc.) from the mean climatology value define each of the categories I–IV, with corresponding descriptors from moderate to extreme. According to this category, some events in 2010, 2012, 2014 were Category II (“Strong”) events, where the maximum temperatures exceeded the 2× difference line (green dashed line).
Heat Flux
One possible cause of the SST increase is an increase in downward net air-sea heat flux. The difference in the net downward air-sea heat flux between the 2010–2016 average and the 1993–2009 average in summer (JJA) is calculated from ERA5 and is shown in Figure 5.
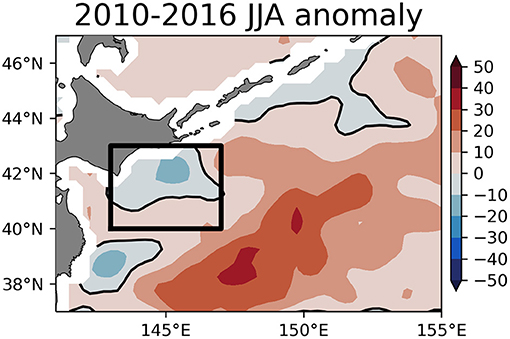
Figure 5. Anomaly of the 2010–2016 average downward net heat flux (color and contour; W m−2) in JJA to the 1993–2009 average in JJA calculated from the ERA5 reanalysis. The box enclosed by the black lines is the same as the previous figures.
Inside the box for southeast off Hokkaido, the anomalous heat flux is upward over the peak of the SST anomaly (Figure 2C). Therefore, the air-sea flux could not cause the SST increase. Rather, a comparison between Figures 2A, 5 suggests that the increase in SST induced the anomalous upward net-heat flux. A similar spatial pattern of the heat flux change was obtained using the averages in JAS or using the JRA55 reanalysis (Kobayashi et al., 2015) (not shown).
Observed Sea Surface Height and Geostrophic Velocity
Because the surface heat flux cannot explain the marine heat wave in 2010–2016, the ocean current is examined as the possible cause of the heat wave in this subsection.
Figure 6 shows (A) the 1993–2009 average, (B) 2010–2016 average, and (C) the difference between the latter and former of SSH and the corresponding geostrophic velocity in JAS.
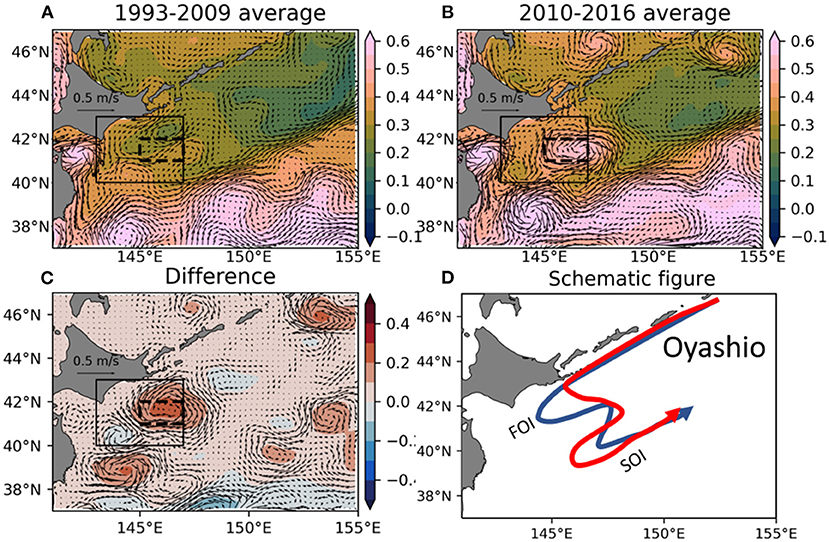
Figure 6. The absolute dynamic heights (color; m) and the corresponding geostrophic velocities (vectors; m s−1) estimated by the altimeters. (A) The 1993–2009 average. (B) The 2010–2016 average, (C) the difference between (B) and (A). (D) Schematic figure of the Oyashio Current in 1999–2009 (blue line) and in 2010–2016 (red line). The first and second crests of the meandering Oyashio Current from the west to the east are the First Oyashio Intrusion (FOI) and Second Oyashio Intrusion (SOI), respectively.
The 1993–2009 average velocity (Figure 6A) shows a typical pattern of the Oyashio, which is schematically shown by the blue arrow in Figure 6D. The first and second southward crests of the meandering Oyashio from the west to the east are called the First Oyashio Intrusion (FOI) and the Second Oyashio Intrusion (SOI), respectively (Kawai, 1972). In contrast, the 2010–2016 average (Figure 6B) shows that the FOI was significantly weaker than that of 1993–2009. Instead, the SOI in 2010–2016 was stronger than that in 1993–2009. The Oyashio's current pattern in this period is shown by the red arrow in Figure 6D. Because the area of the SST warming from 2010 discussed in section Observed Sea Surface Temperature corresponds to the FOI area, the weakening of FOI was responsible for the warming from 2010.
The difference between the 1993–2009 and 2010–2016 averages (Figure 6C) shows that the anticyclonic eddy-like circulation anomaly between the FOI and the SOI. This anticyclonic eddy-like circulation is clearly visible in 2010–2016 average (Figure 6B) but not so in 1993–2009 average (Figure 6A). The enhancement of the anticyclone circulation for the period 2010–2016 is closely related to the weakened FOI.
Kuroda et al. (2015) also found that the Oyashio path shifted from the nearshore (FOI) to offshore (SOI). However, they focused their attention on a trend during 1993–2011, not the change from 2010 discussed in this paper.
Meanwhile, there were little differences in the SSH and geostrophic current in the surrounding subpolar gyre and its western boundary current in Figure 6C (for example, the region between 44–46°N). This suggests that the local intensification of the anticyclonic eddy rather than the weakening of the whole subpolar gyre caused the weakening of FOI.
Increase in Anticyclonic Eddies
It is interesting to know how the intensification of the anticyclonic eddy-like circulation between the FOI and the SOI shown in Figure 6 is associated with individual eddies. The region between FOI and SOI is known as the place where eddies from the Kuroshio Extension move northward (Itoh and Yasuda, 2010). Thus, the intensification of the anticyclonic eddy-like circulation may be resulted from the more frequent anticyclonic eddies from the south rather than an intensification of the same eddy at the same place. To examine this idea, the eddy-tracking product of AVISO was analyzed.
Figure 7A shows the time series of the total cumulative days for which anticyclonic eddy centers are contained in the box enclosed by the dashed line between FOI and SOI in Figure 6B in summer (JAS) each year. The area shown by the dashed line box is henceforth referred to as east of the FOI. Anticyclonic eddies indeed became more frequent from 2010. While anticyclonic eddies existed for 11 days each year on average during 1993–2009, the number increase five times to 56 days during 2010–2016. The difference was statistically significant (p = 3.2 × 10⁻³ < 0.01 with Welch's t-test).
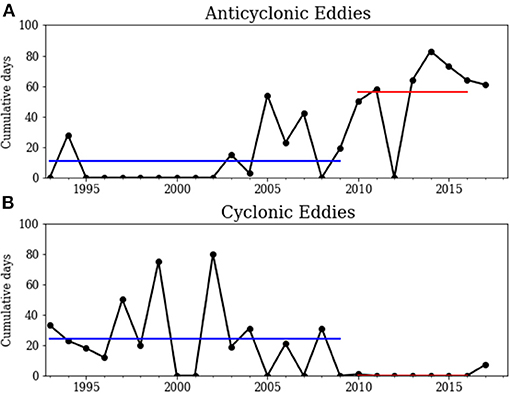
Figure 7. Time series of the total number of days for which eddies remained within the dashed box in Figures 6A–C in summer (JAS) each year. For example, if one eddy remained within the box for 30 days and another eddy remained in the box for 20 days during JAS a certain year, the total cumulative days in the year is 50. (A) For anticyclonic eddies. (B) For cyclonic eddies.
On the other hand, cyclonic eddies decreased in the east of the FOI (Figure 7B). While cyclonic eddies existed for 24 days each year on average during 1993–2009, they are almost absent (0 days) during 2010–2016. The difference was again statistically significant (p = 9.4 × 10⁻⁴ < 0.01).
During the period 2010–2016, anticyclonic eddies did not exist east of the FOI in 2012. This is because the anticyclonic eddies in summer 2012 remained slightly westward or slightly southwestward. When the cumulative days were counted in the box 144–145°E 40.5–41.5°N, the number was 91 days in 2012, comparable to the number in the other years during 2010–2016. Because of the westward location of the anticyclonic eddies in 2012, the SST anomaly was located westward (Figure 3C) compared with the other years in Figure 3.
Note that the eddy-tracking suggests that anticyclonic eddies east of the FOI in each year were different ones (not shown), except for the eddy in 2015 and 2016 as discussed in the next section. While Kuroda and Yokouchi (2017) concluded that an identical eddy (“Eddy-A”) remained from 2010 to as of September 2016, the product used in this study does not indicate it. The difference of Kuroda and Yokouchi (2017) and the product used in this study might be from the difference of the treatments in the coalescence of eddies. Kuroda and Yokouchi (2017) allowed the coalescence of clockwise eddies. However, they did not determine which clockwise eddy survived or died. Instead, they assumed that the Eddy-A survived at any coalescences. Repeated coalescence processes were essential to revive the Eddy-A, which is much weakened in cold seasons. In Kuroda and Yokouchi (2017), however, source of the eddies absorbed into the Eddy-A were not shown.
Subsurface Water Properties
To further examine the change in the subsurface structure, the ocean reanalysis FRA-JCOPE2 was analyzed.
Figure 8 shows that the anomaly of the temperature at 50, 100, 200, and 400 m depth. Figures 8A–C shows that temperature difference occurred not only at the surface but at deeper depths. At 400 m depth, the anomaly was small.
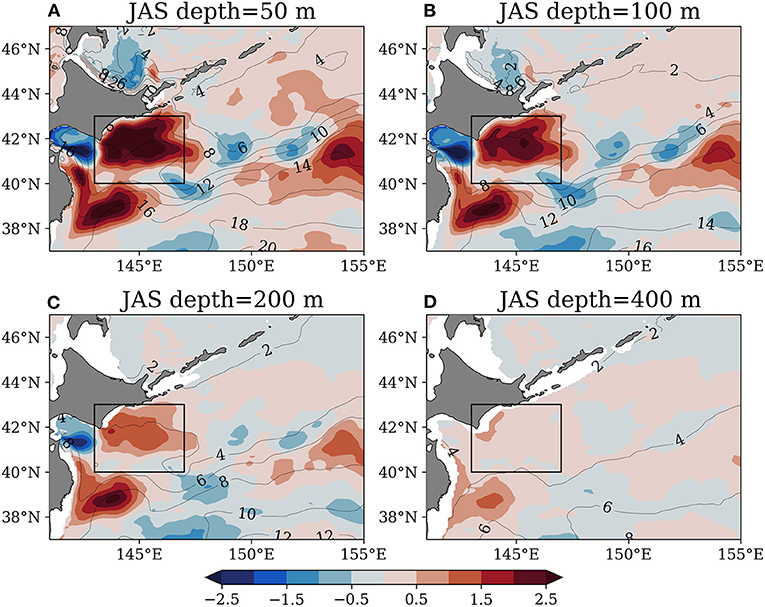
Figure 8. Deviation of the 2010–2016 average temperature at each depth from the 1993–2009 average (color; °C) and the 2010–2016 average temperature at each depth (contour, °C) of the FRA-JCOPE2 reanalysis. (A) At 50 m. (B) At 100 m. (C) At 200 m. (D) At 400 m.
In parallel to the temperature change, the salinity also changed from 2010. Figure 9 shows the salinity increased at the surface and deeper depths, again at least 200 m (Figure 9C). The warming reaching to the subsurface could be important for fisheries because some of the commercially important fisheries in Japan like walleye pollock are demersal (Sakurai, 2007).
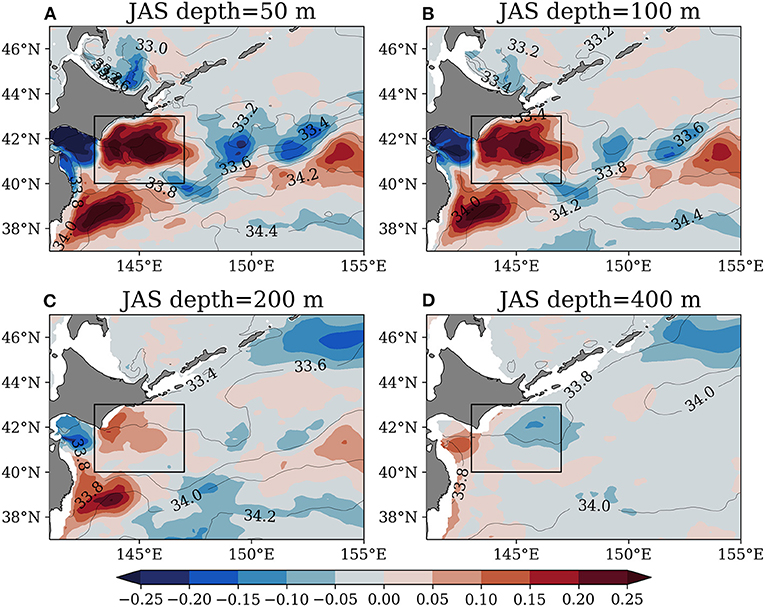
Figure 9. Deviation of the 2010-2016 average salinity at each depth from the 1993-2009 average (color) and the 2010-2016 average salinity at each depth (contour) of the FRA-JCOPE2 reanalysis. (A) At 50 m. (B) At 100 m. (C) At 200 m. (D) At 400 m.
Because the water from the Kuroshio Current is warm and saline and the water from the Oyashio Current is cold and fresh, the increases in temperature and salinity in Figures 8, 9 are consistent with the idea that the advection from the Oyashio became weak while the eddies from the Kuroshio Extension increased from 2010, as discussed in section Observed Sea Surface Height and Geostrophic Velocity and Increase in Anticyclonic Eddies.
Figure 10 shows the monthly time-depth diagram from 2010 to 2016 of (A) the temperature and (B) salinity anomaly (°C and salinity unit; colors and contours) horizontally averaged in the box in Figures 8, 9. Both the temperature and salinity anomalies extended to a depth of more than a few hundred meters during JAS season each year (the horizontal blue line). This warm and saline anomalies in JAS are separated by opposing cold and fresh anomalies in other seasons until 2014. While the vertical extent in 2014 was relatively small among 2010–2016, the vertical extents in 2015 and 2016 were large.
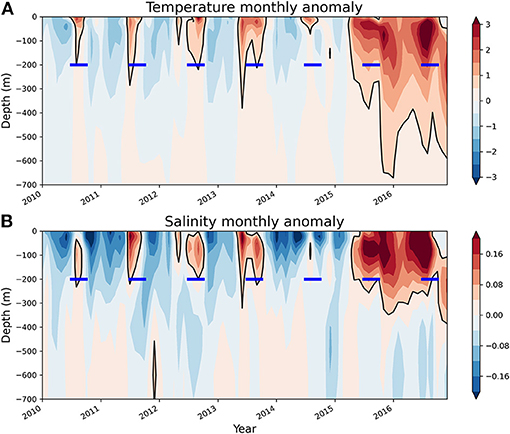
Figure 10. Monthly time-depth diagram from 2010 to 2016 of (A) temperature and (B) salinity anomaly (°C and salinity unit, respectively; colors and contours) horizontally averaged in the box in Figures 8, 9. The horizontal blue lines at 200 m depth denote JAS period each year.
Another prominent feature of the anomalies in 2015 and 2016 was that the anomaly in 2015 did not end in fall unlike 2010–2014 and continued to summer in 2016. This could be because the warm anticyclonic eddy in 2015 remained until 2016. Sendai district meteorological observatory (2017) reported that the warming in the Oyashio region caused by the anticyclonic eddy continued from June 2015 to October 2016.
Southward Intrusion of the Oyashio
In this subsection, we examine how distribution of the Oyashio water changed in 2010–2016 compared to that in 1993–2009. The temperature colder than 5°C at 100 m depth has been used for the area of the Oyashio water in previous studies (Ogawa, 1989; Takasugi and Yasuda, 1993). Figure 11 compares the 1993–2010 and 2010–2016 averages of the temperatures at 100 m depth in winter [JFM, (A) and (B)] and summer [JAS, (C) and (D)]. The Oyashio water indicated by temperature <5°C is colored blue, and southward bulges around 143–144°E and 147–150°E correspond to the FOI and the SOI, respectively. In winter, the distributions of the Oyashio waters are similar between the 1993–2009 (Figure 11A) and 2010–2016 (Figure 11B) periods. However, in summer, the FOI is clear in 1993–2009 (Figure 11C) but not in 2010–2016 (Figure 11D). This change of FOI is consistent with the result obtained from the observed SSH and the corresponding weak FOI in section Observed Sea Surface Height and Geostrophic Velocity.
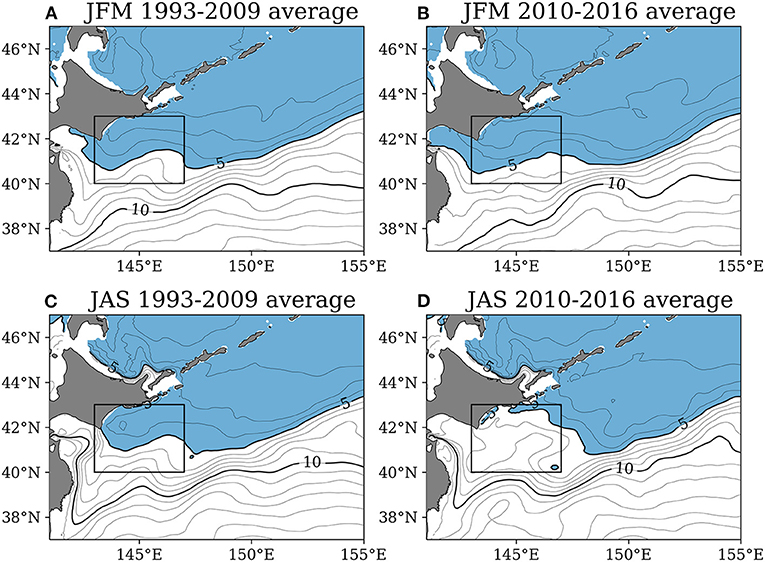
Figure 11. Temperature at 100 m depth of the FRA-JCOPE2 reanalysis (contour). The temperature of <5°C is colored blue. (A) The 1993–2009 average in JFM. (B) The 2010–2016 average in JFM. (C) The 1993–2009 average in JAS. (D) The 2010–2016 average in JAS.
The southernmost latitude of FOI in each month is quantified in Figure 12 using the FRA-JCOPE2 reanalysis. The southernmost latitude of the FOI was defined as the southernmost latitude of the 5°C isoline east of 145°E at 100 m depth. When there was no 5°C isoline east of 145°E, the latitude was defined as the latitude of the 5°C isotherm closest to the coast of the island of Hokkaido.
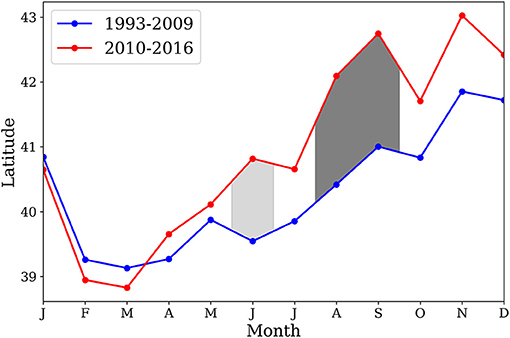
Figure 12. Monthly time series of the southernmost latitude of the FOI. Red and blue curves show the 2010–2016 and 1993–2009 average, respectively. Dark gray and light gray show the differences are significant with p < 0.05 and p < 0.1, respectively.
Figure 12 shows that the seasonal migrations of the FOI in 1993–2009 and 2010–2016 period. In both periods, the FOI advanced most southward in March, retreated from March to November, and reached its northernmost latitude in November. This seasonal variability is consistent with previous studies (Isoguchi and Kawamura, 2006; Kuroda et al., 2017). The seasonal migration is likely controlled by the seasonally fluctuating Aleutian Low pressure system via barotropic adjustment in the subarctic North Pacific Ocean (Qiu, 2019).
The significant differences in FOI latitude occur in the summertime retreating phase. The FOI in 2010–2016 period retreat faster and thus was located northward to the FOI in 1993–2009, while the southward intrusions in winter were not significantly different. The difference in the latitude of FOI was statistically significant in August and September (p < 0.05 with Welch's t-test) and in June (p < 0.1). Figure 12 reaffirms that the warming in FOI from 2010 was concentrated in summer.
Summary and Discussion
The SST in the Oyashio region off the Island of Hokkaido in boreal summer abruptly increased from 2010 and stayed high until 2016. The temperature rise cannot be explained with the downward heat flux, because there is no agreement between the regions of the large downward net heat flux and the large temperature rise. Therefore, it is inferred that water advection is important. The importance of the advection is also supported by the fact that the change of water temperature and salinity extended to a deeper depth of more than a few hundred meters. The increase in the salinity in addition to temperature suggests that strengthening (weakening) of the influence from the Kuroshio (Oyashio) water.
SSH as well as the temperature change shows the weakening of the Oyashio first intrusion (FOI). The weakening of FOI was closely associated with more frequent warm and saline anticyclonic eddies east of the FOI. The Eddy-tracking analysis shows that more anticyclonic eddies coming from the Kuroshio Extension.
As mentioned in the Introduction, temperature changes in the Oyashio region have affected fisheries. As a striking example, the catch data of yellowtail in southeastern Hokkaido (Hidaka, Tokachi, and Kushiro areas) is shown in Figure 13. Yellowtail is one of the most commercially important predatory fishes in Japan. Tian et al. (2012) showed that there was close correspondence between water temperature and catch in the Japan Sea. Figure 13 shows the catch of yellowtail, which was close to zero before 2010, sharply increased with the SST rise from 2010. Spearman rank correlation between the SST and the catch is 0.65 (p = 1.7 × 10⁻⁴).
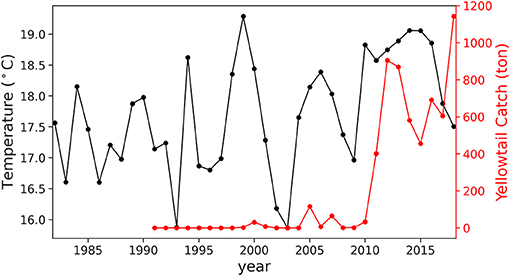
Figure 13. Time series of the SST averaged over the black box of Figure 2 in JAS (black curve; °C on the left axis; the same as Figure 1B) and the time series of the catch of yellowtail (red curve; ton on the right axis) in southeastern Hokkaido (Hidaka, Tokachi, and Kushiro areas). The catch data is taken from Annual Statistics on Fishery and Aquaculture Production in Hokkaido (in Japanese) at: http://www.pref.hokkaido.lg.jp/sr/sum/03kanrig/sui-toukei/suitoukei.htm.
Fisheries of yellowtail are conducted in the Western Central Pacific Ocean, from Japan and the eastern Korean Peninsular to the Hawaiian Islands (Dhirendra, 2005). The Pacific area off southeast Hokkaido is regarded as the northeasternmost habitat or distribution of yellowtail in Japan (Tian et al., 2012; Stock assessment report, 2020). In addition, around the Hokkaido coast, most of yellowtail (e.g., 99% in 2018) was caught by fixed nets in coastal waters according to the Stock assessment report (2020). Hence, the abrupt increase of the Yellowtail catches during 2010–2016 suggests the expansion of the habitat/distribution. This strongly suggests that the marine heat wave southeast off Hokkaido from 2010, which is closely associated with the weakening of the FOI and more frequent anticyclonic eddies from the Kuroshio Extension, have impacted fishery in Hokkaido. Indeed, Hakodate, a city in the southwestern part of Hokkaido, was famous as a “squid town” because of many catches of squid in the past, but it is now trying to become also a “yellowtail town” to adjust to decreased squid catch and increased yellowtail catch. The sharp increase of the yellowtail catch in the Pacific Ocean was not found in Tian et al. (2012), who used the data before 2010.
The present paper documented the major features of the marine heat wave southeast off Hokkaido and associated the FOI change in 2010–2016, but the driving mechanism of this long-lasting marine heat wave has not been identified. Kuroda et al. (2015) proposed one possible reason for the shift of the Oyashio path from FOI to SOI during 1993–2011 is the change of the wind stress over the North Pacific Ocean (decrease of the wind stress curl and the northward shift of the meridional position). However, this change in the stress is the trend from 1993 to 2011 and does not indicate the abrupt change around 2010 (their Figure 15). Figure 6C in this study also suggests that the change from 2010 was local one rather than the large-scale change of the subarctic gyre.
Kuroda et al. (2015) also proposed an increase in anticyclonic eddies as another possible reason for the change in the Oyashio Current. The eddy-tracking analyses by us and Kuroda and Yokouchi (2017) support the role of anticyclonic eddies as the plausible reason for the warming from 2010. Qiu et al. (2017) also concluded that the western Oyashio front variability is controlled by the decadal mesoscale eddy modulations in the upstream Kuroshio Extension. However, Figure 3A in Qiu et al. (2017) does not indicate an increase in eddy generation from the Kuroshio Extension around 2010. Further analysis of not only eddy generation but also eddy propagation is needed to elucidate the behavior of eddies. Further studies are needed to identify the driver for the warming in summer and increase of anticyclonic eddies after 2010.
Hosoda et al. (2015) found the temperature increase since 2008 from the surface to several 100 m depth in another western Pacific region (35°–45°N, 160°–180°E) in early summer. The warming at the surface can also be seen in Figure 1 of our paper. Hosoda et al. (2015) suggested that the oceanic frontal structure change (more northward Kuroshio Extension) was a possible cause, but the reason for the warming has not been confirmed. The current study and Hosoda et al. (2015) share some similarities (abrupt warming from a certain year and the importance of the ocean current) and dissimilarities (from 2010 vs. from 2008, in summer vs. in early summer, and in the Oyashio region vs. 160°–180°E). The investigation on the link or the independence between these warmings is an interesting subject in future studies.
The anthropogenic climate change will have a large impact on the marine environments in the North Pacific Ocean (Holsman et al., 2018). Abrupt warming caused by marine heatwaves like the event discussed in this paper will amplify the impacts. Further understanding of the cause and impacts of marine heatwaves is required to adapt to the rapidly changing ocean climate.
Data Availability Statement
The datasets presented in this study can be found in online repositories. The names of the repository/repositories and accession number(s) can be found in the article/supplementary material.
Author Contributions
HG and SM conceived of the presented idea and did initial analysis. TM continued the analysis and verified the conclusion. All authors discussed the results and contributed to the final manuscript.
Funding
This work is a part of the Japan Coastal Ocean Predictability Experiment (JCOPE) promoted by the Japan Agency for Marine-Earth Science and Technology (JAMSTEC). This work was supported by a Grant-in-Aid for Scientific Research on Innovative Areas 6102 (KAKENHI Grant No. JP19H05697 and JP19H05701) from JSPS of Japan.
Conflict of Interest
The authors declare that the research was conducted in the absence of any commercial or financial relationships that could be construed as a potential conflict of interest.
References
Bond, N. A., Cronin, M. F., and Freeland, H. (2015). The blob: an extreme warm anomaly in the Northeast Pacific [in “State of the Climate in 2014”]. Bull. Amer. Meteorol. Soc. 96, S62–S63. doi: 10.1175/2015BAMSStateoftheClimate.1
Copernicus Climate Change Service (C3S) (2017). ERA5: Fifth Generation of ECMWF Atmospheric Reanalyses of the Global Climate. Available online at: https://cds.climate.copernicus.eu/cdsapp#!/dataset/reanalysis-era5-pressure-levels-monthly-means (accessed May 10, 2020).
Dhirendra, P. T. (2005). Cultured Aquatic Species Information Programme. Seriola quinqueradiata. Rome: Cultured Aquatic Species Information Programme, FAO Fisheries Division. Available online at: http://www.fao.org/fishery/culturedspecies/Seriola_quinqueradiata/en (accessed November 12, 2020).
Hobday, A., Oliver, E., Sen Gupta, A., Benthuysen, J., Burrows, M., Donat, M., et al. (2018). Categorizing and naming marine heatwaves. Oceanography 31, 162–173. doi: 10.5670/oceanog.2018.205
Hobday, A. J., Alexander, L. V., Perkins, S. E., Smale, D. A., Straub, S. C., Oliver, E. C. J., et al. (2016). A hierarchical approach to defining marine heatwaves. Prog. Oceanogr. 141, 227–238. doi: 10.1016/j.pocean.2015.12.014
Holsman, K., Hollowed, A., Ito, S., Bograd, S., Hazen, E., King, J., et al. (2018). “Climate change impacts, vulnerabilities, and adaptations: North Pacific and Pacific Arctic marine fisheries,” in Impacts of Climate Change on Fisheries and Aquaculture, eds M. Barange, T. Bahri, M. C. Beveridge, K. L. Cochrane, S. Funge-Smith, and F. Poulain (Rome: Food and Agriculture Organization of the United Nations), 113–138.
Hosoda, S., Nonaka, M., Sasai, Y., and Sasaki, H. (2015). Early summertime interannual variability in surface and subsurface temperature in the North Pacific. J. Oceanogr. 71, 557–573. doi: 10.1007/s10872-015-0307-3
Hu, Z.-Z., Kumar, A., Jha, B., Zhu, J., and Huang, B. (2017). Persistence and predictions of the remarkable warm anomaly in the Northeastern Pacific Ocean during 2014–16. J. Clim. 30, 689–702. doi: 10.1175/JCLI-D-16-0348.1
Isoguchi, O., and Kawamura, H. (2006). Oyashio seasonal intensification and its effect on subsurface temperature variation off the Sanriku coast. J. Geophys. Res. 111:C10006. doi: 10.1029/2006JC003628
Itoh, S., and Yasuda, I. (2010). Characteristics of mesoscale eddies in the Kuroshio–Oyashio extension region detected from the distribution of the sea surface height anomaly. J. Phys. Oceanogr. 40, 1018–1034. doi: 10.1175/2009JPO4265.1
Kawai, H. (1972). “Hydrography of the Kuroshio extension,” in Kuroshio, It's physical aspects, eds. H. Stommel and K. Yoshida (Tokyo: University of Tokyo Press), 235–352.
Kobayashi, S., Ota, Y., Harada, Y., Ebita, A., Moriya, M., Onoda, H., et al. (2015). The JRA-55 reanalysis: general specifications and basic characteristics. J. Meteorol. Soc. Japan Ser. II 93, 5–48. doi: 10.2151/jmsj.2015-001
Kuroda, H., Wagawa, T., Kakehi, S., Shimizu, Y., Kusaka, A., Okunishi, T., et al. (2017). Long-term mean and seasonal variation of altimetry-derived Oyashio transport across the A-line off the southeastern coast of Hokkaido, Japan. Deep Sea Res. Part I Oceanogr. Res. Pap. 121, 95–109. doi: 10.1016/j.dsr.2016.12.006
Kuroda, H., Wagawa, T., Shimizu, Y., Ito, S., Kakehi, S., Okunishi, T., et al. (2015). Interdecadal decrease of the Oyashio transport on the continental slope off the southeastern coast of Hokkaido, Japan. J. Geophys. Res. Oceans 120, 2504–2522. doi: 10.1002/2014JC010402
Kuroda, H., and Yokouchi, K. (2017). Interdecadal decrease in potential fishing areas for Pacific saury off the southeastern coast of Hokkaido, Japan. Fish. Oceanogr. 26, 439–454. doi: 10.1111/fog.12207
Lorenzo, E. D., and Mantua, N. (2016). Multi-year persistence of the 2014/15 North Pacific marine heatwave. Nat. Clim. Change 6, 1042–1047. doi: 10.1038/nclimate3082
Makino, M., and Sakurai, Y. (2012). Adaptation to climate-change effects on fisheries in the Shiretoko World Natural Heritage area, Japan. ICES J. Mar. Sci. 69, 1134–1140. doi: 10.1093/icesjms/fss098
Miyazawa, Y., Zhang, R., Guo, X., Tamura, H., Ambe, D., Lee, J.-S., et al. (2009). Water mass variability in the western North Pacific detected in a 15-year eddy resolving ocean reanalysis. J. Oceanogr. 65, 737–756. doi: 10.1007/s10872-009-0063-3
Ogawa, Y. (1989). Variation of the southern end latitude of the first Oyashio Intrusion (in Japanese with English abstract and captions). Bull. Tohoku Reg. Fish. Lab. 51, 1–9.
Oliver, E. C. J., Donat, M. G., Burrows, M. T., Moore, P. J., Smale, D. A., Alexander, L. V., et al. (2018). Longer and more frequent marine heatwaves over the past century. Nat. Commun. 9:1324. doi: 10.1038/s41467-018-03732-9
Qiu, B. (2019). “Kuroshio and Oyashio currents,” in Encyclopedia of Ocean Sciences, 3rd Edn, eds J. K. Cochran, H. Bokuniewicz, and P. Yager (Cambridge, MA: Academic Press), 384–394.
Qiu, B., Chen, S. M., and Schneider, N. (2017). Dynamical links between the decadal variability of the Oyashio and Kuroshio extensions. J. Clim. 30, 9591–9605. doi: 10.1175/JCLI-D-17-0397.1
Reynolds, R. W., Smith, T. M., Liu, C., Chelton, D. B., Casey, K. S., and Schlax, M. G. (2007). Daily high-resolution-blended analyses for sea surface temperature. J. Clim. 20, 5473–5496. doi: 10.1175/2007JCLI1824.1
Sakurai, Y. (2007). An overview of the Oyashio ecosystem. Deep Sea Res. Part II Top. Stud. Oceanogr. 54, 2526–2542. doi: 10.1016/j.dsr2.2007.02.007
Sendai district meteorological observatory (2017). Press Release From on March 21, 2017 (in Japanese). Available online at: https://www.jma-net.go.jp/sendai/kouhou/houdou/17/20170321_tohoku_sea.pdf (accessed November 28, 2020).
Stock assessment report (2020). Stock Assessment of Yellowtail in 2019 (in Japanese). Available online at: http://abchan.fra.go.jp/digests2019/details/201945.pdf (accessed November 12, 2020).
Takasugi, S., and Yasuda, I. (1993). Index temperature at 100 m depth of the Oyashio front in the Iwate coastal region (in Japanese with English abstract and captions). Japan. J. Fish. Oceanogr. 57, 333–344.
Tian, Y., Kidokoro, H., Watanabe, T., Igeta, Y., Sakaji, H., and Ino, S. (2012). Response of yellowtail, Seriola quinqueradiata, a key large predatory fish in the Japan Sea, to sea water temperature over the last century and potential effects of global warming. J. Mar. Syst. 91, 1–10. doi: 10.1016/j.jmarsys.2011.09.002
Keywords: marine heatwave, Oyashio current, Kuroshio current, anticyclonic eddy, yellowtail
Citation: Miyama T, Minobe S and Goto H (2021) Marine Heatwave of Sea Surface Temperature of the Oyashio Region in Summer in 2010–2016. Front. Mar. Sci. 7:576240. doi: 10.3389/fmars.2020.576240
Received: 25 June 2020; Accepted: 03 December 2020;
Published: 14 January 2021.
Edited by:
Lyne Morissette, M–Expertise Marine, CanadaReviewed by:
Taku Wagawa, Japan Fisheries Research and Education Agency (FRA), JapanHiroshi Kuroda, Japan Fisheries Research and Education Agency (FRA), Japan
Ming Feng, Commonwealth Scientific and Industrial Research Organization (CSIRO), Australia
Fei Yu, Institute of Oceanology (CAS), China
Copyright © 2021 Miyama, Minobe and Goto. This is an open-access article distributed under the terms of the Creative Commons Attribution License (CC BY). The use, distribution or reproduction in other forums is permitted, provided the original author(s) and the copyright owner(s) are credited and that the original publication in this journal is cited, in accordance with accepted academic practice. No use, distribution or reproduction is permitted which does not comply with these terms.
*Correspondence: Toru Miyama, tmiyama@jamstec.go.jp