Climate Change Vulnerability of American Lobster Fishing Communities in Atlantic Canada
 Blair J. W. Greenan1*
  Nancy L. Shackell1
  Kiyomi Ferguson1
  Philip Greyson1 Andrew Cogswell1 David Brickman1 Zeliang Wang1 Adam Cook1
  Catherine E. Brennan1
  Vincent S. Saba2
- 1Fisheries and Oceans Canada, Bedford Institute of Oceanography, Dartmouth, NS, Canada
- 2NOAA National Marine Fisheries Service, Geophysical Fluid Dynamics Laboratory, Northeast Fisheries Science Center, Princeton University Forrestal, Princeton, NJ, United States
Climate change impacts on fisheries will undoubtedly have socio-economic impacts on coastal communities and the seafood market. However, it is a challenge to integrate climate change information in a form that can be used efficiently by adaptation planners, policy makers, and fishery managers. In this study, we frame a climate change impact assessment using a geographical perspective based on the management units of the dominant fishery, in this case, American lobster in Nova Scotia, Canada. The information considered here includes economic dependence on the fishery, population size, diversity of the fishery revenue, status of harbor infrastructure, total replacement cost of each harbor, increased relative sea level and flooding, and the vulnerability of offshore lobster to ocean warming and changes in zooplankton composition and anticipatory changes in fishery productivity across management borders. Using two ocean models to provide multi-decadal scale projections of bottom temperature, changes in offshore lobster distribution are projected to have a neutral, or positive impact on the region as a whole. However, when lobster vulnerability is combined with climate change related vulnerabilities of coastal fishing communities, it is evident that adaptation planning is needed for long-term sustainability. This impact assessment provides both a framework and information for further in-depth analyses by climate change adaptation planners and fishery managers.
Introduction
Globally, coastal regions and communities have been identified as particularly vulnerable to climate change. This is recognized in Canada in the Pan-Canadian Framework on Clean Growth and Climate Change (https://www.canada.ca/en/services/environment/weather/climatechange/pan-canadian-framework.html). Hence, there is a need to adapt and build resilience in these communities so that they are adequately prepared for climate risks like coastal flooding, extreme weather events, and shifting fish populations. The Government of Canada has recently appointed a Minister of Rural Economic Development with the primary goal of creating a Canadian Rural Economic Development Strategy. At the provincial level in Nova Scotia, a goal was set to double the value of exports (relative to a 2012 baseline) from the fisheries (including aquaculture) and the agricultural sectors on a sustainable basis by 2024 (https://onens.ca/goals/goal-15-fisheries-and-agriculture-exports/). The determination of this sustainability will be contingent upon accounting for the impacts of climate change on the fisheries and fishing communities.
Ocean temperatures on the continental shelves off the Northeast USA and southern Atlantic Canada have increased over the past half century (Jewett and Romanou, 2017; Greenan et al., 2018b), consistent with the global trend of increasing ocean heat content resulting from climate change (Cheng et al., 2017). The resulting biological impacts vary both regionally and by species (Fogarty et al., 2007; Wernberg et al., 2011; Pinsky and Fogarty, 2012; Shackell et al., 2014; Stortini et al., 2015, 2017; Kleisner et al., 2016, 2017). As warming continues, conditions may become uninhabitable for some species while others may flourish (Sorte et al., 2010). These long-term changes can have a major impact on commercial fisheries if waters become unsuitable for species of economic importance and range shifts lead to a decrease in local abundance (Fogarty et al., 2007). Alternatively, an area may experience a change in abundance of certain species if warming improves habitat suitability (Fogarty et al., 2007; Sorte et al., 2010; Shackell et al., 2014; Stortini et al., 2015).
American lobster (Homarus americanus) is Canada's most valuable fishery ($1.3 B in 2016), and contributed 44% of the total commercial value of all fisheries in Atlantic Canada in 2016 (DFO, 2018). Lobster landings have been trending upward in recent decades among the 45 directed fisheries in the Atlantic provinces and Quebec (Bernier et al., 2018). Many small rural communities in Atlantic Canada rely heavily on lobster for their economic well-being, although snow crab (Chionoecetes opilio) is important in the colder northeast region (Figure 1). Ocean temperatures above an optimal thermal range can reduce lobster survival, growth, and reproduction as a result of stress, decreased recruitment, and increased disease (Aiken and Waddy, 1986; ASMFC, 2015). The scale and characteristics of lobster response to warming varies across its range (Boudreau et al., 2015). Lobster abundance in the Gulf of Maine was at record high in 2015 (ASMFC, 2015) where the lobster industry has initially benefitted from a loss of lobsters' predators, warming bottom temperature (Boudreau et al., 2015) as well as strong conservation measures (Le Bris et al., 2018). In contrast, lobsters are declining in the warmer southern New England where conservation measures are fewer (Le Bris et al., 2018).
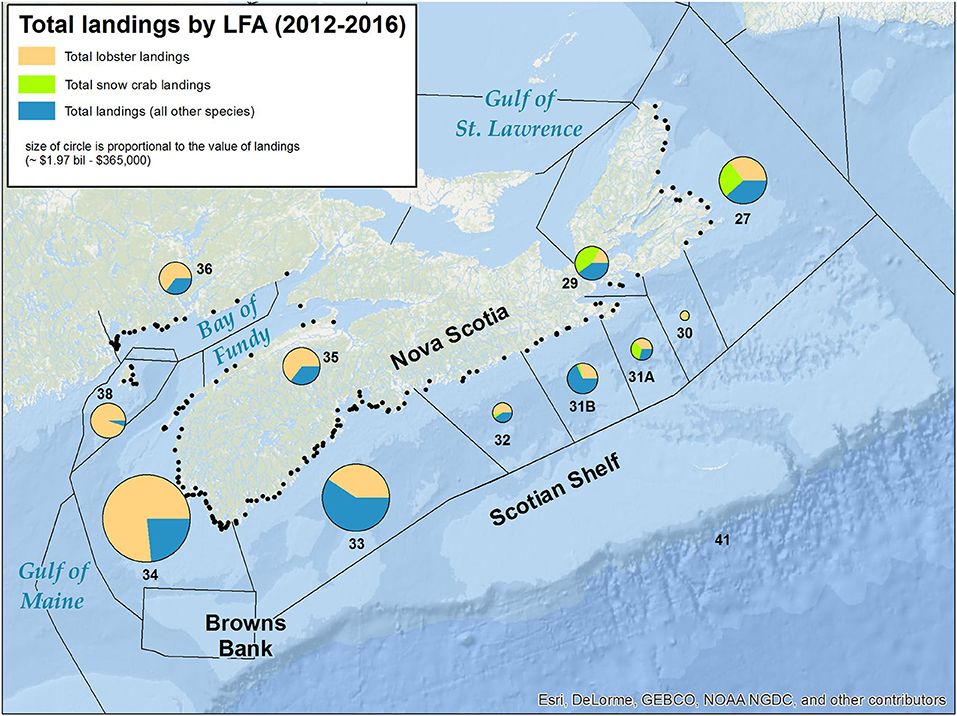
Figure 1. Value of fisheries landings associated with each Lobster Fishing Area (LFA) in the Maritimes Region of Fisheries and Oceans Canada (DFO). Landings are reported at the community level, and aggregated at the level of LFA. The size of pie charts in each LFA is scaled by the total value of landings and the proportions presented for lobster, snow crab and all other species. DFO Small Craft Harbor locations are represented by the black dots.
The observed boom in the Gulf of Maine may not be permanent given that warming-induced changes in molting and timing of migration have extended the fishing season while increasing the number of individuals eligible to the fishery and may lead to over-fishing (Mills et al., 2013) alongside a declining trend in young of year in the Gulf of Maine and Georges Bank since 2012 (Carloni et al., 2018). While ocean temperature change and fishing pressure are important factors impacting lobster distributions, the processes, and interactions that occur at early life cycle stages are also highly relevant. Recently hatched, planktonic lobster spend the first 6–10 weeks of life in near-surface waters, during which planktonic organisms make up the bulk of lobster diets (Lawton and Lavalli, 1995; DFO, 2009). In the Gulf of Maine, a correlation has been identified between the abundances of post-larval and young-of-year lobster, and the copepod species Calanus finmarchicus, suggesting a link between the declining trend in lobster recruitment and deviations in zooplankton assemblages in this region (Carloni et al., 2018). As ocean temperatures warm and habitat suitability decreases in some areas, ensuring that management and fishing practices regionally are tailored to support the future of the stock can help moderate the effects of ocean warming (Le Bris et al., 2018).
In this paper, we present an analysis of coastal vulnerabilities to climate change (physical environment, socio-economic, and infrastructure), alongside potential responses of adjacent lobster populations given increased ocean temperatures. This is performed at the management unit scale as a means to identifying variation between regions, and where/how preparation for investment and/or adaptation strategies may be beneficial in boosting local resiliency to future changes (Colburn et al., 2016). Our analysis of the projections for the lobster fishery is a first step in considering this information in local fishery management decisions and longer term economic development strategies.
Data and Methods
Providing climate change adaptation tools that integrate changes in the physical environment with fisheries response and the potential socio-economic impacts presents a significant challenge. However, such tools are needed by adaptation planners, policy makers, and fishery managers. In the case of fishery managers, they generally make decisions at the scale of the stock management unit as opposed to the entire range of the species. The approach adopted in this paper is to generate two climate change vulnerability indices (one for coastal communities and one for lobster) and then aggregate this information at the scale of fishery management units (Figure 2).
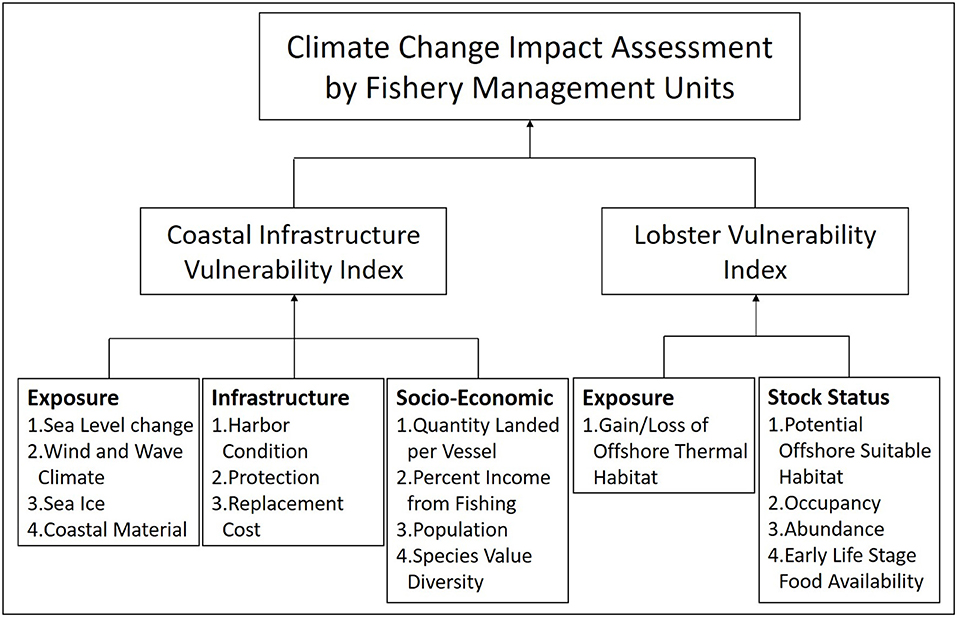
Figure 2. Flowchart of vulnerability indices, sub-indices, and components that contribute to an overall climate change impact assessment by fishery management unit.
In the first case, the Coastal Infrastructure Vulnerability Index (CIVI) will provide a measure of the relative vulnerability of DFO Small Craft Harbor (SCH) locations to climate change (Cogswell et al., 2018; Greenan et al., 2018a). The lobster fishery in Nova Scotia is supported by an extensive network of coastal infrastructure, which is a nationwide SCH program responsible for the maintenance of more than 1,000 harbors with infrastructure (e.g., wharves, breakwaters, buildings) valued at approximately $5.6 billion. While the harbors are locally-operated and managed by not-for-profit Harbor Authorities, the SCH program provides the property, infrastructure, liability insurance, and budget for major and minor repairs. These harbors are critical to the fishing industry and the economy of rural coastal communities in Canada.
While CIVI is comprised of exposure (natural forces), infrastructure, and socio-economic indicators, it does not incorporate biological impacts of climate change. In the second part of the analysis, a species vulnerability index will be calculated as a function of exposure (gain/loss in suitable habitat) and sensitivity (measures of abundance, potential, and food availability) (Stortini et al., 2015, 2017), based on projections of change in suitable habitat (Shackell et al., 2014). The objective of this paper is to integrate relevant information at the spatial scale of a stock. The result is a Climate Change Impact Assessment by Fishery Management Units (Figure 2), and this highlights spatially distinctive characteristics in vulnerability and identifies needs for customized adaptation planning (Colburn et al., 2016).
Coastal Infrastructure Vulnerability Index
The Coastal Infrastructure Vulnerability Index (CIVI) was developed as a national-scale adaptation tool for SCH to provide a numerical indicator of relative vulnerability that incorporated the effects of climate change (Greenan et al., 2018a). This vulnerability index was designed with three component sub-indices: Exposure (natural forces), Infrastructure, and Socio-economics. Each of the sub-indices incorporates three to five component variables which were scored on a 1–5 scale (least vulnerable to most vulnerable) depending on the harbor's vulnerability to that particular variable. The scoring is a relative measure for the variable over the geographical area of this study. Most of the variables are scored objectively using the methodology described in this section, however, some variables required expert judgment and, in those cases, we have provided information on who undertook this assessment. A detailed description of the criteria for scoring each of the variables in CIVI is provided in Greenan et al. (2018a). The individual sub-index scores were calculated as the geometric mean of the constituent variables (Cogswell et al., 2018) and the final vulnerability index is the geometric mean of the three sub-indices for each harbor.
Exposure Sub-Index (ESI)
The Exposure Sub-Index includes five component variables: relative sea level change, maximum wind speed, mean significant wave height, coastal materials (shoreline type/susceptibility to erosion), and change in sea ice duration.
Sea level change
For the Atlantic Canada region considered in this study, relative sea level is rising (and is projected to continue to rise) faster than the global rate, in part as a result of land subsidence due to glacial isostatic adjustment (Greenan et al., 2018b). The relative sea level change data were derived from the Intergovernmental Panel on Climate Change Fifth Assessment Report Coupled Model Intercomparison Project, Phase 5 (IPCC, 2014). Using the IPCC RCP8.5 scenario, the change in relative sea level at each SCH location was computed as the difference between the projected mean water level in the year 2100 relative to 2010. The RCP8.5 scenario was used because it represents the high emission scenario (i.e., business as usual, no mitigation of greenhouse gases) and so for planning purposes is a more conservative option. This scenario is also consistent with the ocean climate model projections that were used for the lobster vulnerability analysis. The scoring of this variable is 1 (5) in the locations of the study with the smallest (largest) projected relative sea level rise.
Wind and wave climate
A wind and wave climate for the Canadian coastline was generated for the years 1990–2012 using wave model data generated from the French Research Institute for Exploitation of the Sea (IFREMER) wave hindcasts using the WAVEWATCH III model (Rascle et al., 2008; Rascle and Ardhuin, 2013) and wind data from the National Centers for Environmental Prediction (NCEP) Climate Forecast System Reanalysis (CFSR) (Saha et al., 2010). Two high resolution (10 min) grids of Atlantic and Pacific maximum modeled wind speeds were used for southern Canadian coastal areas while a coarser (30 min) worldwide grid was used for the Arctic areas. From these datasets the mean annual maximum wind speed and the mean maximum significant wave height were calculated. Future projections of changes in the wind and wave climate along Canada's coastline have low confidence at this point (Greenan et al., 2018b), so the decision was made to use the present wind and wave climate. The scoring of these variables is 1 (5) in the areas with the areas of the study with the lowest (highest) wind speed and smallest (largest) wave heights.
Sea ice
Sea ice data were acquired from the Canadian Ice Service providing percent ice coverage for each week over four decades (1970s through 2000s). For each decade, a single dataset was calculated as the sum of all weeks with ice coverage in excess of 50% along the coastline, with a maximum possible score of 52 weeks for each decade. As a measure of change in ice duration (number of weeks), the data from the 2000s was subtracted from the 1970s. A positive number represented a reduction in weeks of ice coverage, a negative number an increase in ice coverage. This variable is scored one (5) for the locations in the study area that have experienced the smallest (largest) absolute change in the number of weeks of ice coverage.
Coastal materials
The base layers from which the coastal materials layer was derived were the Fulton surficial geology (Fulton, 1995) and the Wheeler bedrock geology (Wheeler et al., 1996), both at scales of 1:25 million. At locations where the surficial geology was greater in thickness than veneer, a score of 3–5 was assigned, with 5 being most erodible (muds, marine clay, materials that will flow) and three being less erodible (sands, gravels). Where surficial materials had the same thickness as veneer or less, the bedrock geology was used as the basis for the score. Scores based on bedrock geology were assigned 2 if the geology was sedimentary, and 1 if igneous or metamorphic (G. Manson, personal communication, 2015, Natural Resources Canada (NRCAN), Bedford Institute of Oceanography, Dartmouth, NS, B2Y 4A2).
Infrastructure Sub-Index (ISI)
A harbor's vulnerability to the potential impacts of climate change depends in large part on their ability to physically withstand the forces associated with these impacts. Three variables were selected for the Infrastructure Sub-Index:
Harbor condition
This variable is based on the SCH engineering evaluation of harbor condition, which incorporates each separate harbor facility at the component level (e.g., breakwater, wharf, building) and assigns a numerical score between 1 and 5 for vulnerability. This index is a weighted average of the score for the individual components. For each harbor, the average of all the individual facility conditions are weighted against the harbor's replacement cost. The scoring of this variable was based on the expert judgment of SCH Regional Engineers responsible for maintenance of these facilities.
Degree of facility protection
The degree of facility protection is an assessment of the degree to which a harbor is naturally protected or has manufactured protection from storm surge, wind, and other natural forces. The elements included in this assessment were: the basin, wharves, floats, shore protection, slipways, and breakwaters, but not buildings, roads, or parking lots. The variable is a function of the presence or absence of protective assets (such as breakwaters or natural topographical features) and their orientation (i.e., positioned such to withstand primary wave direction). This value was assigned by SCH Regional Engineers with a low score (1) for a fully enclosed harbor and a high score (5) for a completely exposed harbor.
Total replacement cost
The value of infrastructure at a harbor can itself be an indication of a harbor's vulnerability to the impacts of climate change. The larger the asset holdings at a harbor, the greater the opportunity for financial losses in the event of a major weather event associated with the exposure-related impacts of climate change. While the degree of facility protection provides an indication of the harbor's ability to protect users and infrastructure from the impacts of climate change, harbor facility replacement cost provides an indication of the potential liabilities related to major financial losses. This variable is scored 1 (5) for the harbor infrastructure with the lowest (highest) replacement cost in the region of this study.
Socio-Economic Sub-Index (SESI)
A Socio-Economic Sub-Index was developed to assess the harbors' economic vulnerability, as well as the harbors' role within the local economy. The Socio-Economic Sub-Index is comprised of the following four variables:
Quantity landed per vessel
The quantity landed per vessel is derived from landings (kg) divided by the number of vessel per harbor. The landings data were retrieved from DFOs Integrated Catch and Effort System. The landings reported here are the aggregated record of landings of all species returned to a particular Small Craft Harbor over the period of 2009–2013.
The number of vessels served by each harbor as port of landing is an estimate of vessel activity by harbor for the purposes of landing harvest from the fisheries. This variable is different from the number of vessels using a specific harbor as home port. Vessel activity of a Small Craft Harbor as the port of landing was used in lieu of harbor as home port as it more reliably captures the presence of economic activity at each harbor location. The number of active vessels that landed harvest in each SCH location was obtained from DFOs Integrated Catch and Effort System. We assume that landings at a particular harbor are associated with the LFA closest to that harbor. This is not necessarily the case, but for this analysis it is a reasonable assumption. This variable is scored 1 (5) for the SCH locations in the study area they have the highest (lowest) quantity landed per vessel.
Percent income from fishing
Fishing income is aggregated at the level of the census subdivision by the Canada Revenue Agency from the reported income of the following four fishing-related sectors: self-employed fish harvesters, wage earning-fish harvesters, fish processing employees, and aquaculture employees. Only individuals who reported a positive amount of income in any of these fishing sectors were included in the analysis. All other employment income is considered non-fishing income. The average fishing income by the census subdivision of each Small Craft Harbor (2009–2013) was calculated as a percentage of total average employment income. This socio-economic variable provides an indicator of the weight of fishing-related incomes in the census subdivision associated with the SCH location. This variable is scored 1 (5) for the community surrounding each SCH facility with the lowest (highest) percent income from fishing in the study area.
Population
The spatial area of Statistics Canada (StatsCan) census subdivisions are too large to properly represent populations associated with many SCH sites. Hence, the population linked to SCH sites was assigned using the smaller StatsCan geographical units of Population Centers, Dissemination Areas, and Dissemination Blocks (largest to smallest). The process used for assigning population to SCHs is as follows:
1. If a harbor falls in a Population Center (or within a distance of 10 km), the population for that Population Center will be assigned to the harbor (Population Center is a StatsCan delineation used for municipal areas).
2. If a harbor has a population value at the level of a Dissemination Block (smallest geographical unit in the Census), that value is used.
3. If there is no population at the Dissemination Block level, the population value at the Dissemination Area level is used.
4. During quality control of the results, communities that were assigned population values that were too large (based on local knowledge of the region) were recalculated using the sum of adjacent Dissemination Blocks instead of the larger Dissemination Area.
This variable is scored 1 (5) for the communities surrounding the SCH facilities with the smallest (largest) populations in the study area.
Species value diversity
We refer to the diversity of fishing revenue as an Species Value Diversity (SVD). We recognize that fishing revenue is only one aspect of economic diversity in coastal communities, but it does provide a measure of whether communities depend on the revenue from a few or several species. For this analysis, Pielou's evenness index (Pielou, 1996) was used to compute the SVD where values range from 0 to 1, with 1 representing a community with similar sized proportions of landed value ($CAD) of each species. While measures of diversity typically use species counts for their calculation, we opted to use landed value for each species at each harbor as a proxy for species counts. These values were then reclassified into five equal intervals and redistributed to a range of 1–5 as has been done with other CIVI variables. The outcome of this calculation is that the SVD directly represents the capacity of fishing communities to adapt to climate change impacts should they result in the failure of a commercial fishery.
Lobster Vulnerability Index Input: Habitat and Zooplankton
The majority of lobster is fished in inshore areas, where inshore is defined as waters up to 12 nautical miles from shore. The only available data for modeling lobster habitat in the region of this study is derived from regular research vessel (RV) surveys, which do not sample inshore areas (see delineation on Figure 1). Without inshore data, it is not possible directly predict the inshore habitat suitability for lobster on the Scotian Shelf, but it is important to note that the RV offshore survey often serves as a proxy for lobster regional population dynamics and habitat preferences (Cook et al., 2017). In LFAs 27, 31A, 31B, and 32 the lobster fisheries are almost completely inshore, and there are too many uncertainties and insufficient information in trawl data to make reliable predictions in the offshore in these LFAs. In this study, a decision was made to limit the analysis to projections in offshore lobster habitat only. It will not be possible to draw conclusions about the inshore areas on the Scotian Shelf until geo-referenced lobster abundance data become available.
Research Vessel Survey Data
Since the early 1960s and 1970s, respectively, the U.S. National Oceanographic and Atmospheric Administration (NOAA) National Marine Fisheries Service and Fisheries and Oceans Canada (DFO) have conducted seasonal and/or annual research vessel (RV) bottom- trawl surveys to monitor the distribution and abundance of groundfish in Northwest Atlantic waters. These surveys range from Newfoundland and Labrador to the Gulf of Maine, and include the Gulf of St. Lawrence and the Bay of Fundy. For each trawl set, species presence, abundance, and biomass are recorded along with several ocean variables (temperature, salinity, depth, date, geographic coordinates). To inform our species distribution model on American lobster habitat preferences, we used presence, depth, bottom temperature, season, and location data from a subset of the RV survey data that includes data from: 1990 to 2016, depths shallower than 450 m, temperatures below 19.5°C, and winter and summer months (January, February, March, July, August, September).
Ocean Model Projections
In this study, we model offshore habitat suitability and measure exposure to climate change as the percent change in suitable habitat availability given a projected increase in ocean bottom temperature from computer models for the months with RV survey data. The two ocean models used in this study included a regional ocean model that has high resolution in the region of the Scotian Shelf and Gulf of Maine [BIO North Atlantic Model (BNAM); (Brickman et al., 2016)], and a global climate model [NOAA Geophysical Fluid Dynamics Laboratory's Climate Model 2.6 (CM2.6); (Saba et al., 2016)].
The BNAM model is run in two basic modes: a hindcast simulation from 1990–present, and future climate projections. Output from the former has been applied to a number of ecosystem related and ocean variability studies in Atlantic Canadian waters (Brickman et al., 2015, 2018; Wang et al., 2016; Shackell et al., 2019). The future climate predictions have been used in studies of impacts on the marine ecosystem (Lowen and DiBacco, 2017; Stanley et al., 2018).
The BNAM provides simulated projections of ocean variables for two future climate bi-decadal periods (2055: 2046–2065, 2075: 2066–2085) using two IPCC AR5 scenarios, RCP4.5 and RCP8.5. In this study, we use the bottom temperature output from the 2055 RCP8.5 model run as it provides the scenario most similar to the CM2.6 doubled CO2 experiment (Meinshausen et al., 2011). The BNAM model simulated the present day climate using the Coordinated Ocean-ice Reference Experiments (CORE) atmospheric forcing dataset (Griffies et al., 2009). Forcing for the future climate simulations was created by adding anomalies derived from six Coupled Model Intercomparison Project Phase 5 (CMIP5) Earth System Models to the present climate CORE forcing for RCP8.5. A representation of the projected Greenland glacier ice melt was also included in the simulations (Brickman et al., 2016). From these simulations, spatial fields representing predictions of mean monthly differences in temperature between the 2055 period and present climate were derived.
The CM2.6 model projected ocean temperature change in response to a 1% per year increase in atmospheric carbon dioxide (CO2) concentrations (Saba et al., 2016). This model was initialized using present day ocean conditions, a 100 year spin up under pre-industrial (1860) atmospheric CO2 concentration levels (Saba et al., 2016). After the initialization period, atmospheric CO2 concentrations were increased by 1% each year for 70 years (with CO2 doubling at 70 years and then remains fixed for 10 more years). A parallel control simulation was run for which after the initialization, CO2 concentrations were fixed to pre-industrial (1860) levels for 80 years. To calculate the change in temperature, control simulation years were subtracted from the corresponding projection months years, producing 80 years of monthly temperature change projections. In our analysis, we used the average of years 61–80 as our temperature change values.
Plankton Monitoring Data
The American Lobster has a complex lifecycle throughout which their diet and habitat needs change. During their planktonic stage, they inhabit near-surface waters where they complete three molts by feeding mostly on other planktonic organisms (DFO, 2009). C. finmarchicus is biomass dominant in the zooplankton assemblages in this region of the northwest Atlantic (Reed et al., 2018). Since phytoplankton are the primary source of nutrients for C. finmarchicus, their lifecycle is highly dependent on the timing and magnitude of seasonal blooms. Therefore, shifts in the spatial and temporal components of the bloom are highly relevant to C. finmarchicus distributions and abundances (Record et al., 2019a,b; Staudinger et al., 2019). Shifts in C. finmarchicus abundance can also lead to timing mismatches for migratory species and reduced availability of anticipated food (Record et al., 2019b; Staudinger et al., 2019). In recent years, this has been observed among the North Atlantic right whale (Eubalaena glacialis) whose diet consists primarily of copepods (Brennan et al., 2019) and is correlated with fish and lobster recruitment (Perretti et al., 2017; Carloni et al., 2018).
To incorporate biological interactions and prey availability into the assessment of stock status, C. finmarchicus abundance data were compiled from the DFO Atlantic Zone Monitoring Program (AZMP), and the spatial abundance was simulated by a coupled bio-physical model (Brennan et al., 2019). The AZMP characterizes oceanographic variability through measurements of temperature, salinity, nutrients, chlorophyll, and zooplankton. Seasonal opportunistic sampling occurs along set sections of the Scotian Shelf, but bi-weekly sampling also occurs at easily accessible fixed sites, and also incorporates ocean data collected by other monitoring programs such as fisheries surveys. Zooplankton samples are collected through ring net vertical tows from near-bottom to surface waters. These samples are split in half, one to determine wet–dry weight, the other is subsampled to identify and count taxa. To represent early life stage food availability in this analysis, we use AZMP C. finmarchicus Scotian Shelf data (individuals per m2) collected from consistently sampled months (April, September, and October) between the years 1999 and 2018.
Lobster Vulnerability Index Formulation
In the context of climate change, the vulnerability of a species balances on the extent of the exposure, the population's sensitivity to this exposure, and its ability to adapt to the associated change (IPCC, 2014). In vulnerability assessments, exposure, sensitivity, and adaptive capacity are quantified using combinations of multiple variables, with specific application to human systems (IPCC, 2014). In the analysis for this study, sensitivity and adaptive capacity have been grouped into a single category “stock status,” which is typical for vulnerability assessments for natural systems (Stortini et al., 2015; Hare et al., 2016).
The Lobster Vulnerability Index formula consisted of two sub-indices: exposure and stock status. Exposure consisted of the percent change in suitable habitat for American lobster in response to projected changes in bottom temperature from the two ocean climate model projections, and stock status was comprised of four component variables: potential suitable habitat, occupancy, abundance status, and early life stage food availability. The gain/loss of suitable habitat per lobster fishing area (LFA) is computed and then combined with stock status within each LFA to arrive at a vulnerability index that represents regional vulnerability to climate-related changes in American lobster habitat. The Lobster Vulnerability Index per LFA will be analyzed in combination with Small Craft Harbor vulnerability indices to characterize an LFA's overall vulnerability to climate change.
Habitat Exposure
For this study, exposure is defined as the percent change in suitable habitat for American lobster between current and projected temperature scenarios. Note that this is different from the Exposure sub index used in CIVI that represents natural forces that can act on infrastructure. Using the mgcv package (Wood, 2004, 2017) available for R statistical programming, a generalized additive model (GAM) was used to measure habitat suitability across our study region. On a scale from 0 to 1, the habitat suitability model predicts the likelihood of a species being present at a location, based on the distributions of known presence and absence locations across the range of environmental conditions. The GAM was selected using a forward stepwise procedure, and comparing the Akaike information criterion (AIC) and Analysis of Variance (ANOVA) diagnostics (R Core Team., 2018). The model with the lowest AIC, lowest residual deviance and highest deviance explained, served as the null model before adding a new variable. The final model incorporated bottom temperature and depth as thin plate splines, longitude and latitude as a tensor product with an exponential spatial correlation, and season and year as factors.
To quantify exposure per LFA, three versions of the same model were run, one for each temperature scenario (current: associated with the RV survey data, future: BNAM, and CM2.6) while holding all other variables constant. For each temperature scenario, the model was run 100 times using a random selection of 85% of the data, habitat suitability was assigned back to each survey point, and to visually represent the results a habitat suitability map was interpolated using inverse distance weighting. To calculate exposure, for each temperature scenario, survey points were grouped by LFA and then the percentage of the data that received a habitat suitability score >0.3 was calculated (Cook et al., 2017). The percent gain/loss was computed by differencing the current estimate with each of the projected temperature change scenarios.
Stock Status
Stock status was calculated as a function of potential suitable habitat, occupancy, abundance status, and early life stage food availability. We measured potential suitable habitat as the percent of the total surveyed LFA area that is suitable (area >0.3 suitability/total surveyed LFA area) when habitat suitability is modeled excluding location. For occupancy, the realized suitable habitat was calculated the same way, but included longitude and latitude in the model, and then divided realized suitable habitat by potential suitable habitat to arrive at an occupancy ratio. Low numbers suggest that there is a lot of unused suitable habitat while high numbers suggest that high occupancy in suitable areas is leading to population growth in less suitable areas. Finally, for abundance status we computed the 5 year (2013–2016, inclusive) mean weight of landings (a proxy abundance index) and divided this by the maximum of the time series. The resulting value represented recent landings as a percent of the highest in the time series, if landings are currently peaking, this value would be 100. There was an exception for LFAs 37, 40, and 41 where we used the RV survey values for landings estimates because LFA 37 is a shared area between LFA 36 and 38. LFA 40 is closed to lobster fisheries, and LFA 41 is a total allowable catch controlled lobster area.
Finally, for early life stage food availability, we combined two values: mean C. finmarchicus abundance per LFA, and the trend in abundance. The trend was defined as the percent change in mean abundance (individuals per m2) in AZMP surveys between the periods of 1999–2009 and 2010–2018 using only data from consistently sampled months (April, September, and October). LFAs that did not contain survey stations were assigned values from the nearest neighboring LFA. Data were divided into two time periods corresponding to the shift circa 2010 in right whale migration patterns (Brennan et al., 2019). As Calanus spp. are the main prey of right whales, this likely represents an upper trophic level response to the documented changes circa 2010 in the zooplankton community in the northwest Atlantic shelf (Devine et al., 2017; Johnson et al., 2018; Meyer-Gutbrod et al., 2018). Mean abundance per LFA was calculated from a coupled bio-physical model prediction of the spatial distribution of average May-November 2008 C. finmarchicus late stage abundance (copepodite stages CV and CVI) on the eastern Canadian shelf (Brennan et al., 2019).
Scoring Matrix
We factored the sub-indices and component variables into 1–5 scores using intervals that were based on the potential range for each variable (Table 1). The final stock status score was calculated using the geometric mean of the four component variables. The vulnerability assessment used a 5 × 5 matrix to describe the relation between exposure and stock status, and assigned vulnerability scores to American lobster per LFA (Table 2). In the matrix, exposure ranged from maximum gain (1) to maximum loss (5) in suitable habitat, and stock status ranged from strong (1) to weak (5).
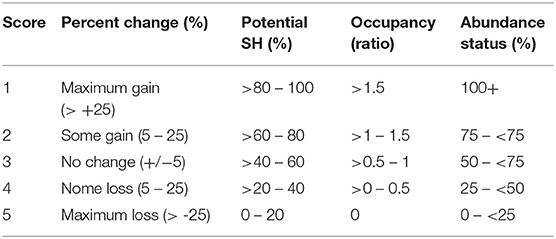
Table 1. Definitions of the bins used to factor indicators into scores that range from 1 to 5 (SH, suitable habitat).
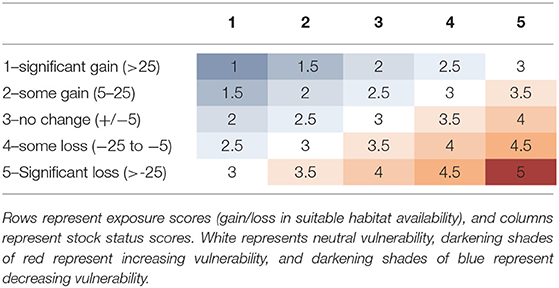
Table 2. Vulnerability assessment scoring matrix.
If exposure is low and stock status is strong, vulnerability will be low, and if exposure is high and stock status is weak, vulnerability will be high. However, some combinations of exposure and stock status can be assigned similar vulnerability scores. An area with high exposure and weak stock status will be scored similarly to a place with low exposure and strong stock status. Because of this, mid-ranged vulnerability scores will require deeper analysis should a more detailed understanding be required. Additionally, when suitable habitat is gained in areas where it is currently relatively scarce, a small absolute gain can lead to a large percent gain, while large spatial gains in areas with high existing availability of suitable habitat will have more muted percent gains. Similarly, when starting points for stock status indicators are low, this can be interpreted as a population under stress, or the absence of an established population (which we parallel with uncertainty). We assessed that in both of these scenarios, weak stock status scores are justified, and for interpretation, the nature of the stock status can be deduced from the known footprint of the fishery and population.
Results
Future Climate Simulations From Two Ocean Models
The future climate simulations from the two ocean models have been used to produce projections of lobster vulnerability in Atlantic Canada. These species distribution models projected similar spatial patterns of habitat suitability for American lobster. This is encouraging given the different methods the two models use to simulate future climates, and supports the use of CM2.6—a global climate model–in similar studies across pan-Canadian waters and elsewhere. The similarity in spatial pattern can be attributed to the high resolution of the models—something that is required to correctly simulate ocean variability and circulation in this region (Brickman et al., 2018). The difference in intensity of the species distribution model responses can be directly related to larger bottom temperature changes predicted by the CM2.6 model (see Figure S1).
Lobster Response to Projected Climate Change
Current habitat suitability is higher and more widespread in the western waters of Nova Scotia, including the Bay of Fundy and Browns Bank, and is moderate throughout the Gulf of Maine and on the outer part of the Scotian Shelf from ~62 to ~65° W (Figure 3). By mid-century, both future climate model scenarios project an increase and expansion of habitat suitability (Figure 3). While the spatial pattern of change in suitability is similar using both ocean climate models, the suitability trend was more pronounced under the CM2.6 temperature change projections.
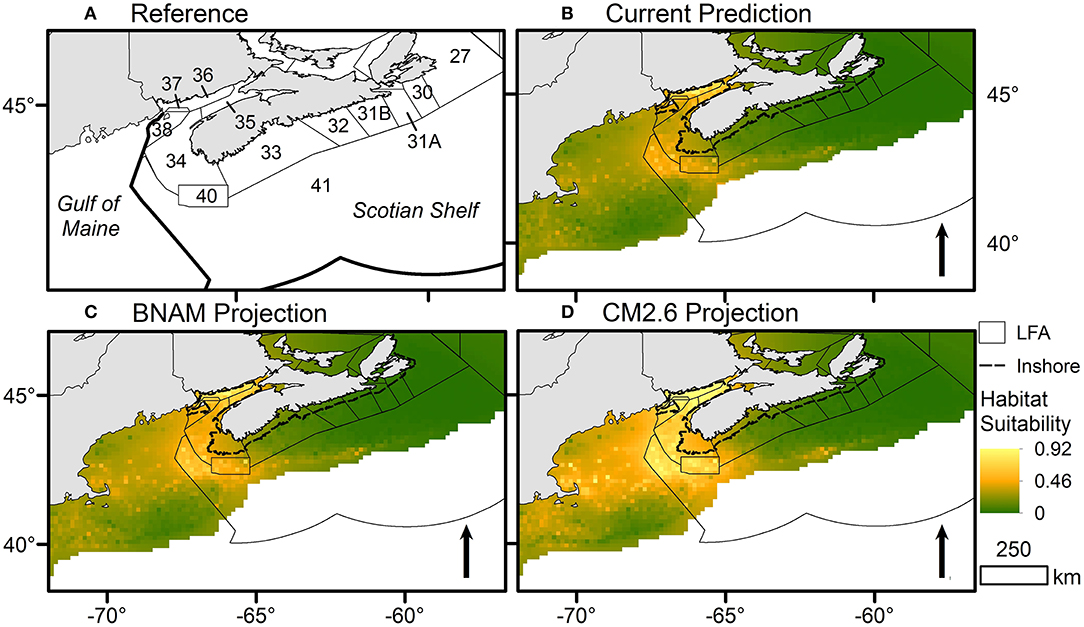
Figure 3. Current and projected habitat suitability maps for American lobster (Homarus americanus), based on measured and projected ocean temperatures. Habitat suitability is measures on a 0–1 scale, where 0 = low likelihood of the species being present and 1 = a high likelihood of species presence. (A) Reference map with Lobster Fishing Areas (LFAs) labeled. (B) Current prediction for habitat suitability distribution modeled using temperature, depth, season, year, and location from research vessel (RV) survey data. (C) Habitat suitability modeled using the same formula as the current prediction, but projected temperatures from the BNAM ocean forecast model instead of measured temperatures. (D) Habitat suitability modeled using the same formula as the current prediction, but projected temperatures from the CM2.6 ocean forecast model instead of measured temperatures. The black dashed line along the coast of Nova Scotia delineates the extent of the inshore fishery where no data are available.
The absolute and percent change in projected habitat suitability between the current conditions and the two future scenarios demonstrates similar increases in most LFAs (Figure 4). For both scenarios, despite suitability remaining high, there is a decrease in suitability in LFA 35 (Bay of Fundy), suggesting that these waters will begin to warm beyond optimal temperatures by mid-century (Figure 4). For both scenarios, habitat suitability in LFAs 34, 38, and 40 increases considerably. In general, the projected change is larger for CM2.6 than BNAM, with a larger range of both increase and decrease in habitat suitability in some areas including LFAs 33 and 41 (Figure 4). However, for LFAs 41 and 33, the gains outweigh the loss, which leads to a net gain in habitat suitability.
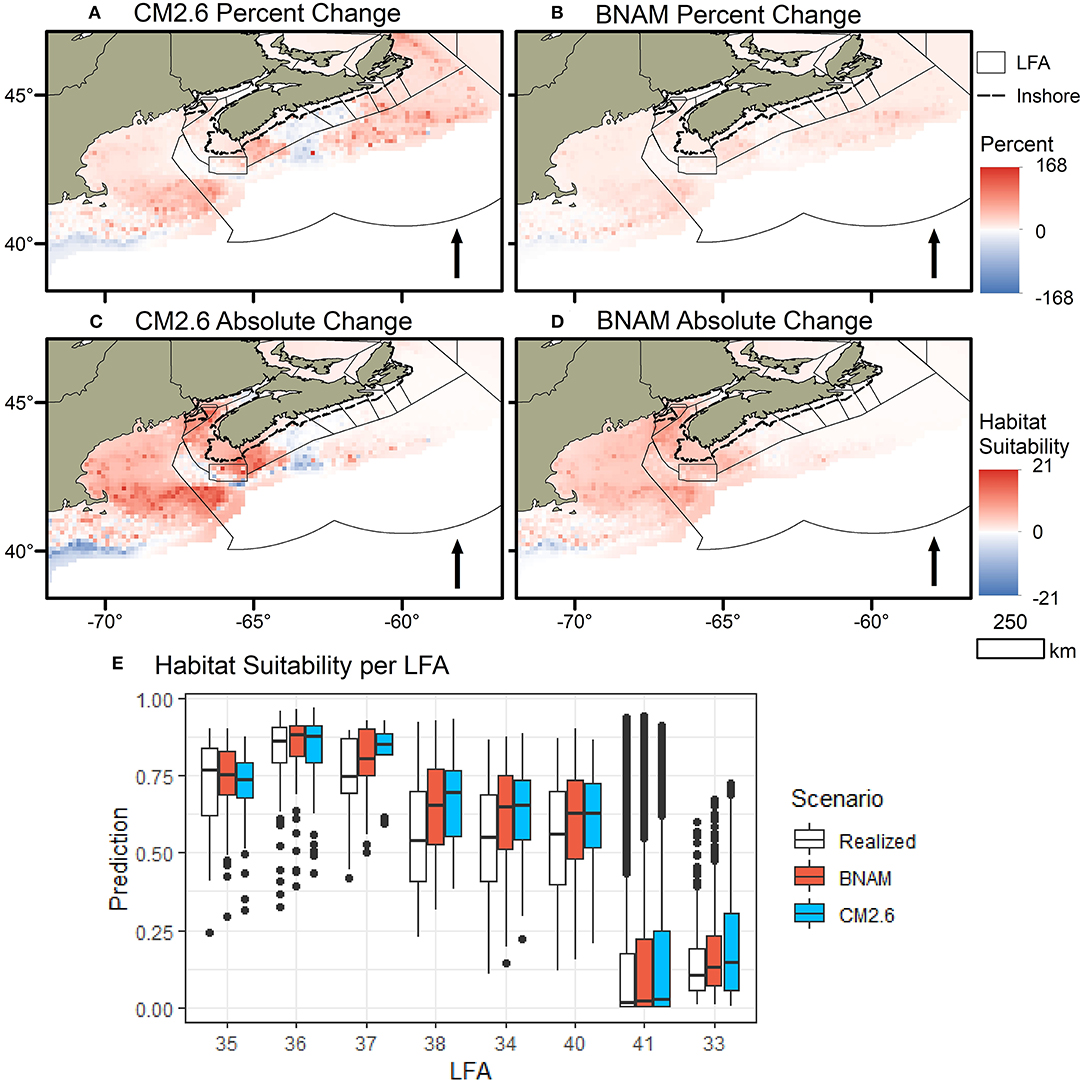
Figure 4. Spatial changes in habitat suitability for American lobster (Homarus americanus) given projected ocean temperature changes from two scenarios. Habitat suitability is measures on a 0–1 scale, where 0 = low likelihood of the species being present and 1 = a high likelihood of species presence. (A) Percent change in habitat suitability between current and CM2.6 temperature change projections. (B) Percent change in habitat suitability between current and BNAM temperature change projections. (C) Absolute change in habitat suitability between current and CM2.6 temperature change projections. (D) Absolute change in habitat suitability between current and BNAM temperature change projections. (E) Change in median habitat suitability per LFA. Bars show the distribution of median habitat suitability per LFA from 100 model iteration. The black dashed line along the coast of Nova Scotia delineates the extent of the inshore fishery where no data are available.
The percent increase in suitable habitat per LFA (exposure) for the two future scenarios yielded similar patterns, with CM2.6 projecting consistently higher gains (Figure 5). LFA 33 is projected to experience a large percent increase, more than doubling the habitat suitability in the CM2.6 scenario and almost doubling in the BNAM scenario. This is because the current habitat suitability in this LFA is quite low, and the increase in habitat suitability, although relatively small compared to other LFAs (34, 38, and 40), is large relative to its starting point (Figure 5). Percent gains in LFAs 34, 38, 40, and 41 were considerable, and negligible in LFAs 35, 36, and 37. LFA 33 is located between LFAs 34 (with considerable gain) and 32 (presently with no offshore lobster fishery). The substantial gain in LFA 33, may represent the edge of a range shift, where habitat suitability is increasing northeast as temperatures warm.
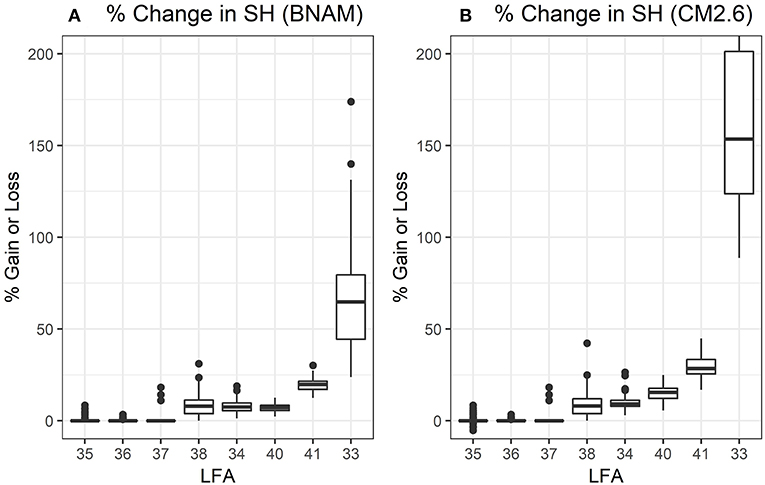
Figure 5. Percent change (gain or loss) in suitable habitat availability for American lobster (Homarus americanus). Habitat suitability is measures on a 0–1 scale, where 0 = low likelihood of the species being present and 1 = a high likelihood of species presence. A location was considered suitable if its habitat suitability score from the model output was >0.3 and distributions were created by calculating percent change between current and projected temperature change scenarios, per Lobster Fishing Area (LFA) based on 100 model iterations. (A) Percent change in suitable habitat availability given the BNAM temperature change scenario. (B) Percent change in suitable habitat availability given the CM2.6 temperature change scenario.
Using the scoring matrix described in Section Scoring matrix, we assigned vulnerability scores to each LFA. For both projected temperature change scenarios, the vulnerability scores were similar in each LFA, except in the case of LFA 41. Values ranged from 2 to 2.5, with LFAs 33, 34, and 38 scoring the lowest (2) and LFAs 35 and 36 the highest (2.5) (Figure 6). LFA 41 scored 2.5 under the BNAM scenario and 2 under the CM2.6 scenario. None of the LFAs were predicted to experience a net loss of suitable habitat, although in LFA 35, the gain only marginally out-weighs the loss. LFAs with higher scores, were typically unlikely to see any significant gain in habitat suitability, and their stock status was scored lower due to component variables (specifically occupancy and potential). LFAs that scored 2, did so due to a combination of reasons, some were predicted to experience large gains so had very low exposure scores, while others had very strong stock status scores, with high potential, occupancy, abundance, and/or food availability.
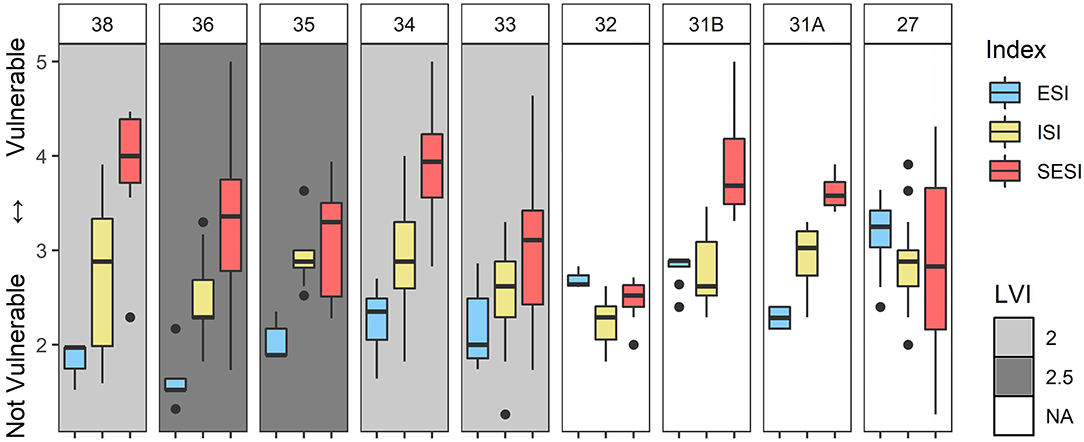
Figure 6. Vulnerability sub-indices by Lobster Fishing Area (LFA). Boxplots show the distribution of index scores within each LFA: the colored boxes represent the interquartile range (the middle 50% of scores), the horizontal line represents the median score, points represent outliers (values that exceed the upper or lower quartile by 3/2 times, whiskers (vertical lines) represent the maximum and minimum scores (excluding outliers). Boxplots represent distributions of Exposure Sub-Index (ESI), Infrastructure Sub-Index (ISI), and Socio-Economic Sub-Index (SESI) scores among Small Craft Harbors within each LFA. Background shading represents the Lobster Vulnerability Index (LVI) per LFA. There is no LVI for LFAs 27, 31A, 31B, and 32 because there are no offshore lobster fisheries in these regions.
Integrated Climate Change Impact Assessment
The primary objective of this paper is to attempt to integrate future projections of lobster vulnerability by LFA with assessments of the climate change vulnerabilities for the respective fishing communities (Figure 2). This could provide a tool for fisheries resource managers to inform decisions to incorporate climate change considerations and adaptation plans into management decisions. The results of this assessment are presented in Figure 6.
The present-day economic dependency on fisheries, as indexed by the SESI, varies across the region with LFA 32 being the least dependent on fisheries and 31B, 34, and 38 being the most dependent (Figure 1). The reason that the LFA 32 SESI is low is that this area is very close to Halifax (the largest city in Nova Scotia) and, therefore, the percentage of income derived from fishing is relatively low. The proximity to Halifax may mask the importance of the lobster industry in the small coastal communities in this LFA. LFAs 31B, 34, and 38, are comprised of many communities with small populations which are highly dependent economically on the lobster fishery (Figure 1, Figure S2).
Two areas with relatively high total value from landings are LFA 34 and LFA 27 (Figure 1). Although lobster vulnerability is not indexed for LFA 27, this region relies heavily on fisheries with both inshore lobster and snow crab contributing heavily (Figure 1). LFA 34 has a very low LVI with lobster accounting for more than three quarters of the landed value from all fisheries (Figures 1, 6). To illustrate the contrast in more detail, the frequency distributions of CIVI sub-index scores in LFAs 27 and 34 are compared with the overall distribution for the region (Figure 7).
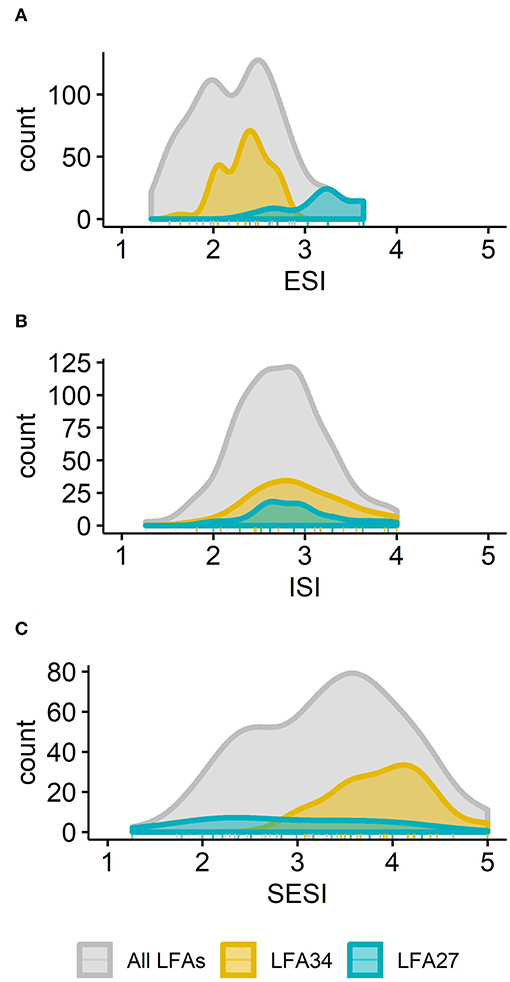
Figure 7. Distributions of vulnerability sub-indices in Lobster Fishing Areas (LFA) 27 (blue) and 34 (yellow) compared to the distribution of all LFAs combined (gray). Plots are counts of Small Craft Harbors location scores for: (A) the Exposure Sub-Index (ESI), (B) Infrastructure Sub-Index (ISI), and (C) Socio-Economic Sub-Index (SESI).
The environmental forcing resulting from climate change (represented by the ESI) indicates that the distribution of vulnerability scores across the harbors in LFA 34 is primarily in the moderate range with no site assessed above 3. In LFA 27, the range of the ESI is much broader and skewed toward the high end of the distribution when compared to both LFA 34 and the overall distribution. The distribution of the ISI is similar for LFA 27 and 34, and consistent with the overall distribution for the region. There is a strong contrast in the SESI scores for LFA 27 and 34 indicating that these regions have much different economic dependencies on the fishing industry. For LFA 34, the SESI is highly right skewed indicating that a large percentage of the communities in this area are predominantly dependent on fishing income and likely have low adaptive capacity. For LFA 27, the SESI distribution is relatively flat with equivalent numbers of low, medium, and high vulnerability. The contrast in SESI scores LFA 27 and 34 is likely explained by the economic diversity in LFA 27, with the SCH sites in the northern part of the area being remote rural communities with small populations and low business diversity while the southern part of LFA 27 encompasses the Cape Breton Regional Municipality with a large population base and diversified commercial sector. LFA 27 also has a more diverse fishery with income from the snow crab fishery being almost equivalent to that of the lobster fishery. Nonetheless, the Scotian Shelf represents the southern range of the snow crab fishery; therefore, future warming of the ocean in LFA 27 is likely to change the balance between the snow crab and lobster fisheries (Stortini et al., 2015; Zisserson and Cook, 2017).
The SESI scores for LFAs 27 and 34 are further compared in Figure 8 by displaying the four indicator variables that comprise the index. It is evident from the percent income derived from fishing that LFA 34 is highly dependent on this industry at almost all SCH locations. In LFA 27, the percent income from fishing is split between bins 1 and 4, demonstrating that this LFA has SCH sites that are either highly dependent on fishing, but an equivalent number that are not very dependent. The population indicator is right skewed for LFAs 27 and 34, this matches the overall distribution which reflects the fact that most SCH sites are in small rural communities and this does not vary much across the region. The quantity landed per vessel at SCH locations is slightly left skewed distribution and would seem to imply that this indicator is not the dominant factor in the SESI. Relative to the overall distribution, LFA 34 is slightly right skewed indicating that there is a relatively high amount of economic activity occurring in this region and the opposite is observed for LFA 27. Finally, the SVD for both LFAs 27 and 34 show high dependence on a few species, which is consistent with the overall distribution.
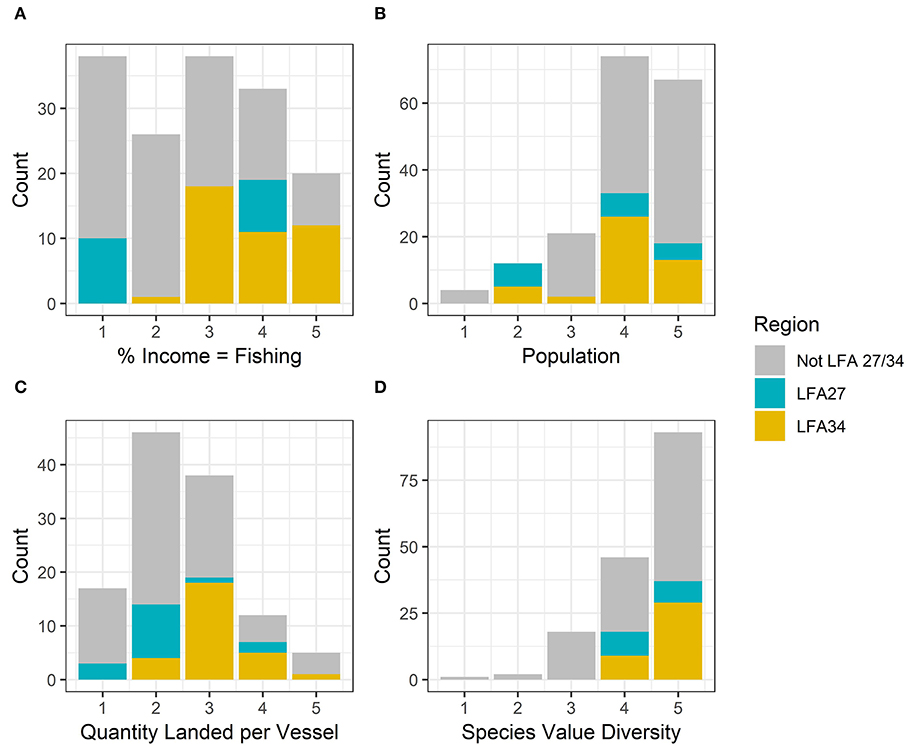
Figure 8. Distribution of scores for the Socio-Economic Sub-Index (SESI) variables and Species Value Diversity (SVD) for three groupings of Small Craft Harbors: LFA 27, LFA 34, and all other LFAs. (A) Percent income from fishing, (B) Population, (C) Quantity Landed per Vessel, and (D) Species Value Diversity (SVD).
Although LFAs 27, 31A, 31B, and 32 were not assigned LVI scores, these regions maintain active and profitable inshore lobster fisheries. The considerations of their Exposure, Infrastructure, and Socio-Economic Sub-Index scores can help describe the capacity of these regions to adapt should lobster productivity change (Figure 6). The ESI and ISI scores are moderate in all of these LFAs, indicating that they are likely to experience some degree of change in environmental conditions, and infrastructure damage/costs. There is a wider range in SESI scores: low in LFA 32, moderate in LFA 27, and on the higher end in LFAs 31B and 31A. The SESI describes the vulnerability of the community and their dependence on the fisheries so a high SESI score combined with a decrease in lobster abundance, would provide reason to look into other confounding factors, and the potential need for adaptation strategies. It is important to note that this model cannot resolve the inshore lobster fishery (which is highly active in these LFAs), and it is possible that the inclusion of the inshore fishing data could provide useful additional information for future development of Lobster Vulnerability Indices in these regions.
Discussion
A climate change impact assessment by fishery management unit has been presented by integrating coastal and economic vulnerability with projected changes in offshore lobster populations. This assessment projects an overall increase in suitable habitat across the shelf, most notably in the southwest with expansion to the northeast (including LFAs 33, 34, 38, 40, and 41). However, habitat suitability is predicted to decline in some parts of the Bay of Fundy where the ambient bottom temperature is already relatively warmer than elsewhere. Rheuban et al. (2017) performed a similar analysis on the southern New England to the Gulf of Maine range of this stock (directly south of our study region) and projected habitat expansion northward and offshore with a loss of habitat in southern inshore areas where temperatures will begin to exceed the thermal range (New England). Although our study was unable to assess inshore areas, we assume that inshore habitat is not vulnerable to warming in the near-term because this has only been projected for the southern-most part of the range. Using survey data collected in both inshore and offshore in the Gulf of Maine, lobster habitat has been shown to be increasing in both areas (Tanaka et al., 2019a), and is projected to continue to increase under the RCP8.5 scenario (Tanaka et al., 2019b). These results, with patterns similar to our own, highlight how climate change-informed habitat suitability projections can help prepare communities to adapt to potential changes in their fisheries (Rheuban et al., 2017; Tanaka et al., 2019a).
Higher vulnerability in areas with increasing suitable habitat is largely a reflection of either poor coastal infrastructure or socio-economic factors. This reflects the economic risks associated with a community dependence on revenue from a single fishery or the fishery as a whole. While the fishing industry in DFO Maritimes Region is supported by a diverse range of species, when it comes to value, it is dominated by a few key species (Figure 1). Coupled with high socio-economic dependence and a moderate state of infrastructure, the region would be at great risk if it were dependent on a cold-water species. Importantly, the entire province is heavily reliant on lobster, and adaptation planners will have to address this dependency on one species. Here, we've used simple economic indicators but a more in-depth analysis would be informative.
Overall, the ISI scores are similar across LFAs and of moderate vulnerability (Figure S3). This suggests that at the scale of the LFAs, Small Craft Harbors are in similar (moderate) condition across the region. The range of harbor conditions is highest in LFA 34, and partially reflects a higher number of SCH sites in that LFA. The assessment of the vulnerability of the coastal infrastructure can be enhanced by considering the ESI, which represents the expected forcing of the physical environment resulting from climate change. The general trend in the ESI is that it increases from west to east. One of the primary drivers of this trend is the projection of a reduced number of weeks of winter sea ice under a warmer climate. In the present climate, land-fast ice in harbors provides some protection for infrastructure from large waves in the winter. Sea ice does not form in the harbors in the western part of Nova Scotia and, therefore, no change is expected in the future climate scenarios. While the ESI is lowest in the LFAs in the western part of Nova Scotia, this should not be interpreted as the environmental forcing not being an issue for climate change vulnerability. Indeed, all of this region is expected to experience relative sea level rise at a rate faster than the global average, in part due to land subsidence in southern Atlantic Canada (Greenan et al., 2018b).
In general, our study suggests that offshore lobster is not imminently vulnerable to the projected warming of bottom waters. However, lobster do spend the early part of their life cycle (when mortality rates are highest) in the surface waters (DFO, 2009). Carloni et al. (2018) suggested that changes in zooplankton assemblages due to ocean warming may be transferring up the food web as they found post-larval abundance and lobster recruitment to be correlated with C. finmarchicus abundance and not temperature. To account for bottom up food-web variability, we included current trends an abundance of C. finmarchicus as a measure of early life cycle food availability in the lobster stock status sub-index. We did not include future projections for C. finmarchicus availability, or indices for other potential prey species including at other lifecycle stages. This could be a beneficial next step should appropriate data become available. There is also some indication that Atlantic Canada is experiencing more frequent and intense heat waves (Oliver et al., 2018). With climate change, these extremes are expected to become more common. This presents a challenge to management because while animals may be able to adapt over the longer term, extremes can present short term disruptions when marine heat waves exceed the animal's thermal tolerance (Mills et al., 2013). For example, in 2011/2012, the commercial snow crab fishery on the Scotian Shelf suffered as a result of a positive temperature event that negatively impacted the snow crab juvenile stages (predominantly), resulting in a temporary decrease in abundance (Zisserson and Cook, 2017).
Rising temperatures and heat waves have been linked to an increase in susceptibility and prevalence of epizootic shell disease that became noticeable among US lobster populations since the mid 1990's (Castro et al., 2006; Glenn and Pugh, 2006). The relation with temperature is complicated, but in general, rising temperatures can reach levels that increase physiological stress and enable bacterial to grow (Smolowitz et al., 2005; Glenn and Pugh, 2006; Tlusty and Metzler, 2012). Epizootic shell disease is most damaging at ~15°C (Tlusty and Metzler, 2012), and lobsters begin to physiologically stress at temperatures above 20°C (Glenn and Pugh, 2006; Fogarty et al., 2007). Spatially, shell disease is most pervasive US waters, increasing in prevalence toward southern extent of the range (Smolowitz et al., 2005; Glenn and Pugh, 2006), where higher temperatures are more consistently sustained. As temperatures continue to rise along the Northeast US and southern Atlantic Canada, we can expect the occurrence of shell disease to continue to spread north. While it is current practice to include this consideration in New England natural mortality rate assessments (Correia et al., 2006), the model projections for changes in ocean temperature on the Scotian Shelf and Bay of Fundy do not suggest that this will be an important issue by mid-century if temperature is a primary driver.
Marine heat waves can also promote shifts in distribution and disrupt the timing of seasonal events, leading to a mismatch between the seasonal/spatial aspects of the targeting fishery (Mills et al., 2013). This was observed among lobster populations in the Gulf of Maine in 2012 when record high temperatures spurred an increase in molting/growth rates alongside an early migration into the inshore fisheries (Mills et al., 2013). This created a longer fishing season with proportionally high landings of new recruits. The combination of these factors makes the population vulnerable to overfishing (Mills et al., 2013). The potential effects of marine heat waves are of specific interest on the Scotian Shelf, because this region has a relatively high proportion of species at the edge of their thermal range and is, therefore, more susceptible to marine heat waves (Smale et al., 2019). Developing an understanding of the potential timing, severity, and effects of marine heat waves on populations of economic importance, is an additional element that should be considered in adaptation planning in fisheries management.
It is important to recognize that temperature change is not the only factor that will impact the spatial development of offshore lobster populations. Other factors include predator and prey species, acidification, environmental degradation, invasive species, and fishing pressure. The abundance of both predator and prey species as well as fishing pressure will factor into lobster condition, mortality, and stock status (Shackell et al., 2014; Le Bris et al., 2018). A population that is shifting due to warming temperatures can be further constrained if key lower trophic level prey species are not available within the new range. This can occur as these short-lived species have a stronger capacity to adapt to change, and thus may not require range shifts to cope with warming temperatures (Friedland et al., 2018). Le Bris et al. (2018) observed that in southwest New England (the southern limit of the range), shell disease has made a significant contribution the collapse of the stock; however, alongside rising temperatures in the Gulf of Maine, fishing practices that protect the more fecund females (and are not practiced in southwest New England), combined with the removal of key predators through other fisheries led to a boom in population. Overall, effective fishery management will require dynamic and regionally tailored planning with constant consideration of border issues and interactions between compounding factors, this can be supported with ongoing monitoring and collaboration with science.
The overall projected changes in offshore lobster habitat for the region are positive. Nonetheless, to promote the prolonged sustainability of this stock these changes should still be considered in resource management. As the population shifts toward the northeast, it will become less abundant around its southwest limit. Through the identification of areas where changes in lobster populations are projected to occur alongside regional vulnerabilities to climate change, the tool presented here can help inform decisions on locations where adaptation planning strategies may need to be developed and or implemented. This could involve preparing a region for changes in potential catch, through adjustments in licensing and quotas, preparing to adapt to a decrease in productivity by encouraging/assisting fishers to diversify (i.e., where they fish, targeted species, to non-fisheries-related income), or supporting projected increases in catch through the investment in upgrades and upkeep of coastal infrastructure where needed Finally, it is important that management anticipate and prepare to adapt to changes as a lag in updates to regulatory constraints (such as licensing and quotas) can lead to an unrepresentative fishing footprint which can lead to overfishing or economic struggles for license holders (Pinsky and Fogarty, 2012; Mills et al., 2013). The LFA borders within the DFO Maritimes Region impose constraints on the fishing industry and present challenges as a warming ocean increases productivity in areas such as LFA 41, which currently has a single license holder.
Climate-induced ocean warming is leading to an accelerated redistribution of marine species catch potential (Cheung et al., 2010; Pinsky and Fogarty, 2012; Poloczanska et al., 2013). Regulations and resources will limit the fishing industry's ability to adapt to changes in stock availability. If fishers are accustomed to long distance fishing trips, they can reroute to follow the stock. Nonetheless, depending on the extent of the range shift, borders may become a limiting factor, and if they do not have the resources to follow range shifts, or if there is a drop in abundance, they will be forced to adapt their practice and target new species which will be accompanied by more overhead costs (Pinsky and Fogarty, 2012). Knowing how animals will shift distribution, and what to do about shifts across management borders, both regional, and international will be critical to their plans (Link et al., 2011). Considerations of climate change are not common in stock assessment models. Tanaka et al. (2019a) combined American lobster recruitment dynamics with spatio-temporal variability in habitat suitability, and demonstrated how the inclusion of dynamic environmental variables can improve the performance of a stock assessment model. Here, we present a tool for anticipating change, that could potentially be incorporated into stock assessment models and help fishers and resources managers with long term planning.
Conclusions
The results of this study highlight the importance of coastal adaptation planning, and flexible fisheries management that is capable of making adjustments in a dynamic environment impacted by climate change. This assessment which integrates information on coastal community and lobster vulnerability provides both a framework and information for further in-depth analyses by climate change adaptation planners and fishery managers. In the USA, the NOAA Climate Change Science Strategy is being used to guide development of regional action plans. The fact that our study focused on one commercial species in one DFO administrative region points to the need for additional research in this area, as has been highlighted in the adaptation and resilience pillar of the Pan-Canadian Framework on Clear Growth and Climate Change. The integrative approach presented in this paper can be adapted for other species (commercial, depleted, etc.) to help support management and planning decisions.
Data Availability
The raw data supporting the conclusions of this manuscript will be made available by the authors, without undue reservation, to any qualified researcher.
Author Contributions
BG, NS, KF, PG, and ACog contributed to the development of the concept, analysis of the data, and writing of this paper. DB, ZW, and VS provided the future ocean climate model projections and contributed to writing those sections of the paper related to this. ACoo contributed to the interpretation of lobster thermal habitat model and provided general background on the lobster biology and fishery. CB provided zooplankton data and model analysis and contributed to writing related sections of the paper.
Funding
This research was funded by Fisheries and Oceans Canada through the Aquatic Climate Change Adaptation Services Program (ACCASP).
Conflict of Interest Statement
The authors declare that the research was conducted in the absence of any commercial or financial relationships that could be construed as a potential conflict of interest.
Acknowledgments
The authors would like to thank Dr. Jamie Tam and two reviewers for their generous and useful suggestions on an earlier text that improved the paper.
Supplementary Material
The Supplementary Material for this article can be found online at: https://www.frontiersin.org/articles/10.3389/fmars.2019.00579/full#supplementary-material
Figure S1. Comparison of BNAM and CM2.6: seasonal changes in bottom temperature from two ocean models. The magnitude of temperature change varies between models, so they have been plotted on different color scales, however, overall patterns are similar. (A) Projected change in summer (July, August, and September) bottom temperature (BNAM). (B) Projected change in summer bottom temperature (CM2.6). (C) Projected change in winter (January, February, and March) bottom temperature (BNAM). (D) Projected change in summer bottom temperature (CM2.6).
Figure S2. The Coastal Infrastructure Vulnerability Index (CIVI) for Small Craft Harbor locations. The scoring of 1(low vulnerability) to 5 (high vulnerability) has been grouped into three categories and then presented in the pie charts for each Lobster Fishing Area (LFA).
Figure S3. Sub-indices of the Coastal Infrastructure Vulnerability Index (CIVI) for Small Craft Harbor locations are as follows: (1) Environmental Sub-Index (ESI), (2) Infrastructure Sub-Index (ISI), and (3) Socio-Economic Sub-Index (SESI). The scoring of 1 (low vulnerability) to 5 (high vulnerability) has been grouped into three categories and then presented in the pie charts for each Lobster Fishing Area (LFA).
Abbreviations
BNAM, Bedford Institute of Oceanography (BIO) North Atlantic Model; CIVI, Coastal Infrastructure Vulnerability Index; CM2. 6, NOAA Geophysical Fluid Dynamics Laboratory's Climate Model 2.6; DFO, Department of Fisheries and Oceans; ESI, Exposure Sub-Index; ISI, Infrastructure Sub-Index; LFA, Lobster Fishing Area; LVI, Lobster Vulnerability Index; NOAA, National Oceanographic and Atmospheric Administration; SCH, Small Craft Habors; SESI, Socio-Economic Sub-Index; SVD, Species Value Diversity.
References
Aiken, D. E., and Waddy, S. L. (1986). Environmental influence on recruitment of the american lobster, Homarus americanus: a perspective. Can. J. Fish. Aquat. Sci. 43, 2258–2270. doi: 10.1139/f86-277
ASMFC (2015). Atlantic States Marine Fisheries Commission (ASMFC) American Lobster Benchmark Stock Assessment and Peer-review Report. Washington, DC: Atlantic States Marine Fisheries Commission. 493.
Bernier, R. Y., Jamieson, R. E., and Moore, A. M. (eds.). (2018). State of the Atlantic Ocean Synthesis Report. Canadian Technical Report of Fisheries and Aquatic Sciences 3167, iii, 149.
Boudreau, S. A., Anderson, S. C., and Worm, B. (2015). Top-down and bottom-up forces interact at thermal range extremes on American lobster. J. Anim. Ecol. 84, 840–850. doi: 10.1111/1365-2656.12322
Brennan, C. E., Maps, F., Gentleman, W. C., Plourde, S., Lavoie, D., Chassé, J., et al. (2019). How transport shapes copepod distributions in relation to whale feeding habitat: demonstration of a new modelling framework. Prog. Oceanogr. 171, 1–21. doi: 10.1016/j.pocean.2018.12.005
Brickman, D., Hebert, D., and Wang, Z. (2018). Mechanism for the recent ocean warming events on the Scotian shelf of eastern Canada. Cont. Shelf Res. 156, 11–22. doi: 10.1016/j.csr.2018.01.001
Brickman, D., Wang, Z., and DeTracey, B. (2015): Variability of current streams in Atlantic Canadian waters: a model study. Atmos. Ocean 54, 218–229. doi: 10.1080/07055900.2015.1094026
Brickman, D., Wang, Z., and Detracey, B. (2016). High resolution future climate ocean model simulations for the Northwest Atlantic Shelf region. Can. Tech. Rep. Hydrogr. Ocean Sci. 315, xiv, 143. Available online at: http://publications.gc.ca/pub?id=9.823975&sl=0
Carloni, J. T., Wahle, R., Geoghegan, P., and Bjorkstedt, E. (2018). Bridging the spawner-recruit disconnect: trends in American lobster recruitment linked to the pelagic food web. Bull. Mar. Sci. 94, 719–735. doi: 10.5343/bms.2017.1150
Castro, K. M., Factor, J. R., Angell, T., and Landers, D. F. (2006). The conceptual approach to lobster shell disease revisited. J. Crustacean Biol. 26, 646–660. doi: 10.1651/S-2761a.1
Cheng, L., Trenberth, K. E., Fasullo, J., Boyer, T., Abraham, J., and Zhu, J. (2017). Improved estimates of ocean heat content from 1960 to 2015. Sci. Adv. 3, 1–11. doi: 10.1126/sciadv.1601545
Cheung, W. W. L., Lam, V. W. Y., Sarmiento, J. L., Kearney, K., Watson, R., Zeller, D., et al. (2010). Large-scale redistribution of maximum fisheries catch potential in the global ocean under climate change. Glob. Chang. Biol. 16, 24–35. doi: 10.1111/j.1365-2486.2009.01995.x
Cogswell, A., Greenan, B. J. W., and Greyson, P. (2018). Evaluation of two common vulnerability index calculation methods. Ocean Coast. Manag. 160, 46–51. doi: 10.1016/j.ocecoaman.2018.03.041
Colburn, L., Jepson, M., Weng, C., Seara, T., and Weiss, J. (2016). Indicators of climate change and social vulnerability in fishing department communities along the Eastern and Gulf coasts of the U.S. Mar. Policy 74, 323–333. doi: 10.1016/j.marpol.2016.04.030
Cook, A. M., Cassista Da-Ros, M., and Denton, C. (2017). Framework Assessment of the Offshore American Lobster (Homarus americanus) in Lobster Fishing Area (LFA) 41. DFO Canadian Science Advisory Secretariat (CSAS), research document 2017/065. viii + 186.
Correia, S., Glenn, R., Howell, P., Jacobson, L., and Wilson, C. (2006). American Lobster Stock Assessment for Peer Review. Stock Assessment Report No. 06-03 (Supplement), Atlantic States Marine Fisheries Commission, 366. Available online at: https://www.asmfc.org/uploads/file/americanLobsterStockAssessmentReport06.pdf
Devine, L., Scarratt, M., Plourde, S., Galbraith, P. S., Michaud, S., and Lehoux, C. (2017). Chemical and Biological Oceanographic Conditions in the Estuary and Gulf of St.Lawrence During 2015. DFO Canadian Science Advisory Secretariat (CSAS), research document 2017/034, 48. Available online at: http://publications.gc.ca/pub?id=9.837481&sl=0
DFO (2009). Assessment of American Lobster in Newfoundland. DFO Canadian Science Advisory Secretariat (CSAS), research document 2009/026. Available online at: https://waves-vagues.dfo-mpo.gc.ca/Library/336989.pdf
DFO (2018). Seafisheries: 2016 Value of Atlantic Coast Commercial Landings, by Region (Thousand Dollars). Available online at: http://dfo-mpo.gc.ca/stats/commercial/land-debarq/sea-maritimes/s2016av-eng.htm (accessed January 1, 2019).
Fogarty, M. J., Incze, L. S., Wahle, R. A., Mountain, D., Robinson, A., Hayhoe, K., et al. (2007). Potential climate change impacts on marine resources of the northeastern United States. Northeast Clim. Impacts Assess. Tech. Ser. 1–33. Available online at: https://www.ucsusa.org/sites/default/files/legacy/assets/documents/global_warming/pdf/miti/fogarty_et_al.pdf
Friedland, K. D., McManus, M. C., Morse, R. E., and Link, J. S. (2018). Event scale and persistent drivers of fish and macroinvertebrate distributions on the Northeast US Shelf. ICES J. Mar. Sci. fsy167. doi: 10.1093/icesjms/fsy167
Fulton, R. J. (1995). Surficial Materials of Canada / Matériaux superficiels du Canada. Geological Survey of Canada, Map 1880A, 1 sheet. doi: 10.4095/205040
Glenn, R. P., and Pugh, T. L. (2006). Epizootic shell disease in American lobster (Homarus americanus) in Massachusetts coastal waters: interactions of temperature, maturity, and intermolt duratio. J. Crustacean Biol. 26, 639–645. doi: 10.1651/S-2754.1
Greenan, B. J. W., Cogswell, A., Greyson, P., Jean, D., Cloutier, M., Bird, E., et al. (2018a). Small Craft Harbours Coastal Infrastructure Vulnerability Index Pilot Project. Canadian Technical Report of Fisheries and Aquatic Sciences 3245, xiv + 73.
Greenan, B. J. W., James, T. S., Loder, J. W., Pepin, P., Azetsu-Scott, K., Ianson, D., et al. (2018b). “Chapter 7: Changes in oceans surrounding Canada,” in Canada's Changing Climate Report, eds Bush and Lemmen (Ottawa, ON: Government of Canada, 343–423.
Griffies, S. M., Biastoch, A., Böning, C., Bryan, F., Danabasoglu, G., Chassignet, E. P., et al. (2009). Coordinated Ocean-ice Reference Experiments (COREs). Ocean Model. 26, 1–46. doi: 10.1016/j.ocemod.2008.08.007
Hare, J. A., Morrison, W. E., Nelson, M. W., Stachura, M. M., Teeters, E. J., Griffis, R. B., et al. (2016). A vulnerability assessment of fish and invertebrates to climate change on the northeast U.S. continental shelf. PLoS ONE 11: e0146756. doi: 10.1371/journal.pone.0146756
IPCC (2014). “Summary for policymakers,” in Climate Change 2014: Impacts, Adaptation, and Vulnerability. Part A: Global and Sectoral Aspects. Contribution of Working Group II to the Fifth Assessment Report of the Intergovernmental Panel on Climate Change, eds C. B. Field, V. R. Barros, D. J. Dokken, K. J. Mach, M. D. Mastrandrea, T. E. Bilir, et al. (Cambridge; New York, NY: Cambridge University Press, 1–32.
Jewett, L., and Romanou, A. (2017). “Ocean acidification and other ocean changes,” in Climate Science Special Report: Fourth National Climate Assessment, Vol. I, eds D. J. Wuebbles, D. W. Fahey, K. A. Hibbard, D. J. Dokken, B. C. Stewart, and T. K. Maycock (Washington, DC: U.S. Global Change Research Program), 364–392. doi: 10.7930/J0QV3JQB
Johnson, C. L., Devred, E., Casault, B., Head, E., and Spry, J. (2018). Optical, Chemical, and Biological Oceanographic Conditions on the Scotian Shelf and in the Eastern Gulf of Maine in 2016. DFO Canadian Science Advisory Secretariat (CSAS), research document 2018/017, v + 58. Available at: https://waves-vagues.dfo-mpo.gc.ca/Library/362284.pdf
Kleisner, K. M., Fogarty, M. J., McGee, S., Barnett, A., Fratantoni, P., Greene, J., et al. (2016). The effects of sub-regional climate velocity on the distribution and spatial extent of marine species assemblages. PLoS ONE 11:e0149220. doi: 10.1371/journal.pone.0149220
Kleisner, K. M., Fogarty, M. J., McGee, S., Hare, J. A., Moret, S., Perretti, C. T., et al. (2017). Marine species distribution shifts on the U.S. Northeast Continental Shelf under continued ocean warming. Prog. Oceanogr. 153, 24–36. doi: 10.1016/j.pocean.2017.04.001
Lawton, P., and Lavalli, K. L. (1995). “Postlarval, juvenile, adolescent, and adult ecology,” in Biology of the Lobster, Homarus americanus, ed J. R. Factor (New York, NY: Academic Press), 47–88. doi: 10.1016/B978-012247570-2/50026-8
Le Bris, A., Mills, K. E., Wahle, R. A., Chen, Y., Alexander, M. A., Allyn, A. J., et al. (2018). Climate vulnerability and resilience in the most valuable North American fishery. Proc. Natl. Acad. Sci. U.S.A. 115, 1831–1836. doi: 10.1073/pnas.1711122115
Link, J. S., Nye, J. A., and Hare, J. A. (2011). Guidelines for incorporating fish distribution shifts into a fisheries management context. Fish Fish. 12, 461–469. doi: 10.1111/j.1467-2979.2010.00398.x
Lowen, J. B., and DiBacco, C. (2017). Distributional changes in a guild of non-indigenous tunicates in the NW Atlantic under high-resolution climate projections. Mar. Ecol. Prog. Ser. 570, 173–186. doi: 10.3354/meps12077
Meinshausen, M., Smith, S. J., Calvin, K., Daniel, J. S., and Kainuma, M. L. T. (2011). The RCP greenhouse gas concentrations and their extensions from 1765 to 2300. Clim. Change 109, 213–241. doi: 10.1007/s10584-011-0156-z
Meyer-Gutbrod, E., Greene, C., and Davies, K. (2018). Marine species range shifts necessitate advanced policy planning: the case of the North Atlantic right whale. Oceanography 31, 19–23. doi: 10.5670/oceanog.2018.209
Mills, K. E., Pershing, A. J., Brown, C., Chen, Y., Chiang, F.-S., Holland, D. S., et al. (2013). Fisheries management in a changing climate: lessons from the 2012 ocean heat wave in the Northwest Atlantic. Oceanography 26, 191–195. doi: 10.5670/oceanog.2013.27
Oliver, E. C. J., Donat, M. G., Burrows, M. T., Moore, P. J., Smale, D. A., Alexander, L. V., et al. (2018). Longer and more frequent marine heatwaves over the past century. Nat. Commun. 9:1324. doi: 10.1038/s41467-018-03732-9
Perretti, C. T., Fogarty, M. J., Friedland, K. D., Hare, J. A., Lucey, S. M., McBride, R. S., et al. (2017). Regime shifts in fish recruitment on the Northeast US Continental Shelf. Mar. Ecol. Prog. Ser. 574, 1–11. doi: 10.3354/meps12183
Pielou, E. C. (1996). The measurement of diversity in different types of biological collections. J. Theor. Biol. 13, 131–144. doi: 10.1016/0022-5193(66)90013-0
Pinsky, M. L., and Fogarty, M. (2012). Lagged social-ecological responses to climate and range shifts in fisheries. Clim. Change 15, 883–891. doi: 10.1007/s10584-012-0599-x
Poloczanska, E. S., Brown, C. J., Sydeman, W. J., Kiessling, W., Schoeman, D. S., and Moore, P. J. (2013). Global imprint of climate change on marine life. Nat. Clim. Change 3, 919–925. doi: 10.1038/nclimate1958
R Core Team. (2018). R: A Language and Environment for Statistical Computing. Vienna: R Foundation for Statistical Computing. Available online at: https://www.R-project.org/
Rascle, N., and Ardhuin, F. (2013). A global wave parameter database for geophysical applications. Part 2 : model validation with improved source term parameterization. Ocean Model. 70, 174–188. doi: 10.1016/j.ocemod.2012.12.001
Rascle, N., Ardhuin, F., Queffeulou, P., and Croizé-fillon, D. (2008). A global wave parameter database for geophysical applications. Part 1 : wave-current – turbulence interaction parameters for the open ocean based on traditional parameterizations. Ocean Model. 25, 154–171. doi: 10.1016/j.ocemod.2008.07.006
Record, N. R., Balch, W. M., and Stamieszkin, K. (2019a). Century-scale changes in phytoplankton phenology in the Gulf of Maine. PeerJ. 7:e6735. doi: 10.7717/peerj.6735
Record, N. R., Runge, J. A., Pendleton, D. E., Balch, W. M., Davies, K. T. A., Pershing, A. J., et al. (2019b). Rapid climate-driven circulation changes threaten conservation of endangered North Atlantic right whales. Oceanography 32, 162–169. doi: 10.5670/oceanog.2019.201
Reed, D., Plourde, S., Cook, A., Pepin, P., Casault, B., Lehoux, C., et al. (2018). Response of Scotian Shelf silver hake (Merluccius bilinearis) to environmental variability. Fish. Oceanogr. 28, 256–272. doi: 10.1111/fog.12406
Rheuban, J. E., Kavanaugh, M. T., and Doney, S. C. (2017). Implications of future northwest Atlantic bottom temperatures on the American lobster (Homarus americanus) fishery. J. Geophys. Res. Oceans 122, 9387–9398. doi: 10.1002/2017JC012949
Saba, V. S., Griffies, S. M., Anderson, W. G., Winton, M., Alexander, M. A., Delworth, T. L., et al. (2016). Enhanced warming of the Northwest Atlantic Ocean under climate change. J. Geophys. Res. Oceans 121, 118–132. doi: 10.1002/2015JC011346
Saha, S., Moorthi, S., Pan, H., Wu, X., Wang, J., Nadiga, S., et al. (2010). The NCEP climate forecast system reanalysis. Bull. Amer. Meteor. Soc. 91, 1015–1057. doi: 10.1175/2010BAMS3001.1
Shackell, N. L., Ferguson, K. J., den Heyer, C. E., Brickman, D., Wang, Z., and Ransier, K. T. (2019). Growing degree-day influences growth rate and length of maturity of Northwest Atlantic halibut (Hippoglossus hippoglussus L.) across the southern stock domain. J. Northw. Atlan. Fish. Sci. 50, 25–35. doi: 10.2960/J.v50.m716
Shackell, N. L., Ricard, D., and Stortini, C. (2014). Thermal habitat index of many Northwest Atlantic temperate species stays neutral under warming projected for 2030 but changes radically by 2060. PLoS ONE 9:e90662. doi: 10.1371/journal.pone.0090662
Smale, D. A., Wernberg, T., Oliver, E. C. J., Thomsen, M., Harvey, B. P., Straub, S. C., et al. (2019). Marine heatwaves threaten global biodiversity and the provision of ecosystem services. Nat. Clim. Chang 9, 306–312. doi: 10.1038/s41558-019-0412-1
Smolowitz, R., Chistoserdov, A. Y., and Hsu, A. (2005). A description of the pathology of epizootic shsell disease in the American lobster, Homarus americanus, H. Milne Edwards 1837. J. Shellfish Res. 24, 749–756. doi: 10.2983/0730-8000(2005)24[749:ADOTPO]2.0.CO;2
Sorte, C. J., Williams, S. L., and Zerebecki, R. A. (2010). Ocean warming increases threat of invasive species in a marine fouling community. Ecol. Soc. Am. 91, 2198–2204. doi: 10.1890/10-0238.1
Stanley, R., DiBacco, R. E., Lowen, C., Beiko, B., Jeffery, R. G., Wyngaarden, N., et al. (2018). A climate-associated multispecies cryptic cline in the northwest Atlantic. Sci. Adv. 4:eaaq0929. doi: 10.1126/sciadv.aaq0929
Staudinger, M. D., Mills, K. E., Stamieszkin, K., Record, N. R., Hudak, C. A., Allyn, A., et al. (2019). It's about time: a synthesis of changing phenology in the Gulf of Maine ecosystem. Fish. Oceanogr. 2019, 1–34. doi: 10.1111/fog.12429
Stortini, C. H., Chabot, D., and Shackell, N. L. (2017). Marine species in ambient low-oxygen regions subject to double jeopardy impacts of climate change. Glob. Change Biol. 23, 2284–2296. doi: 10.1111/gcb.13534
Stortini, C. H., Shackell, N. L., Tyedmers, P., and Beazley, K. (2015). Assessing marine species vulnerability to projected warming on the Scotian Shelf, Canada. ICES J. Mar. Sci. 72, 1731–1743. doi: 10.1093/icesjms/fsv022
Tanaka, K. R., Cao, J., Shank, B. V., Truesdell, S. B., Mazur, M. D., Xu, L., et al. (2019a). A model-based approach to incorporate environmental variability into assessment of a commercial fishery : a case study with the American lobster fishery in the Gulf of Maine and Georges Bank. ICES J. Mar. Sci. doi: 10.1093/icesjms/fsz024
Tanaka, K. R., Chang, J., Xue, Y., Li, Z., Jacobson, L., and Chen, Y. (2019b). Mesoscale climatic impacts on the distribution of Homarus americanus in the US inshore Gulf of Maine. Can. J. Fish. Aquat. Sci. 76, 608–625. doi: 10.1139/cjfas-2018-0075
Tlusty, M. F., and Metzler, A. (2012). Relationship between temperature and shell disease in laboratory populations of juvenile American lobsters (Homarus americanus). J. Shellfish Res. 31, 533–541. doi: 10.2983/035.031.0213
Wang, Z., Brickman, D., Greenan, B. J., and Yashayaev, I. (2016). An abrupt shift in the labrador current system in relation to winter NAO events. J. Geophys. Res. Oceans 121, 5338–5349. doi: 10.1002/2016JC011721
Wernberg, T., Russell, B. D., Moore, P. J., Ling, S. D., Smale, D. A., Campbell, A., et al. (2011). Impacts of climate change in a global hotspot for temperate marine biodiversity and ocean warming. J. Exp. Mar. Biol. Ecol. 400, 7–16. doi: 10.1016/j.jembe.2011.02.021
Wheeler, J. O., Hoffman, P. F., Card, K. D., Davidson, A., Sanford, B. V., Okulitch, A. V., et al. (1996). Geological Map of Canada / Carte Géologique du Canada. Geological Survey of Canada, Map 1860A, 1 sheet. ID: 208175. doi: 10.4095/208175
Wood, S. N. (2004). Stable and efficient multiple smoothing parameter estimation for generalized additive models. J. Am. Stat. Assoc. 99, 673–686. doi: 10.1198/016214504000000980
Wood, S. N. (2017). Generalized Additive Models: An Introduction with R (2nd edition). New York, NY: Chapman and Hall/CRC. 496.
Keywords: climate change, lobster, thermal habitat, coastal vulnerability, harbor infrastructure, climate projections, fishery management
Citation: Greenan BJW, Shackell NL, Ferguson K, Greyson P, Cogswell A, Brickman D, Wang Z, Cook A, Brennan CE and Saba VS (2019) Climate Change Vulnerability of American Lobster Fishing Communities in Atlantic Canada. Front. Mar. Sci. 6:579. doi: 10.3389/fmars.2019.00579
Received: 30 April 2019; Accepted: 30 August 2019;
Published: 13 September 2019.
Edited by:
Elizabeth A. Fulton, Commonwealth Scientific and Industrial Research Organisation (CSIRO), AustraliaReviewed by:
Kate Barclay, University of Technology Sydney, AustraliaChristopher James Brown, Griffith University, Australia
Copyright © 2019 Greenan, Shackell, Ferguson, Greyson, Cogswell, Brickman, Wang, Cook, Brennan and Saba. This is an open-access article distributed under the terms of the Creative Commons Attribution License (CC BY). The use, distribution or reproduction in other forums is permitted, provided the original author(s) and the copyright owner(s) are credited and that the original publication in this journal is cited, in accordance with accepted academic practice. No use, distribution or reproduction is permitted which does not comply with these terms.
*Correspondence: Blair J. W. Greenan, blair.greenan@dfo-mpo.gc.ca