Relationship Between Carbon- and Oxygen-Based Primary Productivity in the Arctic Ocean, Svalbard Archipelago
 Marina Sanz-Martín1,2
  María Vernet3*
  Mattias R. Cape4
  Elena Mesa5
  Antonio Delgado-Huertas5
  Marit Reigstad6
  Paul Wassmann6
  Carlos M. Duarte7,8
- 1Instituto Mediterráneo de Estudios Avanzados (IMEDEA-CSIC-UIB), Esporles, Spain
- 2Facultad de Geología, Universitat de Barcelona, Barcelona, Spain
- 3Scripps Institution of Oceanography, University of California, San Diego, La Jolla, CA, United States
- 4School of Oceanography, University of Washington, Seattle, WA, United States
- 5Instituto Andaluz de Ciencias de la Tierra (IACT-CSIC-UGR), Armilla, Spain
- 6Institute of Arctic and Marine Biology, UiT The Arctic University of Norway, Tromsø, Norway
- 7Red Sea Research Center, King Abdullah University of Science and Technology, Thuwal, Saudi Arabia
- 8Department of Bioscience, Arctic Research Centre, Aarhus University, Arhus, Denmark
Phytoplankton contribute half of the primary production (PP) in the biosphere and are the major source of energy for the Arctic Ocean ecosystem. While PP measurements are therefore fundamental to our understanding of marine biogeochemical cycling, the extent to which current methods provide a definitive estimate of this process remains uncertain given differences in their underlying approaches, and assumptions. This is especially the case in the Arctic Ocean, a region of the planet undergoing rapid evolution as a result of climate change, yet where PP measurements are sparse. In this study, we compared three common methods for estimating PP in the European Arctic Ocean: (1) production of 18O-labeled oxygen (GPP-18O), (2) changes in dissolved oxygen (GPP-DO), and (3) incorporation rates of 14C-labeled carbon into particulate organic carbon (14C-POC) and into total organic carbon (14C-TOC, the sum of dissolved and particulate organic carbon). Results show that PP rates derived using oxygen methods showed good agreement across season and were strongly positively correlated. While also strongly correlated, higher scatter associated with seasonal changes was observed between 14C-POC and 14C-TOC. The 14C-TOC-derived rates were, on average, approximately 50% of the oxygen-based estimates. However, the relationship between these estimates changed seasonally. In May, during a spring bloom of Phaeocystis sp., 14C-TOC was 52% and 50% of GPP-DO, and GPP-18O, respectively, while in August, during post-bloom conditions dominated by flagellates, 14C-TOC was 125% of GPP-DO, and 14C-TOC was 175% of GPP-18O. Varying relationship between C and O rates may be the result of varying importance of respiration, where C-based rates estimate net primary production (NPP) and O-based rates estimate gross primary production (GPP). However, uncertainty remains in this comparison, given differing assumptions of the methods and the photosynthetic quotients. The median O:C ratio of 4.75 in May is within the range of that observed for other regions of the world’s ocean. However, the median O:C ratio for August is <1, lower than in any other reported region. Our results suggest further research is needed to estimate O:C in Arctic waters, and at different times of the seasonal cycle.
Introduction
Plankton photosynthesis contributes half of the primary production (PP) in the biosphere (Field et al., 1998) and is the main source of carbon for the Arctic Ocean food web (Matrai et al., 2013). Because photosynthesis is a fundamental process affecting, either directly or indirectly, the functioning of marine ecosystems, from their capacity to take up atmospheric CO2 to the distribution and breeding success of higher trophic levels, quantification of PP has long been a core measurement in biological oceanography (Robinson et al., 2009; Regaudie-de-Gioux et al., 2014). Measurements of PP over the last decades, both remote and in situ, have provided critical insight into the spatial and temporal variability of phytoplankton growth in the Arctic. Although the Arctic Ocean is strongly seasonal, some of its regions rank among the most productive in the oceans (Gosselin et al., 1997; Tremblay et al., 2002; Vaquer-Sunyer et al., 2013), which results in high pelagic and benthic secondary production (Grebmeier and Mcroy, 1989; Grebmeier et al., 2006, 2013). While recent modeling and remote sensing studies have also suggested climate-driven changes in the rates of PP in the Arctic (Pabi et al., 2008; Slagstad et al., 2015; Kahru, 2017), methodological differences in PP measurements nevertheless introduce uncertainty in these future projections. To evaluate PP responses, appropriate estimations and evaluations of PP based on comparable methods are fundamental (Robinson et al., 2009; Regaudie-de-Gioux et al., 2014). Until a consensus is reached or an unambiguous method is developed, comparisons between measurements originating from different methods can provide insight on the ecological and physiological processes involved as well as help constrain the uncertainties (Robinson et al., 2009; Regaudie-de-Gioux et al., 2014).
Three primary methods have historically been used to estimate planktonic PP, each with different underlying assumptions. Gross photosynthesis (or gross primary production rate, GPP) estimates the total photosynthetic rate before any losses, like phytoplankton respiration. GPP has been quantified using two oxygen-based methods as the photosynthetic production of 18O from 18O-labeled water additions (GPP-18O) as well as using the Dissolved Oxygen method. The determination of GPP-18O through mass spectrometry, which measures the O2 produced during a 24-h incubation (Bender et al., 1987), has previously been identified as the best approach to estimate GPP (Regaudie-de-Gioux et al., 2014). However, not all the oxygen-producing metabolic processes measured with the 18O method are directly related to carbon assimilation (Bender et al., 1999; Laws et al., 2000; Dickson et al., 2001; Marra, 2002). The Dissolved Oxygen method (Carpenter, 1995), on the other hand, measures the change in dissolved oxygen in light/dark incubations over 24 h. In this case, GPP, (hereafter GPP-DO) is derived by summing the rate of change of oxygen in dark bottles (an estimate of community respiration, CR) and that in clear bottles (an estimate of net community production, NCP) (Carritt and Carpenter, 1966; Duarte et al., 2011). This procedure assumes that respiration in the dark is the same as that in the light. Recent studies have shown that this assumption may not hold in the Arctic Ocean during spring and summer, where 24-h daylight lead to increased respiration rates (Mesa et al., 2017).
The third and most widely used method to resolve plankton PP is the 14C method (Steemann-Nielsen, 1952), which traces the incorporation of inorganic carbon into live phytoplankton cells, or particulate organic carbon (14C-POC). This method can also be used to track the release of recently incorporated 14C as dissolved organic carbon (14C-DOC). The total carbon incorporation by the 14C method is 14C-TOC, the sum of 14C-POC and 14C-DOC. High variability in incubation times has resulted in significant uncertainty as to how to interpret 14C rate measurements. In daily incubations, 14C-POC is expected to reflect net primary production (14C-NPP) (Marra, 2002, 2009). NPP rates may account for a minimum of ∼35% of GPP-18O in 24-h incubations (Bender et al., 1996; Duarte and Cebrián, 1996) and about 48% of GPP-DO in short incubations, as a consequence of losses attributed to algal respiration, and DOC production (Del Giorgio and Duarte, 2002).
Comparison of estimates derived from these various methods have led to a wide range of carbon uptake estimates across spatial scales (Robinson et al., 2009; Regaudie-de-Gioux et al., 2014). While in previous studies in the North Pacific, the Dissolved Oxygen and the 18O methods provided similar estimates of GPP (Grande et al., 1989b), in global comparisons (Robinson et al., 2009; Regaudie-de-Gioux et al., 2014), as well as in the Arctic Ocean (Mesa et al., 2017), the GPP-18O estimates were higher than GPP-DO. In contrast, 18O values can be significantly lower than GPP-DO rates in nutrient-rich areas with low dissolved oxygen concentrations (Gazeau et al., 2007). This large variability indicates that the ability of methods to estimate PP is dependent on environmental conditions, and the use of multiple methods has been recommended as a regional solution (Robinson et al., 2009).
Comparisons between the C-based method and the O2-based methods have indicated lower rates of 14C incorporation than O2 production (Robinson et al., 2009; Regaudie-de-Gioux et al., 2014). These discrepancies are likely due to variability in the assumed photosynthetic quotient (PQ), a critical parameter quantifying the amount of oxygen evolved per unit of photosynthetically fixed carbon into organic matter. PQ values range widely, from 1.0 to 1.8, with values 1.0 to 1.4 in non-polar oceanic areas (e.g., Bender et al., 1987; Grande et al., 1989b; Laws et al., 2000; Dickson et al., 2001) and from 1.1 to 1.8 in the Southern Ocean (i.e., Williams et al., 1979; Aristegui et al., 1996; Robinson et al., 1999). Although no PQ value has been derived for the Arctic Ocean, a value of 1.25, proposed by Williams et al. (1979), has been widely applied in this region to convert O2 molar stoichiometry units into C (i.e., Vaquer-Sunyer et al., 2013; Duarte and Agustí, 1998). However, PQ = 1 is also frequently considered when comparing C and O2-based PP rates (Duarte et al., 2011; Regaudie-de-Gioux et al., 2014).
Historically, 14C-POC measurements have primarily been collected across the Arctic Ocean, with O2-based rates collected only in select regions (Matrai et al., 2013). Average 14C-POC rates in Arctic surface waters, compiled over 50 years (1954–2007), are 70 and 21 mg C m-3 d-1 in spring and summer, respectively (Matrai et al., 2013). By comparison, O2-based GPP-DO productivity rates of surface waters, collected in the European sector of the Arctic between 2007 and 2011, average 168 and 55 mg C m-3 d-1 in spring and summer, respectively (Vaquer-Sunyer et al., 2013), twofold higher than those derived for 14C-POC rates. Whether these differences are due to spatial gradients or temporal changes in the system, or a result of bias in the methods of measurement remains unknown due to a lack of comparison between concurrent C-based and O2-based measurements of PP in Arctic waters.
In this study, we report on rates of PP derived using 14C, Dissolved Oxygen, and 18O methods in the northwestern Svalbard Archipelago in the European Arctic and focus on comparing these rates. We also consider the pathways of carbon and oxygen within the plankton and provide an assessment of the ecological and physiological processes underlying the methods’ assumptions. We aim to facilitate future PP studies in the region and to highlight improvements needed in order to interpret results from the various methods in the Arctic Ocean ecosystems.
Materials and Methods
Sampling
Two cruises were conducted in the north and northwestern Svalbard region during May and August 2014 aboard R/V Helmer Hanssen (Figure 1). Our aim was to analyze the underlying assumptions of primary productivity rate measurements through two different pathways: the carbon assimilation and the oxygen production. In order to achieve this, we measured PP rates in 24-h incubations using three different methods (the 14C method, the Dissolved Oxygen method, and the 18O method). Although the cruise sampled six “P” stations, P6 was not included in this study as GPP-DO measurements are not available. Similarly, no sampling is available from P2 as this station was aborted due to loss of the mooring with the 14C incubations. Five remaining stations were occupied during the May cruise (P1, P3, P4, D1, and D6) and four remaining stations in the August cruise (P5, P7, D1, and D6), with sampling including hydrographic profiling with a calibrated Seabird 911plus CTD (conductivity, temperature, and depth). Discrete water samples for PP incubations were collected from CTD casts, for 14C rate measurement and oxygen measurements (DO and 18O). Seawater for PP analysis was sampled from the same cast at four stations (D1 and D6 in both May and August), while logistical constraints on hydrographic deployments forced collection of water from separate CTD casts at three stations (P1, P3, and P4) in May and two stations (P5 and P7) in August, with time lag between casts ranging from minutes to 32 h (see section “Sampling Time Lag” below). Seawater for all O2-based PP and for 14C at the D stations was sampled at the surface (1 or 3 m), the deep chlorophyll maximum layer (DCM) depth (20–30 m depending on stations), and an intermediate depth (10 or 15 m). Seawater for 14C–based PP determination at the P stations was sampled at 1–3, 5, 10, 15–20, and 25–30 m, with exact sampling depths varying depending on the presence and depth of the DCM. Rate measurements at a given station were matched by closest depths, with depth differences reaching a maximum of 3 m.
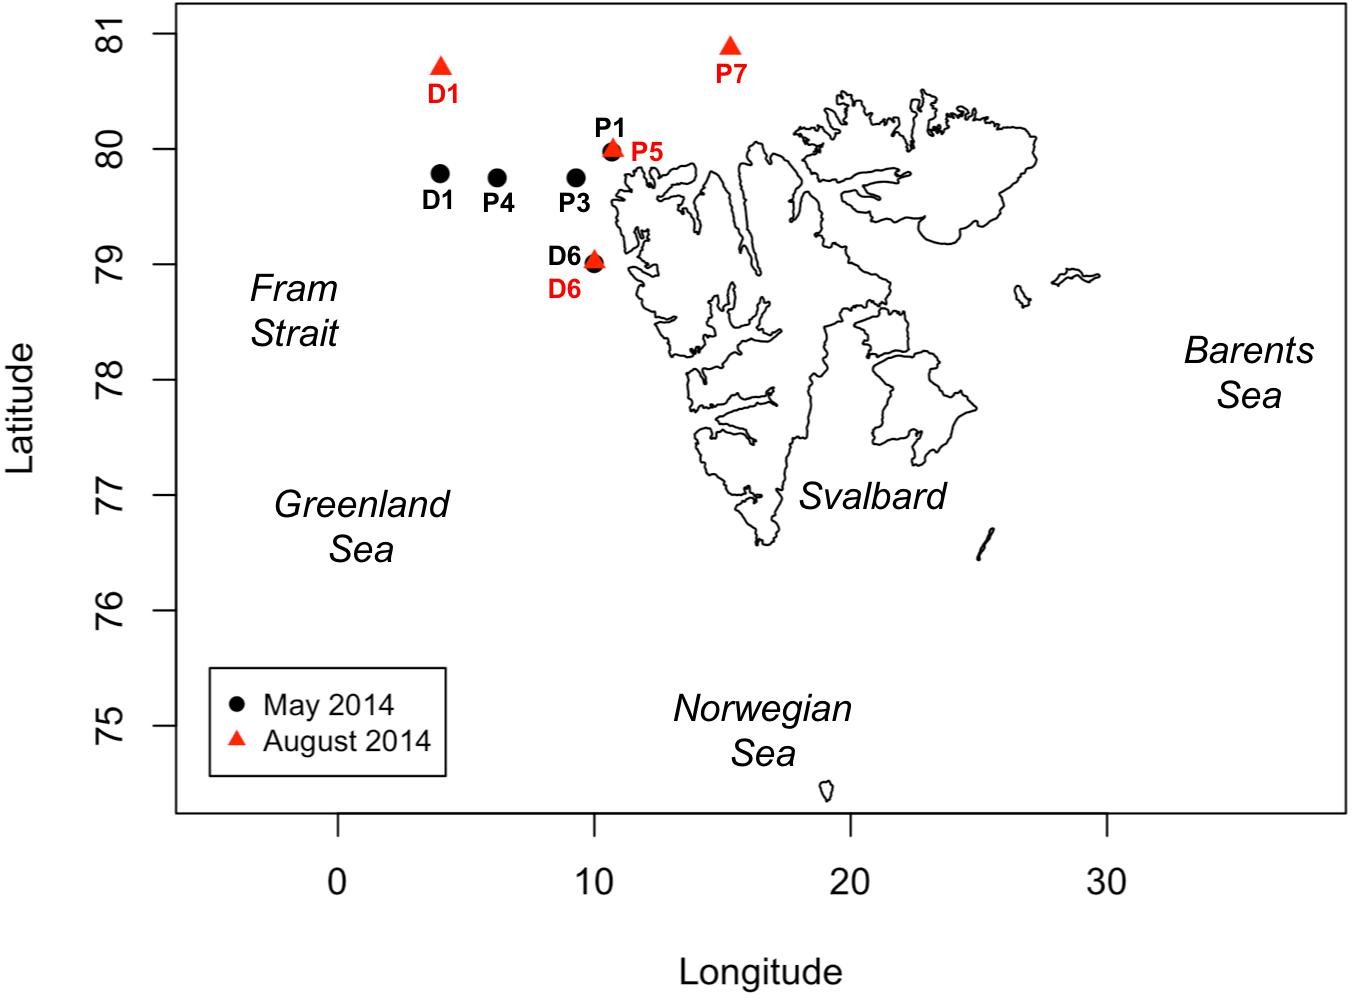
Figure 1. Map of the Svalbard Archipelago, showing the locations of sampling stations occupied in May (stations D1, D6, P1, P3, and P4, black dots) and August 2014 (stations D1, D6, P5 and P7, red triangles). Note that stations P2 and P6 are not included as no data was available for the analysis (see section “Materials and Methods”).
Primary Production Incubations
Primary production rates were measured using three methods: the 18O method (Bender et al., 1987), the Dissolved Oxygen method (Carpenter, 1995), and the 14C method (Steemann-Nielsen, 1952). Samples measured with O2 methods were incubated on deck with running seawater from the ship’s seawater intake (Supplementary Figure S1), following the incubation protocols used in previous studies (Regaudie-de-Gioux and Duarte, 2010; Vaquer-Sunyer et al., 2013; Holding et al., 2015; Garcia-Corral et al., 2016; Mesa et al., 2017). The seawater intake was at ∼6 m depth, within the mixed layer. Depending on the station, the mixed layer reached depths between 9 and 15 m (Randelhoff et al., 2018). For deep samples collected below the mixed layer, temperature differences between circulated water and in situ temperature ranged from 0.03°C to 4.5°C (Supplementary Figures S2, S3). Samples measured with the 14C method were incubated both on deck (D stations, Supplementary Figure S1), using the incubation system of the O2 samples, and in situ (P stations, see below for additional details).
The 18O Method
GPP-18O was measured as the photosynthetic production of 18O2 following the addition of H218O after 24 h incubations (Bender et al., 1987; Table 1). Samples were distributed into eight 12-ml vials, allowing them to overflow to avoid contamination with atmospheric O2. Borosilicate vials were ultraviolet A and B (UVA/B) opaque. Four replicate vials were immediately preserved with 100 μl of saturated mercury chloride (HgCl2) solution for further determination of natural δ18O in seawater and the vials stored inverted, in darkness. The other four replicate vials, containing glass beads, were labeled with 80 μl of 98% H218O and shaken to ensure mixing. The labeled samples were incubated for 24 h on deck in transparent methacrylate tubes that are also UVA/B opaque with flow-through surface seawater. To simulate light attenuation in the water column, methacrylate tubes were wrapped with screen. Screening resulted in an attenuation of 60, 33, and 25% of surface PAR for these bottles (as measured with a portable photosynthetically available radiation (PAR) radiometer, Biospherical Instruments Inc. QSL-101), equivalent to light levels at 1, 10, and 20–30 m depth (Randelhoff et al., 2018). After 24 h, incubation vials were spiked with 100 μl of saturated HgCl2 solution and stored for further analysis.
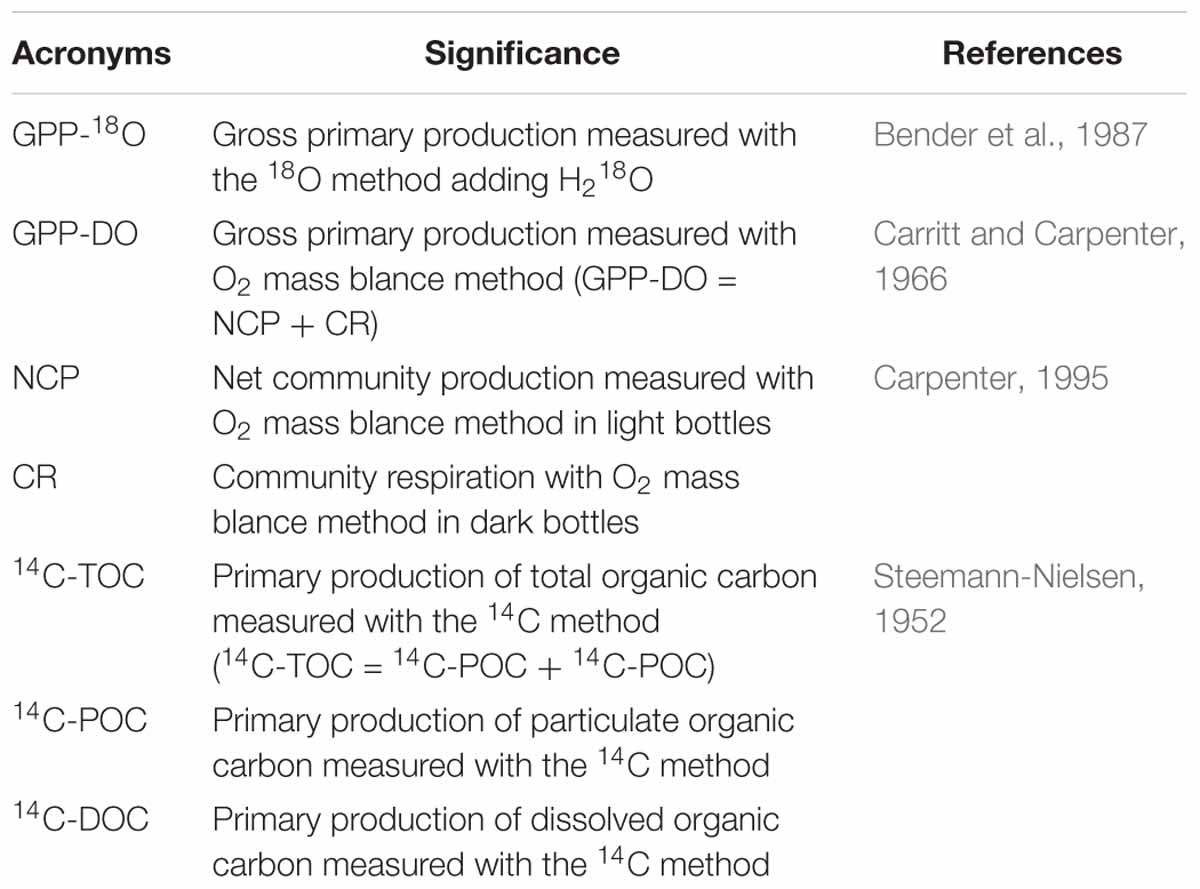
Table 1. Acronyms for primary production variables used in this study, including their definition and source.
Samples were analyzed 2 weeks later at the Stable-Isotope Laboratory in IACT-CSIC, Armilla, Spain. A 4-mL headspace with 100% Helium was generated in each vial and left for 24 h at room temperature, letting the dissolved gases in water equilibrate with the headspace. After 24 h, the δ18O of dissolved oxygen in the headspace was measured in a Finnigan GasBench II attached to a Finnigan DeltaPlusXP isotope ratio mass spectrometer. We used a gas bottle of oxygen as our internal standard and atmospheric air injected in helium vials as an external standard. The analysis of the δ18O of oxygen from the gas bottle had a standard deviation of 0.05%. Atmospheric air, which was measured following the same route as the samples, had a standard deviation of 0.2%. The flow was passed through a liquid nitrogen trap to remove water vapor before entering into the GasBench II. Molecules of O2 and N2 were separated in a Molecular Sieve 5Å chromatographic column. Corrected data with atmospheric air was reported as δ18O value (‰) relative to V-SMOW (Vienna Standard Mean Ocean Water) standard.
The δ18O (H2O) composition of labeled samples was measured in a liquid water isotope analyzer (Los Gatos Research), with precision of 0.2%. In order to avoid contamination of the analyzer with highly 18O-enriched H2O (≈ 3000‰), the labeled sample was diluted (approximately 1:20) with a laboratory standard of known isotopic composition. GPP-18O was calculated using the Eq. (1) from Bender et al. (1999):
Where GPP-18O, in units of mmol O2 m-3 d-1, is the gross PP measured with the 18O method, δ18Oinitial and δ18Ofinal are the initial and final δ18O of dissolved O2 (‰), respectively, δ18Owater is the δ18O of the labeled seawater (‰), [O2]initial is the initial O2 concentration (μmol O2 L-1) measured by high-precision Winkler titration (see below) and δt is the incubation time in days (d).
The Dissolved Oxygen Method
GPP-DO, an acronym previously applied for GPP evaluated with this method (i.e., Regaudie-de-Gioux et al., 2014), also called GP(O2), (i.e., Robinson et al., 2009) was calculated by solving the daily change in dissolved oxygen in equation GPP-DO = NCP + CRdark where NCP is net primary production and CRdark is community respiration in darkness, in units of mmol O2 m-3 d-1. NCP and CRdark were calculated by subtracting initial dissolved oxygen concentrations from the dissolved oxygen concentrations measured after 24-h incubation in light and dark conditions, respectively (Carritt and Carpenter, 1966; Carpenter, 1995; Table 1). For this incubation, water samples were distributed into 21 UVA/B opaque 100 mL narrow-mouth borosilicate Winkler bottles. Seven replicates were used to determine the initial oxygen concentration, and seven replicates were incubated in dark and seven in light for 24 h on deck. O2 concentrations were determined using an automatic titrator (808 Tritando, Metrohm) (Carritt and Carpenter, 1966; Carpenter, 1995), a potentiometric electrode and automated endpoint detection (Oudot et al., 1988). Values that reported O2 production in darkness (Pamatmat, 1997) were flagged as unreliable and discarded (Holding et al., 2013).
The 14C Method
Primary production using 14C method included estimates of particulate (14C-POC) and total (14C-TOC) organic carbon production in 24 h incubations (Steemann-Nielsen, 1952; Vernet et al., 1998; Table 1). Water samples were distributed in four UVA/B opaque 150-mL polycarbonate bottles. Treatments included 2 light bottles, 1 dark, and one Time Zero. Ten μCi of 14C-labeled bicarbonate was dispensed into each bottle, and the Time Zero filtered immediately. In addition, for each depth, a 100 μL aliquot was sampled into a 6-mL scintillation vial containing 0.1 mL 6N NaOH in order to estimate the initial 14C-bicarbonate concentration, or Specific Activity. In the P stations (Figure 1), samples were incubated in situ: light and dark bottles were hung from a line anchored to an ice floe and deployed for approximately 22 h. In D stations (Figure 1), samples were incubated on deck for 24 h, in UVA/B opaque methacrylate tubes (Plexiglas®), with surface water temperatures maintained with running seawater from the ship’s intake. To simulate light attenuation in the water column, screens covered the methacrylate tubes placed inside the incubator (Supplementary Figure S1). Light attenuation was simulated using screens as a % of the on-deck photosynthetically available irradiance (PAR), simulating 100, 50, 25, and 12% of surface PAR, respectively. Attenuation within the methacrylate tubes was quantified with a Biospherical Instruments Inc QSL-101. After 22–24 h, bottles for in situ or on deck incubations were recovered and sampled, keeping the bottles refrigerated. 200 μL of 20% HCl was dispensed into each 6-mL scintillation vial containing either a Whatman GF/F filter (for particulate, 14C-POC) or 2 mL of seawater (for total production, 14C-TOC) in order to release any inorganic 14C remaining in the sample. After 24 h, 5 ml of Ultima Gold (Perkin Elmer, United States) was added and the samples stored in the dark for further analysis. One week later, each vial was shaken and the 14C activity measured in a Perkin Elmer scintillation counter at the University of Tromsø. PP was calculated as 14C incorporation into the sample, measured in units of disintegrations per minute (DPM). The intensity of the signal is proportional to the beta particle emission from the 14C incorporated into the cells. The total C-based production rates were then calculated as:
where 14C-TOC is production or mg C m-3 d-1, DPML is disintegration per minute in the samples incubated in the light, DPMD is disintegration per minute for the samples incubated in the dark, Vol refers to the sample volume (100 ml filtered for POC, 2 ml seawater for TOC and 0.1 ml for determination of Specific Activity) and δt the incubation time in days (d). DIC or dissolved inorganic carbon was measured in every sample (see section “Dissolved Inorganic Carbon”). The value of 1.05 is the discrimination factor between incorporation of 14C and 12C. The 14C incorporation in the light bottle is thought to account both for biotic (i.e., photosynthesis and CaCO3 incorporation) and for abiotic (i.e., adsorption) processes (Banse, 1993). Adsorption processes were accounted for by the Time Zero bottle. The incorporation of 14C into CaCO3 is corrected by conversion to CO2 following 24-h acidification. Thus, 14C incorporation rates are corrected by subtracting the 14C incorporation in the dark bottle, accounting for biological 14C uptake that can occur outside photosynthesis, and yielding carbon uptake by photosynthesis. The C-based rates were obtained in weight units, mg C m-3 d-1, and divided by the molar mass of C (12 g/mol) to obtain final units of mmol C m-3 d-1.
Dissolved Inorganic Carbon
Samples for dissolved inorganic carbon (DIC) were measured at the Norwegian Polar Institute (M. Chierici, PI). Seawater for DIC analysis was collected from the same CTD casts as the water for C-based estimates. Seawater was sampled and distributed into 100-mL borosilicate bottles, which were then preserved with 20 μL of HgCl2 and stored in dark and cold until analysis. DIC was determined using gas extraction of the acidified sample followed by coulometric titration and photometric detection using a Versatile Instrument for the Determination of Titration carbonate (VINDTA 3C, Marianda, Germany) following the standard operating procedures from Dickson et al. (2007). Certified reference material provided by Dr. Andrew Dickson (Scripps Institution of Oceanography, University of California San Diego, La Jolla, CA, United States) was used to control accuracy of the analyses. The limit of detection is estimated at approximately 1.0 mg C m-3 d-1.
Volumetric and Integrated Primary Production Rates
Volumetric 14C and O2-based rates were estimated for each depth at every station, yielding a total of 21 volumetric rates for each method (data available in Supplementary Table S1). Units of volumetric rates are mmol C or O2 m-3 d-1. Integrated 14C and O2-based rates, integrated to a depth equal to the 90% of accumulated 14C-POC (which was significantly correlated with the euphotic depth; p-value < 0.05 and R2 = 0.85) were calculated from the volumetric rates by the quadratic method, where the volumetric value of PP at two consecutive depths were averaged and multiplied by the depth differential. The resulting units for integrated rates are in mmol C or O2 m-2 d-1. Details of euphotic zone depth calculations are described in Randelhoff et al. (2018).
Data Analysis
Primary production rates for each method were log10-transformed to meet the assumption of normality. Normality of data was tested using the Shapiro-Wilk test, appropriate for small sample size (Shapiro and Wilk, 1965), with p > 0.05 for volumetric and integrated rates within each method for the full dataset (i.e., aggregating both cruises; Supplementary Table S2). Despite the non-normal nature of the untransformed data, we present PP rates as scatterplots in both untransformed and transformed (i.e., log) space in order to facilitate comparison with results from previous studies (see section “Discussion” below).
Comparison between the 14C- and O2-based methods were performed for samples collected at similar depths (maximum difference of ∼3 m). Seawater for 14C and O2-based analysis was sampled with time lags between casts ranging from 4 to 32 h for stations P, and no time lag for stations D (i.e., they were sampled from the same CTD cast, Supplementary Figures S4, S5). Similarity in sampled water masses, considering time lag between casts, was examined by comparing cast temperature-salinity characteristics (Supplementary Figures S6, S7), with water masses as defined in Randelhoff et al. (2018) and references therein. While sampling at the majority of P stations indeed occurred within the same water mass, samples collected in P1 originated from different water masses (Supplementary Figure S6A). This station was subsequently omitted from the comparison analysis, resulting in a total of 19 rates ensembles across 8 stations (i.e., n = 19).
Relative contributions of factors (method, cruise, depth and casts) to variability in PP rates were assessed using ANOVA. Examination of scatterplots of log-transformed PP rates (see section “Results” below) suggested wider variance in May than in August within the factor “cruise” (i.e., season, May and August). Levene’s test within the factor season (using differences between observations and group median) rejected the null hypothesis of homoscedasticity between log-transformed PP rates in May and August [i.e., homogeneity of variances; F(1,74) = 9.76, p < 0.01]. By comparison, the assumption of homoscedasticity of log-transformed PP data held for methods, casts and depths (values not shown). To account for inhomogeneity of variances, relative contribution of factors to variability in PP rates was therefore assessed using a 4-way ANOVA (type II) using a heteroscedasticity-corrected coefficient covariance matrix, omitting interactions after insuring they were not significant (not shown). The analysis was run using the “car” package (Fox and Weisberg, 2011), implemented in R software version 1.0.44 (R Core Team, 2014). Given an assumption that neither time differences between cast nor depth were significant in explaining variability in the productivity data, we also ran a 2-way ANOVA analysis focusing on method and cruise (or season) alone, omitting casts and depth, using the same “car” package and in the same way as the 4-way ANOVA. This analysis was performed to independently confirm the results obtained by the 4-way ANOVA relative to differences between seasons.
Regression was applied to log10-transformed data, with a regression equation of the form:
Where PP1 and PP2 correspond to rates from two different PP methods (e.g., GPP-DO and 14C-TOC) and a and b are fitted intercept and slope parameters. Note that fitting this linear regression in log space is equivalent to fitting a power function in untransformed space:
Multivariate normality of the input data was assessed with the MVN package in R (Korkmaz et al., 2014). Assuming symmetry in the relationship between PP rates derived by the methods under consideration, reduced major axis regression (RMA) was employed to examine relationships between productivity rates (Legendre and Legendre, 1998) Statistical analyses were completed using the lmodel2 R package (Legendre, 2014). Estimates from the pooled data presented in this study were then compared to previous regressions derived from a global PP synthesis aimed at predicting O rates from C rates (Regaudie-de-Gioux et al., 2014).
Results
During May, PP rates based on GPP-18O and GPP-DO averaged 21.0 mmol O2 m-3 d-1 while the 14C-TOC averaged 10.7 mmol C m-3 d-1 (combined 14C uptake in particulate and dissolved carbon) (Figure 2 and Table 2). In August, PP rates based on GPP-18O and GPP-DO averaged 2.4 mmol O2 m-3 d-1 while the 14C-TOC was 3.5 mmol C m-3 d-1. Seasonally, the O2-based rates decreased ∼90% from May to August, while the 14C-based rates decreased ∼60% (Figure 2 and Table 2). Particularly in August, the 14C-TOC decreased 68% while 14C-POC decreased 48% from May. As a result, volumetric PP rates in May were approximately six times higher than in August while integrated rates were on average three times higher in May than in August, with variability among specific methods.
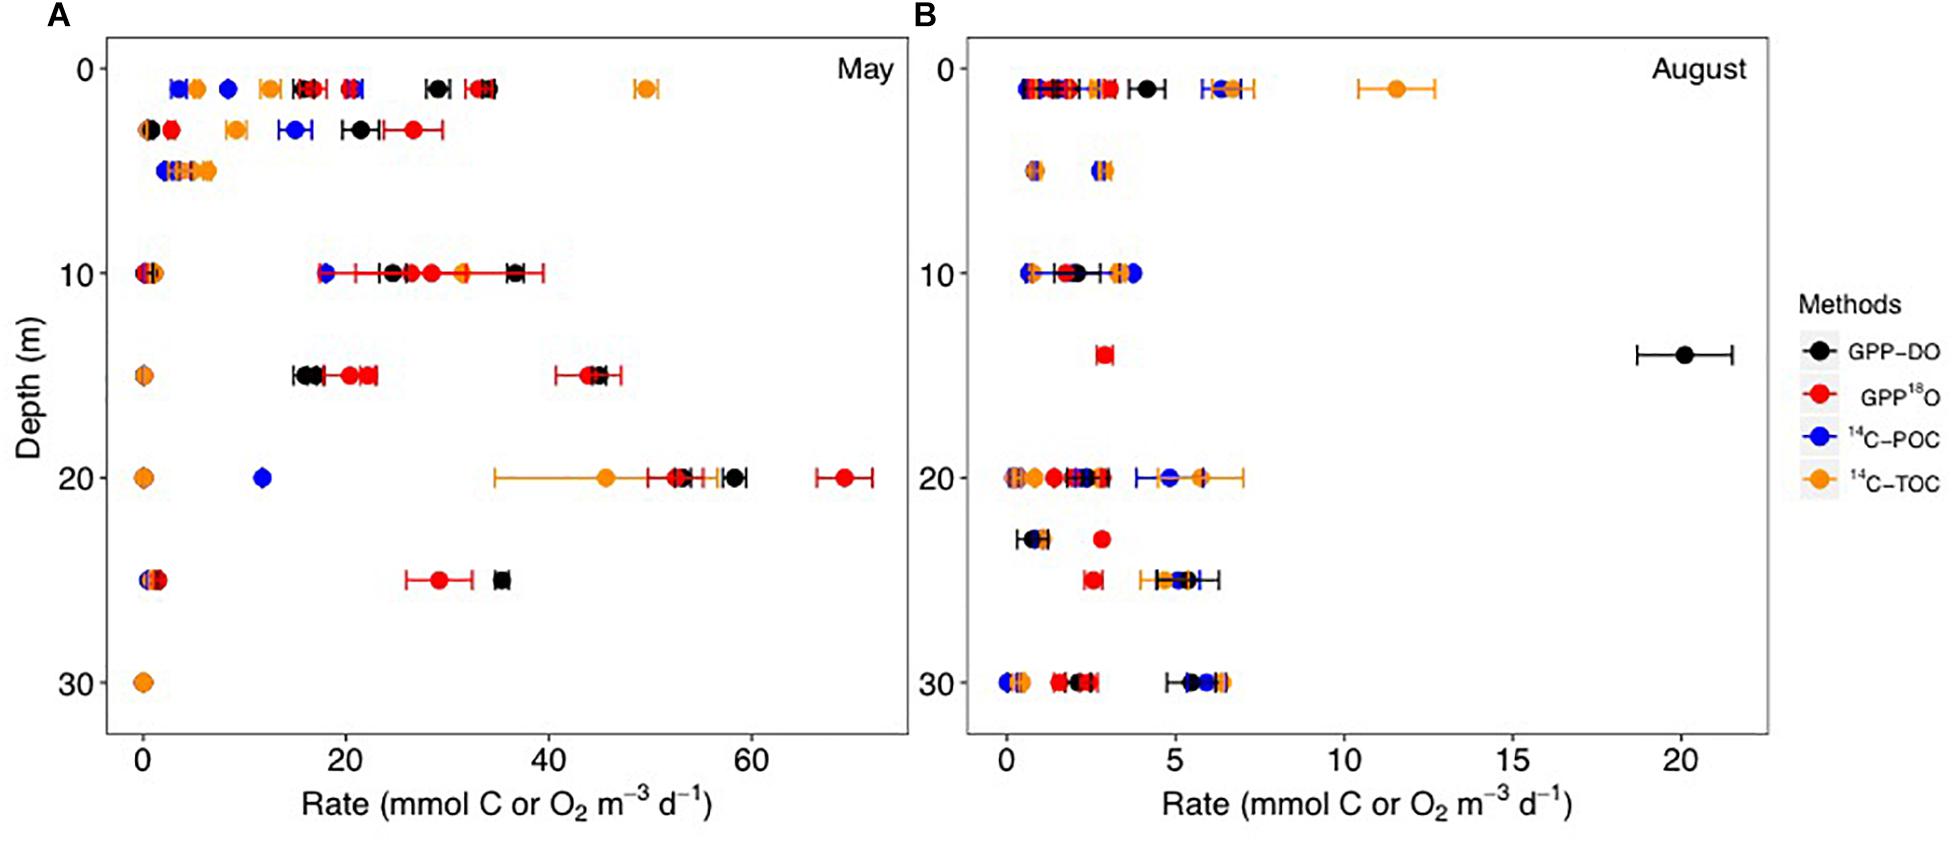
Figure 2. Volumetric primary production (PP) rates compared in this study during the May (A) and August (B) 2014 cruises for the GPP-DO (in black), GPP-18O (in red), 14C-POC (in blue), 14C-TOC methods (in orange) in mmol C, or O2 m-3 d-1. Locations shown in Figure 1. Symbols and error bars indicate average ± SE. Note change of rate scale.
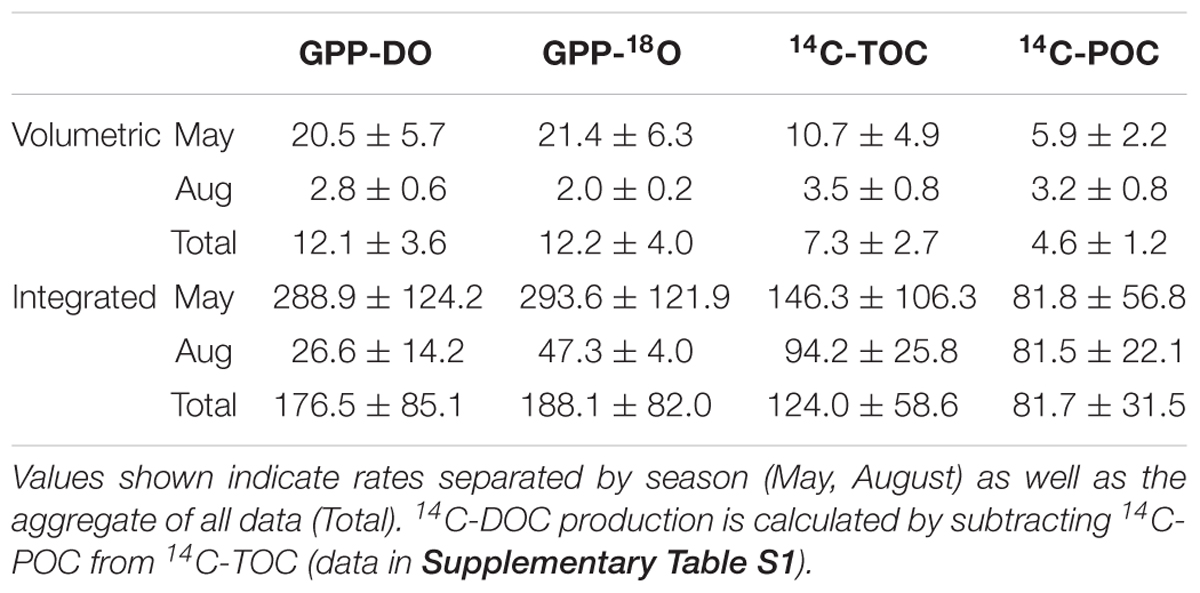
Table 2. Mean and standard error of the mean for volumetric and integrated rates of GPP-DO, GPP-18O, 14C-TOC, and 14C-POC in units mmol C or O2 m-3 d-1 for the volumetric rates and mmol C or O2 m-2 d-1 for the integrated rates.
For all data combined, our results indicate that volumetric 14C-TOC estimates were 40% of the oxygen-based GPP rates in the study region (calculated as the ratio of averages shown in Table 2). However, this relationship also varied seasonally. In May, 14C-TOC volumetric rates were on average 51% of the O2-based rates (Table 2). In August, 14C-TOC rates were on average 125% of the GPP-DO rates and 175% of the GPP-18O volumetric estimates. This relationship was also evident when examining scatterplots of the untransformed data (Figure 3) and O:C ratios (Figure 4), with O:C ratios in the spring generally higher than 1.25:1 and in some cases higher than 3:1, yet below 1:1 in the summer (see section “Photosynthetic Quotient” discussion below). On average for each season, the variability in O:C was larger in May than in August.
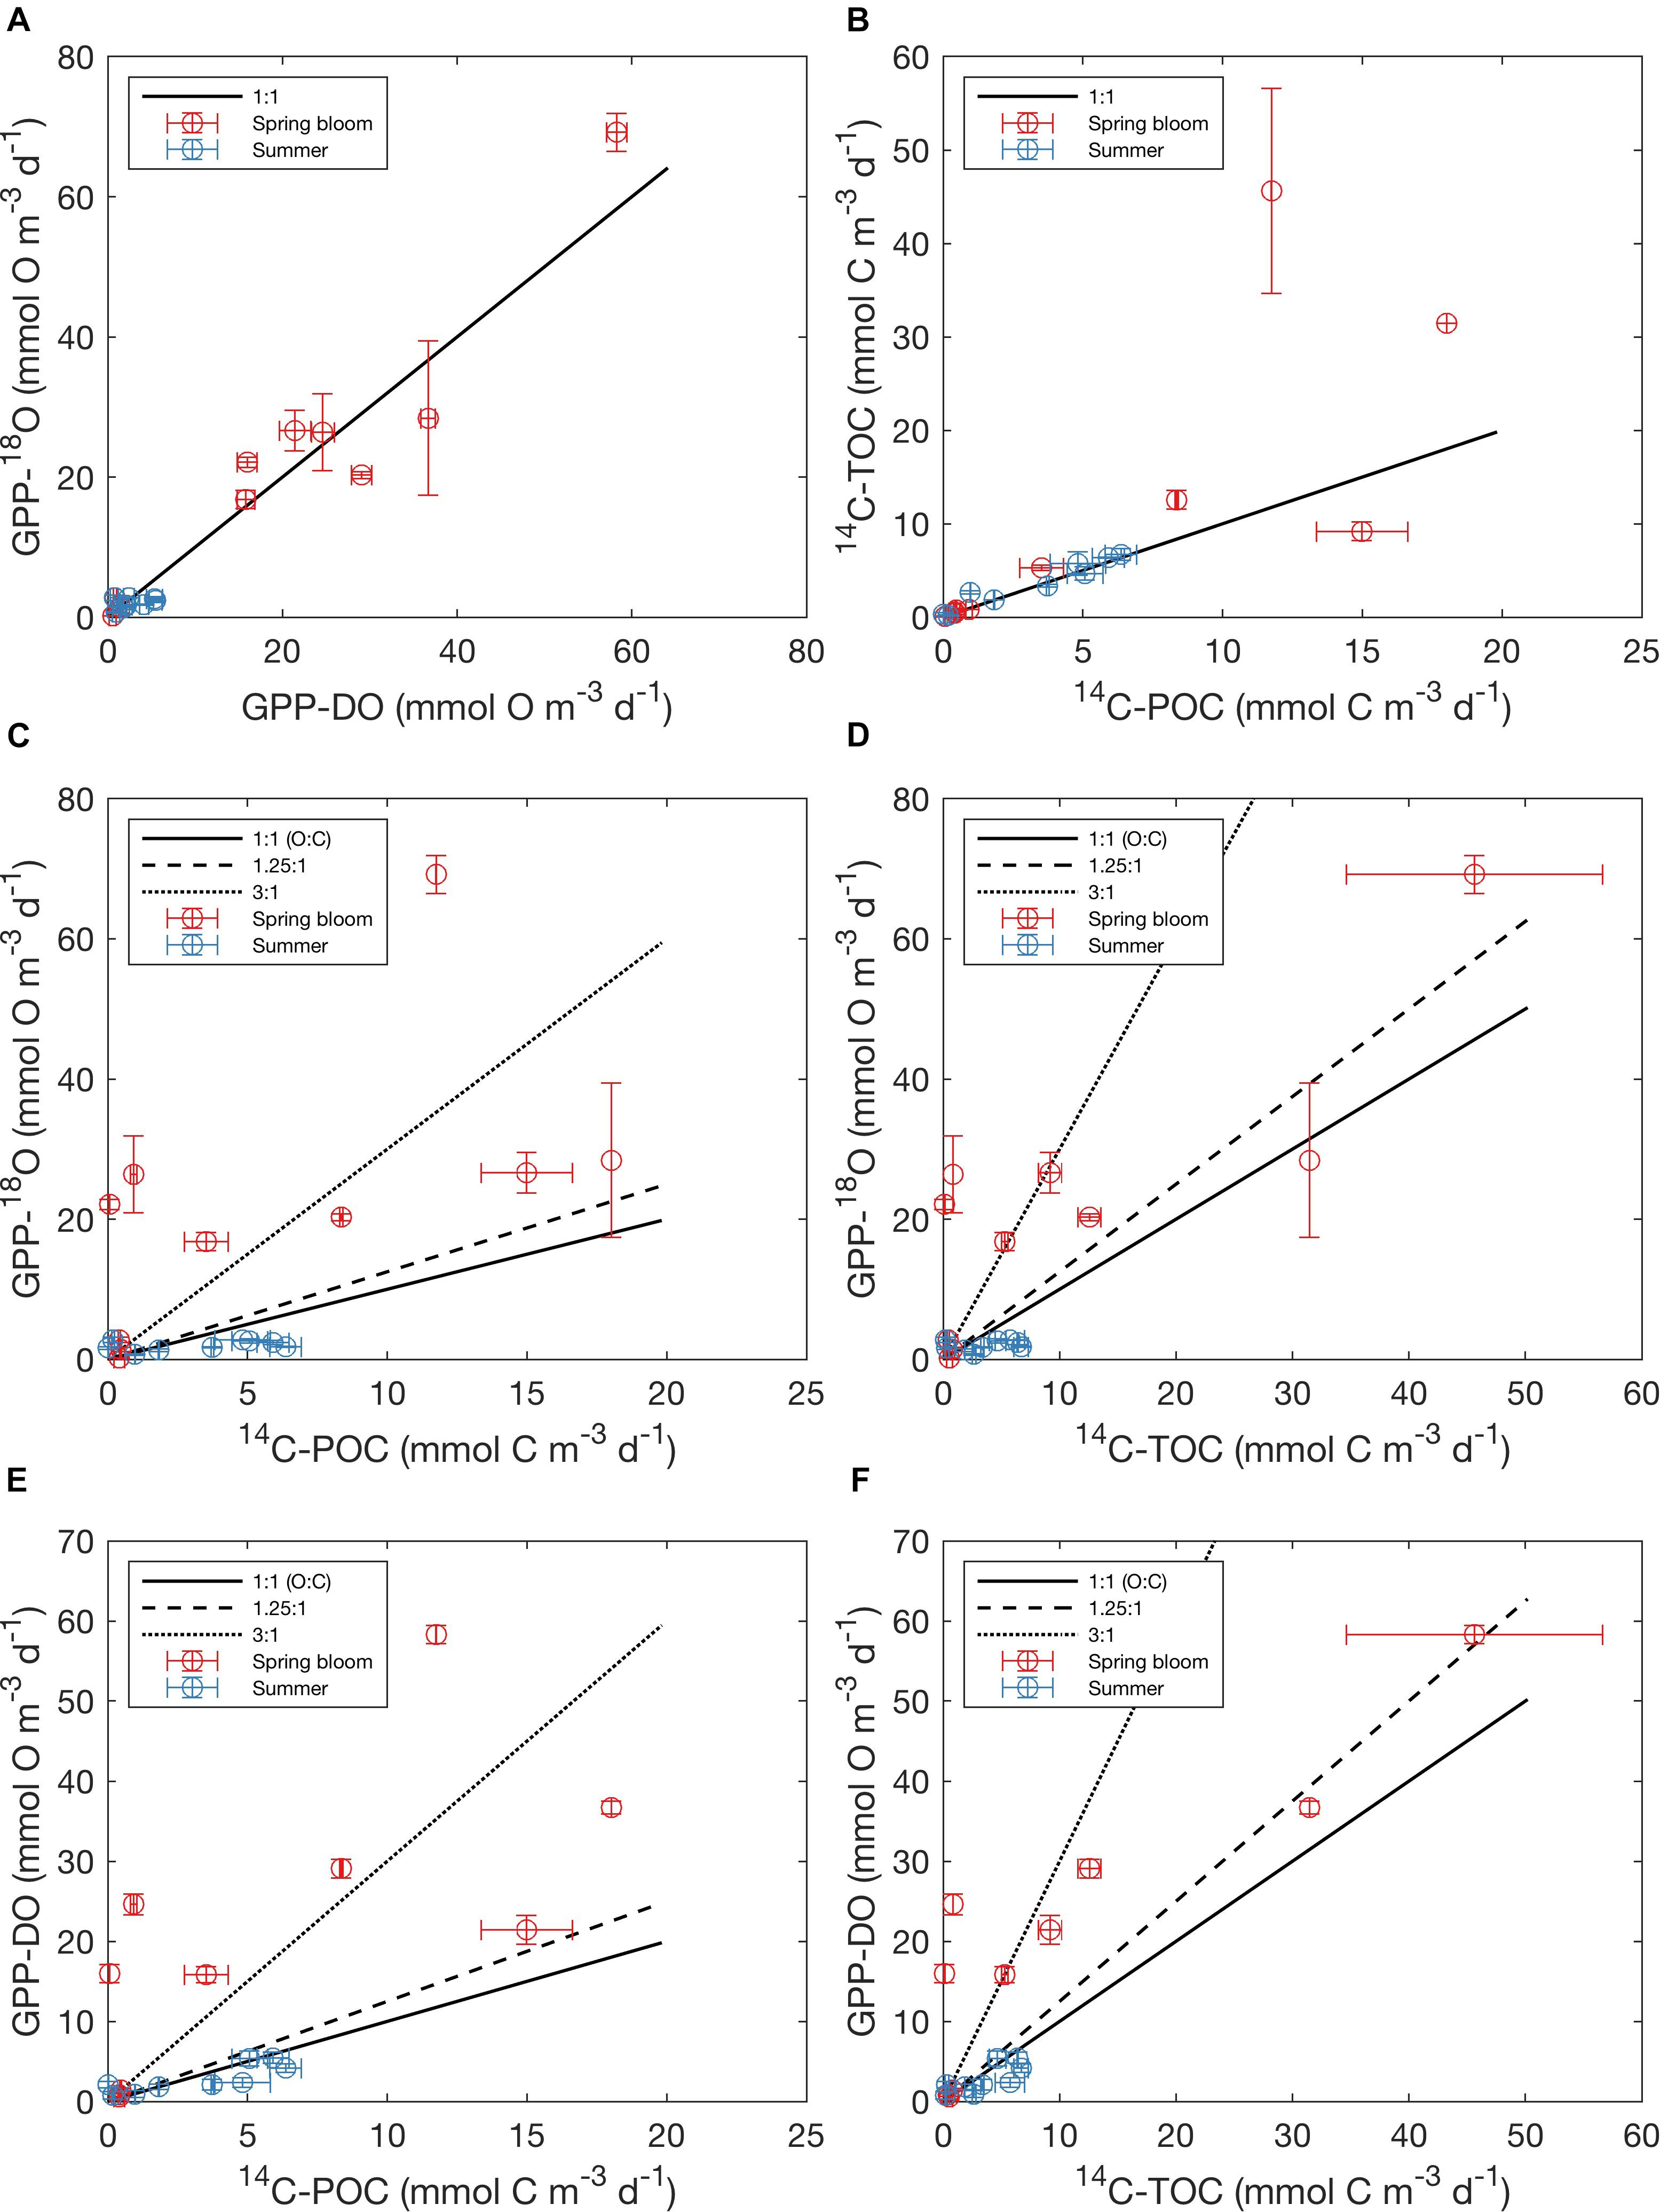
Figure 3. Relationship amongst O- and C-based primary production rates reported in this study, showing mean values (circles) and standard errors on both x and y (error bars). (A) GPP-18O vs. GPP-DO, (B) 14C-TOC vs. 14C-POC, (C) GPP-18O vs. 14C-POC, (D) GPP-18O vs. 14C-TOC, (E) GPP-DO vs. 14C-POC and (F) GPP-DO vs. 14C-TOC. Colors indicate sampling season (the spring bloom in May and summertime in August), with the solid black line indicating a 1:1 relationship, the dashed line 1.25:1, and the dotted line 3:1 (O:C). Note that the rates are untransformed and reported in native units (mmol O m-3 d-1 for oxygen and mmol C m-3 d-1 for carbon).
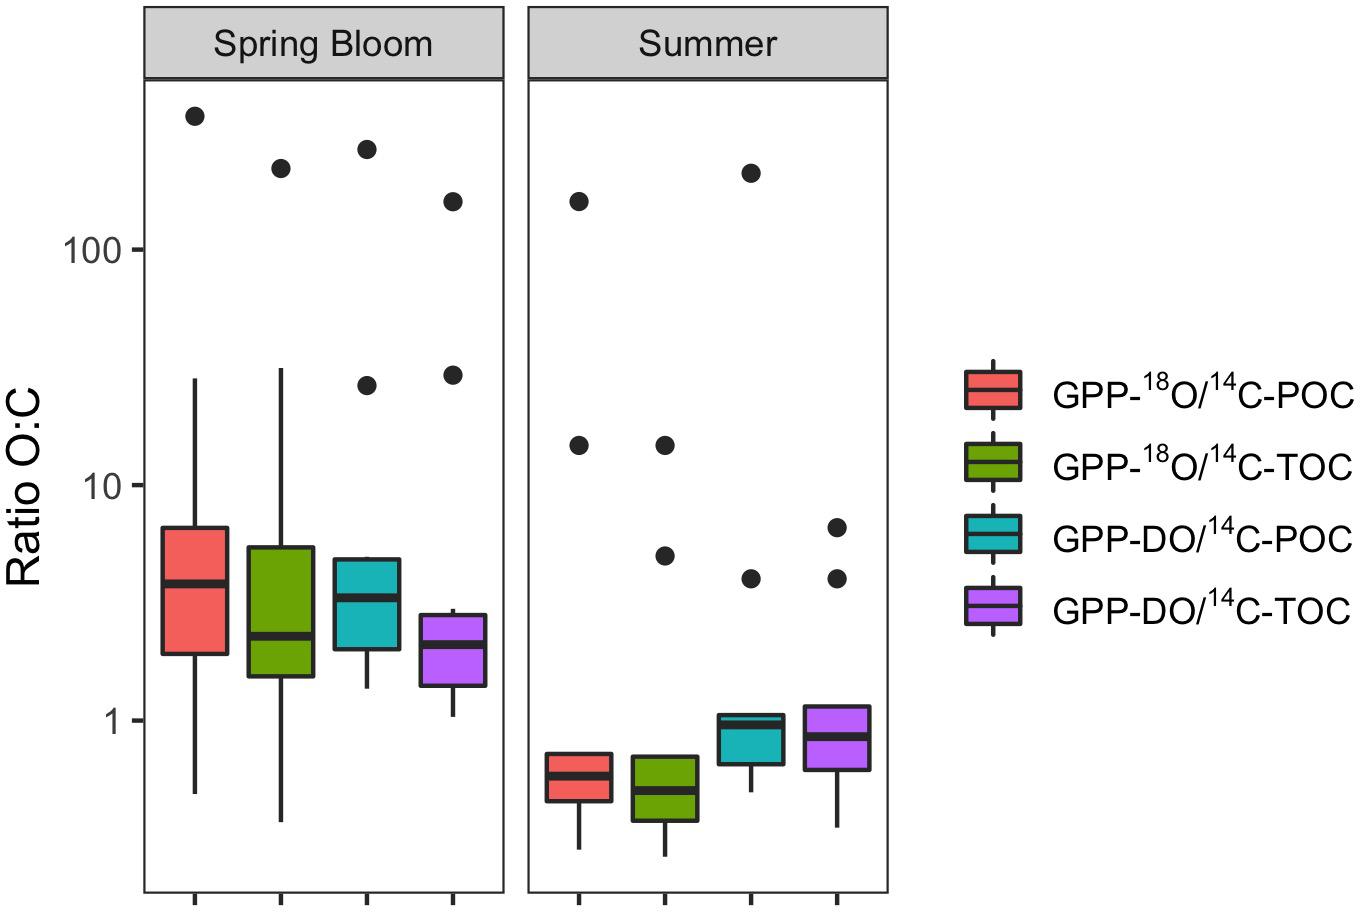
Figure 4. Box plots of O:C ratios of PP estimates, by season (May – spring bloom n = 10; August – summer n = 9). Box plot showing the median (horizontal line), as well as the 25 and 75th percentiles, with vertical lines going to extremes, and outliers denoted by points.
Considering all factors in a 4-way ANOVA, differences between rates of PP were statistically significant for cruise (i.e., season; F = 4.25, p < 0.05; Table 3 and Supplementary Figure S8). Considering only factors method and cruise in a 2-way ANOVA yielded a similar result, with differences between PP rates proving significant only for the latter, confirming results from 4-way ANOVA [F(3,71) = 0.17 and F(1,71) = 5.49, p < 0.05, respectively]. These results are consistent with those presented in Figures 3, 4, as well as Table 2, given the large variability within a particular method but larger seasonal differences in productivity rates. In summary, most of the variability in O:C ratios originates from the seasonal evolution of the phytoplankton community and to a lesser extent, the methods employed in measuring PP. However, examination of Table 2, where in some cases the distribution of the volumetric (and integrated) rates for different methods do not overlap, suggests that differences among methods cannot be discounted. Specifically, these observations, alongside difference in median O:C ratios presented in Figure 4 and regressions analyses (see below), suggest that an interaction between Method x Season is likely, and may not have been detected in ANOVA as a result of limitations of both dataset and statistical method.
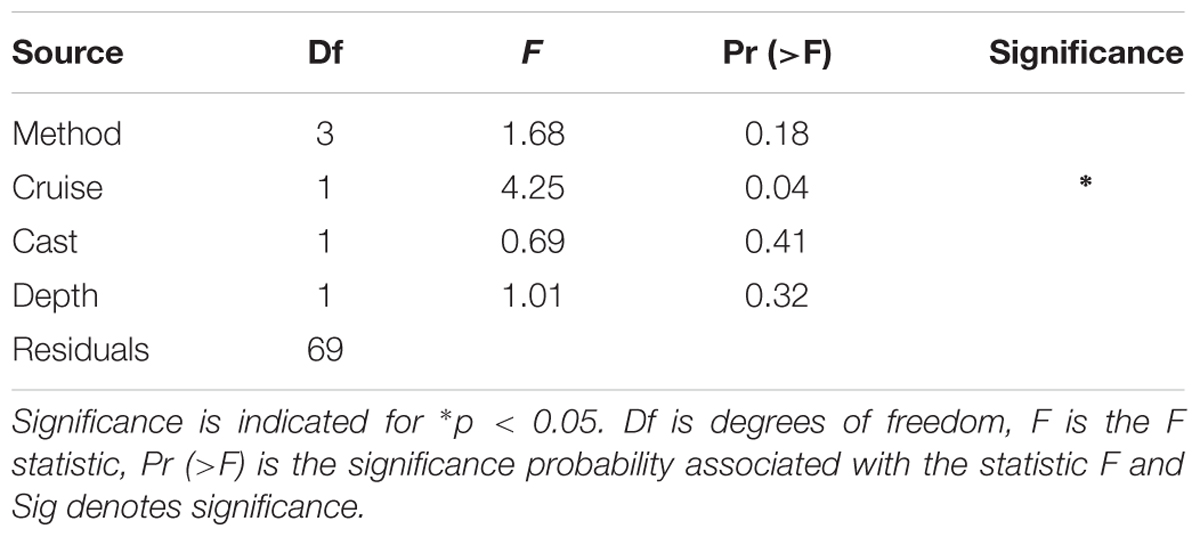
Table 3. Results of the 4-way (type II) ANOVA testing for significance of treatment by method, cruise (or season), cast, and depth for log10-transformed.
f) GPP-DO vs 14C-TOC.”
Regression of log-transformed PP rates serves to further highlight differences in the relationship between O and C rate estimates in aggregate, but also as a function of season, as well as differences between this Arctic dataset and previous global syntheses. While rates within a particular method class (i.e., C or O) fell approximately along the 1:1 line in log-log space (0.82 < r2 < 0.85, p < 0.01, Figures 5A,B and Supplementary Table S3), far more scatter was apparent when considering relationships across methods (Figures 5C–F), with O:C ratios amongst estimates for a particular sampling location sometimes exceeding a factor of 100 (identified as outliers in Figure 4). As observed in the untransformed data (Figure 3), higher variability was apparent during the spring bloom (May cruise) compared to summer (August cruise). While positive linear relationships between log O and log C rates were apparent, the relationships were sometimes weak (Figures 5C–F and Supplementary Table S3). Significant correlations were found for linear relationships between log-transformed oxygen and carbon rates (r = 0.92, p < 0.001 and r = 0.91, p < 0.001, respectively), as well as between C-based productivity rates and GPP-DO (r = 0.50, p < 0.05 and r = 0.58, p < 0.01 for 14C-POC and 14C-TOC, respectively). Confidence intervals on the slope in log-log regressions (i.e., the power slope “b” in Eqs 3 and 4) included 1 (one) in all cases (Supplementary Table S3). While this suggests an isometric relationship in untransformed (i.e., O:C) space, this result may also be a consequence of the tendency of RMA slopes to tend to 1 for weak linear relationships (Legendre and Legendre, 1998). In several cases, fitted intercepts “a” were however significantly different from 0 (i.e., for 14C-POC vs. 14C-TOC, 14C-POC vs. GPP-18O, 14C-POC vs. GPP-DO, and 14C-TOC vs. GPP-DO; Supplementary Table S3). Linear relationships derived for log O and log C PP rates from a previous global data synthesis (Regaudie-de-Gioux et al., 2014), while reasonable within O and C methods (Figures 5A,B), also proved a poor fit to the data when comparing methods. In summary, the data demonstrate that there is a large source of variability in these relationships as a function of season, further confirmed when PP methods are compared by cruise (Supplementary Figure S9) and that a global conversion equation likely is a poor fit to specific regions in the ocean, including in this case the Arctic.
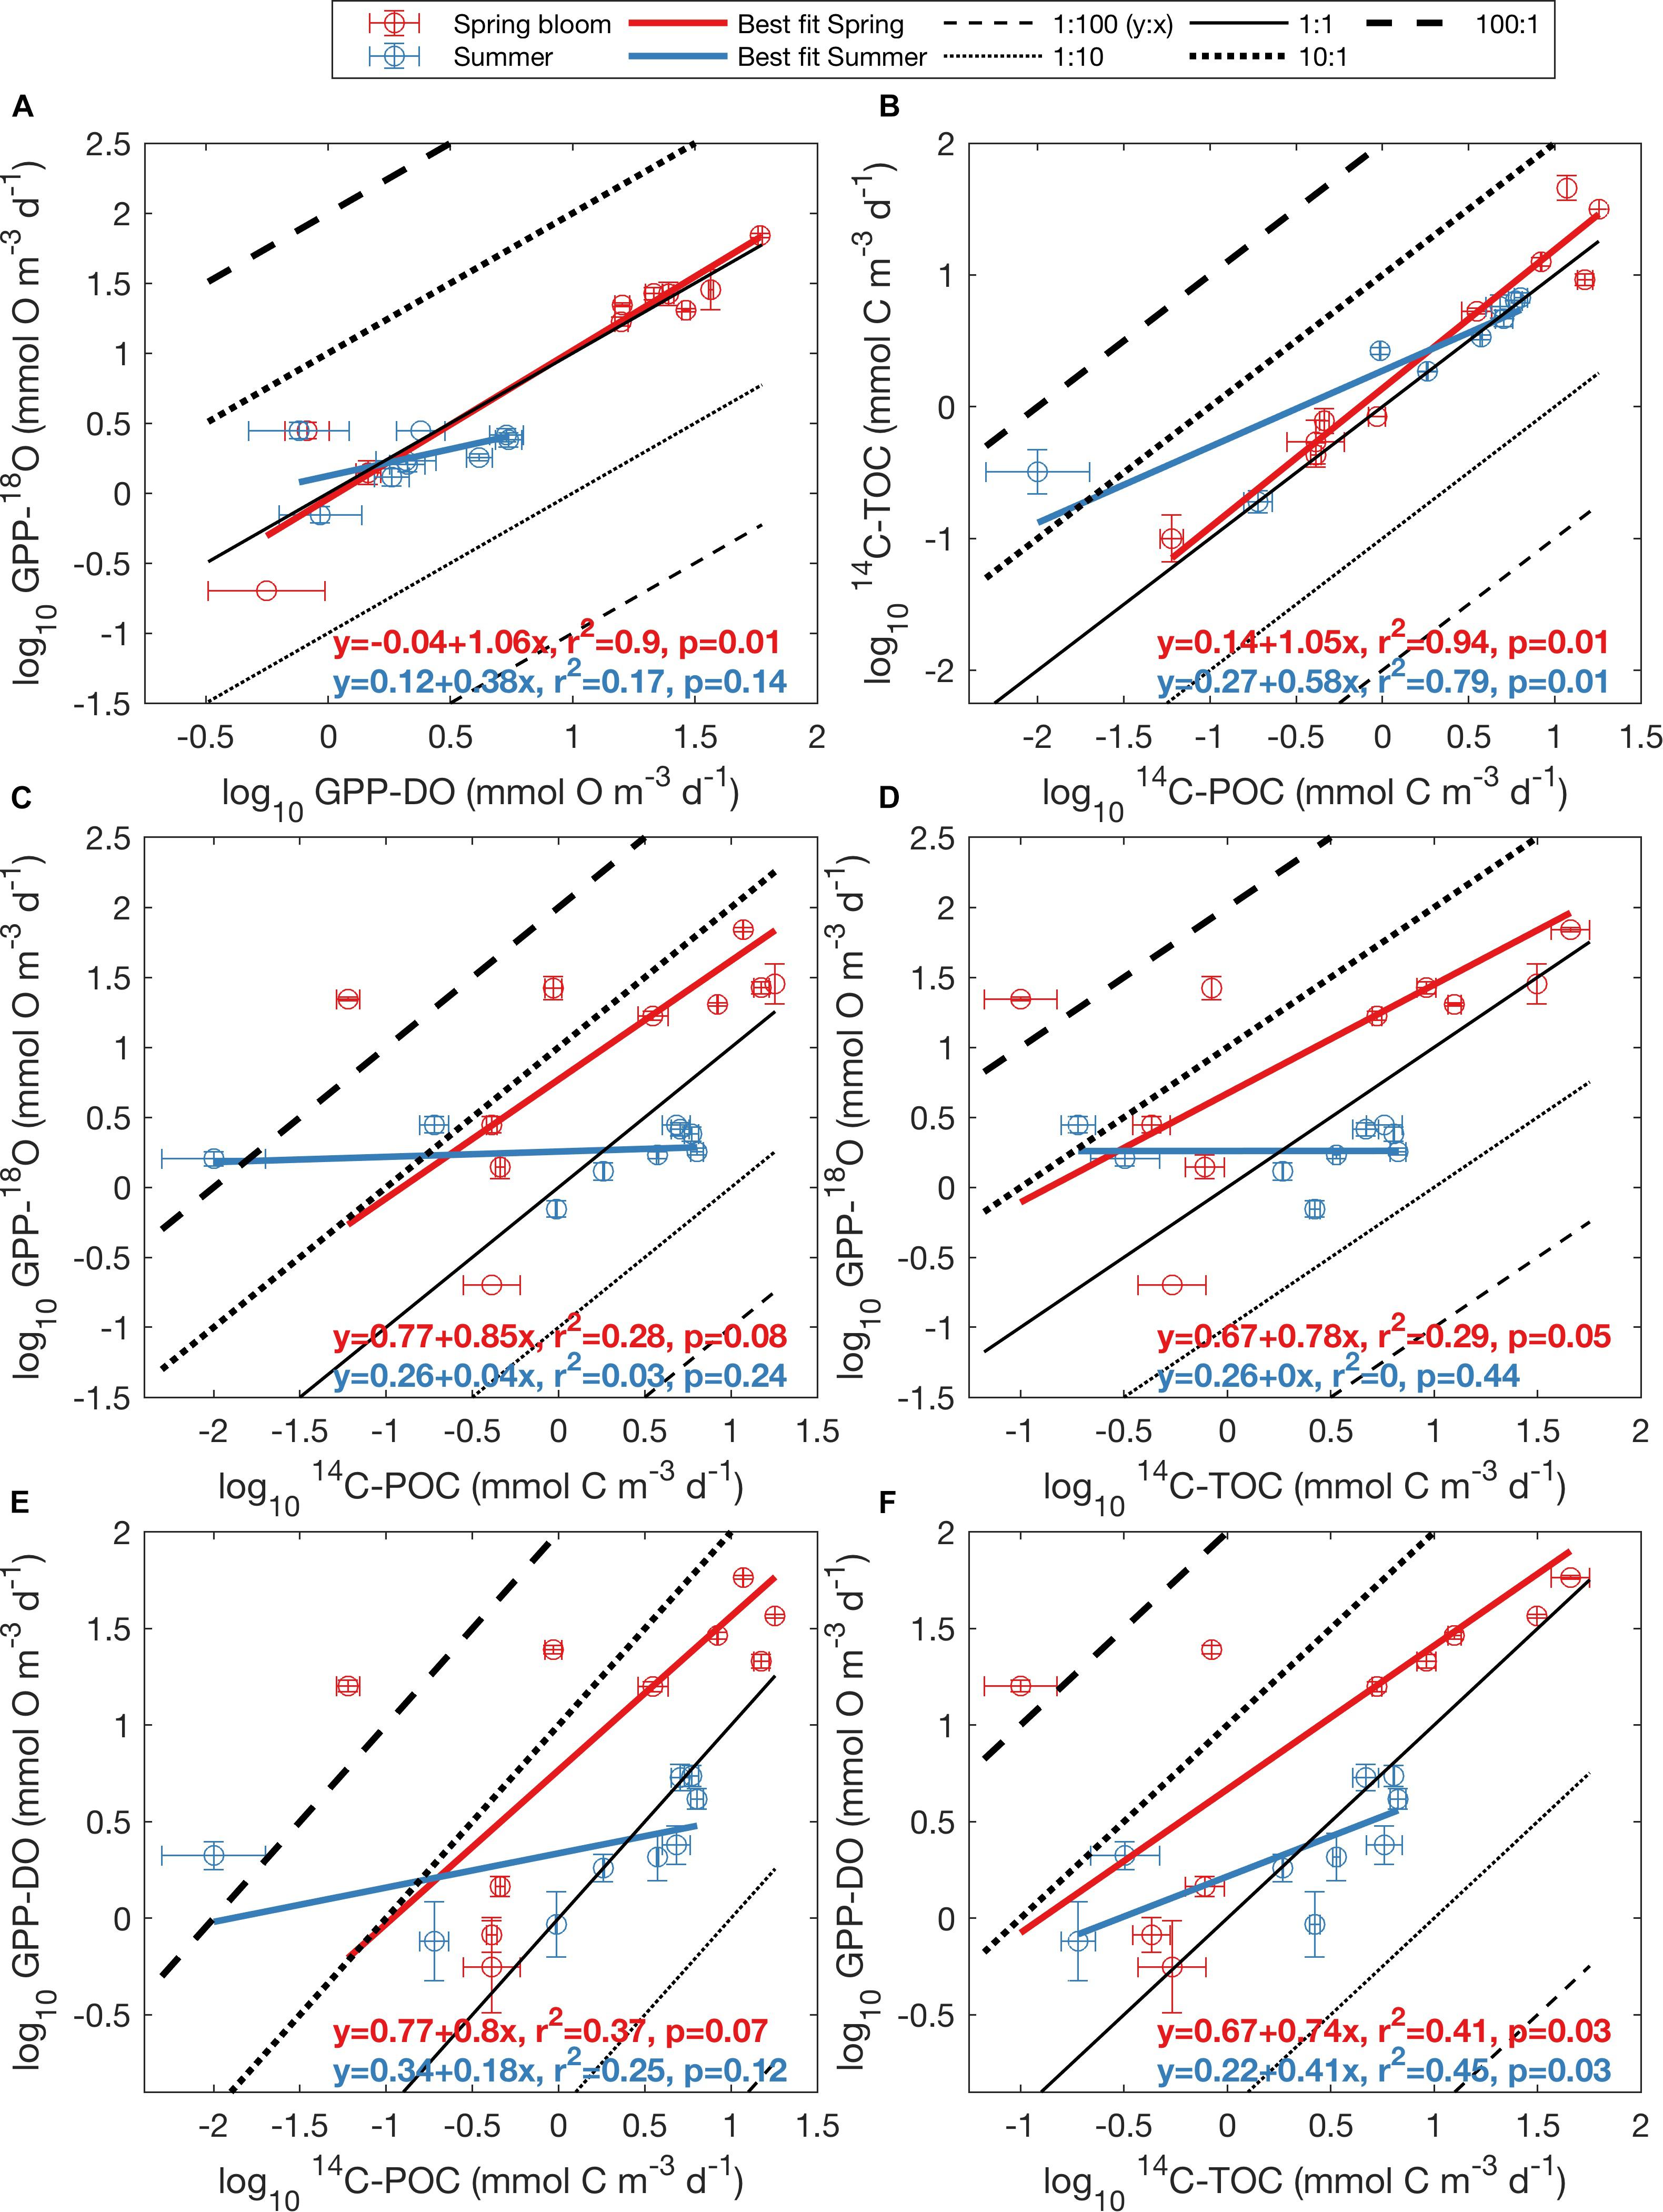
Figure 5. Log-log relationship between oxygen- and carbon-based methods for May (red dots) and August (blue dots), presented as average ± standard error for each depth (Figure 2). (A) GPP-118O vs. GPP-DO, (B) 14C-TOC vs. 14C-POC, (C) GPP-18O vs. 14C-POC, (D) GPP-18O vs. 14C-TOC, (E) GPP-DO vs. 14C-POC, and (F) GPP-DO vs. 14C-TOC. All rates are volumetric in units of mmol O m-3 d-1 for oxygen and mmol C m-3 d-1 for carbon. Black lines represent ratios of y to x ranging from 1:100 to 100:1, with the solid line indicating a 1:1 relationship. The bold teal line represents the best linear fit to the aggregate dataset (i.e., including both seasons), while the orange line, if present, represents the best fit line calculated by Regaudie-de-Gioux et al. (2014), based on a global synthesis of PP observations.
Discussion
In the spring of 2014, the waters NW and N of Svalbard Archipelago were dominated by a bloom of large chain-forming diatoms and the colonial form of Phaeocystis sp. [M. Reigstad, pers. comm.]. Average integrated chlorophyll concentration was 236.7 ± 88.8 mg chlorophyll a m-2. By August, toward the end of the growth season, phytoplankton abundance was low and small flagellates dominated the community. Integrated chlorophyll a had decreased to 57 ± 22.6 mg m-2. The phytoplankton community was dominated by cryptomonads, coccolithophorids, dinoflagellates, and few’ small diatoms. These two scenarios correspond to periods of nitrate-based new production in May, followed by a period of recycled, or ammonium-based, production in August (Randelhoff et al., 2018; Svensen et al., 2019). The C-based and O-based techniques all noted a sharp decrease in primary productivity estimates between May and August, representative of the change in phytoplankton abundance and composition (Table 2). The high C-based and O2-based rates of PP in May corresponded to the boreal spring bloom, at the ice edge, where high rates of productivity are expected (Vaquer-Sunyer et al., 2013).
Our results indicate that the average volumetric O-based PP, as measured by 18O method (12.2 ± 4.0 mmol O2 m-3 d-1) is ∼1.7 higher than the C-based estimates such as 14C-TOC (7.3 ± 2.7 mmol C m-3 d-1), which includes particulate and dissolved carbon uptake (Table 2). This difference is consistent with other measurements on open ocean phytoplankton, where GPP-18O was ∼1.5 higher than 14C-POC (Juranek and Quay, 2005). Based on similar productivity methods as in this study, Regaudie-de-Gioux et al. (2014) showed that GPP-18O > GPP-DO > 14C-TOC > 14C-POC. In our case, the average GPP-18O ≈ GPP-DO > 14C-TOC > 14C-POC as previously reported by Grande et al. (1989b) for the North Pacific. It is only in May that our results agree with those of Regaudie-de-Gioux et al. (2014), with GPP-18O > GPP-DO > 14C-TOC > 14C-POC (Table 2).
Seasonal dynamics of the pelagic ecosystem’s metabolism could play a key role in the difference between C- and O-based rates of primary productivity. In spring, during the ice-edge phytoplankton bloom, 14C-TOC rates equalled 52% and 50% of GPP-DO and GPP-18O estimates, respectively (Table 2). A similar difference is observed in the integrated productivity estimates, where 14C-TOC (146.3 ± 106.3 mmol C m-3 d-1) were 50% of the average GPP estimates from 18O method (293.6 ± 121.9 mmol O2 m-3 d-1; Table 2). In August, when overall rates were low, integrated 14C-TOC was 125% and 175% of DO-GPP and GPP-18O estimates, respectively (Table 2). Hence, in low productive waters with low abundance of large phytoplankton and when recycling processes dominate (Olli et al., 2019), the relationship between volumetric C- and O-estimates was reversed, 14C-TOC > 14C-POC > GPP-DO > GPP-18O (Table 2). In this way, seasonality not only affected overall PP rates and the absolute amount of the difference between methods, but the sign as well. Possible sources of observed variability in productivity estimates by the various methods are discussed below.
Cellular Processes Affecting Primary Production Estimates
O2-based GPP rates are higher than 14C- based estimates as the latter excludes respiration (Bender et al., 1987). In this way, our results confirm that similar to lower latitude estimates, the C-based techniques in the Arctic better approximate net primary production (NPP) (Marra, 2002; Robinson et al., 2009; Regaudie-de-Gioux et al., 2014). As 14C-TOC includes both particulate and dissolved C uptake, it is expected to be higher than 14C-POC which only includes the 14C retained in phytoplankton, concentrated on a filter after incubation (see section “Materials and Methods”) (Juranek and Quay, 2005; Matrai et al., 2013). 14C-POC is the most common productivity technique when using radioactive carbon (Steemann-Nielsen, 1952). However, the difference between 14C-TOC and 14C-POC can be substantial. 14C-DOC, calculated as the difference between 14C-TOC and 14C-POC (Table 2 and Supplementary Table S1), was higher in May than in August due to high PP rates in spring, accounting for 4.8 ± 3.6 mmol C m-3 d-1 or approximately 45% of the 14C-TOC and 0.3 ± 0.2 mmol C m-3 d-1 or 9% of the 14C-TOC in August, similar to rates previously observed in the Barents Sea (Table 2; Vernet et al., 1998) and productive areas of the Nansen Basin, Arctic Ocean (Gosselin et al., 1997).
For the North Atlantic, Robinson et al. (2009) highlighted that the difference between the techniques depended on the magnitude of basal (or dark) respiration. Hence, the significant difference between GPP-18O and 14C-POC rates found in this study (Tables 2, 3) could be explained by losses resulting from respiration by autotrophs (Grande et al., 1989b). In May, the basal respiratory losses accounted for 2.52 ± 0.31 mmol O2 or C m-3 d-1 (Table 1 in Mesa et al., 2017) or ∼10% of the GPP (Table 2), in agreement with the expectation that basal respiration rates in European Arctic communities are characteristically low (i.e., Vaquer-Sunyer et al., 2013). However, the 24-h photoperiod that helps support rapid growth and high rates of photosynthesis may impose higher daily respiratory losses than in temperate regions. Higher respiration rates in the light might be due to the contribution of autotrophic metabolic processes, such as photo-enhanced mitochondrial respiration, chlororespiration, photorespiration, and/or the Mehler reaction (Bender et al., 1999). For example, phytoplankton exposure to higher light irradiances in the shallow mixed layers created by sea ice melt, combined with low temperatures, might lead to the increase of the Mehler reaction, a defense mechanisms to overcome photoinhibition (Laws et al., 2000; Beer et al., 2014). Indeed, high respiration rates have been reported for the Beaufort Sea, in the summer, during periods of high-light exposure (Nguyen et al., 2012).
For the European Arctic, phytoplankton respiration rates during summer, characteristic of continuous daylight, are higher in the light than in the dark (Mesa et al., 2017). These authors found that community respiration rates evaluated in the light increased with increasing GPP-18O rates, establishing a threshold of 10 mmol O2 m-3 d-1 beyond which the light compared with the dark process prevail. Respiration in the light was on average 1.37 higher than in the dark and at maximum respiration rates, the light respiration was 17.56 higher. This non-linearity of respiration in relation to productivity rates is expected to underlie the non-linearity of the O:C relationship (Figure 5). For the area around Svalbard, the average respiration in the light is 5.2 ± 0.52 mmol O2 m-3 d-1 (Table 1 in Mesa et al., 2017). Combining these light respiration rates with a GPP of 21.4 ± 6.3 mmol O2 m-3 d-1 (Table 2) we can predict an O2-based net production of ∼16.2 mmol O2 m-3 d-1, while the 14C-TOC is 10.7 ± 4.9 mmol C m-3 d-1, with a difference of ∼5.5 mmol O2 or C m-3 d-1 after accounting for respiratory losses.
Remaining differences between O- and C-based measurements after correcting for respiration suggests other processes are at play in Arctic plankton communities. The 14C method can underestimate C assimilated due to release 14CO2 by photorespiration that results when O2 binds ribulose-1,5-bisphosphate carboxylase/oxygenase (Rubisco) leading to the excretion of glycolate, though photorespiration is apparently low in many phytoplankton (Peterson, 1980; Laws et al., 2000). In the case where PP is estimated with 14C-POC, it differed by 17.7 mmol C or O2 m-3 d-1 from GPP-DO (Table 2). Processes that affect the release of 14C-DOC will diminish the 14C-POC estimate. “Sloppy” feeding and photorespiration might release 14C-DOC as well (Laws et al., 2000). Microzooplankton grazers impact the estimation of 14C-POC to the extent that grazed carbon is not only respired but also excreted (Laws et al., 2000). During our study period, average microzooplankton grazing rate was 0.23 d-1 (Lavrentyev et al., 2019). On the other hand, consumption by heterotrophic prokaryotes leads to a loss in 14C-DOC, decreasing 14C-TOC estimates (Steemann-Nielsen, 1952; Marra, 2002). Short incubation times (<4 h) are recommended to minimize this loss.
The GPP-18O and triple oxygen isotope method are considered the most accurate measurements of gross photosynthesis available (Laws et al., 2000; Regaudie-de-Gioux et al., 2014) since GPP is best defined on the basis of oxygen evolution rather than carbon fixation (Falkowski and Raven, 1997). However, this technique also has inherent errors where GPP-18O can be overestimated, increasing the difference with DO and 14C techniques. GPP-18O rates are thought to overestimate GPP due to the decoupling of O2-production and C-assimilation through the Mehler reaction and photorespiration (Grande et al., 1989b; Laws et al., 2000). In the Mehler reaction, a molecule of labeled O2 is produced and a molecule of unlabelled O2 is consumed, accounting for an estimated 10% increase in GPP-18O rates (Falkowski and Raven, 1997; Laws et al., 2000). Photorespiration leads to the excretion of glycolate, also increasing GPP-18O estimates by 10% (Falkowski and Raven, 1997; Beardall et al., 2009). Higher C than O2-based rates during August may also be due to the presence of Synechococcus spp. (Paulsen et al., 2016). Indeed, Grande et al. (1989a) demonstrated elevated rates of respiration in light conditions due to photorespiration in Synechococcus spp. cultures from the Arabian Sea. Accounting for these sources of gains and losses, the combined effect of the Mehler reaction and photorespiration, increasing GPP-18O by 20%, and the impact of grazing on 14C-assimilation, contributing to differences of 15% after 24 h (Laws et al., 2000), could account for ∼35% of the 51% difference observed in our GPP-18O and 14C-TOC estimates in May (Table 2). The rest is accounted for by a minimum of ∼10% respiration losses.
Oxygen: Carbon Ratios in Arctic Phytoplankton
For the Arctic, median O:C ratios of 4.75 and 0.56 can be estimated for May and August, respectively, based on integrated GPP-18O and 14C-POC rates (calculated as the median of the ratios of the integrated C and O productivity estimates for each station, data in Supplementary Table S1). The 25 and 75% percentiles for May and August are 2.6 and 7.6, and 0.5 and 0.8, respectively. The May ratio in the Arctic is higher than the average 2.7 of a multidisciplinary study (JGOFS, Joint Global Ocean Flux Study in the Arabian Sea, North Atlantic, Equatorial Pacific, and Southern Ocean), an O:C ratio also based on 18O-GOP, or gross oxygen production, and 24-h 14C incubations of the particulate matter (labeled 14C-PP in JGOFS studies) (Figure 6; Juranek and Quay, 2013). This ratio is within the range of other oceanic regions where the ratio of O-based to C-based productivity estimates range from 3.1 to 8.2 (Figure 6; data obtained from Table 1 in Juranek and Quay, 2013). In the Southern Ocean a similar ratio of 4.2 ± 2.5 was observed (Figure 6; Hamme et al., 2012). These measurements were obtained at the Polar Front, at ∼50oS, during late summer (March), a time of the year more comparable to the August Arctic cruise of 2014 albeit with a difference of 30° in latitude. In all these studies, 18O-GOP is incubation-independent, based on 18O:17O ratio in surface waters and modeling of physical properties of the mixed layer and mixing processes (Bender et al., 1999, 2000; Laws et al., 2000) while 14C estimates are from incubations, as in this study. Nevertheless, Marra (2002) and Marra and Barber (2004) found a robust relationship between these 18O and 14C measurements, where 14C-POC estimations were ∼50% lower than 18O-GOP, as found for the Arctic (Table 2). These field O:C ratios were confirmed by laboratory experiments where Halsey et al. (2010) found a consistent O:C of 3.3 for the green microalga Dunaliella tertiolecta (Figure 6).
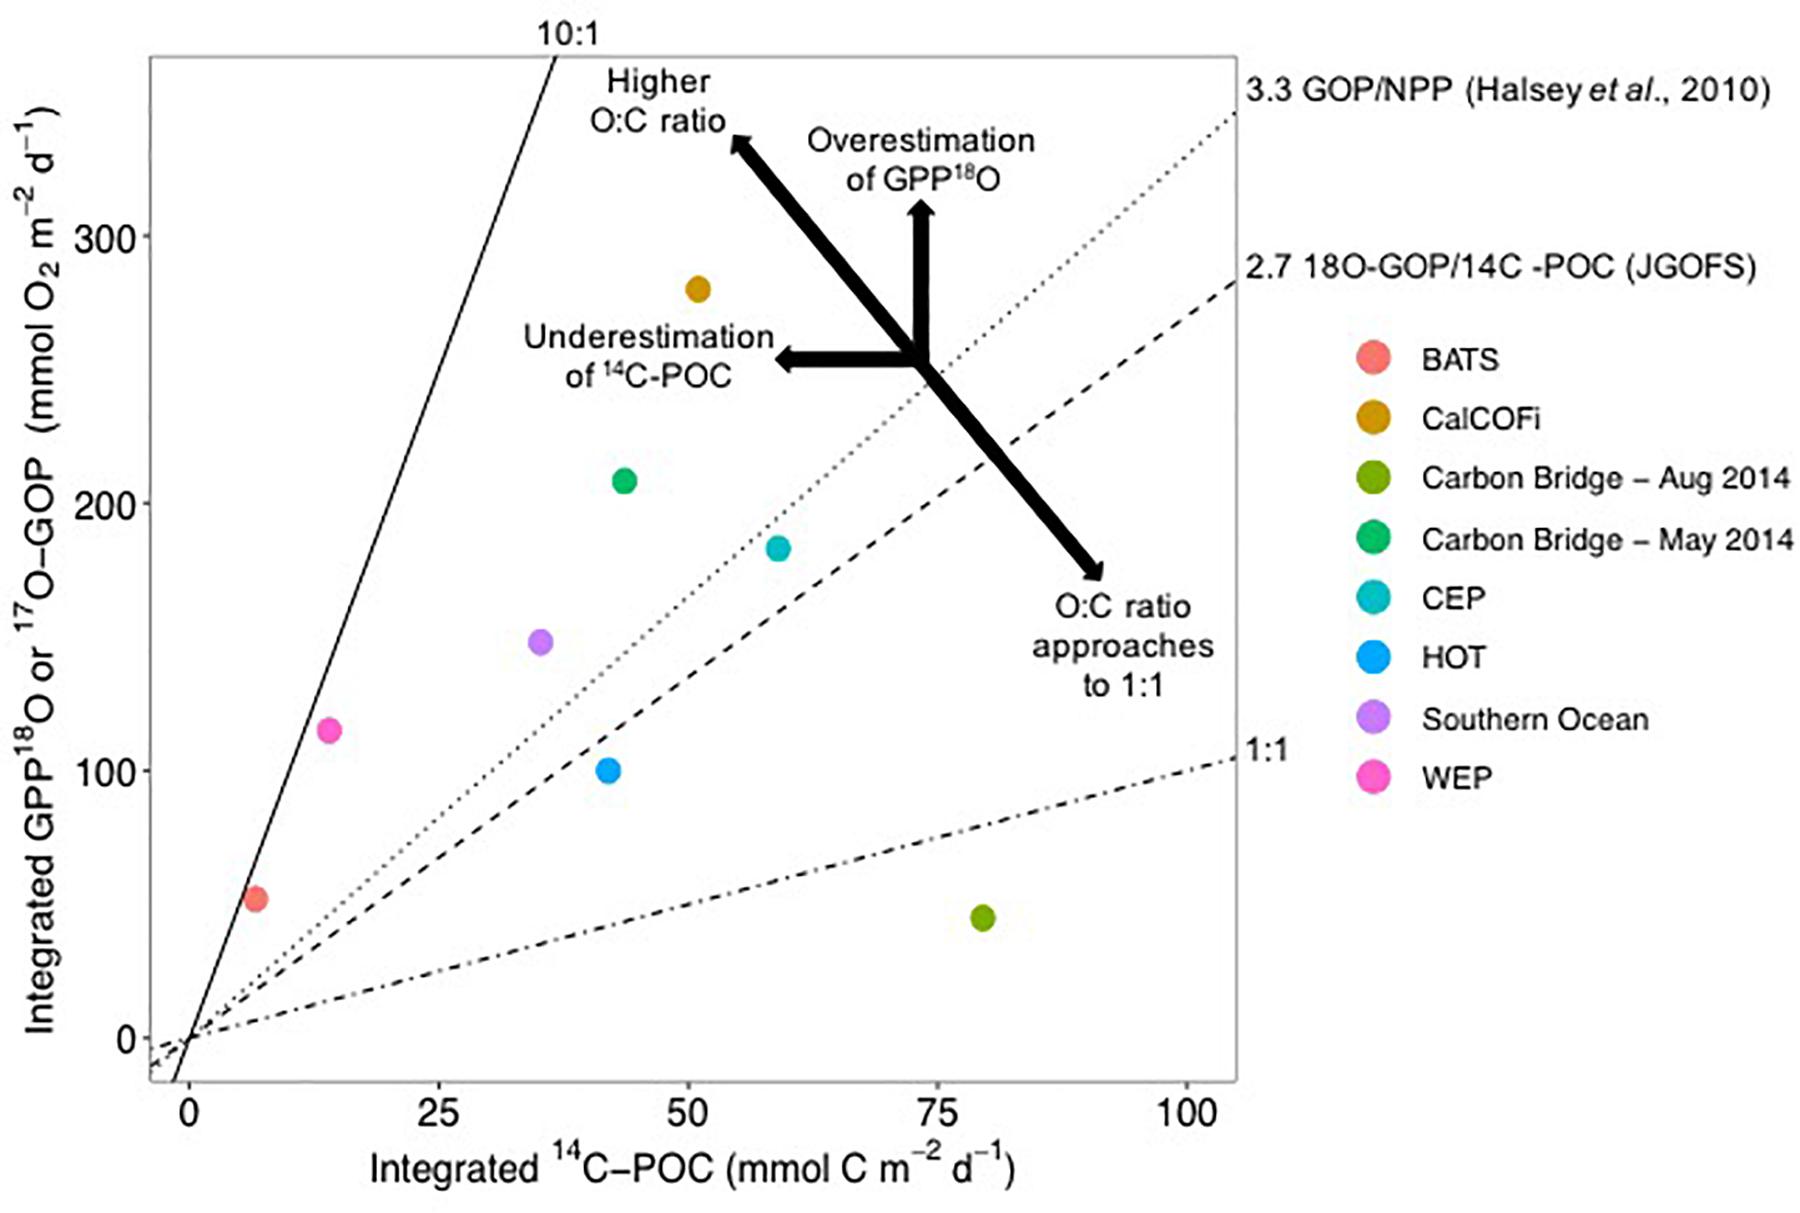
Figure 6. Average O:C ratios from 14C-POC and mixed-layer Gross oxygen production (GOP), equivalent to GPP-18O in this study (Carbon Bridge – May and August 2014), estimated from incubations of 18O and DO. All rates are integrated, with units of mmol m-2 d-1. BATS correspond to the Bermuda Atlantic Time Series, CalCOFI to the California Cooperative Fisheries Investigations, Carbon Bridge 2014 (this study), CEP to the Central Equatorial Pacific, HOT to the Hawaii Ocean Time Series, and WEP to the Western Equatorial Pacific. 14C-POC corresponds to 14C-PP in the literature. For the Arctic, a median of 4.75 for May, with 25 and 75% percentiles of 2.6 and 7.6, respectively, and for August, a median of 0.56 with 25 and 75% percentiles of 0.5 and 0.8, respectively. Factors overestimating GPP-18O include photo-enhanced mitochondrial respiration, chloro-respiration, photo-respiration, and Mehler reaction, which increase oxygen consumption not related to carbon uptake. 14C-POC can be underestimated by grazing and DOC excretion as well as photo-respiration where 14C is consumed within the incubation vessel (see text for more details). Graph redrawn from Juranek and Quay (2013).
The low O:C ratio observed in August (median 0.56) does not have corresponding values in the literature. O:C ratios < 1 could be characteristic of high latitudes, not found in the tropics where most of the available measurements originate (e.g., Juranek and Quay, 2013). Assuming C uptake or loss do not change substantially from spring to summer (e.g., Lavrentyev et al., 2019), what decreases O2 production with respect to carbon uptake? Possible processes decreasing O2 production have been mentioned above, such as higher photorespiration by the abundant Synechococcus and higher Mehler reaction under conditions of high light (Nguyen et al., 2012; Paulsen et al., 2016). It is possible that coccolithophorids and dinoflagellates, together with Synechococcus, have higher basal respiration than the bloom-forming large diatoms or the colonial Phaeocystis sp., either due to their smaller cell size or other physiological response. The drastic change in phytoplankton composition from spring to summer suggests that phytoplankton community structure could be an important factor determining the O:C ratio. However, additional experiments are needed to substantiate this hypothesis.
High inter- and intra-seasonal variability characterizes Arctic primary productivity rates (Figures 2, 3). Part of the seasonal variability could originate from a variable proportion of light- and dark respiration, discussed above, as during productive periods of high phytoplankton biomass the proportion of light to dark respiration could be as high as ∼18 (Mesa et al., 2017). This large variability in respiration, potentially affecting the O:C ratio in polar phytoplankton, could explain in part the differences we observed between May and August. As the days shorten the respiration in the light decreases, decreasing O2- based GPP estimates, such that in the Arctic the O:C ratio in August was <1 (Figures 4, 6). These large discrepancies in O:C ratios between seasons and with the global dataset suggest that more experiments are needed before large-scale regional and seasonal patterns can be determined.
Conclusion
The O2-based methods and the 14C method provide understanding of different processes critical to describe ecosystem function such as gross and NPP and respiration at the plankton community level. The choice of either method should be guided by the specific question being addressed. In this way, the methods are complementary. For example, the combination of 14C-TOC and 14C-POC provides information of food supply (as DOC) for the microbial food web, not available from the oxygen methods. Furthermore, 14C-POC represents the phytoplankton carbon production needed when quantifying the food available for higher trophic levels. The DO methods provide independent estimates of community respiration (CR) and net community production (NCP) (Carritt and Carpenter, 1966; Carpenter, 1995). The main difference among methods is the inclusion of respiration in GPP estimates, that in the Svalbard region seems to account for ∼20% of the primary production (Mesa et al., 2017).
In this study we emphasize that (1) the relationship between O and C in the Arctic are relatively weak, with seemingly variable relationship; (2) there is evidence for seasonality in this relationship, mediated in part by rates of productivity; and (3) that this relationship differs from previous ones derived from an aggregation of global datasets. In demonstrating seasonal variability in the O to C relationship, as well as variability between types of O and C methods, our study contributes significantly to the state of the art, while doing so raising a number of interesting questions. One of these is this notion of PQ which relates moles of O released and moles of C produced. This relationship appears variable temporally and perhaps spatially, while the state of the art has been to apply a single number, often with no regional parametrization let alone temporal component. Further exploration of O:C ratios in Arctic and global phytoplankton, and the impact of respiration on rate estimates, will provide valuable insight to better constrain primary production, and ultimately provide a means to track long-term change in the evolving Arctic environment.
Data Availability
All datasets generated for this study are included in the manuscript and/or the Supplementary Files.
Author Contributions
CD, MS-M, MV, and MR designed the fieldwork. MS-M, MV, EM, and MC carried out the fieldwork and the laboratory analysis. MS-M, CD, MV, and MC analyzed the data. All authors contributed to the writing and editing of the manuscript.
Funding
This study is a contribution to the Carbon Bridge (RCN-226415) project funded by the Norwegian Research Council to MR. MS-M was supported by a predoctoral fellowship from the Fundación La Caixa and the unemployment benefit of Ministry of Labour, Migrations and Social Security, Spain. MV was partially funded by a fellowship from the Hanse-Wissenchaftskolleg, Delmenhorst, Germany and by a United States National Science Foundation award PLR-1443705. MC was partially funded by the NASA Headquarters under the NASA Earth and Space Science Fellowship Program – grant NNX12AN48H.
Conflict of Interest Statement
The authors declare that the research was conducted in the absence of any commercial or financial relationships that could be construed as a potential conflict of interest.
Acknowledgments
We thank the crew of R/V Helmer Hanssen for their support during the Carbon Bridge project; P. Carrillo-de-Albornoz, E. Pérez, and A. Granados for their help in the sampling and analytical measurements; and M. Chierici for DIC analysis. We also thank A. Regaudie-de-Gioux, R. Vaquer-Sunyer for their comments on primary productivity and A. Lázaro, G. Martín, and G. Sanz for their comments in statistics.
Supplementary Material
The Supplementary Material for this article can be found online at: https://www.frontiersin.org/articles/10.3389/fmars.2019.00468/full#supplementary-material
References
Aristegui, J., Montero, M. F., Ballesteros, S., Basterretxea, G., and Van Lenning, K. (1996). Planktonic primary production and microbial respiration measured by 14C assimilation and dissolved oxygen changes in coastal waters of the Antarctic Peninsula during austral summer: implications for carbon flux studies. Mar. Ecol. Ser. 132, 191–201. doi: 10.3354/meps132191
Banse, K. (1993). On the dark bottle in the 14C method for measuring marine phytoplankton production. ICES J. Mar. Sci. 197, 132–140.
Beardall, J., Ihnken, S., and Quigg, A. (2009). Gross and net primary production: closing the gap between concepts and measurements. Aquat. Microb. Ecol. 56, 113–122. doi: 10.3354/ame01305
Beer, S., Björk, M., and Beardall, J. (2014). Photosynthesis in the Marine Environment. Hoboken, NJ: John Wiley & Sons.
Bender, M. L., Dickson, M. L., and Orchardo, J. (2000). Net and gross production in the Ross Sea as determined by incubation experiments and dissolved O2 studies. Deep Sea Res. Part II Top. Stud. Oceanogr. 47, 3141–3158. doi: 10.1016/S0967-0645(00)00062-X
Bender, M. L., Karen, G., Kenneth, J., John, M., Michael, P., Chris, L., et al. (1987). A comparison of four methods for determining planktonic community production. Limnol. Oceanogr. 32, 1085–1098. doi: 10.4319/lo.1987.32.5.1085
Bender, M. L., Orchardo, J., Dickson, M. L., Barber, R. T., and Lindley, S. (1999). In vitro O2 fluxes compared with 14C production and other rate terms during the JGOFS equatorial pacific experiment. Deep Sea Res. Part A Oceanogr. Res. Pap. 46, 637–654. doi: 10.1016/S0967-0637(98)00080-6
Bender, M. L., Taylor, E., Tans, P., Francey, R., and Lowe, D. (1996). Variability in the O2/N2 ratio of southern hemisphere air, 1991-1994: implications for the carbon cycle. Glob. Biogeochem. Cycles 10, 9–21. doi: 10.1029/95gb03295
Carpenter, J. (1995). The Accuracy of the Winkler Method for Dissolved Oxyen Analysis. Baltimore, MD: The Johns IIopkins University, 135–140.
Carritt, D. E., and Carpenter, J. H. (1966). Comparison and evaluation of currently employed modifications of the Winkler method for determining dissolved oxygen in seawater. J. Mar. Res. 24, 286–318.
Del Giorgio, P. A., and Duarte, C. M. (2002). Respiration in the open ocean. Nature 420, 379–384. doi: 10.1038/nature01165
Dickson, A. G., Sabine, C. L., and Christian, J. R. (2007). Guide to Best Practices for Ocean CO2. Sidney, BC: North Pacific Marine Science Organization.
Dickson, M. L., Orchardo, J., Barber, R. T., Marra, J., McCarthy, J. J., and Sambrotto, R. N. (2001). Production and respiration rates in the Arabian Sea during the 1995 Northeast and Southwest Monsoons. Deep Res. Part II 48, 1199–1230. doi: 10.1016/S0967-0645(00)00136-3
Duarte, C. M., and Agustí, S. (1998). The CO2 balance of unproductive aquatic ecosystems. Science 281, 234–236. doi: 10.1126/science.281.5374.234
Duarte, C. M., Agustí, S., and Regaudie-de-Gioux, A. (2011). “The role of marine biota in the metabolism of the biosphere,” in The Role of Marine Biota in the Functioning of the Biosphere, ed. C. M. Duarte (Madrid: CSIC), 38–53.
Duarte, C. M., and Cebrián, J. (1996). The fate of marine autotrophic production. Limnol. Oceanogr. 41, 1758–1766. doi: 10.4319/lo.1996.41.8.1758
Field, C. B., Behrenfeld, M. J., Randerson, J. T., and Falkowski, P. G. (1998). Primary production of the biosphere: integrating terrestrial and oceanic components. Science 281, 237–240. doi: 10.1126/science.281.5374.237
Fox, J., and Weisberg, S. (2011). Car: Companion to Applied Regression. Available at: https://CRAN.R-project.org/package=car
Garcia-Corral, L. S., Holding, J. M., Carrillo-de-Albornoz, P., Steckbauer, A., Navarro, N., Serret, P., et al. (2016). Effects of UVB radiation on net community production in the upper global ocean. Glob. Ecol. Biogeogr. 26, 54–64. doi: 10.1111/geb.12513
Gazeau, F., Middelburg, J. J., Loijens, M., Vanderborgh, J. P., Pizay, M. D., and Gattuso, J. P. (2007). Planktonic primary production in estuaries: comparison of 14C, O2 and 18O methods. Aquat. Microb. Ecol. 46, 95–106. doi: 10.3354/ame046095
Gosselin, M., Levasseur, M., Wheeler, P. A., Horner, R. A., and Booth, B. C. (1997). New measurements of phytoplankton and ice algal production in the Arctic Ocean. Deep Res. Part II Top. Stud. Oceanogr. 44, 1623–1644. doi: 10.1016/S0967-0645(97)00054-4
Grande, K. D., Marra, J., Langdon, C., Heinemann, K., and Bender, M. L. (1989a). Rates of respiration in the light measurement in marine phytoplankton using an 18O isotope-labeling technique. J. Exp. Mar. Biol. Ecol. 129, 95–120. doi: 10.1016/0022-0981(89)90050-6
Grande, K. D., Williams, P. J. B., Marra, J., Purdie, D. A., Heinemann, K., Eppley, R. W., et al. (1989b). Primary production in the north pacific gyre: a comparison of rates determined by the 14C, O2 concentration and 18O methods. Deep Sea Res. Part A Oceanogr. Res. Pap. 36, 1621–1634. doi: 10.1016/0198-0149(89)90063-0
Grebmeier, J. M., and Mcroy, C. P. (1989). Pelagic-benthic coupling on the shelf of the northern Bering and Chukchi Seas. III. Benthic food supply and carbon cycling. Mar. Ecol. Prog. Ser. 53, 79–91. doi: 10.3354/meps053079
Grebmeier, J. M., Overland, J. E., Moore, S. E., Carmack, E. C., Cooper, L. W., Frey, K. E., et al. (2006). A major ecosystem shift in the northern bering sea. Science 311, 1461–1464. doi: 10.1126/science.1121365
Grebmeier, J. M., Smith, W. O., and Conover, R. J. (2013). Biological processes on arctic continental shelves: ice-ocean-biotic interactions. Arctic Oceanogr. Marg. Ice Zones Cont. Shelves 49, 231–261. doi: 10.1093/icb/icr102
Halsey, K. H., Milligan, A. J., and Behrenfeld, M. J. (2010). Physiological optimization underlies growth rate-independent chlorophyll-specific gross and net primary production. Photosynth. Res. 103, 125–137. doi: 10.1007/s11120-009-9526-z
Hamme, R. C., Nicolas, C., Veronica, P. L., Robert, D. V., Michael, L. B., Peter, G. S., et al. (2012). Dissolved O2/Ar and other methods reveal rapid changes in productivity during a Lagrangian experiment in the Southern Ocean. J. Geophys. Res. Ocean 117, 1–19. doi: 10.1029/2011JC007046
Holding, J. M., Duarte, C. M., Arrieta, J. M., Vaquer-Suyner, R., Coello-Camba, A., Wassmann, P. F., et al. (2013). Experimentally determined temperature thresholds for Arctic plankton community metabolism. Biogeosciences 10, 357–370. doi: 10.5194/bg-10-357-2013
Holding, J. M., Duarte, C. M., Sanz-Martín, M., Mesa, E., Arrieta, J. M., Chierici, M., et al. (2015). Temperature dependence of CO2-enhanced primary production in the European Arctic Ocean. Nat. Clim. Chang 5, 1079–1082. doi: 10.1038/nclimate2768
Juranek, L. W., and Quay, P. D. (2005). In vitro and in situ gross primary and net community production in the North Pacific Subtropical Gyre using labeled and natural abundance isotopes of dissolved O2. Glob. Biogeochem. Cycles 19, 1–15. doi: 10.1029/2004GB002384
Juranek, L. W., and Quay, P. D. (2013). Using triple isotopes of dissolved oxygen to evaluate global marine productivity. Annu. Rev. Mar. Sci. 5, 503–524. doi: 10.1146/annurev-marine-121211-172430
Kahru, M. (2017). Ocean productivity from space: commentary. Global Biogeochem. Cycles 31, 214–216. doi: 10.1002/2016GB005582
Korkmaz, S., Goksuluk, D., and Zararsiz, G. (2014). MVN: An R package for assessing multivariate normality. R J. 6, 151–162. doi: 10.32614/RJ-2014-031
Lavrentyev, P. J., Franzè, G., and Moore, F. B. (2019). Microzooplankton distribution and dynamics in the eastern fram strait and the arctic ocean in may and August 2014. Front. Mar. Sci. 6:264. doi: 10.3389/fmars.2019.00264
Laws, E. A., Landry, M. R., Barber, R. T., Campbell, L., Dickson, M. L., and Marra, J. (2000). Carbon cycling in primary production bottle incubations: inferences from grazing experiments and photosynthetic studies using 14C and 18O in the Arabian Sea. Deep Sea Res. Part II Top. Stud. Oceanogr. 47, 1339–1352. doi: 10.1016/S0967-0645(99)00146-0
Marra, J. (2002). “Approaches to the measurement of plankton production,” in Phytoplankton Productivity: Carbon Assimilation in Marine and Freshwater, eds P. J. le B. Williams, D. N. Thomas, and C. S. Reynolds (Oxford: BlackwellScience).
Marra, J. (2009). Net and gross productivity: weighing in with 14C. Aquat. Ecosyst. Health Manag. 56, 123–131. doi: 10.3354/ame01306
Marra, J., and Barber, R. T. (2004). Phytoplankton and heterotrophic respiration in the surface layer of the ocean. Geophys. Res. Lett. 31:L09314. doi: 10.1029/2004GL019664
Matrai, P. A., Olson, E., Suttles, S. E., Hill, V., Codispoti, L. A., Light, B., et al. (2013). Synthesis of primary production in the Arctic Ocean: I. Surface waters, 1954 – 2007. Prog. Oceanogr. 110, 93–106. doi: 10.1016/j.pocean.2012.11.004
Mesa, E., Delgado-Huertas, A., Carrillo-De-Albornoz, P., García-Corral, L. S., Sanz-Martín, M., and Wassmann, P. (2017). Continuous daylight in the high-Arctic summer supports high plankton respiration rates compared to those supported in the dark. Sci. Rep. 7:1247. doi: 10.1038/s41598-017-01203-7
Nguyen, D., Maranger, R., Tremblay, J.-É., and Gosselin, M. (2012). Respiration and bacterial carbon dynamics in the Amundsen Gulf, western Canadian Arctic. J. Geophys. Res. Ocean. 117, 1–12. doi: 10.1029/2011JC007343
Olli, K., Halvorsen, E., Vernet, M., Lavrentyev, P. J., Franzè, G., and Sanz-Martín, M. (2019). Food web functions and interactions during spring and summer in the arctic water inflow region: investigated through inverse modeling. Front. Mar. Sci. 6:244. doi: 10.3389/fmars.2019.00244
Oudot, C., Gerard, R., Morin, P., and Gningue, I. (1988). Precise shipboard determination of dissolved oxygen (Winkler procedure) for productivity studies with a commercial system. Limnol. Oceanogr. 33, 146–150. doi: 10.4319/lo.1988.33.1.0146
Pabi, S., van Dijken, G. L., and Arrigo, K. R. (2008). Primary production in the Arctic Ocean, 1998-2006. J. Geophys. Res. Ocean 113, 1998–2006. doi: 10.1029/2007JC004578
Pamatmat, M. M. (1997). Non-photosynthethic oxygen production and non-respiratory oxygen uptake in the dark: a theory of oxyegn dynamics in plankton communities. Mar. Biol. 129, 735–746. doi: 10.1007/s002270050216
Paulsen, M. L., Doré, H., Garczarek, L., Seuthe, L., Müller, O., Sandaa, R. A., et al. (2016). Synechococcus in the atlantic gateway to the arctic ocean. Front. Mar. Sci. 3:191. doi: 10.3389/fmars.2016.00191
Peterson, B. J. (1980). Aquatic primary productivity and the 14C-CO2: a history of the productivity problem. Annu. Rev. Ecol. Syst. 11, 359–385. doi: 10.1146/annurev.es.11.110180.002043
R Core Team (2014). R: A Language and Environment for Statistical Computing. Vienna: R Foundation for Statistical Computing.
Randelhoff, A., Reigstad, M., Chierici, M., Sundfjord, A., Ivanov, V., and Cape, M. R. (2018). Seasonality of the physical and biogeochemical hydrography in the inflow to the arctic ocean through fram strait. Front. Mar. Sci. 5:224. doi: 10.3389/fmars.2018.00224
Regaudie-de-Gioux, A., and Duarte, C. M. (2010). Plankton metabolism in the greenland sea during the polar summer of 2007. Polar Biol. 33, 1651–1660. doi: 10.1007/s00300-010-0792-1
Regaudie-de-Gioux, A., Lasternas, S. S., Agustí, S., Duarte, C. M., Agustí, S., and Duarte, C. M. (2014). Comparing marine primary production estimates through different methods and development of conversion equations. Front. Mar. Sci. 1:19. doi: 10.3389/fmars.2014.00019
Robinson, C., Archer, S. D., and Williams, P. J. B. (1999). Microbial dynamics in coastal waters of East Antarctica: plankton production and respiration. Mar. Ecol. Prog. Ser. 180, 23–36. doi: 10.3354/meps180023
Robinson, C., Tilstone, G. H., Rees, A. P., Smyth, T. J., Fishwick, J. R., Tarran, G. A., et al. (2009). Comparison of in vitro and in situ plankton production determinations. Aquat. Microb. Ecol. 54, 13–34. doi: 10.3354/ame01250
Shapiro, S. S., and Wilk, M. B. (1965). An analysis of variance test for normality (complete samples). Biometrika 52, 591–611. doi: 10.1093/biomet/52.3-4.591
Slagstad, D., Wassmann, P. F. J., and Ellingsen, I. (2015). Physical constrains and productivity in the future Arctic Ocean. Front. Mar. Sci. 2:85. doi: 10.3389/fmars.2015.00085
Steemann-Nielsen, C. (1952). The use of radiactive carbon (14C) for measuring organic production in the sea. J. Cons. Perm. Int. Explor Mer. 18, 117–140. doi: 10.1093/icesjms/18.2.117
Svensen, C., Halvorsen, E., Vernet, M., Franzè, G., Dmoch, K., Lavrentyev, P. J., et al. (2019). Zooplankton communities associated with new and regenerated primary production in the Atlantic inflow north of svalbard. Front. Mar. Sci. 6:293. doi: 10.3389/fmars.2019.00293
Tremblay, J. E., Gratton, Y., Fauchot, J., and Price, N. M. (2002). Climatic and oceanic forcing of new, net, and diatom production in the North Water. Deep Res. Part II Top. Stud. Oceanogr. 49, 4927–4946. doi: 10.1016/S0967-0645(02)00171-6
Vaquer-Sunyer, R., Duarte, C. M., Regaudie-De-Gioux, A., Holding, J. M., García-Corral, L. S., Reigstad, M., et al. (2013). Seasonal patterns in Arctic planktonic metabolism (Fram Strait - Svalbard region). Biogeosciences 10, 1451–1469. doi: 10.5194/bg-10-1451-2013
Vernet, M., Matrai, P. A., and Andreassen, I. (1998). Synthesis of particulate and extracellular carbon by phytoplankton at the marginal ice zone in the Barents Sea. J. Geophys. Res. 103, 1023–1037. doi: 10.1029/97JC02288
Keywords: primary production, Arctic Ocean, oxygen method, carbon methodology, Svalbard (Arctic) and plankton
Citation: Sanz-Martín M, Vernet M, Cape MR, Mesa E, Delgado-Huertas A, Reigstad M, Wassmann P and Duarte CM (2019) Relationship Between Carbon- and Oxygen-Based Primary Productivity in the Arctic Ocean, Svalbard Archipelago. Front. Mar. Sci. 6:468. doi: 10.3389/fmars.2019.00468
Received: 01 March 2019; Accepted: 11 July 2019;
Published: 02 August 2019.
Edited by:
Christian Grenz, UMR7294 Institut Méditerranéen d’Océanographie (MIO), FranceReviewed by:
Isabel Seguro, University of East Anglia, United KingdomVieira Vasco, University of Lisbon, Portugal
Copyright © 2019 Sanz-Martín, Vernet, Cape, Mesa, Delgado-Huertas, Reigstad, Wassmann and Duarte. This is an open-access article distributed under the terms of the Creative Commons Attribution License (CC BY). The use, distribution or reproduction in other forums is permitted, provided the original author(s) and the copyright owner(s) are credited and that the original publication in this journal is cited, in accordance with accepted academic practice. No use, distribution or reproduction is permitted which does not comply with these terms.
*Correspondence: María Vernet, mvernet@ucsd.edu