Strong and Dynamic Benthic-Pelagic Coupling and Feedbacks in a Coastal Upwelling System (Peruvian Shelf)
 Andrew W. Dale
 Michelle Graco2
 - 1GEOMAR Helmholtz Centre for Ocean Research Kiel, Kiel, Germany
- 2Instituto del Mar del Perú, Callao, Peru
Monthly time-series data (1998–2009) of bottom water oxygen, nitrate and nitrite concentrations from the outer shelf (150 m water depth) in the oxygen minimum zone offshore Peru were coupled to a layered biogeochemical sediment model to investigate benthic-pelagic coupling over multi-annual time scales. The model includes the mineralization of four reactive pools of particulate organic carbon (POC) with lifetimes of 0.13, 1.3, 20, and 1700 year that were constrained using empirical data. Total POC rain rates to the seafloor were derived from satellite based estimates of primary production. Solute fluxes and concentrations in sediment porewater showed highly dynamic behavior over the course of a typical year. Conversion of fixed N to N2 by denitrification varied from 1.1 mmol m−2 d−1 of N in winter to 1.8 mmol m−2 d−1 of N in summer with a long term mean N loss for the shelf of 1.5 mmol m−2 d−1 of N. Fixed N loss across the whole time-series agreed very well with a previously-published vertically-integrated sediment model for coupling the benthic and pelagic N cycle in regional and global models. Dissimilatory nitrate reduction to ammonium (DNRA) emerges as a major process in the benthic N cycle, producing on average 1.9 mmol m−2 d−1 of ammonium: more than twice the rate of ammonification of organic nitrogen. The model predicts sulfide emissions from the sediment of up to 1 mmol m−2 d−1 when POC rain rate exceeds 20 mmol m−2 d−1, in agreement with past observations of benthic sulfide fluxes and sulfide plume distributions in the water column. This study demonstrates that sediments on the Peruvian shelf are not static repositories that are independent of changes taking place in the water column. Our results strongly suggest the shelf sediments must exert an important feedback on biogeochemical processes in the overlying waters, and should be considered in regional model studies.
Introduction
The recycling and burial of biogenic material in continental margin sediments plays a key role in the regulation of ocean chemistry (Walsh, 1991). It is generally accepted that the rate of benthic remineralization of organic debris is strongly coupled to primary production and undergoes pronounced seasonality. This is not only true for the shelves and margins, but for the deep-sea too, which receives pulses of phytodetritus following the spring bloom (Billet et al., 1983; Lampitt, 1985). Proper consideration of seafloor recycling in ocean biogeochemical models and the linkages with water column tracer fields is becoming increasingly recognized as an important step in model validation and prediction (Kriest and Oschlies, 2013).
In environments experiencing strong interannual variability in bottom water redox conditions and carbon rain rates, benthic feedbacks may be difficult to predict without the application of sediment biogeochemical models. Non-steady state dynamics have been implemented into diagenetic models to study the seasonal evolution of benthic remineralization and fluxes across the sediment-water interface (Martin and Bender, 1988; Klump and Martens, 1989; Soetaert et al., 1996; Fossing et al., 2004; Dale et al., 2013). The advent of sophisticated modeling tools along with an expanding set of physico-biogeochemical time-series data from the water column and satellite sensors makes it possible to construct well constrained benthic models for accurately predicting the exchange of redox sensitive elements between the sediments and the ocean.
The Peruvian margin (Eastern Tropical South Pacific) is one such system that undergoes pronounced seasonal variability in biogeochemical and physical properties of the water column. This is mainly caused by variability in the intensity of upwelling-favorable winds and the delivery of nutrient–rich Equatorial Subsurface Water (ESSW) that fuels phytoplankton production there (Pennington et al., 2006; Chavez et al., 2008; Chaigneau et al., 2013; Graco et al., 2016). Primary productivity ranges from 1.8 to 5.2 g C m−2 d−1 (Pennington et al., 2006; Quiñones et al., 2010) and leads to a permanent oxygen minimum zone (OMZ) where dissolved oxygen concentrations are essentially zero (Thamdrup et al., 2012; Ulloa et al., 2012). On the shelf, however, bottom water redox conditions can be highly variable as a result of respiration in the water column plus the interaction of climatic variability and equatorial forcing associated with El Niño events and the passage of coastal trapped waves (Gutiérrez et al., 2008; Graco et al., 2016). This rather extreme setting should lead to strong and variable feedbacks between the sediment and water column.
In this study, monthly data (1998–2009) from the water column at a time-series station (150 m water depth) on the continental shelf offshore Peru are used in conjunction with satellite-derived organic matter rain rates to predict the response of sediment biogeochemistry to natural variability in the overlying waters. The benthic feedbacks are determined using a diagenetic model with a focus on the carbon, nitrogen and sulfur cycles. It is our objective to demonstrate and quantify benthic remineralization under natural conditions on the Peruvian margin and highlight the scale of variability that can be expected. The model is also used to derive a function for predicting daily benthic fixed N loss (to N2) and reduction of nitrate (to ammonium) in regional biogeochemical models of the Peruvian upwelling and similar low oxygen systems. We conclude that proper consideration of benthic processes ought to be considered in regional models of the Peruvian margin, and margins in general, in order to fully understand and quantify nutrient turnover in the overlying water column.
Site Description
The time-series station is located 20 nautical miles offshore at a water depth of 150 m (Figure 1A). Monthly vertical profiles of temperature, salinity, oxygen and nutrients (nitrate, nitrite, phosphate and silicate) have been measured there by the Instituto del Mar del Perú (IMARPE) between 1996 and 2009 (Graco et al., 2016). The station is located in a main upwelling cell that experiences maximum primary production in the austral summer (February–April, low upwelling), hereafter termed “summer,” and lower productivity in austral winter (July–September, high upwelling), hereafter termed “winter” (Echevin et al., 2008). An example of satellite derived chlorophyll a in the wider region during one of our research campaigns (January 2013) clearly shows the elevated values along the coastal margin where upwelling strength is greatest (Figure 1B). Highest rates of primary productivity are 6 months out of phase with upwelling intensity due to several factors including light limitation as a result of the deepening of the mixed layer during the upwelling period (Echevin et al., 2008; Quiñones et al., 2010). Data from the time-series station show that the vertical extent of the OMZ exhibits significant variability at different time scales due to El Niño and the passage of coastal trapped waves (Graco et al., 2016). The 22 μM upper boundary of the OMZ usually resides at 20–40 m during the high productivity season, deepening to 70 m in winter (Graco et al., 2016). During El Niño, bottom waters can become ventilated down to 100 m or more (Levin et al., 2002).
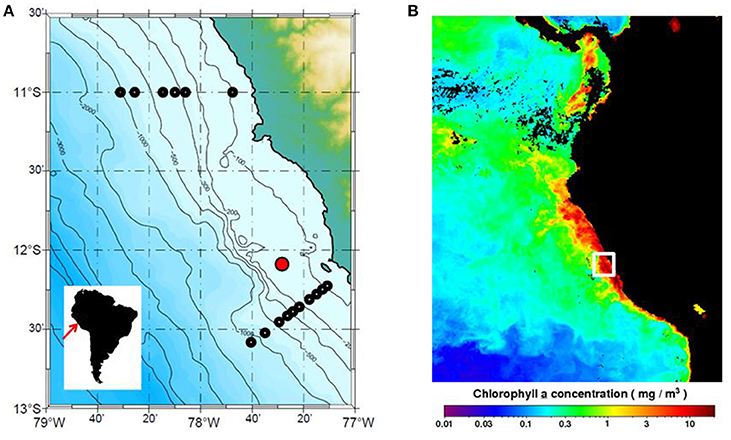
Figure 1. (A) Peru margin and sampling locations. The location of the IMARPE time-series station (150 m water depth, red symbol) and the sampling stations at 11°S and 12°S (black symbols) where organic carbon rain rates were determined by Dale et al. (2015) are indicated (see Figure 3C). Monthly satellite data (1/6 degree resolution) were used to determine mean PP and EP fluxes for the ocean area shown (77 to 79°W and 10.5 to 13°S). (B) Chlorophyll a data (mg m−3) for January 2013 from the Aqua MODIS satellite (OCx algorithm) for the Eastern Tropical Pacific accessed in December 2016 from the Ocean Biology Processing Group (OBPG) of NASA Goddard Space Flight Center (https://oceancolor.gsfc.nasa.gov/cms/). The white box shows the approximate position of the transects in (A).
Sediments nearby the time-series station are diatomaceous, rapidly accumulating muds displaying high rates of microbial sulfate reduction (Suess et al., 1987; Fossing, 1990; Böning et al., 2004). Surface particulate organic carbon (POC) content is high in the OMZ (15 to 20 wt.%) with lower values (5 to 10 wt.%) on the shelf and in deep waters (Böning et al., 2004). δ13C analysis and other geochemical indicators confirm that the organic matter at this latitude is almost entirely of marine origin (Arthur et al., 1998; Levin et al., 2002).
The sediments down to around 400 m are highly reducing and colonized by dense, centimeter-thick mats of gelatinous sheaths containing microbial filaments of the large sulfur oxidizing bacteria Thioploca spp. (Gallardo, 1977; Henrichs and Farrington, 1984; Schulz et al., 1996; Gutiérrez et al., 2008). These bacteria glide vertically through the sediments to access sulfide which they oxidize using nitrate stored within intracellular vacuoles (Jørgensen and Gallardo, 1999). Nitrate reduction by Thioploca using sulfide leads to ammonium as the end product (i.e., dissimilatory nitrate reduction to ammonium, DNRA, Otte et al., 1999; Graco et al., 2001). The ammonium produced leaks out of the sediment and fuels water column N loss by anammox (Kalvelage et al., 2013). Biological oxidation of sulfide is a major sink for sulfide in Peruvian shelf sediments (Bohlen et al., 2011; Dale et al., 2016). Bacterial biomass can be diminished if electron acceptors in the bottom water are depleted or if large amounts of organic matter are deposited on the sea bed (Gutiérrez et al., 2008). Consequently, at these times, sulfide is able to bypass the microbial filter and escape to the bottom water (Schunck et al., 2013; Sommer et al., 2016).
Model
The numerical model is based on a previous diagenetic model used to investigate the response of benthic N fluxes to temporal anoxia and nitrate depletion in the water column on the Peruvian shelf (Dale et al., 2016). The model couples reaction and transport in a vertically-resolved 1-D framework for the upper 50 cm of sediment. It considers 9 solutes and particulate organic carbon. Transport processes included are sediment burial, compaction, molecular diffusion and low rates of biodiffusion (bioturbation). Uptake and intracellular storage of nitrate by Thioploca is also considered. Further model details on these aspects can be found in the Supplementary Material.
We used previous steady state models of the benthic N cycle on the Peruvian shelf to parameterize the model (Bohlen et al., 2011; Dale et al., 2016). There is uncertainty in applying the same parameterization to a non-steady state scenario since, as will become clear later, sediment geochemistry shows considerable temporal variability. Benthic fluxes and porewater concentration data are available at 11°S and 12°S from summer 2008 and 2013, respectively, and permit some constraint on the rates of modeled processes (Bohlen et al., 2011; Sommer et al., 2016). Importantly, however, the reactivity of organic matter in the sediment is not arbitrarily assigned based on literature values, but is carefully tailored to the Peruvian shelf, as described below.
POC Degradation
The rain rate of particulate organic carbon (POC) to the sediment surface and its degradation in the sediment drives all the biogeochemical processes taking place in the model. The depth and rate where POC mineralization occurs will affect the distribution of solutes in sediment porewaters, their turnover rates and the flux of solutes between the sediment and the ocean. It is therefore critical to describe POC degradation as accurately as possible.
Bulk POC can be envisaged as a continuum of reactive particulate fractions, each having its own discrete first-order rate constant (Middelburg, 1989; Boudreau and Ruddick, 1991). In the steady state version of our model, the reactivity of bulk POC pool is constrained directly from the ammonium () profile and decreases smoothly with depth in the sediment, that is, as a reactive continuum (Bohlen et al., 2011; Dale et al., 2016). However, this approach is not suitable for non-steady state applications because of complications in defining the boundary conditions for a single POC pool whose reactivity decreases with sediment depth (i.e., over time). It is thus necessary to define several POC fractions, or “G,” that capture the spectrum of our known bulk reactivity on the Peruvian margin; otherwise known as the multi-G model (Jørgensen, 1978).
Our aim is to parameterize a multi-G model consisting of several POC fractions, i, each being degraded with a rate constant kGi. The fluxes of each fraction to the seafloor and the rate constants were constrained using the known distribution of POC degradation rate with depth in sediments on the Peruvian margin (RPOC). In the first step, the RPOC profile was obtained from the average model-derived RPOC profile from 3 stations (128, 142, and 195 m) on the outer shelf at 12°S which neighbor the time-series station (Dale et al., 2016). POC degradation at each of these stations was tightly constrained in that study using porewater data, POC content and benthic fluxes of dissolved inorganic carbon and nitrogen. The average RPOC profile for these stations is shown in Figure 2A (dotted red curve). RPOC decreases by three orders of magnitude over the upper 20 cm, reflecting rapid respiration of the labile organic components.
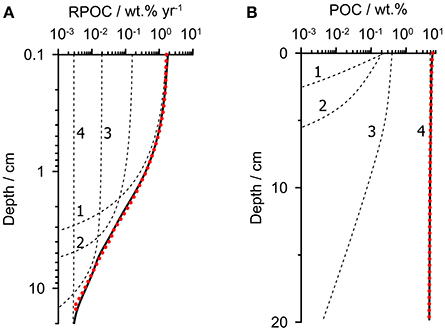
Figure 2. Extraction of a multi-G model (four fractions) from the known POC degradation rate profile. (A) The dotted red curve shows the modeled POC degradation rate in the upper 20 cm of sediment predicted using the mean rate profile of POC degradation (RPOC) from the outer shelf (Dale et al., 2016). (B) The dotted red curve shows the corresponding POC content for the RPOC profile in (A). The dashed black curves in (A,B) show the individual fractions whose total (solid black lines) matches the bulk property distributions. Rate constants and fractions are given in Table 1.
The second step is to use this rate profile to predict the corresponding POC content. The POC content and the rate profile are both needed in the subsequent step to fully constrain the parameters of the multi-G model. To achieve this, the RPOC profile was used as a forcing function in a steady state 1-D reaction-transport model that considers POC degradation as well as burial with compaction and bioturbation in the upper 20 cm. The model simply calculates the POC content for the imposed RPOC profile, POC rain rate and transport processes. The rain rate was taken as 17 mmol m−2 d−1 (204 mg m−2 d−1), which is the average rain rate determined for the outer shelf stations (Dale et al., 2015). From the same study, the sediment accumulation rate and bioturbation coefficient were determined by radiotracer measurements to be 0.15 cm year−1 and 2 cm2 year−1, respectively. The resulting simulated surface POC content of 5.7 wt.% (Figure 2B, dotted red curve) is close to the measured value on the outer shelf of 7.5 ± 3.2 wt.% (Dale et al., 2015). The carbon burial efficiency is 50%, which is well within the range of 24–74% determined for these stations based on measured POC accumulation rates and in situ flux measurements of dissolved inorganic carbon.
Finally, in step 3, the multi-G model was fit to the RPOC and POC profiles using a reaction-transport model with several discrete POC fractions, employing identical sediment accumulation and bioturbation rates as in step 2. We found that a model with 4 POC fractions was adequate to give optimal fits to both profiles over the sediment depth range (Figure 2, dashed lines and Table 1). Fewer fractions were insufficient, and more fractions introduce additional and unwarranted parameter uncertainty. As an initial model constraint, we chose a value of kG1 = 8 year−1 and kG2 = 0.8 year−1 for the two most reactive fractions (POC1 and POC2) based on degradation experiments of fresh phytodetritus under anoxic conditions (Westrich and Berner, 1984). These appear to be satisfyingly appropriate for this setting (Figure 2). The two remaining rate constants were constrained solely from the RPOC and POC profiles. The results show that around 35% of the POC pool is highly reactive (POC1) with a further 10% attributed to POC2. The corresponding lifetimes (1/kGi) of these fractions are 0.13 and 1.3 year. Around half of the organic material is barely degradable on the time-scales of interest to this study (POC4), with a lifetime of 1700 years, with a smaller fraction (6%) attributed to POC3 with a lifetime of 20 years. Only the least reactive fraction survives below ca. 10 cm, and is thus mainly responsible for the 50% carbon burial efficiency in the OMZ (Dale et al., 2015).
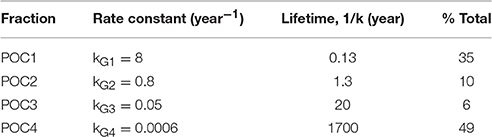
Table 1. Best fit parameters of the multi-G model.
It is important to note that the rate constants and POC fractions derived from this procedure bear additional uncertainties since they have been derived using RPOC profiles that are assumed to be in steady state but which clearly are not (see Figure 4 in Results). The reader should therefore be aware that our POC kinetics, especially of the more reactive fractions, probably better reflect the summer situation from which the RPOC profiles were derived, rather than winter. We would require data on the temporal variability in benthic mineralization to minimize this uncertainty.
Benthic N Cycle
The current model contains a more complete N cycle than the non-steady state version developed previously (Dale et al., 2016). Mass balances, model calculations and biogeochemical observations suggest that sulfide (H2S) oxidation to sulfate () coupled to nitrate () reduction by vacuolated Thioploca spp. is a major process in Peruvian shelf sediments (Henrichs and Farrington, 1984; Fossing et al., 1995; Huettel et al., 1996; Otte et al., 1999; Bohlen et al., 2011). This process, DNRA, can be described as (Zopfi et al., 2001):
where “B” denotes stored within vacuolated bacteria. Being motile, Thioploca can directly access the bottom water reservoir by extending their filaments through the benthic boundary layer (Huettel et al., 1996). Enhanced transport of into the sediment by Thioploca is simulated in the model (Dale et al., 2016), and this leads to an increase in the intracellular biological pool (see Supplementary Material). Reduction of B during DNRA is simulated as a first-order loss term, where the rate constant was set to 30 year−1, equal to a mean lifetime of around 2 weeks. This value was determined from the observed decrease in the intracellular pool during a period when Thioploca were surviving on their internal reserves (Dale et al., 2016). Simulated B concentrations are reported on a porewater basis, that is, the equivalent concentration of the internal B pool if it were distributed evenly in the porewater. The surface B content is used as a boundary condition in the model and was scaled to bottom water concentrations as described in the Supplementary Material.
On the Peruvian shelf, DNRA may produce more in the sediment than ammonification:
where CH2O represents POC of zero oxidation state and rNC is the molar N-to-C ratio that links organic N, defined above as a NH3 moiety, to POC degradation. Organic phosphorus and phosphorus dynamics in general are not considered. The role of Thioploca on P dynamics in these settings is not well understood (Lomnitz et al., 2016), and will be addressed in a forthcoming manuscript. Mineralization of POC by an oxidant thus produces in addition to reducing equivalents and dissolved inorganic carbon (DIC) and a net change in protons (ΣH+). Acid-base speciation is not dealt with explicitly in this model. POC mineralization pathways include aerobic respiration, reduction to nitrite (), denitrification of to N2, and sulfate reduction. Methanogenesis and metal oxide reduction are unimportant in surface sediments on the Peruvian shelf (Dale et al., 2016).
Initial simulations at the time-series station using the above-derived rate constant for DNRA showed that this process alone cannot completely diminish the benthic H2S flux because the rates of sulfate reduction are so high. Given that no benthic H2S flux was detected on the shelf at 150 m (Sommer et al., 2016), an additional H2S removal process was required in the model to prevent its escape to the water column. An immediate increase in H2S concentration inside benthic chambers when and fell below 0.5 μM (Dale et al., 2016) indicates that H2S removal may be coupled to the reduction of and/or , that is, chemoautotrophic denitrification, CD (Lam and Kuypers, 2011):
We ruled out as the end product of this reaction since the budget is already well constrained by benthic chamber fluxes and porewater concentrations (Dale et al., 2016). The microorganisms that mediate CD are assumed to be non-vacuolated and non-motile and so rely on and that diffuses into the sediment or produced in situ by nitrification. These aspects are discussed further later on.
Heterotrophic denitrification (HD) produces N2 during the oxidation of POC using :
The rate of HD is determined directly from the rate of POC degradation (see Supplementary Material).
Finally, anammox is the other reaction in the model that leads to fixed N loss to N2:
Other processes included are aerobic nitrification of and and aerobic oxidation of H2S. We do not consider precipitation of particulate S in the current model. For typical particulate S content on the shelf of 1.5 wt.% and sediment mass accumulation rate of 1 g m−2 d−1 (Suits and Arthur, 2000; Scholz et al., 2011; Dale et al., 2016), S burial amounts to ca. 0.4 mmol m−2 d−1, equivalent to around 15% of sulfate reduction (see Results).
Dynamic Model Boundary Conditions
POC Rain Rate (RRPOC)
Organic carbon rain rates were estimated for the IMARPE time-series site from satellite-based primary production (PP) and export production (EP). PP was calculated using the Vertically Generalized Production Model as a function of satellite-derived chlorophyll, available light, and the photosynthetic efficiency (Behrenfeld and Falkowski, 1997). Monthly averaged PP data on a 1/6 degree resolution for the Peruvian margin between 77 and 79°W and 10.5 and 13°S (Figure 1A) were downloaded in February 2016 from the Oregon State University Ocean Productivity Center (http://www.science.oregonstate.edu/ocean.productivity/index.php). To cover the period of the IMARPE time-series sampling (January 1998 to December 2009), PP were derived using data from the SeaWiFS (1998–2007) and MODIS sensors (2002–2009).
PP shows considerable seasonal variability (Figure 3A) with highest values in summer (February–April) and lowest values in winter (July–September). MODIS derived productivity data are on average ca. 25% higher than SeaWiFS data over the period 2003–2008 where data from both sensors are available (Figure 3A). This discrepancy can be traced back to the variability in the chlorophyll concentrations rather than SST. SeaWiFS mean monthly chlorophyll concentrations in the Peruvian coastal zone have been shown to underestimate the measured in situ concentrations by as much as 100% (Echevin et al., 2008). This implies that MODIS derived satellite data may be more accurate than SeaWiFS for this geographical region. These authors further remark that the SeaWiFS algorithm used to calculate surface chlorophyll tends to underestimate the high concentrations in coastal zones, citing Hooker and McClain (2000). They also note that frequent nearshore cloud coverage, especially in winter, could cause an improper quantification of the intense surface blooms. Thus, the two data sets were aligned by increasing the SeaWiFS productivity by a factor of 1.25, resulting in a mean PP of 2.7 ± 1.2 g C m−2 d−1 for the time period 1998 to 2015 that is in good agreement with observations of 1.8 to 5.2 g C m−2 d−1 based on ship-collected PP estimates (Pennington et al., 2006; Quiñones et al., 2010).
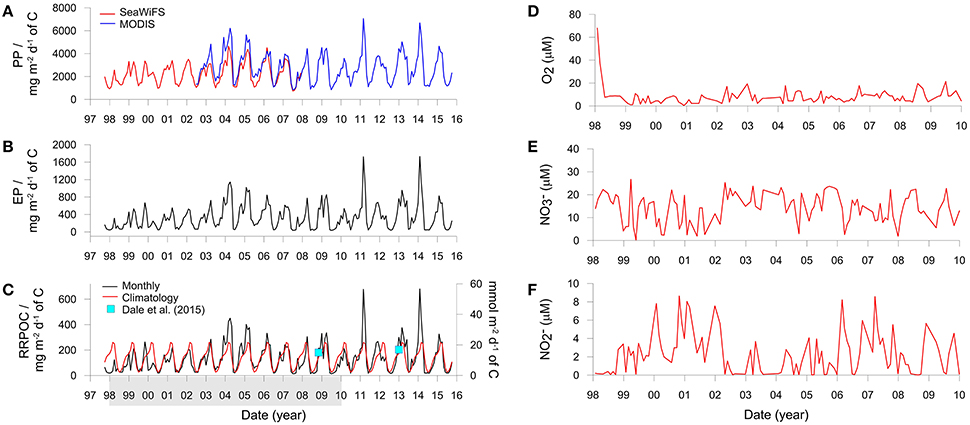
Figure 3. Derived variables and boundary conditions used to run the benthic model. (A) Monthly averaged primary production derived using SeaWiFS and MODIS satellite data, (B) Monthly averaged export production, and (C) Monthly averaged and climatological (long-term daily mean) organic carbon rain rates. PP and EP are averaged over the ocean area shown in Figure 1 whereas RRPOC is adjusted to fit the data (blue squares) from the shelf. The latter are equal to 15 mmol m−2 d−1 at St. 1 in Bohlen et al. (2011) for November 2008 and an average of 17 mmol m−2 d−1 at St. 3, 4, and 5 in Dale et al. (2015) for January 2013 (the mean chlorophyll a concentrations for January 2013 are shown in Figure 1B). The shaded bar in (C) shows the time period over which the model is executed. (D–F) Show the concentrations of temporally-variable dissolved species in the bottom water (μM).
The spatially resolved monthly PP estimates were used to determine EP at each grid point using the pe-ratio that gives the fraction of PP exported out of the euphotic zone (Equation 1b in Dunne et al., 2005). This empirical function requires sea surface temperature (SST), chlorophyll concentration and euphotic depth as input variables and is valid for a pe range of 0.04–0.72. pe-ratios that fell below this range were set to 0.04 (pe ratios did not exceed 0.72). The pe-ratio data corresponding to the MODIS data were calculated from monthly MODIS SST and chlorophyll concentrations downloaded from the Ocean Productivity Center. Similarly, the adjusted SeaWiFS chlorophyll data were used for the corresponding SeaWiFS pe ratio, whereas SST was determined using AVHRR data (NOAA). Euphotic depths were calculated directly from chlorophyll concentrations following Morel and Berthon (1989). pe-ratios were always below 0.26 due to warm surface waters (16–24°C). This is consistent with observations that most PP in the Humboldt system is mineralized in the euphotic zone (Quiñones et al., 2010 and references therein).
Export production using the MODIS and adjusted SeaWiFS productivity data is shown in Figure 3B. Mean EP between 1998 and 2015 is 340 ± 290 mg C m−2 d−1. Very low EP coincided with periods of warm water masses and low chlorophyll concentrations (not shown). These conditions were established, for example, in late 1998 during the strongly positive ENSO (Gutiérrez et al., 2008; Quiñones et al., 2010). The EP data were then used to determine the organic carbon rain rate to the seafloor (RRPOC). Yet, given that the EP data in Figure 3B represent the average of the shelf and upper slope (Figure 1A), they are not directly applicable to the time-series station at 150 m. RRPOC data at 150 m were thus obtained by linearly adjusting the whole EP time-series data downwards linearly until the data coincided with the two known RRPOC data points that are available for the outer shelf stations at 11°S and 12°S (blue squares in Figure 3C). The application of empirical functions, such as the Martin curve (Martin et al., 1987), are probably not suitable alternatives to determine rain rates on the shelf due to lateral advection of particles (Arthur et al., 1998). The adjusted RRPOC ranges between 13 and 680 mg m−2 d−1, with mean summer values (237 ± 142 mg m−2 d−1) being 6-fold higher as those in winter (40 ± 31 mg m−2 d−1) and with a long term average of 134 ± 115 mg m−2 d−1. The years 2004, 2005, 2011, and 2014 are noteworthy since the RRPOC was considerably higher than the climatological rain rate (red curve), which is the daily average of all data. The monthly RRPOC data, interpolated linearly, were imposed as a time-variable boundary condition for total POC deposition flux in the benthic model. The fluxes of the four POC fractions vary with the rain rate in the proportions given in Table 1.
Table 2 provides and overview of the pelagic POC fluxes for the period between 1998 and 2010 where IMARPE data is available. Average PP, EP and RRPOC are 2744 ± 1153 mg m−2 d−1, 316 ± 256 mg m−2 d−1, and 124 ± 101 mg m−2 d−1, respectively. These numbers show that shelf sediments at Peru capture up to 40% of the EP and 5% of PP, and thus likely provide an important feedback to water column biogeochemistry.
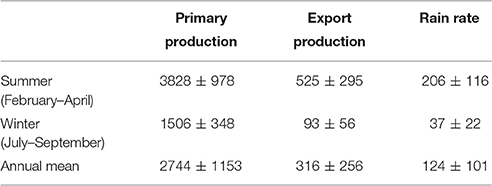
Table 2. Summary of mean POC fluxes (in mg m−2 d−1) for the Peruvian margin at the time-series station for the period 1998–2010.
Bottom Water Chemistry
Concentrations of dissolved oxygen and nutrients (O2, , ) in the water column at the IMARPE time-series station show enormous temporal variability that cannot be explained by seasonality alone (Gutiérrez et al., 2008; Graco et al., 2016). Concentrations often range by several tens of micromolar on a monthly basis. This variability is partly driven by biological factors such as phytodetrital sedimentation and decay as well as physical factors such as the poleward propagation of coastal trapped waves, which are stronger and more frequent during El Niño (Gutiérrez et al., 2008). These waves deepen the pycnocline and ventilate the bottom waters, as can be seen by the high O2 levels during the strong 1997/1998 El Niño and the weaker warm event in 2002/2003 (Figure 3D; Graco et al., 2016). We extracted monthly data of O2, and from the lowest water column sampling depth (90 or 140 m) to use as upper (seawater) boundary conditions in the benthic model (Figures 3D–F). Approximately half the data are from 90 m, where O2 concentrations are on average a factor of 2 higher than those at 140 m (~16 vs. 8 μM). O2 data from 90 m were thus reduced by a factor of two for the implementation of the boundary condition. and concentrations between 90 and 140 m showed no statistical differences (two tailed t-test, p > 0.05). Occasional monthly gaps in the database (max. 8 data points) were filled using linear interpolation between adjacent data points. The solute time-series' were linearly interpolated for implementation as boundary conditions in the model. Concentrations of all other solutes were set to fixed concentrations (see Supplementary Material). This latter assumption does not significantly affect the model results.
Model Spin-Up
Model results are shown for the 12 year period between 1 January 1998 and 31 December 2009 when bottom water chemistry and rain rate data are simultaneously available. Prior to this, the model was spun-up to generate a realistic initial condition. The mean RRPOC data for the first 3 years (1998–2000, Figure 3C) was used to derive seasonally-cycling profiles of the POC fractions. At the same time, constant bottom water concentrations equivalent to 3 μM of O2, 14 μM of , and 2 μM of were imposed. It should be noted that porewater concentrations nonetheless vary over time in this initialization step due to the seasonal variability in rain rate.
The initial condition is only an approximation of reality since time-series rain rate estimates prior to 1998 are unavailable. However, the uncertainty created at the start of the simulation (1 January 1998) will be limited by the fact that the lifetime of almost half of the POC is around 1 year or less, and the other half is mostly refractive on the time scales relevant to the simulated sediment column (Table 1). The reactive fractions will mainly determine the reactivity of the surface sediments and the solute flux across the sediment-water interface. Specifying the initial condition for O2, and is less critical since their distribution is limited to the surface millimeters or centimeters and their residence time in the porewater is on the order of hours. All initial concentration profiles for 1 January 1998 were taken from the final day (31 December) of the spin-up simulation.
Results
Sediment Geochemistry
Selected geochemical profiles from the final year of the simulation are shown to illustrate the intra-annual dynamicity of the sediments (Figure 4). The model results agree well with observations made close to the time-series station in summer 2013 (Dale et al., 2016). The reactive POC fractions (1 and 2) show clear seasonal variability due to their high reactivity. With increasingly refractivity, less variability is observed. The variability in POC content is linked to the rate of POC degradation which varies by an order of magnitude in the surface layers (Figure 4B). Dissolved O2, and show pronounced variability in the upper millimeters caused both by the changing bottom water concentrations and the input of labile organic matter (Figures 4C–E). and concentrations also occasionally show subsurface peaks. Further model simulations with constant O2 boundary conditions (not shown) indicate that these peaks are driven by nitrification when O2 is available in the bottom water, rather than changes in bottom water and . The results demonstrate that down-core measurements of using microsensors (e.g., Glud et al., 2009) from a single time point could not be used to accurately extrapolate fluxes over an annual cycle at this site.
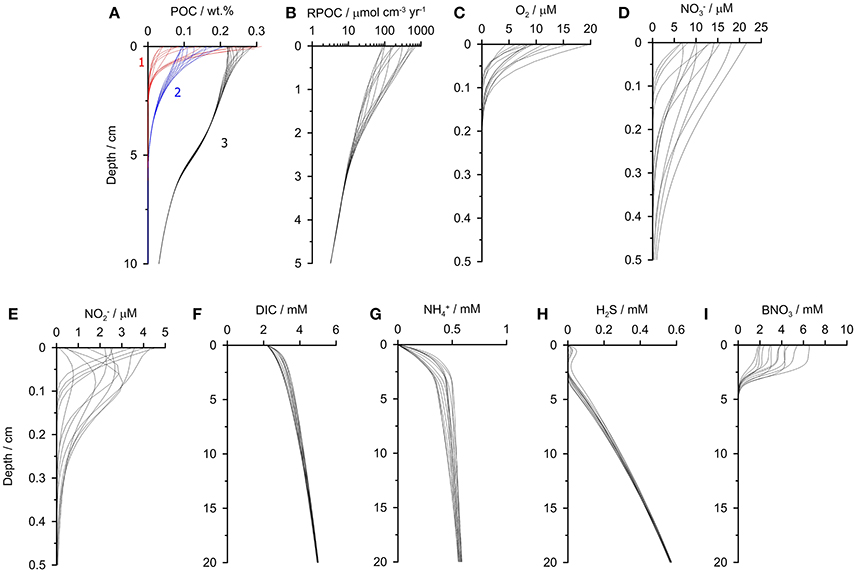
Figure 4. Sediment profiles of (A) POC, (B) POC mineralization, (C) O2, (D) , (E) , (F) DIC, (G) , (H) H2S, and (I) biological nitrate, B. The profiles are extracted from the last simulation year (2009) at monthly time intervals. In (A) the different POC fractions 1–3 are labeled. The most refractive fraction POC4 barely changes down-core and is not shown for clarity. The model simulates down to 50 cm, and only the upper portions of sediment are shown here (note different depth scales).
Pronounced temporal variability is even seen in the solutes that have constant boundary conditions (Figures 4F–H). Yet, whereas the variability in DIC concentrations is only due to the seasonality in rain rate and POC degradation, the profiles of show more variability since they are modified by biological transport and reduction by Thioploca (Figure 4I). The effect of anammox and nitrification on concentrations is limited to the surface 0.5 cm where and are available.
Finally, the model predicts a lack of H2S in the upper 3 cm except for a small subsurface peak in H2S of ca. 20 μM that is also apparent in porewater measurements made at 101 and 128 m water depth (Dale et al., 2016). This reflects extremely high rates of POC respiration by sulfate reduction and, at the same time, very efficient microbial H2S oxidation, but not quite enough to completely eliminate H2S in the top centimeter.
Benthic Fluxes and Mineralization Processes
Solute fluxes across the sediment surface demonstrate high temporal variability (Figures 5A–F and Table 3). O2 and fluxes show no obvious trends because their rate of sediment uptake is largely determined by their bottom water concentrations which are highly variable due to displacement and exchange of shelf waters (Graco et al., 2016). O2 flux was highest in 1998 (−4.0 mmol m−2 d−1) when bottom waters became ventilated during a strong El Niño event. It should be noted that during our fieldwork in 2008 and 2013 the O2 flux was essentially zero on the shelf because bottom water O2 levels were below detection limit (Table 3, Dale et al., 2016). uptake by the sediment tends to be higher in summer due to elevated POC flux (−0.3 mmol m−2 d−1) in combination with abundant in the bottom water. During winter, the rain rate is diminished and fluxes are more directed toward the water column (0.2 mmol m−2 d−1). Fluxes of and DIC show the same seasonal trends as POC rain rate with highest values in summer and lowest in winter.
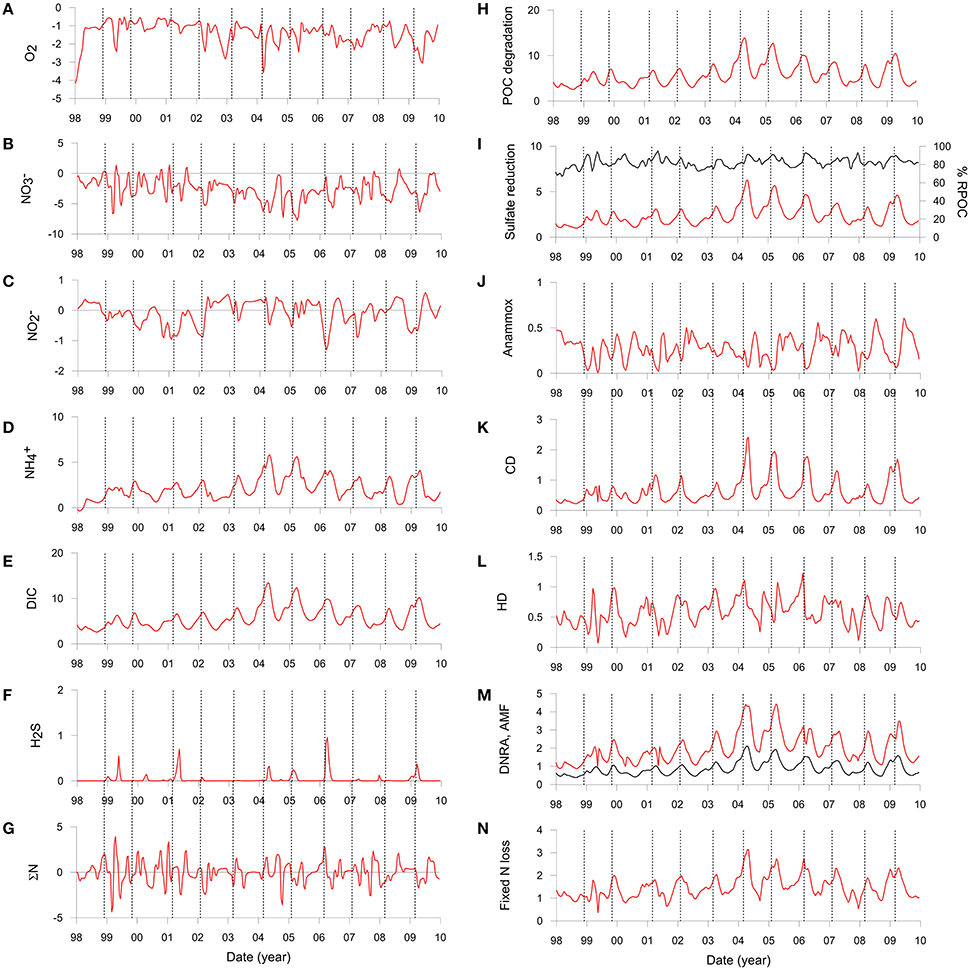
Figure 5. Simulated benthic fluxes (left) and depth-integrated rates (right) on the Peruvian shelf extracted at bi-weekly intervals and interpolated linearly. Positive fluxes denote release from the sediment to the water column and vice versa. (A) O2, (B) including uptake by nitrate-storing bacteria, (C) , (D) , (E) DIC, and (F) H2S. All fluxes are in in mmol m−2 d−1. (G) shows the net N balance (ΣN) equal to the sum of fluxes + + + 2 × N2 + RAMF in mmol m−2 d−1. (H) POC mineralization (mmol m−2 d−1 of C), (I) Sulfate reduction (mmol m−2 d−1 of S), where the right axis is the fraction of POC mineralized by sulfate reduction (black curve). (J) Anammox (mmol m−2 d−1 of N), (K) Chemoautotrophic denitrification (mmol m−2 d−1 of N), (L) Heterotrophic denitrification (mmol m−2 d−1 of N), (M) DNRA (mmol m−2 d−1 of N) and ammonification (mmol m−2 d−1 of N) (black curve), and (N) total fixed N loss (mmol m−2 d−1 of N) by anammox and denitrification [Equations (3) to (6)]. The vertical dashed lines show the time of maximum rain rate for each year.
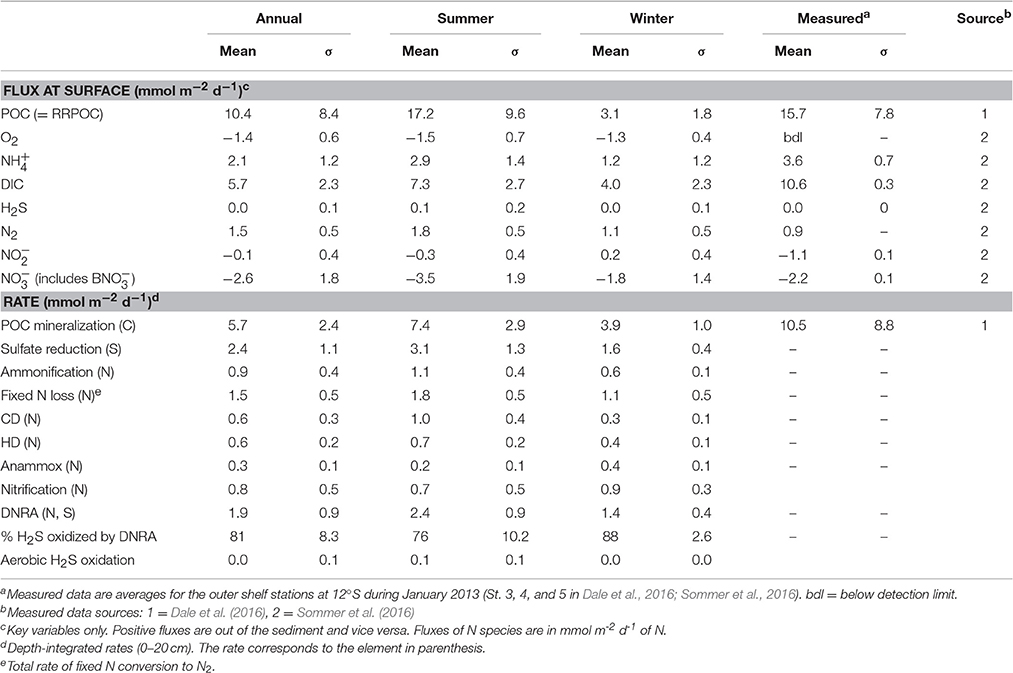
Table 3. Mean (± 1 standard deviation, σ), modeled and measured fluxes and depth-integrated rates (upper 50 cm).
The model predicts negligible efflux of H2S (Figure 5F) which is in line with observations on the shelf in summer (Bohlen et al., 2011; Sommer et al., 2016). Notable H2S release events up to 1.0 mmol m−2 d−1 were predicted during early summer in other years (e.g., 2006) and at the end of summer in 1999. These emissions coincide with periods of elevated carbon rain rate, demonstrating a direct link between carbon input and H2S release.
Organic matter mineralization in the sediment shows regular seasonal patterns driven by organic matter input (Figures 5H–N). Mean POC degradation is 5.7 mmol m−2 d−1, and ranges between a minimum of 2.6 mmol m−2 d−1 in August 1998 during the strong El Niño event to 14.0 mmol m−2 d−1 in April 2004. Summer and winter averages for the whole period are 7.4 and 3.9 mmol m−2 d−1, respectively (Table 3). On average, 83% of the POC is respired by sulfate reduction, with a mean rate of 2.4 mmol m−2 d−1 of S (Figure 5I, Table 3). Furthermore, 81% of the H2S is consumed by DNRA, with the remainder either escaping the sediment by diffusion or oxidized by chemoautotrophic denitrification (CD). As for DNRA, CD acts as an important barrier for H2S emissions and a sink for fixed N ( and ). The maximum CD rates occurred in 2004 to 2006 when rain rate and sulfate reduction were highest. Heterotrophic denitrification is equivalent to around 15% of CD. Both these processes contribute to N loss, which increases from 1.1 mmol m−2 d−1 in winter to 1.8 mmol m−2 d−1 in summer, with a mean of 1.5 mmol m−2 d−1 (Figure 5N; Table 3). These are similar to rates in sediments in the OMZ offshore Chile measured by Farías et al. (2004) and to those determined by mass balance at Peru (Bohlen et al., 2011; Dale et al., 2016; Table 3). In contrast, DNRA conserves fixed N in the system and produces twice as much as ammonification (Figure 5M). Given that anammox consumes around one-third of produced by ammonification and DNRA (Table 3), most of the diffuses out of the sediment and enters the water column. This is important for the system-wide N balance, because production by DNRA can be an important driver for N loss in the water column by anammox (Kalvelage et al., 2013).
Discussion
Sediment Feedbacks on the Peruvian Shelf
The intra-annual biogeochemistry of the Peruvian upwelling system is well-recognized, resulting from strong seasonality in the intensity of upwelling, primary production and hydrodynamic factors (Pennington et al., 2006; Echevin et al., 2008, 2014; Gutiérrez et al., 2008; Graco et al., 2016). Yet, the corresponding variability in sediment biogeochemistry on the Peruvian shelf is only just beginning to be appreciated. This has been demonstrated here by coupling water column time-series data to an empirical diagenetic model. Time-series data provide invaluable boundary conditions for sediment models that allow the strength and direction of benthic-pelagic feedbacks to be quantified (e.g., Fossing et al., 2004; Dale et al., 2013). We have shown that the sediments on the Peruvian shelf are not static repositories that are independent of changes taking place in the water column. Rather, benthic reaction rates and fluxes vary several-fold over the course of the year in concert with upwelling and organic carbon rain rate. Considerable temporal variability in benthic feedbacks has been observed in the adjacent upwelling zone further south in Conception Bay (Chile); a site also characterized by microbial mat communities (Graco et al., 2001; Farías et al., 2004). A well-defined coupling between the benthos and water column is probably true for continental shelves in general and deeper waters too (Martin and Bender, 1988; Soetaert et al., 1996).
It is interesting to note that the seasonality in benthic biogeochemical reactions is greatly attenuated with regard to the input of organic matter to the sediment. This is illustrated by the rate of POC degradation, which is around two times higher in summer than winter whereas the rain rate is five to six times higher (Table 3). Benthic DIC fluxes are similarly attenuated. The maximum DIC flux also slightly lags behind the maximum rain rate by around 3–4 weeks (vertical lines, Figure 5E). This lag is also apparent in the and H2S flux as well as in the POC degradation rate (Figure 5H). Clearly, then, the POC rain rate to the seafloor does not exclusively determine the benthic solute fluxes at any given time.
These temporal lags have implications for the benthic N balance too. Under steady state conditions, the net sum of the dissolved N fluxes and ammonification across the sediment surface should equal zero. This mass balance, plotted as ΣN in Figure 5G, demonstrates that an imbalance of a few mmol m−2 d−1 on a month-by-month basis is the norm rather than the exception. There is no obvious seasonal trend, with positive and negative ΣN occurring in both summer and winter. Maximum deviations from steady state occurred in summer 1999 when ΣN increased to ca. 4 mmol m−2 d−1. Similar N imbalances based on single time point measurements have been observed on the outer Peruvian shelf (Sommer et al., 2016) and in the California Borderland basins (Chong et al., 2012).
The chief causes of the N imbalance are ammonification and DNRA. The former process directly depends on the rate of organic matter mineralization whereas the latter indirectly depends on organic matter mineralization via the rate of H2S production by sulfate reduction. Organic matter that falls to the seafloor is not instantaneously mineralized, but decays over time according to the derived rate constants in Table 1. The seasonality in rain rate thus leads to temporal storage of solids and solutes in the sediment and, consequently, biogeochemical reactions (Martin and Bender, 1988). Similar deviations from steady state have been reported for sites with transient development of bacterial mats of filamentous Beggiatoa spp. and subsequent release of associated with DNRA (Graco et al., 2001).
More generally, the model provides a rough idea of the uncertainty in benthic turnover rates that are derived from single time point measurements. For instance, if benthic DIC fluxes collected in summer are used to determine total benthic respiration rates using mass balances or modeling (e.g., Bohlen et al., 2011; Dale et al., 2016), Figure 5E and Table 3 inform us that the derived rates will have a 30% margin of error (deviation from annual mean). The error using data from winter rises to around 40%. This is greater than the typical uncertainty in measured fluxes due to sediment heterogeneity and experimental artifacts (Hammond et al., 2004; Sommer et al., 2016).
Perhaps one of the most important results from the entire modeling exercise is that the sediments must exert a strong feedback on the nutrient cycles in the water column. For example, benthic N loss at the time-series site (1.5 mmol m−2 d−1; Table 3) is up to 20% of water column N loss by anammox reported for 140 m water depth at a site close to the time-series station (6.2 mmol m−2 d−1; Hamersley et al., 2007). Furthermore, produced by DNRA can easily cover the required by anammox in the water column (Dale et al., 2016). Sediments thus likely play an important direct and indirect role in the pelagic fixed N budget. These basic feedbacks need to be considered in regional models of the Peruvian system. Later on, we suggest ways in which this can be achieved.
Microbiological Control of Sulfur Emissions
Reports of benthic emissions of H2S on the Peruvian margin are rare (Schunck et al., 2013). Benthic chambers deployed so far on the shelf have only measured H2S release where the sediments receive massive amounts of phytodetritus (>60 mmol m−2 d−1 of C) and where bottom waters are depleted in electron acceptors (Sommer et al., 2016). At a station close to the time-series station managed by IMARPE and at a similar water depth (150 m), no H2S emissions were detected (Sommer et al., 2016). To simulate this in our model, an efficient sink of H2S in addition to DNRA was required because the rate constant of DNRA was pre-determined based on observed temporal decreases in the B pool (see section Model). An immediate increase in H2S concentrations inside benthic chambers following depletion of and to below 0.5 μM further alludes to second pathway of H2S removal coupled to the reduction of and/or (Dale et al., 2016). Such an immediate increase may not be expected of -storing microbial communities that can continue to respire H2S in the short-term absence of electron acceptors.
In the present model, this sink was assumed to be chemotrophic denitrification (CD) coupled to H2S oxidation by non-vacuolated bacteria [Equation (3) and (4)]. It would seem reasonable that chemoautotrophic denitrifying bacteria are present and able to compete with Thioploca for H2S in the organic-rich anoxic Peruvian muds displaying high rates of sulfate reduction (Fossing et al., 2004). These bacteria have been isolated in OMZs and the reaction is highly favorable energetically (Lam and Kuypers, 2011). Other H2S removal processes do not greatly help to close the mass balance. Aerobic H2S oxidation is negligible (Table 3), and burial of particulate sulfur (e.g., pyrite) was not considered since, as mentioned (Section Benthic N Cycle), it can only sequester around 15% of total H2S production. Although, this is roughly the same as the fraction of H2S consumed by CD, we infer from the immediate increase in H2S concentrations inside benthic chambers when / concentrations fall below 0.5 μM that the sink must be occurring directly at the sediment-water interface (Dale et al., 2016). It is questionable whether the precipitation of iron sulfides will be thermodynamically favorable at the sediment-water interface due to low reactant concentrations and the presence of potential oxidants for reduced sulfur such as O2 and (Rickard, 1997). Although, the role of sedimentary CD has not yet been quantified in the field, the model has identified an additional process in the benthic S cycle that may turn out to be just as important as DNRA in maintaining a H2S-free water column.
Nonetheless, as mentioned, benthic microorganisms are unable to consume H2S completely when rain rates are exceptional, as seen by the peaks in H2S emissions (Figure 5F). The peak in summer 2009 coincides with the largest sulfidic event ever measured in the water column on the Peruvian margin (Schunck et al., 2013). These authors further attributed the H2S plume to benthic H2S release, and estimated a benthic H2S source of around 2 mmol m−2 d−1 on the middle shelf at 100 m water depth. This is in agreement with the present model prediction (0.4 mmol m−2 d−1) when one considers that organic matter mineralization at 100 m is a factor of 3–4 higher than at 150 m (Dale et al., 2015). The model results suggest that large-scale H2S emission events may occur more regularly than currently presumed and may have gone undetected in 2004, 2005, and 2006 (Figure 5F). Furthermore, given that H2S release appears at times when primary production exceeds ca. 20 mmol m−2 d−1 (c.f. Figure 3A), satellite-derived data could be used as an early warning system to predict sulfidic events on the Peruvian margin. The feasibility of this idea is certainly worth further investigation, especially given the importance of the fishery sector to the Peruvian economy.
Benthic-Pelagic Coupling and N Loss on the Margin
Denitrification in continental margin sediments constitutes the largest sink of fixed N in the ocean today (Gruber, 2008). Although, sediments underlying oxygen deficient waters account for less than 1% of the total seafloor, globally they account for 10% of benthic N loss (Bohlen et al., 2012). On average, 1 mole of fixed N is transformed to N2 for every 4 moles of POC oxidized at the time-series station (Table 3), compared to a ratio of 1:10 in oxic shelf settings (Middelburg et al., 1996; Bohlen et al., 2012). As explained above, benthic denitrification must modulate the biogeochemistry of the water column on the Peruvian shelf. Given that N loss limits productivity, regional and global biogeochemical models that simulate oxygen deficient waters need to be able to predict benthic N loss accurately.
Several approaches of varying complexity exist to couple benthic and pelagic models (reviewed by Soetaert et al., 2000). At the one end, time-dependent, vertically-resolved diagenetic models, such as the one presented here, can be coupled to a water column biogeochemistry model (e.g., Archer et al., 2002). In practice, this approach is seldom used due to the excessive computational demands and parameterization required. At the other end, over-simplified approaches that include the specification of fixed or reflective sea floor boundary conditions in ocean models inadequately capture the diagenetic transformations of organic matter and benthic sources and sinks. Intermediate complexity approaches, such as vertically-integrated sediment models, are a pragmatic alternative. These allow sediment fluxes to be parameterized using zero-dimensional time-dependent approaches (i.e., a single box) at the lower ocean boundary, or by the implementation of transfer functions to predict the immediate response of sediments to changes occurring at the sediment-seawater boundary. These models can be derived from statistical analysis of vertically-resolved benthic models or be purely empirical in nature (Middelburg et al., 1996; Soetaert et al., 2000; Capet et al., 2016).
An example of an empirical transfer function for predicting fixed N loss in global models has been developed by Bohlen et al. (2012). Here, denitrification (all N2 production pathways in mmol m−2 d−1 of N) can be predicted from the POC rain rate (mmol m−2 d−1 of C) and the bottom water concentrations of O2 and in μM:
where a (0.060), b (0.19) and c (0.99) are constants determined from a global database of measured benthic O2 and fluxes and rain rates. The function has been coupled to Earth System Models to predict benthic denitrification in the modern ocean (e.g., Somes et al., 2013; Yang and Gruber, 2016). The function is also dynamic in the sense that N loss responds instantaneously to changes in the boundary conditions, but does not consider the storage of solutes and particulates in sediments.
For the application of Equation (7) to the Peruvian margin, RRPOC has to be adjusted to account for the elevated carbon burial efficiency (CBE) in sediments under anoxic waters. The more carbon buried, the less degradation and thus less N2 loss. Previously, the CBE was shown to be 50% for sediments within the OMZ (section POC Degradation and Dale et al., 2015). RRPOC was thus corrected by multiplying by the factor 1− CBE/100:
Fixed N loss predicted using Equation (8) is shown alongside the N loss from the numerical model in Figure 6 jointly with the resultant residuals. The two approaches show a very good agreement; only during periods when the POC rain rate rises above ca. 25 mmol m−2 d−1 does Equation (8) over-predict the N loss by more than two standard deviations (2σ) of the residuals, such as in 2004 and 2005. This is probably because extreme settings such as the Peruvian shelf that display high rates of DNRA at the expense of denitrification are not well represented in the database used to derive the transfer function. Nonetheless, over the whole time-series, the models agree to within 30%, which is within the empirical uncertainty of the transfer function (Bohlen et al., 2012). The model could be further generalized by making CBE a function of, for example, rain rate (Dunne et al., 2007).
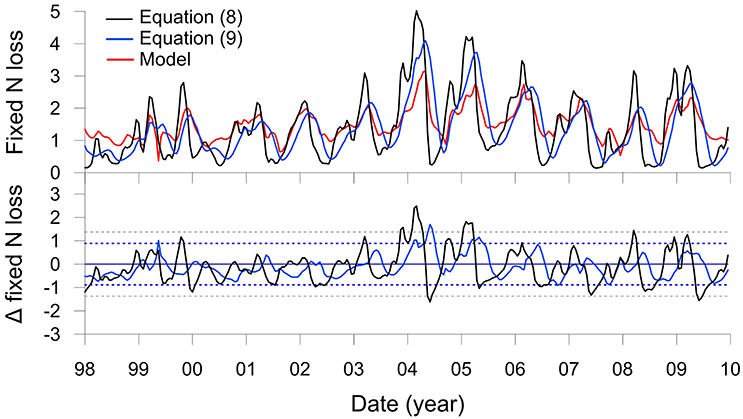
Figure 6. The upper panel shows total fixed N loss (mmol m−2 d−1 of N) on the Peruvian shelf from Figure 5N (red curve) and the results of the transfer function (Equation 8, black curve). The blue curve is the transfer function with the rain rate filtered by a 4 month moving average (Equation 9). The lower panel shows corresponding residuals from the two functions compared to the model with control limits, ±2σ (dotted lines).
It can nonetheless be seen that the yearly maxima in N loss predicted by Equation (8) precede the model result by 1 to 2 months (Figure 6). This is due to the time lag between POC deposition and organic matter mineralization. An improved transfer function can be formulated that considers these lags by filtering RRPOC using a low pass moving average:
where n denotes the number of months, i, over which the moving average was applied. Best results were found for n = 4 (Figure 6, blue curve), for which the mean and standard deviation of the N loss (1.3 ± 0.8 mmol m−2 d−1) are within excellent agreement of the model result (1.5 ± 0.5 mmol m−2 d−1). The 4 month filter captures much of the variability induced by the reactivity of the POC1 and POC2 fractions (Table 1) as well as the time required for molecules to diffuse over the upper 10 cm in response to the changes in rain rate.
On the one hand, these are important results since they show that these functions can be coupled to dynamic regional biogeochemical models of the Peru system such as the Regional Ocean Modeling System (e.g., Vergara et al., 2016). On the other hand, it is perhaps surprising that the N loss predicted by the vertically–resolved and—integrated models agree so well. Nitrogen loss in the numerical model depends on the temporally-variable vertical distribution of organic matter and dissolved species and hence their rates of advective and diffusive transport in the sediment column. The history of the previous boundary conditions is thus entrained in the numerical model. The transfer functions, in contrast, retain no memory of past conditions; only the instantaneous rain rate and bottom water concentrations are important. This is partly compensated for in Equation (9) by the low pass filter on the rain rate. Storage of POC seems not to greatly affect the predictive capability of the functions because the most labile carbon pool, with a lifetime of a few weeks, constitutes a large fraction of bulk POC (Table 1). Furthermore, almost all denitrification takes place within the upper 5 mm of the sediment (Figure 4C). The time scale for a molecule to diffuse across this distance is only a few hours, such that the relatively gradual changes of solute concentrations in the bottom water allow benthic denitrification to proceed in quasi-steady state. The accuracy of the transfer functions would begin to break down in situations where bottom water chemistry fluctuates on hourly time scales due to e.g., tides.
Challenges of Predicting DNRA
Almost all of the N loss from the water column in the Eastern Tropical South Pacific occurs by anammox rather than heterotrophic denitrification (Hamersley et al., 2007; Kalvelage et al., 2013). Mass balance calculations suggest that around 40% of the N loss takes place within the coastal OMZ where water depths are <600 m (Kalvelage et al., 2013). Moreover, it has been suggested that production by Thioploca could contribute as much as 50% of the total oxidized by anammox (Dale et al., 2016). This potentially important feedback linking the benthic and pelagic N cycle is thus focused on shallower waters. Its impact on the wider biogeochemistry of the Peruvian OMZ requires investigation using a regional model that accounts for N transformations in both the water column and sediments.
Analogous to Equation (9), a simple vertically-integrated model for benthic DNRA (mmol m−2 d−1 of N) can be proposed based on the model findings:
where rSC is the sulfate-to-carbon ratio during POC respiration by sulfate reduction (0.5) and f is the mean fraction of H2S produced by sulfate reduction that is oxidized by DNRA (81%, Table 3). The coefficient 0.83 accounts for the fraction of POC respired by sulfate reduction at the time-series station (Figure 5I).
Results with this function, again with n = 4, show a very good agreement with the modeled DNRA rates (Figure 7). Bottom water is not a variable in this function. DNRA is more sensitive to RRPOC than changes in bottom water because Thioploca, along with some species of Beggiatoaceae and Thiomargarita, are able to store within their vacuoles, and thus bridge periods where availability is low or absent (Schulz et al., 1996; Preisler et al., 2007). The equation would be straightforward to implement as a lower water column boundary condition in a regional model. Applying the function from the shelf down to 400 m, where Thioploca are distributed (Mosch et al., 2012; Sommer et al., 2016), would allow a first-order estimate of benthic conversion to by Thioploca for the entire Peruvian margin to be determined, as well as the impact of benthic DNRA on water column N loss. Ideally, such an approach would also have to consider that the sediments north of 10°S and south of 15°S are sandy due to sediment winnowing by strong bottom currents (Suess et al., 1987), and thus unlikely to support Thioploca communities.
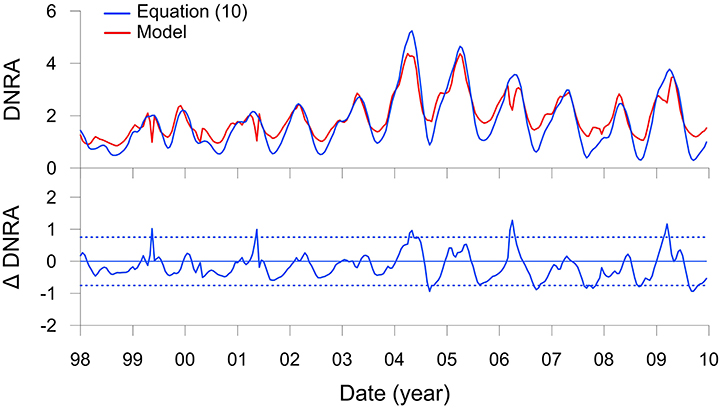
Figure 7. DNRA (mmol m−2 d−1 of N) on the Peruvian shelf from Figure 5M (red curve) and predicted by the transfer function (Equation 10, blue curve). The lower panel shows the residuals of the function compared to the model with control limits, ±2σ (dotted lines).
One drawback of this approach is that the ecology of Thioploca is treated in a very simplified manner. Time-series analysis of Thioploca biomass at a nearby station (94 m water depth) between 1993 and 2006 showed that the bacteria are mostly present when O2 levels are <20 μM but not anoxic (Gutiérrez et al., 2008). These conditions characterize the period of the current model application, with the exception of the strong El Niño in 1998 when bottom waters became well ventilated for several months due to onshore intrusion of Subtropical Surface Water (Figure 3E; Graco et al., 2016). Following this event, Thioploca biomass at the other site (Gutiérrez et al., 2008) was diminished for 2–3 years during which time the benthic biota became dominated by amphipods and polychaetes. Although, Thioploca biomass does not correlate statistically with O2 concentrations (Gutiérrez et al., 2008), the presence or absence of bacterial mats very likely depends on the occurrence of coastal trapped waves that depress the OMZ downwards and ventilate shelf sediments. The frequency of these waves increases during El Niño, and this sustained ventilation is believed to allow burrowing macrofaunal communities to be established at the expense of Thioploca (Gutiérrez et al., 2008). Furthermore, Thioploca populations can be diminished during La Niña events when bottom waters stagnate and is exhausted, or following the sinking of massive plankton blooms that smother the seafloor biota (Graco et al., 2001; Gutiérrez et al., 2008). These extreme low frequency (e.g., ENSO) and high frequency forcings (e.g., bottom water stagnation) lead to complex dynamics of Thioploca biomass and DNRA that are not dealt with in the current model.
Conclusions
Relatively little fieldwork effort has been directed to investigate the inter-annual and intra-annual fluxes of carbon, nutrients and other biologically important compounds across the marine sediment-water interface. In part, this is due to greater labor and cost investments demanded by sediment sampling compared to the water column. An alternative approach to quantify benthic-pelagic feedbacks is to couple water column time-series data to a diagenetic model that has been ground-truthed using data from the same locality. This was the approach taken in this study on the Peruvian margin. Water column data on the outer shelf were measured at the time-series station managed by the Instituto del Mar del Perú (IMARPE) and the benthic model was constrained using sediment geochemical data and benthic fluxes. The results allow the natural variability and time scales of benthic-pelagic feedbacks in carbon, nitrogen and sulfur cycling to be quantified. This type of analysis further permits the influence of the low frequency remote forcing, such as El Niño, on the sediment nutrient balance to be investigated.
An important finding from this work is that the sediments must provide a strong feedback on the biogeochemical cycles and productivity of the water column. Further, they are not static repositories that are independent of changes taking place in the water column. Benthic reaction rates and fluxes vary several-fold over the course of the year in concert with organic carbon rain rate. The level of variability observed is very likely typical for the continental margin, which emphasizes the importance of seasonality in sediment mineralization rates to system scale nutrients budgets. This work clearly demonstrates that water column biogeochemical models on the Peruvian margin require careful consideration of benthic feedbacks to correctly balance nutrient inventories. Biogeochemical models will inaccurately predict feedbacks from the sediment if the seafloor is treated as a simple reflective boundary or ignored altogether; a point made many years ago (Soetaert et al., 2000). It would be instructive to quantify the role of sediments to nutrient budgets on the Peruvian margin using a regional 3-D physical-biogeochemical model. Important outstanding questions include the strength of benthic denitrification as a negative feedback on primary production and the role of ammonium production by Thioploca to water column N loss by anammox (another possible negative feedback). Similarly, the link between the N and S cycles in the sediments and the water column mediated by benthic biota and ephemeral sulfide emissions deserves further attention.
Author Contributions
AD: Designed the study and carried out the model simulations; MG: Provided the time-series nutrient data; AD, MG, and KW: Contributed to the writing and editing of the manuscript.
Conflict of Interest Statement
The authors declare that the research was conducted in the absence of any commercial or financial relationships that could be construed as a potential conflict of interest.
Acknowledgments
This research was funded by the Sonderforschungsbereich 754 “Climate—Biogeochemistry Interactions in the Tropical Ocean” (www.sfb754.de) which is supported by the Deutsche Forschungsgemeinschaft. We would like to thank three reviewers for their very positive commentaries and Dr. Phyllis Lam for the editorial handling of this manuscript.
Supplementary Material
The Supplementary Material for this article can be found online at: https://www.frontiersin.org/article/10.3389/fmars.2017.00029/full#supplementary-material
References
Archer, D. E., Morford, J. L., and Emerson, S. R. (2002). A model of suboxic sedimentary diagenesis suitable for automatic tuning and gridded global domains. Glob. Biogeochem. Cycles 16, 17–1–17–21. doi: 10.1029/2000gb001288
Arthur, M. A., Dean, W. E., and Laarkamp, K. (1998). Organic carbon accumulation and preservation in surface sediments on the Peru margin. Chem. Geol. 152, 273–286.
Behrenfeld, M. J., and Falkowski, P. G. (1997). Photosynthetic rates derived from satellite-based chlorophyll concentration. Limnol. Oceanogr. 42, 1–20.
Billet, D. S. M., Lampitt, R. S., Rice, A. L., and Mantoura, R. F. C. (1983). Seasonal sedimentation of phytoplankton to the deep-sea benthos. Nature 302, 520–522. doi: 10.1038/302520a0
Bohlen, L., Dale, A. W., Sommer, S., Mosch, T., Hensen, C., Noffke, A., et al. (2011). Benthic nitrogen cycling traversing the Peruvian oxygen minimum zone. Geochim. Cosmochim. Acta 75, 6094–6111. doi: 10.1016/j.gca.2011.08.010
Bohlen, L., Dale, A. W., and Wallmann, K. (2012). Simple transfer functions for calculating benthic fixed nitrogen losses and C:N:P regeneration ratios in global biogeochemical models. Glob. Biogeochem. Cycles 26, GB3029. doi: 10.1029/2011gb004198
Böning, P., Brumsack, H. J., Böttcher, M. E., Schnetger, B., Kriete, C., Kallmeyer, J., et al. (2004). Geochemistry of Peruvian near-surface sediments. Geochim. Cosmochim. Acta 68, 4429–4451. doi: 10.1016/j.gca.2004.04.027
Boudreau, B. P., and Ruddick, B. R. (1991). On a reactive continuum representation of organic matter diagenesis. Am. J. Sci. 291, 507–538.
Capet, A., Meysman, F. J. R., Akoumianaki, I., Soetaert, K., and Grégorie, M. (2016). Integrating sediment biogeochemistry into 3D oceanic models: a study of benthic-pelagic coupling in the Black Sea. Ocean Model. 101, 83–100. doi: 10.1016/j.ocemod.2016.03.006
Chaigneau, A., Dominguez, N., Vasquez, L., Flores, R., Grados, C., and Echevin, V. (2013). Near-coastal circulation in the Northern Humboldt current system from shipboard ADCP data. J. Geophys. Res. Oceans 118, 1–16. doi: 10.1002/jgrc.20328
Chavez, F. P., Bertrand, A., Guevara-Carrasco, R., and Soler, P. (2008). The northern Humboldt Current System: Brief history, present status and a view towards the future. Prog. Oceanogr. 79, 95–105. doi: 10.1016/j.pocean.2008.10.012
Chong, L. S., Prokopenko, M. G., Berelson, W. M., Townsend-Small, A., and McManus, J. (2012). Nitrogen cycling within suboxic and anoxic sediments from the continental margin of Western North America. Mar. Chem. 128–129, 13–25. doi: 10.1016/j.marchem.2011.10.007
Dale, A. W., Bertics, V. J., Treude, T., Sommer, S., and Wallmann, K. (2013). Modeling benthic-pelagic nutrient exchange processes and porewater distributions in a seasonally-hypoxic sediment: evidence for massive phosphate release by Beggiatoa? Biogeosciences 10, 629–651. doi: 10.5194/bg-10-629-2013
Dale, A. W., Sommer, S., Lomnitz, U., Bourbonnais, A., and Wallmann, K. (2016). Biological nitrate transport in sediments on the Peruvian margin mitigates benthic sulfide emissions and drives pelagic N loss during stagnation events. Deep-Sea Res. Part I. 112, 123–136. doi: 10.1016/j.dsr.2016.02.013
Dale, A. W., Sommer, S., Lomnitz, U., Montes, I., Treude, T., Liebetrau, V., et al. (2015). Organic carbon production, mineralisation and preservation on the Peruvian margin. Biogeosciences 12, 1537–1559. doi: 10.5194/bg-12-1537-2015
Dunne, J. P., Armstrong, R. A., Gnnadesikan, A., and Sarmiento, J. L. (2005). Empirical and mechanistic models for the particle export ratio. Glob. Biogeochem. Cycles 19, GB4026. doi: 10.1029/2004gb002390
Dunne, J. P., Sarmiento, J. L., and Gnanadesikan, A. (2007). A synthesis of global particle export from the surface ocean and cycling through the ocean interior and on the seafloor. Glob. Biogeochem. Cycles 21, 1–16. doi: 10.1029/2006GB002907
Echevin, V., Albert, A., Lévy, M., Graco, M., Aumont, O., Piétri, A., et al. (2014). Intraseasonal variability of nearshore productivity in the Northern Humboldt current system: the role of coastal trapped waves. Cont. Shelf Res. 73, 14–30. doi: 10.1016/j.csr.2013.11.015
Echevin, V., Aumont, O., Ledesma, J., and Flores, G. (2008). The seasonal cycle of surface chlorophyll in the Peruvian upwelling system: a modelling study. Prog. Oceanogr. 79, 167–176. doi: 10.1016/j.pocean.2008.10.026
Farías, L., Graco, M., and Ulloa, O. (2004). Temporal variability of nitrogen cycling in continental-shelf sediments of the upwelling ecosystem off central Chile. Deep-Sea Res. Part II 51, 2491–2505. doi: 10.1016/j.dsr2.2004.07.029
Fossing, H. (1990). Sulfate reduction in shelf sediments in the upwelling region off Central Peru. Cont. Shelf Res. 10, 355–367. doi: 10.1016/0278-4343(90)90056-R
Fossing, H., Berg, P., Thamdrup, B., Rysgaard, S., Sørensen, H. M., and Nielsen, K. (2004). A Model Set-Up for an Oxygen and Nutrient flux Model for Aarhus Bay (Denmark). National Environmental Research Institute, Denmark. NERI Technical Report No. 483, 65.
Fossing, H., Gallardo, V. A., Jørgensen, B. B., Hüttel, M., Nielsen, L. P., Schulz, H., et al. (1995). Concentration and transport of nitrate by mat-forming sulphur bacterium Thioploca. Nature 374, 713–715. doi: 10.1038/374713a0
Gallardo, V. A. (1977). Large benthic microbial communities in sulphide biota under Peru-Chile subsurface countercurrent. Nature 268, 331–332. doi: 10.1038/268331a0
Glud, R. N., Thamdrup, B., Stahl, H., Wenzhoefer, F., Glud, A., Nomaki, H., et al. (2009). Nitrogen cycling in a deep ocean margin sediment (Sagami Bay, Japan). Limnol. Oceanogr. 54, 723–734. doi: 10.4319/lo.2009.54.3.0723
Graco, M., Farías, L., Molina, V., Gutiérrez, D., and Nielsen, L. P. (2001). Massive developments of microbial mats following phytoplankton blooms in a naturally eutrophic bay: implications for nitrogen cycling. Limnol. Oceanogr. 46, 821–832. doi: 10.4319/lo.2001.46.4.0821
Graco, M., Purca, S., Dewitte, B., Morón, O., Ledesma, J., Flores, G., et al. (2016). The OMZ and nutrients features as a signature of interannual and low frequency variability off the Peruvian upwelling system. Biogeosci. Discuss. 1–36. doi: 10.5194/bg-2015-567
Gruber, N. (2008). “The Marine nitrogen cycle: overview and challenges,” in Nitrogen in the Marine Environment, eds D. G. Capone, D. A. Bronk, M. Mulholland, and E. J. Carpenter (Amsterdam: Academic Press), 1–50.
Gutiérrez, D., Enríquez, E., Purca, S., Quipúzcoa, L., Marquina, R., Flores, G., et al. (2008). Oxygenation episodes on the continental shelf of central Peru: remote forcing and benthic ecosystem response. Prog. Oceanogr. 79, 177–189. doi: 10.1016/j.pocean.2008.10.025
Hamersley, M. R., Lavik, G., Woebken, D., Rattray, J. E., Lam, P., Hopmans, E. C., et al. (2007). Anaerobic ammonium oxidation in the Peruvian oxygen minimum zone. Limnol. Oceanogr. 52, 923–933. doi: 10.4319/lo.2007.52.3.0923
Hammond, D. E., Cummins, K. M., McManus, J., Berelson, W. M., and Smith, G. (2004). Methods for measuring benthic nutrient flux on the California Margin: comparing shipboard core incubations to in situ lander results. Limnol. Oceanogr. Methods 2, 146–159. doi: 10.4319/lom.2004.2.146
Henrichs, S. M., and Farrington, J. W. (1984). Peru upwelling region sediments near 15os. 1. Remineralization and accumulation of organic matter. Limnol. Oceanogr. 29, 1–19.
Hooker, S. B., and McClain, C. R. (2000). The calibration and validation of SeaWiFS data. Prog. Oceanogr. 45, 427–465. doi: 10.1016/S0079-6611(00)00012-4
Huettel, M., Forster, S., Kloser, S., and Fossing, H. (1996). Vertical migration in the sediment-dwelling sulfur bacteria Thioploca spp. in overcoming diffusion limitations. Appl. Environ. Microbiol. 62, 1863–1872.
Jørgensen, B. B. (1978). A comparison of methods for the quantification of bacterial sulfate reduction in coastal marine sediments II. Calculation from mathematical models. Geomicrobiol. J. 1, 29–47.
Jørgensen, B. B., and Gallardo, V. A. (1999). Thioploca spp.: filamentous sulfur bacteria with nitrate vacuoles. FEMS Microbiol. Ecol. 28, 301–313.
Kalvelage, T., Lavik, G., Lam, P., Contreras, S., Arteaga, L., Löscher, C. R., et al. (2013). Nitrogen cycling driven by organic matter export in the South Pacific oxygen minimum zone. Nat. Geosci. 6, 228–234. doi: 10.1038/ngeo1739
Klump, J. V., and Martens, C. S. (1989). The seasonality of nutrient regeneration in an organic-rich coastal sediment: kinetic modeling of changing pore-water nutrient and sulfate distribution. Limnol. Oceanogr. 34, 559–577. doi: 10.4319/lo.1989.34.3.0559
Kriest, I., and Oschlies, A. (2013). Swept under the carpet: organic matter burial decreases global ocean biogeochemical model sensitivity to remineralization length scale. Biogeosciences 10, 8401–8422. doi: 10.5194/bg-10-8401-2013
Lam, P., and Kuypers, M. M. M. (2011). Microbial nitrogen cycling processes in oxygen minimum zones. Ann. Rev. Mar. Sci. 3, 317–345. doi: 10.1146/annurev-marine-120709-142814
Lampitt, R. (1985). Evidence for the seasonal deposition of detritus to the deep-sea floor and its subsequent resuspension. Deep-Sea Res. 32, 885–897. doi: 10.1016/0198-0149(85)90034-2
Levin, L., Gutiérrez, D., Rathburn, A., Neira, C., Sellanes, J., Munoz, P., et al. (2002). Benthic processes on the Peru margin: A transect across the oxygen minimum zone during the 1997-98 El Ni-o. Prog. Oceanogr. 53, 1–27. doi: 10.1016/s0079-6611(02)00022-8
Lomnitz, U., Sommer, S., Dale, A. W., Löscher, C. R., Noffke, A., Wallmann, K., et al. (2016). Benthic phosphorus cycling in the Peruvian oxygen minimum zone. Biogeosciences 13, 1367–1386. doi: 10.5194/bg-13-1367-2016
Martin, J. H., Knauer, G. A., Karl, D. M., and Broenkow, W. W. (1987). VERTEX: carbon cycling in the northeast Pacific. Deep-Sea Res. 34, 267–285. doi: 10.1016/0198-0149(87)90086-0
Martin, W. R., and Bender, M. L. (1988). The variability of benthic fluxes and sedimentary remineralization rates in response to seasonally variable organic carbon rain rates in the deep sea: a modeling study. Am. J. Sci. 288, 561–574. doi: 10.2475/ajs.288.6.561
Middelburg, J. J. (1989). A simple rate model for organic matter decomposition in marine sediments. Geochim. Cosmochim. Acta 53, 1577–1581.
Middelburg, J. J., Soetaert, K., Herman, P. M. J., and Heip, C. H. R. R. (1996). Denitrification in marine sediments: a model study. Global Biogeochem. Cycles 10, 661–673.
Morel, A., and Berthon, J.-F. (1989). Surface pigments, algal biomass profiles, and potential production of the euphotic layer?: relationships reinvestigated view of remote-sensing applications. Limnol. Oceanogr. 34, 1545–1562. doi: 10.4319/lo.1989.34.8.1545
Mosch, T., Sommer, S., Dengler, M., Noffke, A., Bohlen, L., Pfannkuche, O., et al. (2012). Factors influencing the distribution of epibenthic megafauna across the Peruvian oxygen minimum zone. Deep-Sea Res. Part I. 68, 123–135. doi: 10.1016/j.dsr.2012.04.014
Otte, S., Kuenen, J. G., Nielsen, L. P., Paerl, H. W., Zopfi, J., Schulz, H. N., et al. (1999). Nitrogen, carbon, and sulfur metabolism in natural Thioploca samples. Appl. Environ. Microbiol. 65, 3148–3157.
Pennington, J. T., Mahoney, K. L., Kuwahara, V. S., Kolber, D. D., Calienes, R., and Chavez, F. P. (2006). Primary production in the eastern tropical Pacific: a review. Prog. Oceanogr. 69, 285–317. doi: 10.1016/j.pocean.2006.03.012
Preisler, A., de Beer, D., Lichtschlag, A., Lavik, G., Boetius, A., and Jørgensen, B. B. (2007). Biological and chemical sulfide oxidation in a Beggiatoa inhabited marine sediment. ISME J. 1, 341–353. doi: 10.1038/ismej.2007.50
Quiñones, R. A., Gutierrez, M. H., Daneri, G., Aguilar, D. G., Gonzalez, H. E., and Chavez, F. P. (2010). “The Humboldt current system,” in Carbon and Nutrient Fluxes in Continental Margins: A Global Synthesis, eds K. K. Liu, L. Atkinson, R. Qui-ones, and L. Talaue-McManus (Berlin: Springer-Verlag), 44–64.
Rickard, D. (1997). Kinetics of pyrite formation by the H2S oxidation of iron (II) monosulfide in aqueous solutions between 25 and 125°C: the rate equation. Geochim. Cosmochim. Acta 61, 115–134. doi: 10.1016/s0016-7037(96)00322-5
Scholz, F., Hensen, C., Noffke, A., Rohde, A., Liebetrau, V., and Wallmann, K. (2011). Early diagenesis of redox-sensitive trace metals in the Peru upwelling area – response to ENSO-related oxygen fluctuations in the water column. Geochim. Cosmochim. Acta 75, 7257–7276. doi: 10.1016/j.gca.2011.08.007
Schulz, H. N., Jørgensen, B. B., Fossing, H. A., and Ramsing, N. B. (1996). Community structure of filamentous, sheath-building sulfur bacteria, Thioploca spp., off the Coast of Chile. Appl. Environ. Microbiol. 62, 1855–1862.
Schunck, H., Lavik, G., Desai, D. K., Großkopf, T., Kalvelage, T., Löscher, C., et al. (2013). Giant hydrogen sulfide plume in the oxygen minimum zone off Peru supports chemolithoautotrophy. PLoS ONE 8:e68661. doi: 10.1371/journal.pone.0068661
Soetaert, K., Herman, P. M. J., and Middelburgl, J. J. (1996). Dynamic response of deep-sea sediments to seasonal variations: a model. Limnol. Oceanogr. 41, 1651–1668.
Soetaert, K., Middelburg, J. J., Herman, P. M. J., and Buis, K. (2000). On the coupling of benthic and pelagic biogeochemical models. Earth-Sci. Rev. 51, 173–201. doi: 10.1016/S0012-8252(00)00004-0
Somes, C. J., Oschlies, A., and Schmittner, A. (2013). Isotopic constraints on the pre-industrial oceanic nitrogen budget. Biogeosciences 10, 5889–5910. doi: 10.5194/bg-10-5889-2013
Sommer, S., Gier, J., Treude, T., Lomnitz, U., Dengler, M., Cardich, J., et al. (2016). Depletion of oxygen, nitrate and nitrite in the Peruvian oxygen minimum zone cause an imbalance of benthic nitrogen fluxes. Deep-Sea Res. Part I. 112, 113–122. doi: 10.1016/j.dsr.2016.03.001
Suess, E., Kulm, L. D., and Killingly, J. S. (1987). “Coastal upwelling and a history of organic-rich mudstone deposition off Peru,” in Marine Petroleum Source Rocks. Geological Society Special Publication No. 26, eds J. Brooks and A. J. Fleet (London: Blackwell Scientific), 181–197.
Suits, N. S., and Arthur, M. A. (2000). Bacterial production of anomalously high dissolved sulfate concentrations in Peru slope sediments: steady-state sulfur oxidation, or transient response to end of El Nino? Deep-Sea Res. Part I. 47, 1829–1853. doi: 10.1016/s0967-0637(99)00120-x
Thamdrup, B., Dalsgaard, T., and Revsbech, N. P. (2012). Widespread functional anoxia in the oxygen minimum zone of the Eastern South Pacific. Deep-Sea Res. Part I. 65, 36–45. doi: 10.1016/j.dsr.2012.03.001
Ulloa, O., Canfield, D. E., Delong, E. F., Letelier, R. M., and Stewart, F. J. (2012). Microbial oceanography of anoxic oxygen minimum zones. Proc. Natl. Acad. Sci. U.S.A. 109, 15996–16003. doi: 10.1073/pnas.1205009109
Vergara, O., Dewitte, B., Montes, I., Garçon, V., Ramos, M., Paulmier, A., et al. (2016). Seasonal variability of the oxygen minimum zone off Peru in a high-resolution regional coupled model. Biogeosciences 13, 4389–4410. doi: 10.5194/bg-13-4389-2016
Walsh, J. J. (1991). Importance of continental margins in the marine biogeochemical cycling of carbon and nitrogen. Nature 350, 53–55. doi: 10.1038/350053a0
Westrich, J. T., and Berner, R. A. (1984). The role of sedimentary organic matter in bacterial sulfate reduction: the G model tested. Limnol. Oceanogr. 29, 236–249.
Yang, S., and Gruber, N. (2016). The anthropogenic perturbation of the marine nitrogen cycle by atmospheric deposition?: nitrogen cycle feedbacks and the 15N Haber-Bosch effect. Glob. Biogeochem. Cycles 30, 1418–1440. doi: 10.1002/2016GB005421
Zopfi, J., Kjaer, T., Nielsen, L. P., and Jørgensen, B. B. (2001). Ecology of Thioploca spp.: nitrate and sulfur storage in relation to chemical microgradients and influence of Thioploca spp. on the sedimentary nitrogen cycle. Appl. Environ. Microbiol. 67, 5530–5337. doi: 10.1128/aem.67.12.5530-5537.2001
Keywords: Peru, model, oxygen minimum zone, denitrification, DNRA, Thioploca, time-series, sediment
Citation: Dale AW, Graco M and Wallmann K (2017) Strong and Dynamic Benthic-Pelagic Coupling and Feedbacks in a Coastal Upwelling System (Peruvian Shelf). Front. Mar. Sci. 4:29. doi: 10.3389/fmars.2017.00029
Received: 27 October 2016; Accepted: 24 January 2017;
Published: 09 February 2017.
Edited by:
Phyllis Lam, University of Southampton, UKReviewed by:
Perran Cook, Monash University, AustraliaArthur Capet, National Research Council, Italy
Matthias Egger, Aarhus University, Denmark
Copyright © 2017 Dale, Graco and Wallmann. This is an open-access article distributed under the terms of the Creative Commons Attribution License (CC BY). The use, distribution or reproduction in other forums is permitted, provided the original author(s) or licensor are credited and that the original publication in this journal is cited, in accordance with accepted academic practice. No use, distribution or reproduction is permitted which does not comply with these terms.
*Correspondence: Andrew W. Dale, adale@geomar.de