 Anne Inderbitzin
 Tom Loosli1,2,3†
 Lennart Opitz
- 1Department of Infectious Diseases and Hospital Epidemiology, University Hospital Zurich, Zurich, Switzerland
- 2Institute of Medical Virology, University of Zurich, Zurich, Switzerland
- 3Life Science Zurich Graduate School, University of Zurich, Zurich, Switzerland
- 4Functional Genomics Center Zurich, Eidgenössische Technische Hochschule (ETH) Zürich/University of Zurich, Zurich, Switzerland
The main obstacle to cure HIV-1 is the latent reservoir. Antiretroviral therapy effectively controls viral replication, however, it does not eradicate the latent reservoir. Latent CD4+ T cells are extremely rare in HIV-1 infected patients, making primary CD4+ T cell models of HIV-1 latency key to understanding latency and thus finding a cure. In recent years several primary CD4+ T cell models of HIV-1 latency were developed to study the underlying mechanism of establishing, maintaining and reversing HIV-1 latency. In the search of biomarkers, primary CD4+ T cell models of HIV-1 latency were used for bulk and single-cell transcriptomics. A wealth of information was generated from transcriptome analyses of different primary CD4+ T cell models of HIV-1 latency using latently- and reactivated HIV-1 infected primary CD4+ T cells. Here, we performed a pooled data-analysis comparing the transcriptome profiles of latently- and reactivated HIV-1 infected cells of 5 in vitro primary CD4+ T cell models of HIV-1 latency and 2 ex vivo studies of reactivated HIV-1 infected primary CD4+ T cells from HIV-1 infected individuals. Identifying genes that are differentially expressed between latently- and reactivated HIV-1 infected primary CD4+ T cells could be a more successful strategy to better understand and characterize HIV-1 latency and reactivation. We observed that natural ligands and coreceptors were predominantly downregulated in latently HIV-1 infected primary CD4+ T cells, whereas genes associated with apoptosis, cell cycle and HLA class II were upregulated in reactivated HIV-1 infected primary CD4+ T cells. In addition, we observed 5 differentially expressed genes that co-occurred in latently- and reactivated HIV-1 infected primary CD4+ T cells, one of which, MSRB2, was found to be differentially expressed between latently- and reactivated HIV-1 infected cells. Investigation of primary CD4+ T cell models of HIV-1 latency that mimic the in vivo state remains essential for the study of HIV-1 latency and thus providing the opportunity to compare the transcriptome profile of latently- and reactivated HIV-1 infected cells to gain insights into differentially expressed genes, which might contribute to HIV-1 latency.
Introduction
The human immunodeficiency virus type 1 (HIV-1) remains a global health problem, while ART efficiently blocks viral replication it does not cure HIV-1 infection owing to persistent proviruses (1). These proviruses are quiescent and mainly found in resting memory CD4+ T cells, known as the latent reservoir (2, 3). The latent reservoir is defined as replication-competent but transcriptionally silent viruses. The latent reservoir is established within the first weeks of infection (4, 5) but the exact mechanisms of its establishment is still being investigated. Potential mechanisms leading HIV-1 into latency include transcriptional interference, chromatin remodelling, epigenetic silencing, and transcription factor sequestration (6). Nevertheless, to date the driving forces for HIV-1 latency are not fully understood. It is still unknown which factors distinguish between latently- and reactivated HIV-1 infected CD4+ T cells on a molecular level. Numerous studies searched for cellular markers identifying latently HIV-1 infected cells and several cellular markers were described, however, these cellular markers could only rarely be confirmed and are controversially discussed (7).
Therefore, primary CD4+ T cell models of HIV-1 latency that mimic the in vivo state remain a necessity for the study of HIV-1 latency. A wealth of information has been generated from the transcriptome profiles of primary CD4+ T cell models of HIV-1 latency. To obtain a comprehensive understanding of drivers that might maintain HIV-1 in latency, we performed a pooled data-analysis comparing the transcriptome profiles of latently- and reactivated HIV-1 infected cells from 5 in vitro primary CD4+ T cell models of HIV-1 latency and 2 ex vivo studies of reactivated HIV-1 infected primary CD4+ T cells from HIV-1 infected individuals (detailed description of the models/studies in Supplementary Figure 1 and Supplementary Material). By conducting a pooled data-analysis, high-throughput data from multiple independent primary CD4+ T cell models of HIV-1 latency are included, resulting in 1. larger sample size, 2. overcoming donor variability bias and 3. allowing for a comprehensive assessment of transcriptome profiles, thus providing more insights into HIV-1 pathogenesis and latency. In our pooled data-analysis, we identified 247 differentially expressed genes (DEGs) that were present in at least 3 of 4-5 datasets of latently- and reactivated HIV-1-infected primary CD4+ T cells, respectively. These DEGs were called pooled data-analysis differentially expressed genes (pdaDEGs). This may be a successful strategy to better understand and characterize HIV-1 latency and reactivation. This could provide insights into the mechanisms leading to HIV-1 latency and reactivation.
Results
Quantitative assessment of gene expression from data sets of in vitro primary CD4+ T cell models of HIV-1 latency and ex vivo studies of reactivated HIV-1 infected primary CD4+ T cells from HIV-1 infected individuals
To gain a comprehensive understanding of differentially expressed genes (DEGs) between latently- and reactivated HIV-1 infected cells, we analysed DEGs in 5 in vitro primary CD4+ T cell models of HIV-1 latency and 2 ex vivo studies of reactivated HIV-1 infected primary CD4+ T cells from HIV-1 infected individuals, in particular latently- (8–11) and reactivated (10–13) HIV-1 infected cells. Applying our search parameters resulted in 47 full text publications. We excluded studies using ChIP assays, non-primary CD4+ T cells data, cell line studies, and studies which did not contain transcriptome data and resulted in 4 in vitro primary CD4+ T cell models of HIV-1 latency (8–11) (Figure 1). By including 2 ex vivo studies of reactivated HIV-1 infected primary CD4+ T cells from suppressed HIV-1 infected individuals and our own model (14), a total of 50 unique transcriptome samples (26 HIV-1 infected cells and 24 uninfected cells) were included in our pooled data-analysis. We obtained 1’297-21’886 HGNC annotated genes per dataset (Table 1). We determined the mean standardised expression of all genes in all primary CD4+ T cell models of HIV-1 latency by averaging the fold changes standardized by the study-specific standard error. To account for the differences in the datasets, we refrained from identifying the DEGs by |fold change| >2 and false discovery rate (FDR) <0.05, but employed a custom filtering score method based on: 1. FDR <0.1 increasing the score by 1, 2. absolute fold change greater than the study-specific 50% absolute fold change quantile, increasing the score by 1, and 3. up- or downregulation, resulting in either a positive or negative score, respectively. A gene can get a score of maximally 2 per dataset, i.e., maximum score of 8 for latently and 10 for reactivated HIV-1 infected cells (Table 1). For each gene the scores are summed up across datasets and normalized to 1. Pooled data-analysis DEGs (pdaDEGs) were then identified by applying a filtering score ≥0.5. This resulted in 130 pdaDEGs for latently- and 117 pdaDEGs for reactivated HIV-1 infected primary CD4+ T cells (Table 1). The 130 pdaDEGs obtained from the latently HIV-1 infected cells were present in at least 3 out of the 4 primary CD4+ T cell models of HIV-1 latency. Whereas in the reactivated HIV-1 infected cells 117 pdaDEGs were present in at least 3 out of 5 datasets. In general, pdaDEGs were more frequently downregulated in latently HIV-1 infected primary CD4+ T cells and more frequently upregulated in reactivated HIV-1 infected primary CD4+ T cells (Table 1).
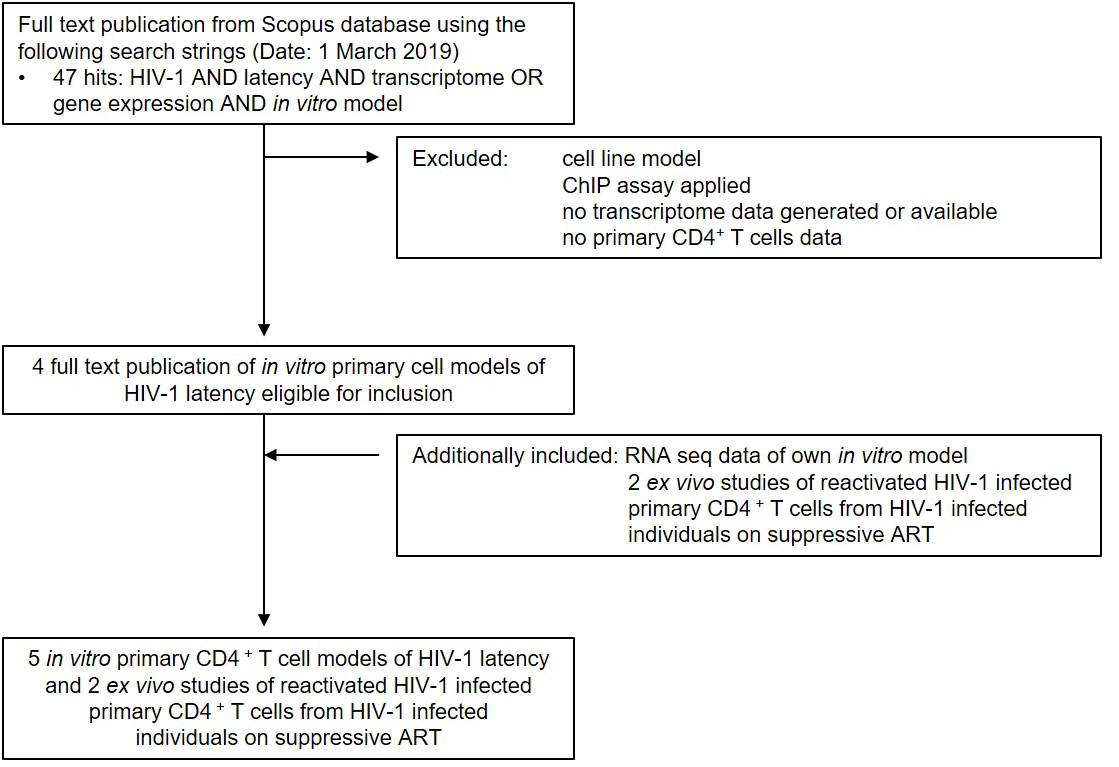
Figure 1 Summary of study search and selection procedure from the Scopus database.
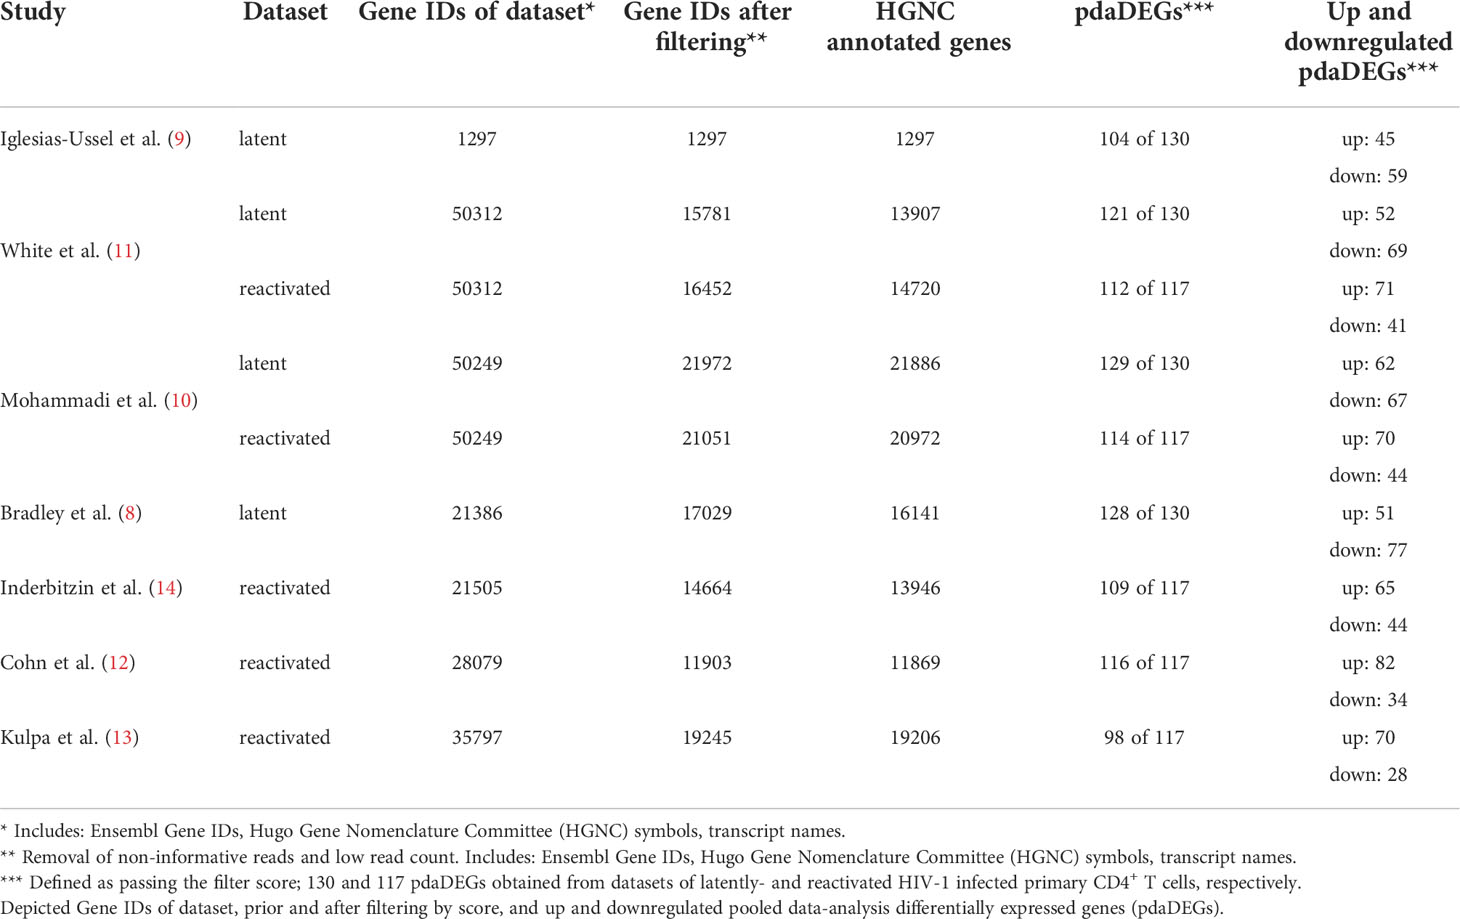
Table 1 Cross-reference of 5 in vitro primary CD4+ T cell models of HIV-1 latency and 2 ex vivo studies of reactivated HIV-1 infected primary CD4+ T cells from HIV-1 infected individuals, of latently- and reactivated HIV-1 infected cells.
pdaDEGs identified in latently HIV-1 infected cells from 4 in vitro primary CD4+ T cell models of HIV-1 latency
A comprehensive understanding of how latently HIV-1 infected primary CD4+ T cells are altered to allow HIV-1 persistence would be an important step towards developing cures for HIV-1-infected individuals. Therefore, it is important to determine whether the observed transcriptional heterogeneity in latently HIV-1 infected primary CD4+ T cells, which suggests that latent HIV-1 infection can persist in very different host cell environments, indeed masks common core motifs that would be responsible for controlling HIV-1 latency (12, 15, 16). To address this goal, we analysed and compared the 130 identified pdaDEGs in latently HIV-1 infected cells of 4 in vitro primary CD4+ T cell models of HIV-1 latency (8–11) (Table 1 and Supplementary Figure 1A). Of those 130 pdaDEGs, 75 were down- and 55 upregulated. 48 pdaDEGs showed associations with HIV-1 based on the Database for Annotation, Visualization and Integrated Discovery (DAVID), of which 29/48 were downregulated (Figure 2). 9 pdaDEGs with known HIV-1 associations were observed across all 4 in vitro primary CD4+ T cell models of HIV-1 latency. Out of which, 5 were downregulated (CCL4, CCL5, CXCR6, LYZ and RRBP1) and 4 upregulated (PLAU, LMNA, LY96 and CD69) (Supplementary Table 1). Downregulated pdaDEGs were predominantly natural ligands or coreceptor: CCL4 (chemokine (C-C motif) ligands 4), CCL5 (RANTES, regulated on activation, normal T cell expressed and secreted), and CXCR6 (C-X-C chemokine receptor type 6). CCL4 is known to activate and enhance the cytotoxicity in natural killer cells (17). CCL5 has been shown to interfere with the spread of HIV-1 by 1. binding to the CCR5 receptor and thereby blocking the binding of the HIV-1 envelope or 2. inducing the internalisation of the bound receptor and thereby reducing the surface amounts of CCR5 (18–21). CXCR6 was found to be downregulated across primary cell models of HIV-1 latency; it is known as a minor coreceptor of HIV-1 and might play a role in disease progression through its role as mediator of inflammation (22). The main HIV-1 co-receptor CCR5 was also found to be downregulated in 3/4 in vitro primary cell models of HIV-1 latency, which is in line with the study from Shan et al., showing that CCR5 is downregulated in resting CD4+ T cells (23). In summary, we found that natural ligands and coreceptors were predominantly downregulated in all investigated models for latently HIV-1 infected primary CD4+ T cells.
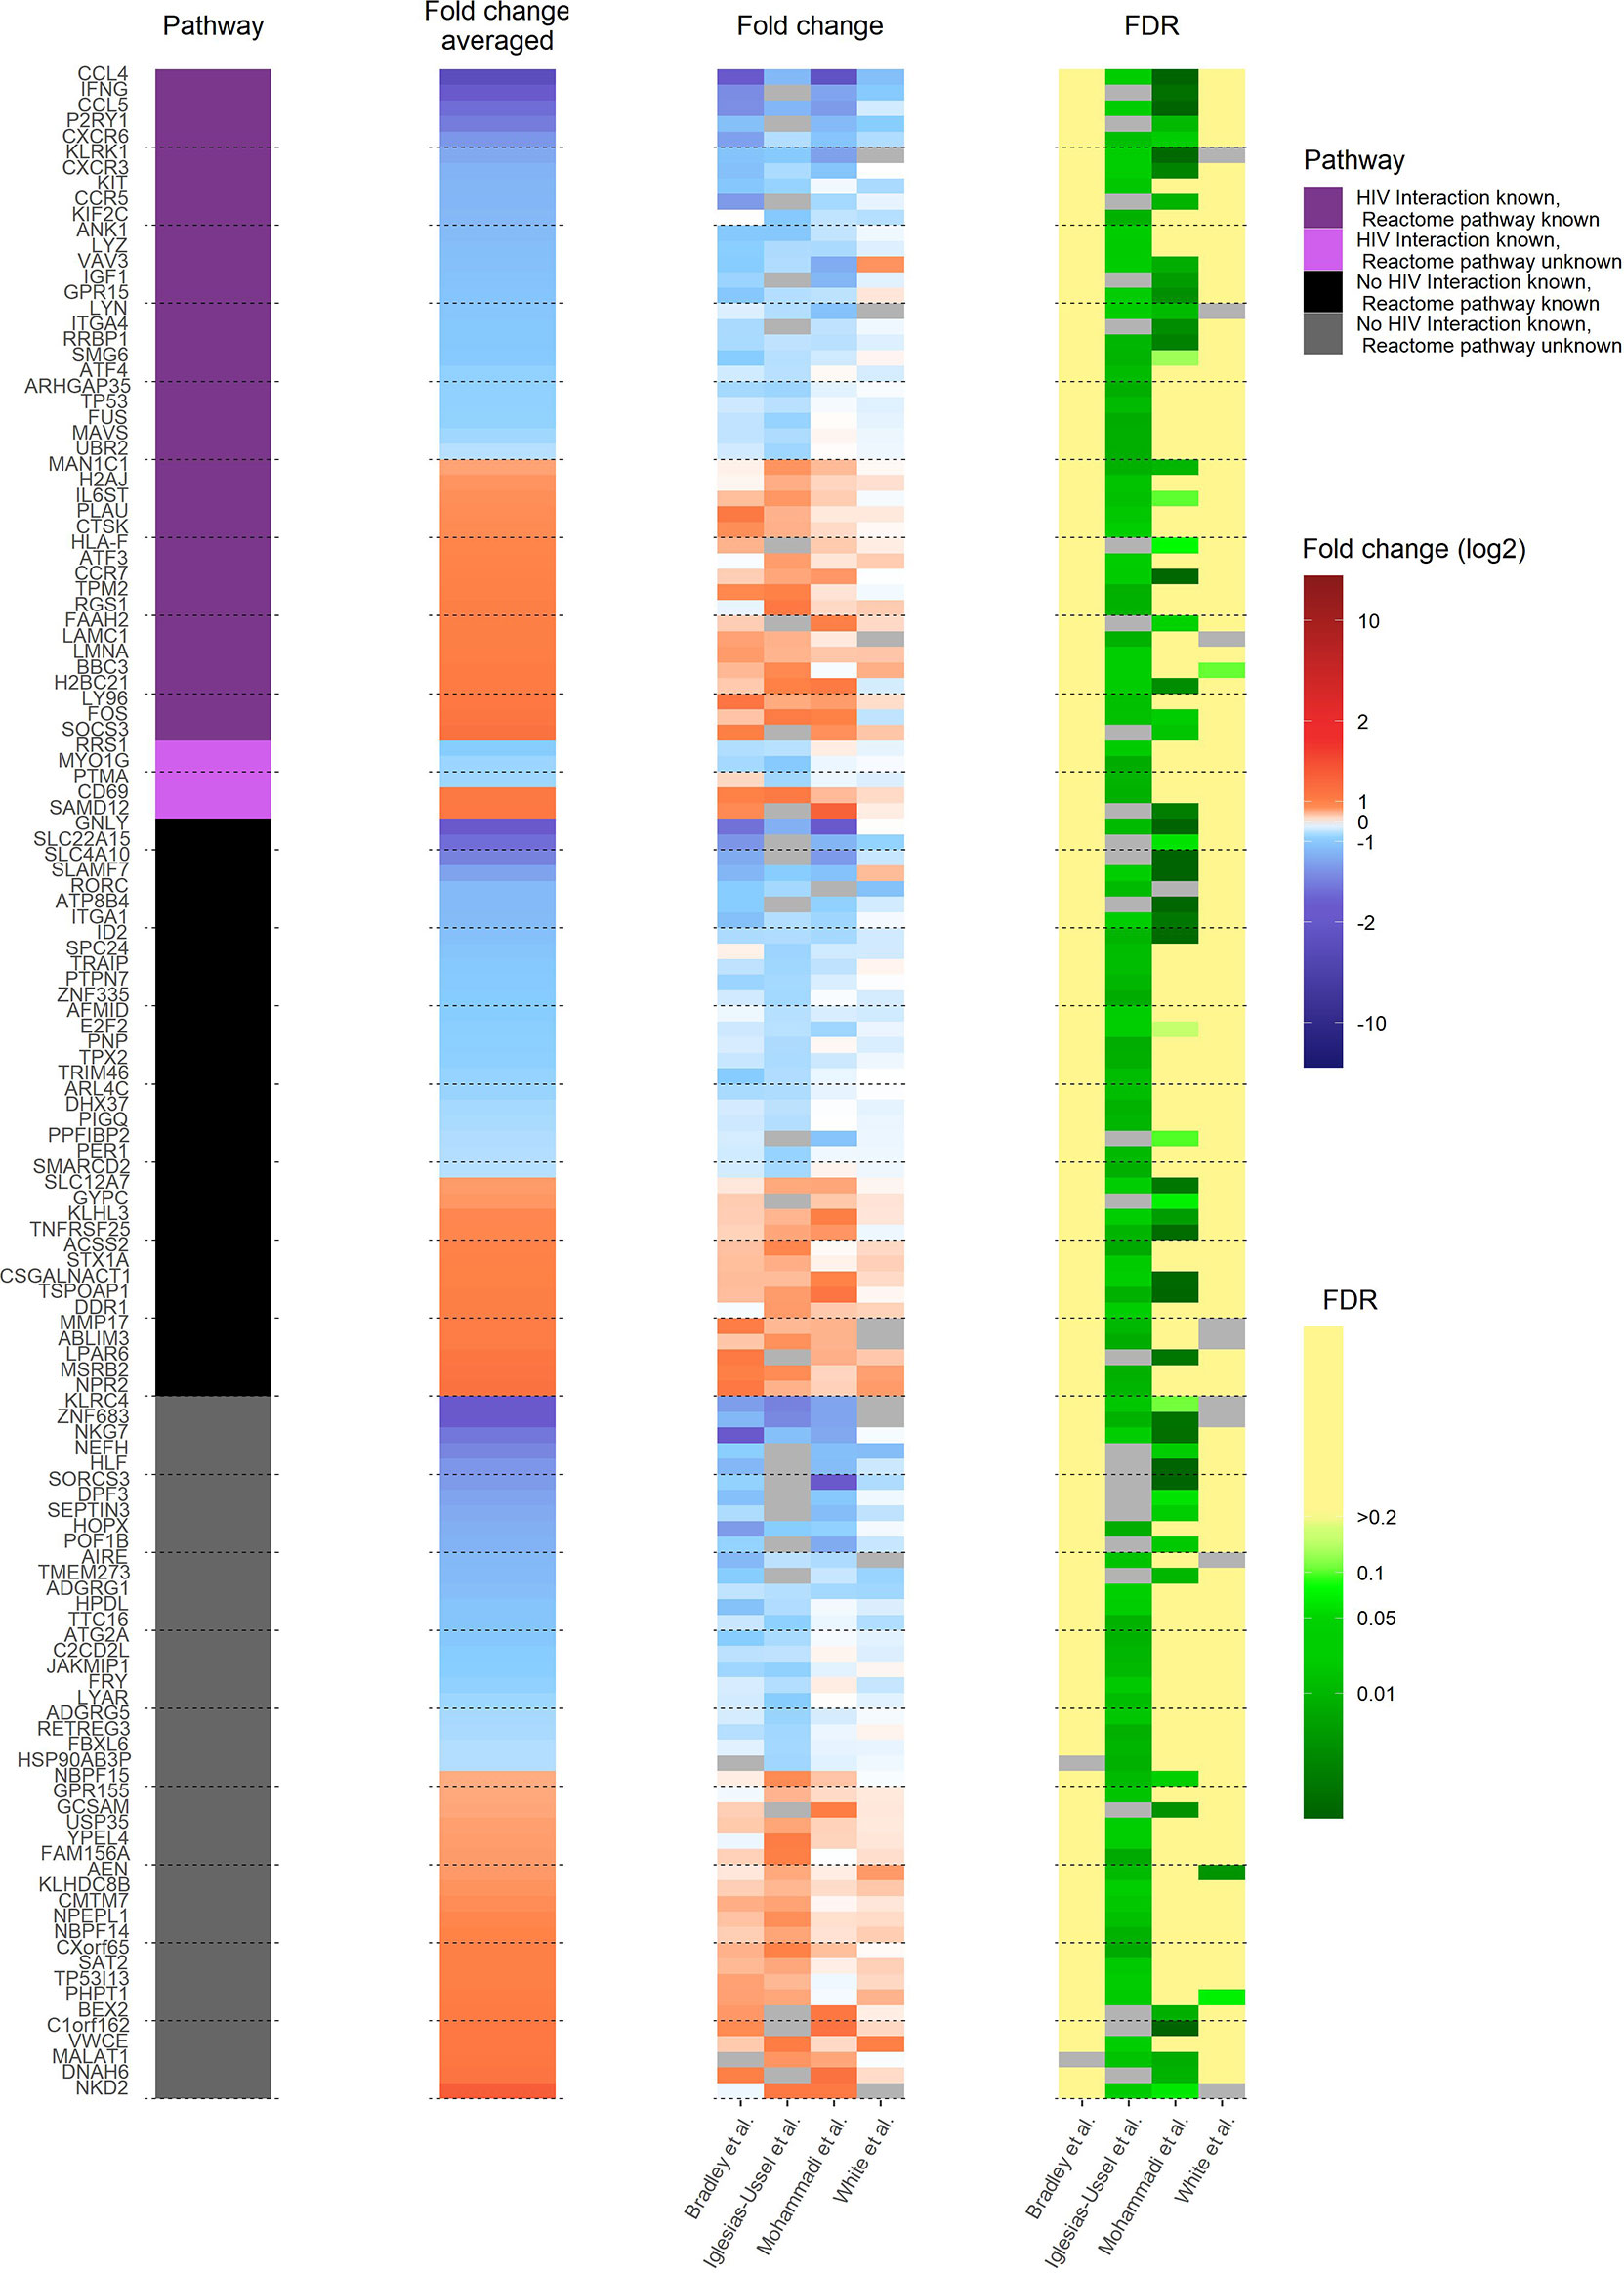
Figure 2 Heat map of transcriptome profile of latently HIV-1 infected cells of 4 in vitro primary CD4+ T cell models of HIV-1 latency. The 130 pdaDEGs depicted in the heat map are co-occurring in the latently HIV-1 infected cells of the at least 3 of 4 primary CD4+ T models of HIV-1 latency. For each gene the available information on pathways, mean standardized fold change, and study-specific fold change and false discovery rates (FDR) are illustrated. The pathway describes whether an HIV-1 interaction/association and/or the reactome pathway is known or not. Fold change and FDR in grey indicates no gene expression reported in the according dataset [Bradley et al. (8) Iglesias-Ussel et al. (9), Mohammadi et al. (10) and White et al. (11)].
pdaDEGs identified in reactivated HIV-1 infected cells from 3 in vitro primary CD4+ T cell models of HIV-1 latency and 2 ex vivo studies of reactivated HIV-1 infected primary CD4+ T cells from HIV-1 infected individuals
In in vivo and in vitro settings, a large number of latently HIV-1 infected primary CD4+ T cells remain unresponsive to strong latency reversal agents (24–35). To investigate transcriptional heterogeneity in HIV-1 latency reversal and to find common core motifs responsible for controlling HIV-1 latency reactivation, we analysed and compared pdaDEGs in reactivated HIV-1 infected cells of 3 in vitro (10, 11, 14) primary CD4+ T cell models of HIV-1 latency and 2 ex vivo studies of reactivated HIV-1 infected primary CD4+ T cells from HIV-1 infected individuals (Supplementary Figure 1) (12, 13).
In the reactivated HIV-1 infected primary CD4+ T cells, 117 pdaDEGs were identified, of which 35 pdaDEGs were down-, and 82 upregulated. 24 pdaDEGs have known HIV-1 associations based on DAVID, of which 16/24 were upregulated (Figure 3). 6 of those upregulated pdaDEGs with known HIV-1 associations were observed in all 5 datasets, namely ACTA2, LAMP3, HLA-DOA, CXCL10, SLC7A11 and SPTBN5 (Supplementary Table 2).
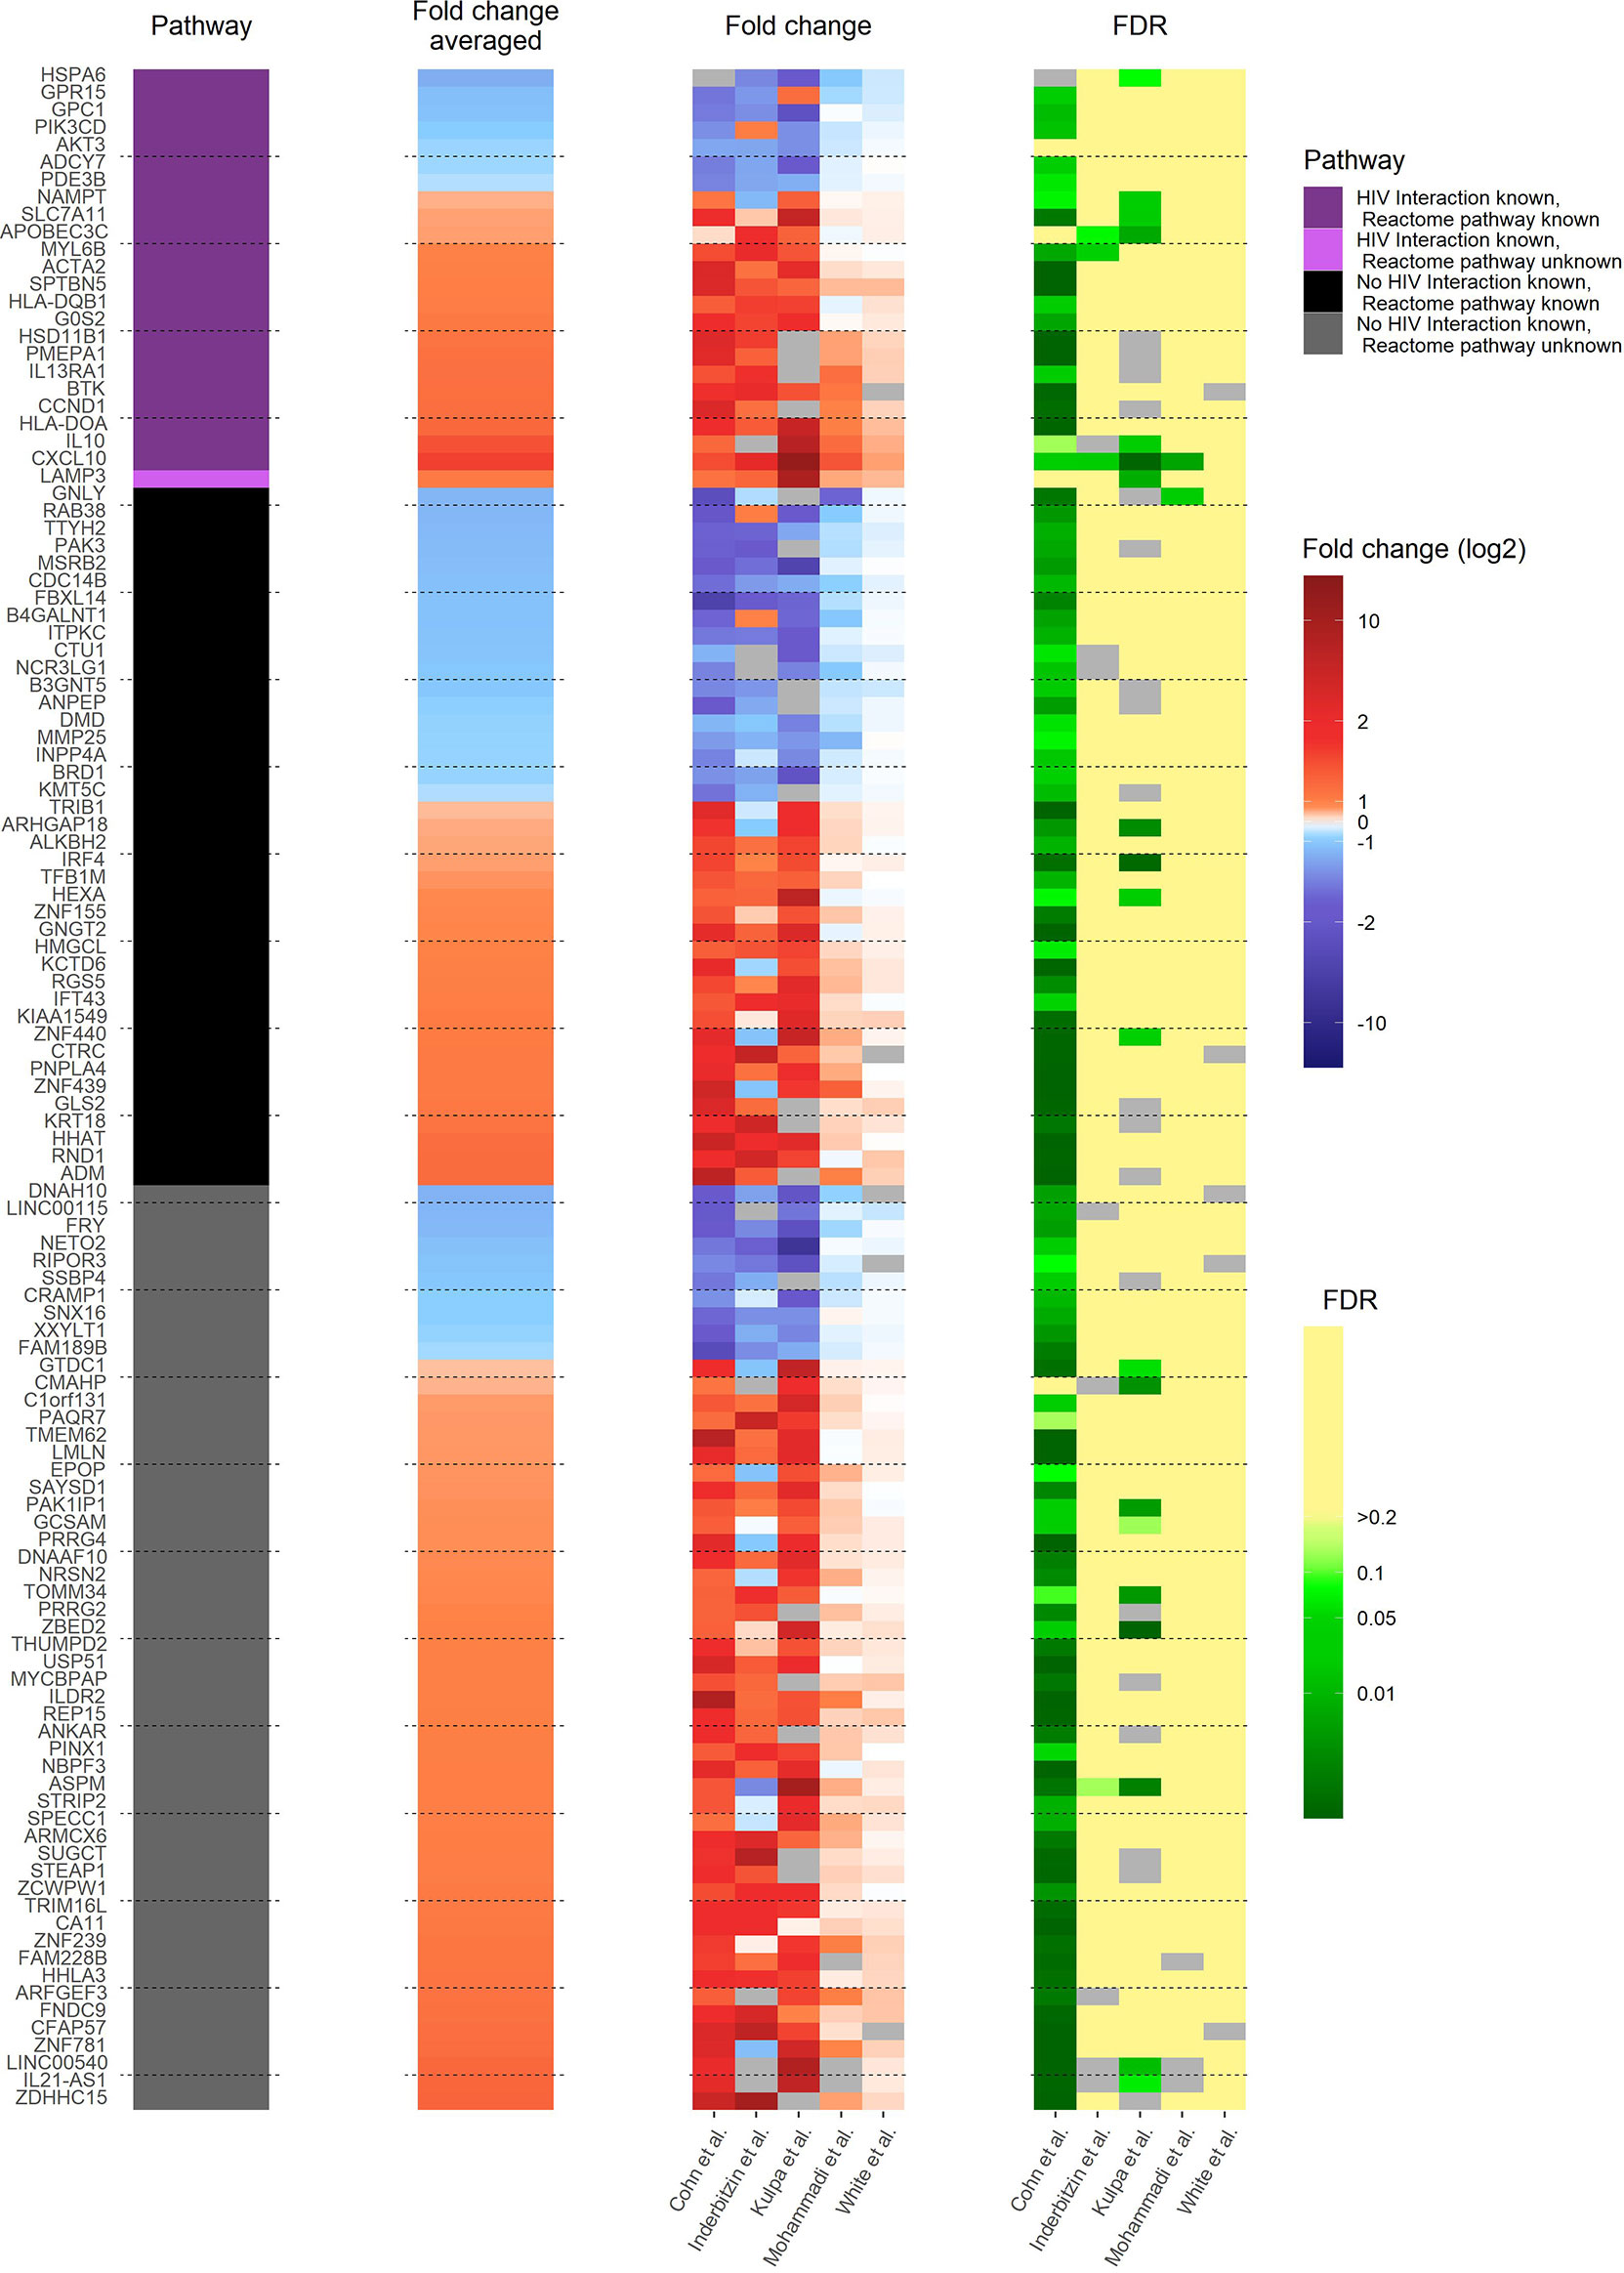
Figure 3 Heat map of gene expression profile of reactivated HIV-1 infected cells of 3 in vitro primary CD4+ T cell models of HIV-1 latency and 2 ex vivo studies of reactivated HIV-1 infected primary CD4+ T cells from HIV-1 infected individuals. The 117 pdaDEGs depicted in the heat map co-occurring in the reactivated HIV-1 infected cells of at least 3 out of 5 primary CD4+ T cell models of HIV-1 latency. For each gene the available information on pathways, mean standardized fold change, and study-specific fold change and false discovery rates (FDR) are illustrated. The pathway describes whether an HIV-1 interaction/association and/or the reactome pathway is known or not. Fold change and FDR in grey indicates no gene expression reported in the according dataset [Cohn et al. (12), Inderbitzin et al. (14), Kulpa et al. (13), Mohammadi et al. (10) and White et al. (11)].
The upregulated pdaDEGs were predominantly genes associated with 1. the p53 pathway, such as ACTA2 (actin alpha 2) which is known to be induced by p53 (11), 2. the PI3K/Akt pathway, such as LAMP3 (lysosome-associated membrane glycoprotein 3) which is involved in cell cycle and apoptosis (36) or 3. the human leukocyte antigen (HLA) class II such as HLA-DOA and HLA-DQB1, which was found in 4/5 in vitro and ex vivo HIV-1 studies, the latter is associated with increased risk of susceptibility to HIV-1 infection and for a rapid HIV-1 disease progression (37). CXCL10 (C-X-C motif chemokine ligand 10) is a pro-inflammatory cytokine involved in processes such as differentiation, regulation of cell growth, activation of peripheral immune cells and apoptosis (38). In addition, CXCL10 was suggested as a biomarker in the clinic for long-term HIV disease prognosis (39). SLC7A11 (solute carrier family 7 member 11), also named xCT, is a cytoplasmic membrane antiporter that exports one glutamate molecule for each imported cystine molecule (40–43). SLC7A11 has shown to inhibit HIV-1 infection (44).
In summary, we found genes associated with apoptosis, cell cycle and HLA class II were predominantly upregulated in all investigated models for reactivated HIV-1 infected primary CD4+ T cells.
Comparison of transcriptome profiles of latently- and reactivated HIV-1 infected CD4+ T cells
Next, we analysed the overlaps of the 130 and 117 pdaDEGs in latently- and reactivated HIV-1 infected primary CD4+ T cells, respectively. 5 pdaDEGs were observed in latently- and reactivated HIV-1 infected primary CD4+ T cells: FRY, GCSAM, GNLY, GPR15 and MSRB2 (Figure 4). Of those pdaDEGs, FRY, GNLY and GPR15 were downregulated and GCSM was upregulated in both groups. Only methionine sulfoxide reductase B2 (MSRB2) was regulated differentially between the latently- and reactivated HIV-1 infected CD4+ T cells, namely, upregulated in latently HIV-1 infected primary CD4+ T cells and downregulated in reactivated HIV-1 infected primary CD4+ T cells. Based on DAVID there is only an HIV-1 interaction known for GPR15, namely an interaction with HIV-1 Env gp120. GPR15 has been found to be the co-receptor of SIV and HIV-2 (45). According to the reactome, FRY and GCSAM could not be assigned to any pathway (Figures 2, 3). All those genes might be interesting in further studies, in particular MSRB2.
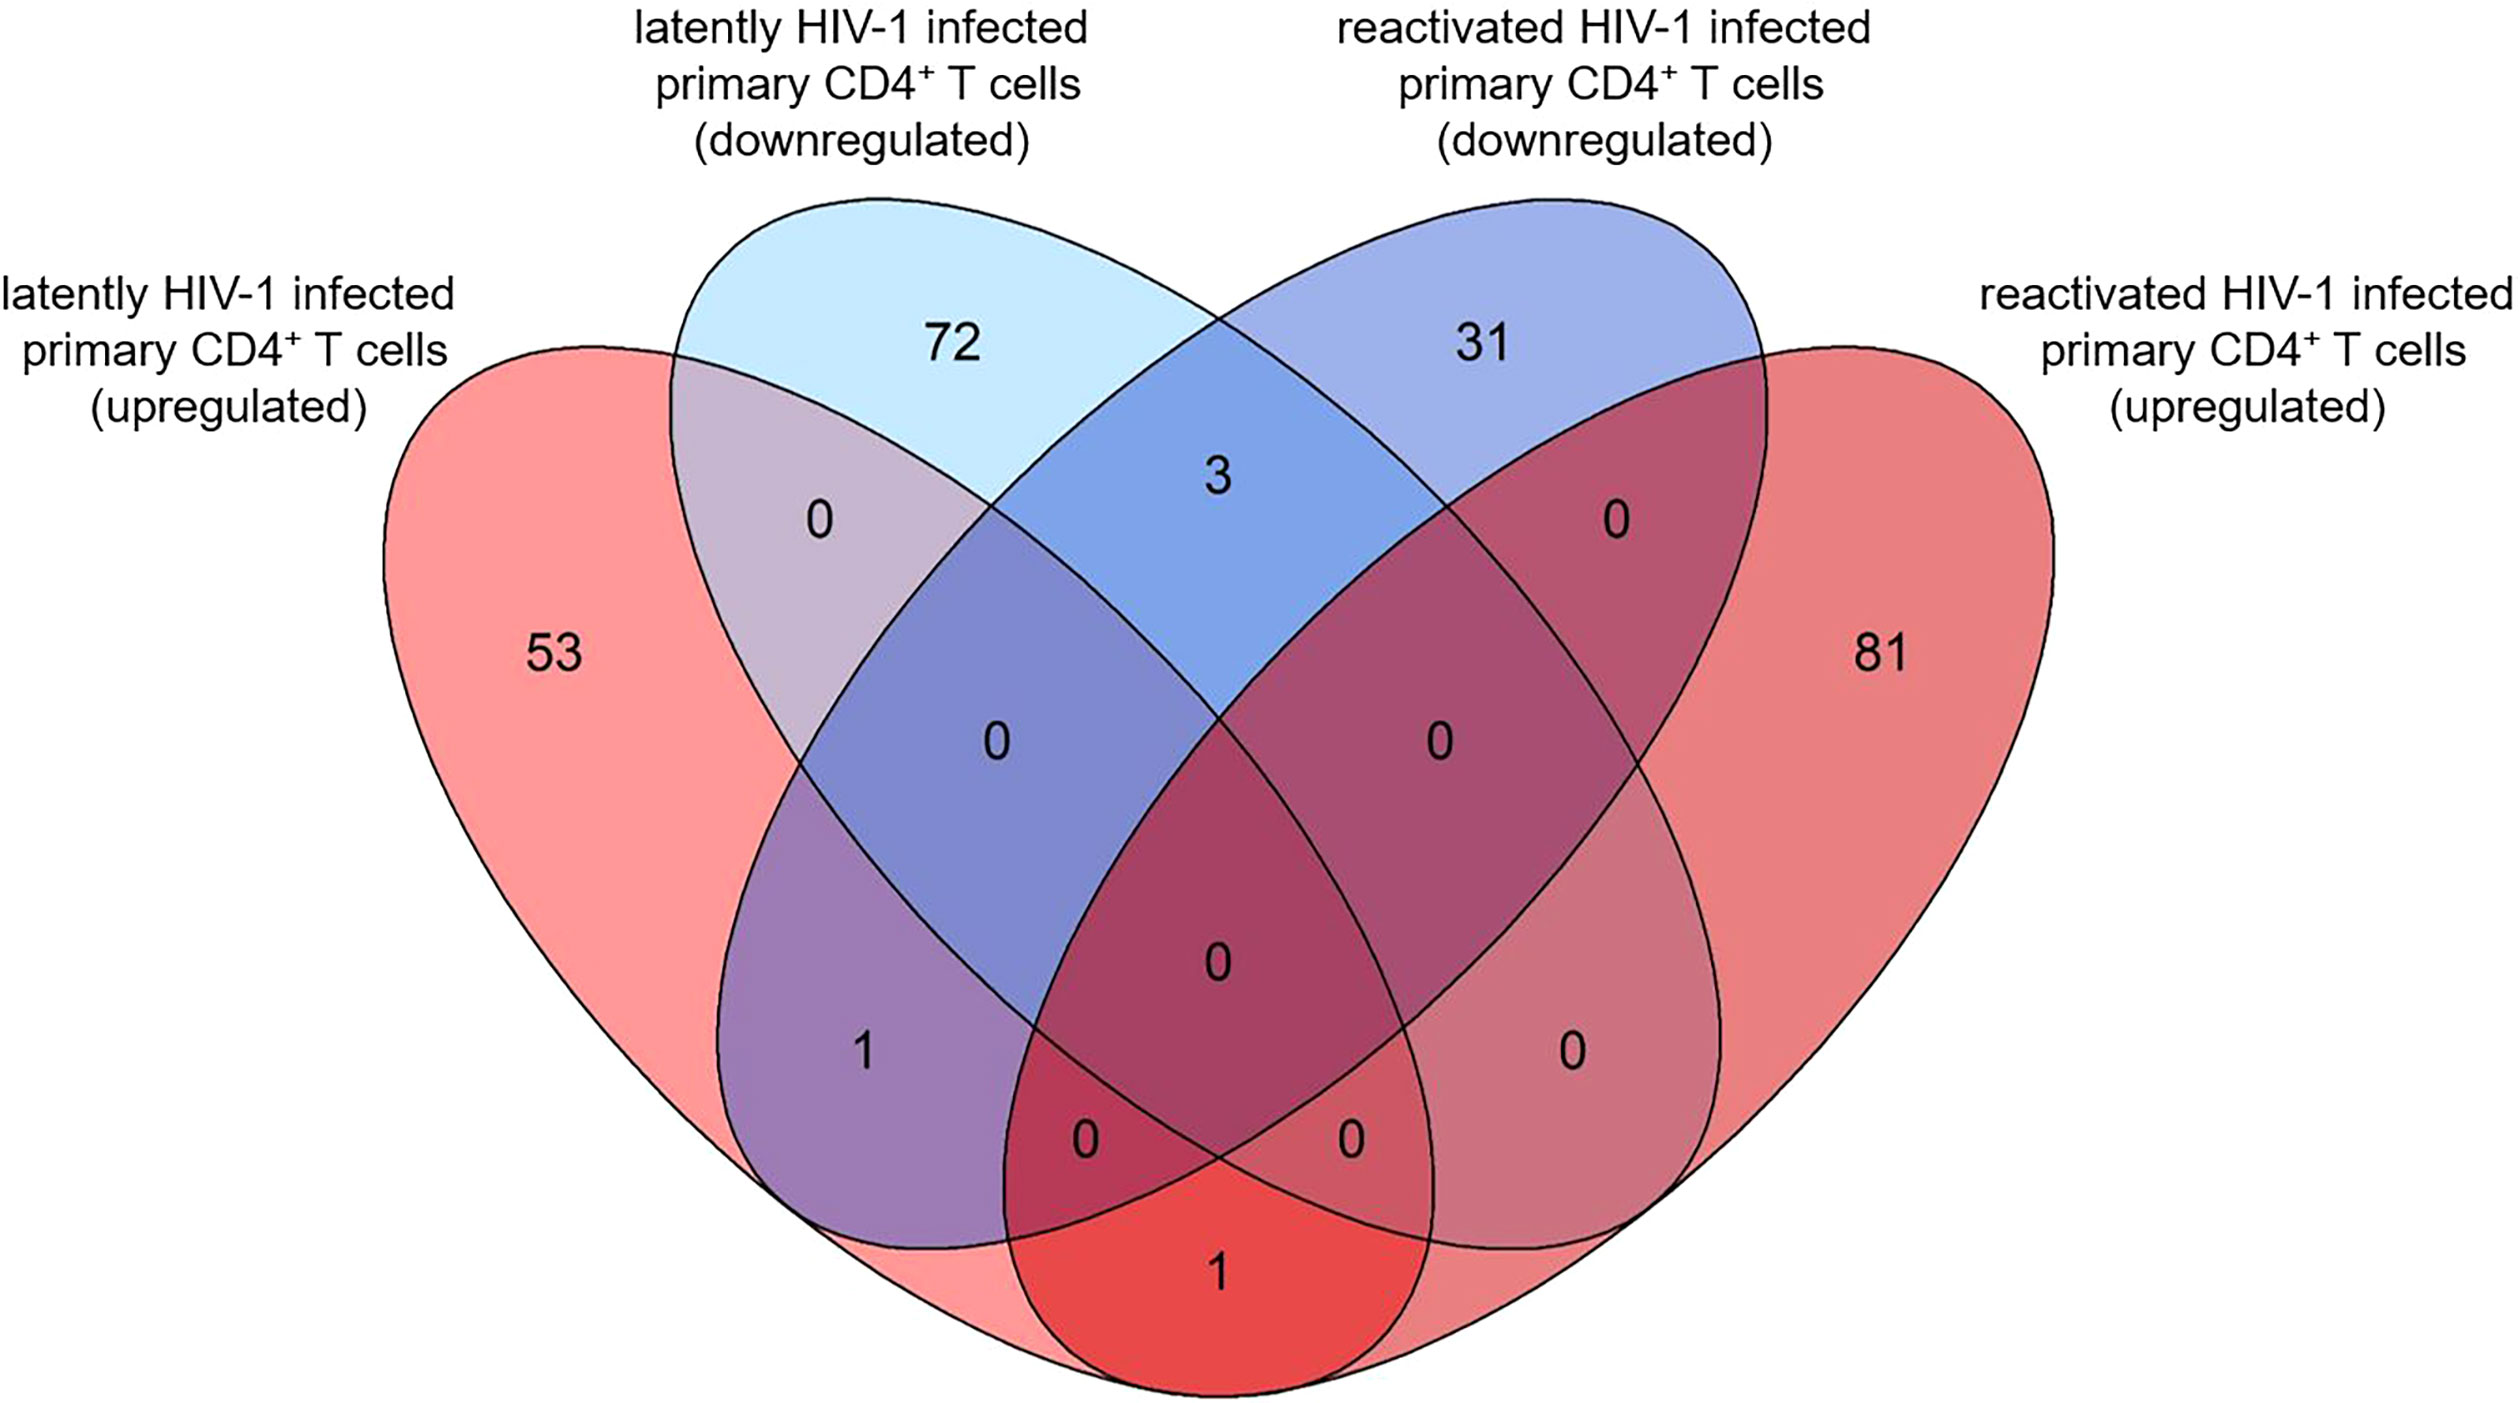
Figure 4 Overlap of pdaDEGs identified in latently- and reactivated HIV-1 infected cells from 5 in vitro primary CD4+ T cell models of HIV-1 latency and 2 ex vivo studies of reactivated HIV-1 infected primary CD4+ T cells from HIV-1 infected individuals. Of the 130 and 117 pdaDEGs identified in latently- and reactivated HIV-1 infected cells, respectively, 5 co-occurred in both groups. Of those, 3 pdaDEGs were downregulated, one pdaDEGs upregulated and one pdaDEGs was differentially expressed in latently- and reactivated HIV-1 infected primary CD4+ T cells.
Enriched biological processes of pdaDEGs
Gene ontology (GO) enrichment analysis was performed for functional investigation of pdaDEGs. In the GO enrichment analysis we observed predominantly downregulation of the T cell activation and STAT, JAK pathways in latently HIV-1 infected cells of the 4 in vitro primary CD4+ T cell models of HIV-1 latency (Figure 5). In addition, bona fide markers for IFN related genes were identified to be downregulated in 3/4 in vitro primary CD4+ T cell models of HIV-1 latency, such as MAVS, IFNG, TRIM46. In parallel, genes associated with the p53 signalling pathways were found to be upregulated in particular pathways related to apoptosis and DNA damage repair (11), such as BBC3 and TNFRSF25. For the reactivated HIV-1 infected primary CD4+ T cells, we could not observe any enriched biological processes in the pdaDEGs.
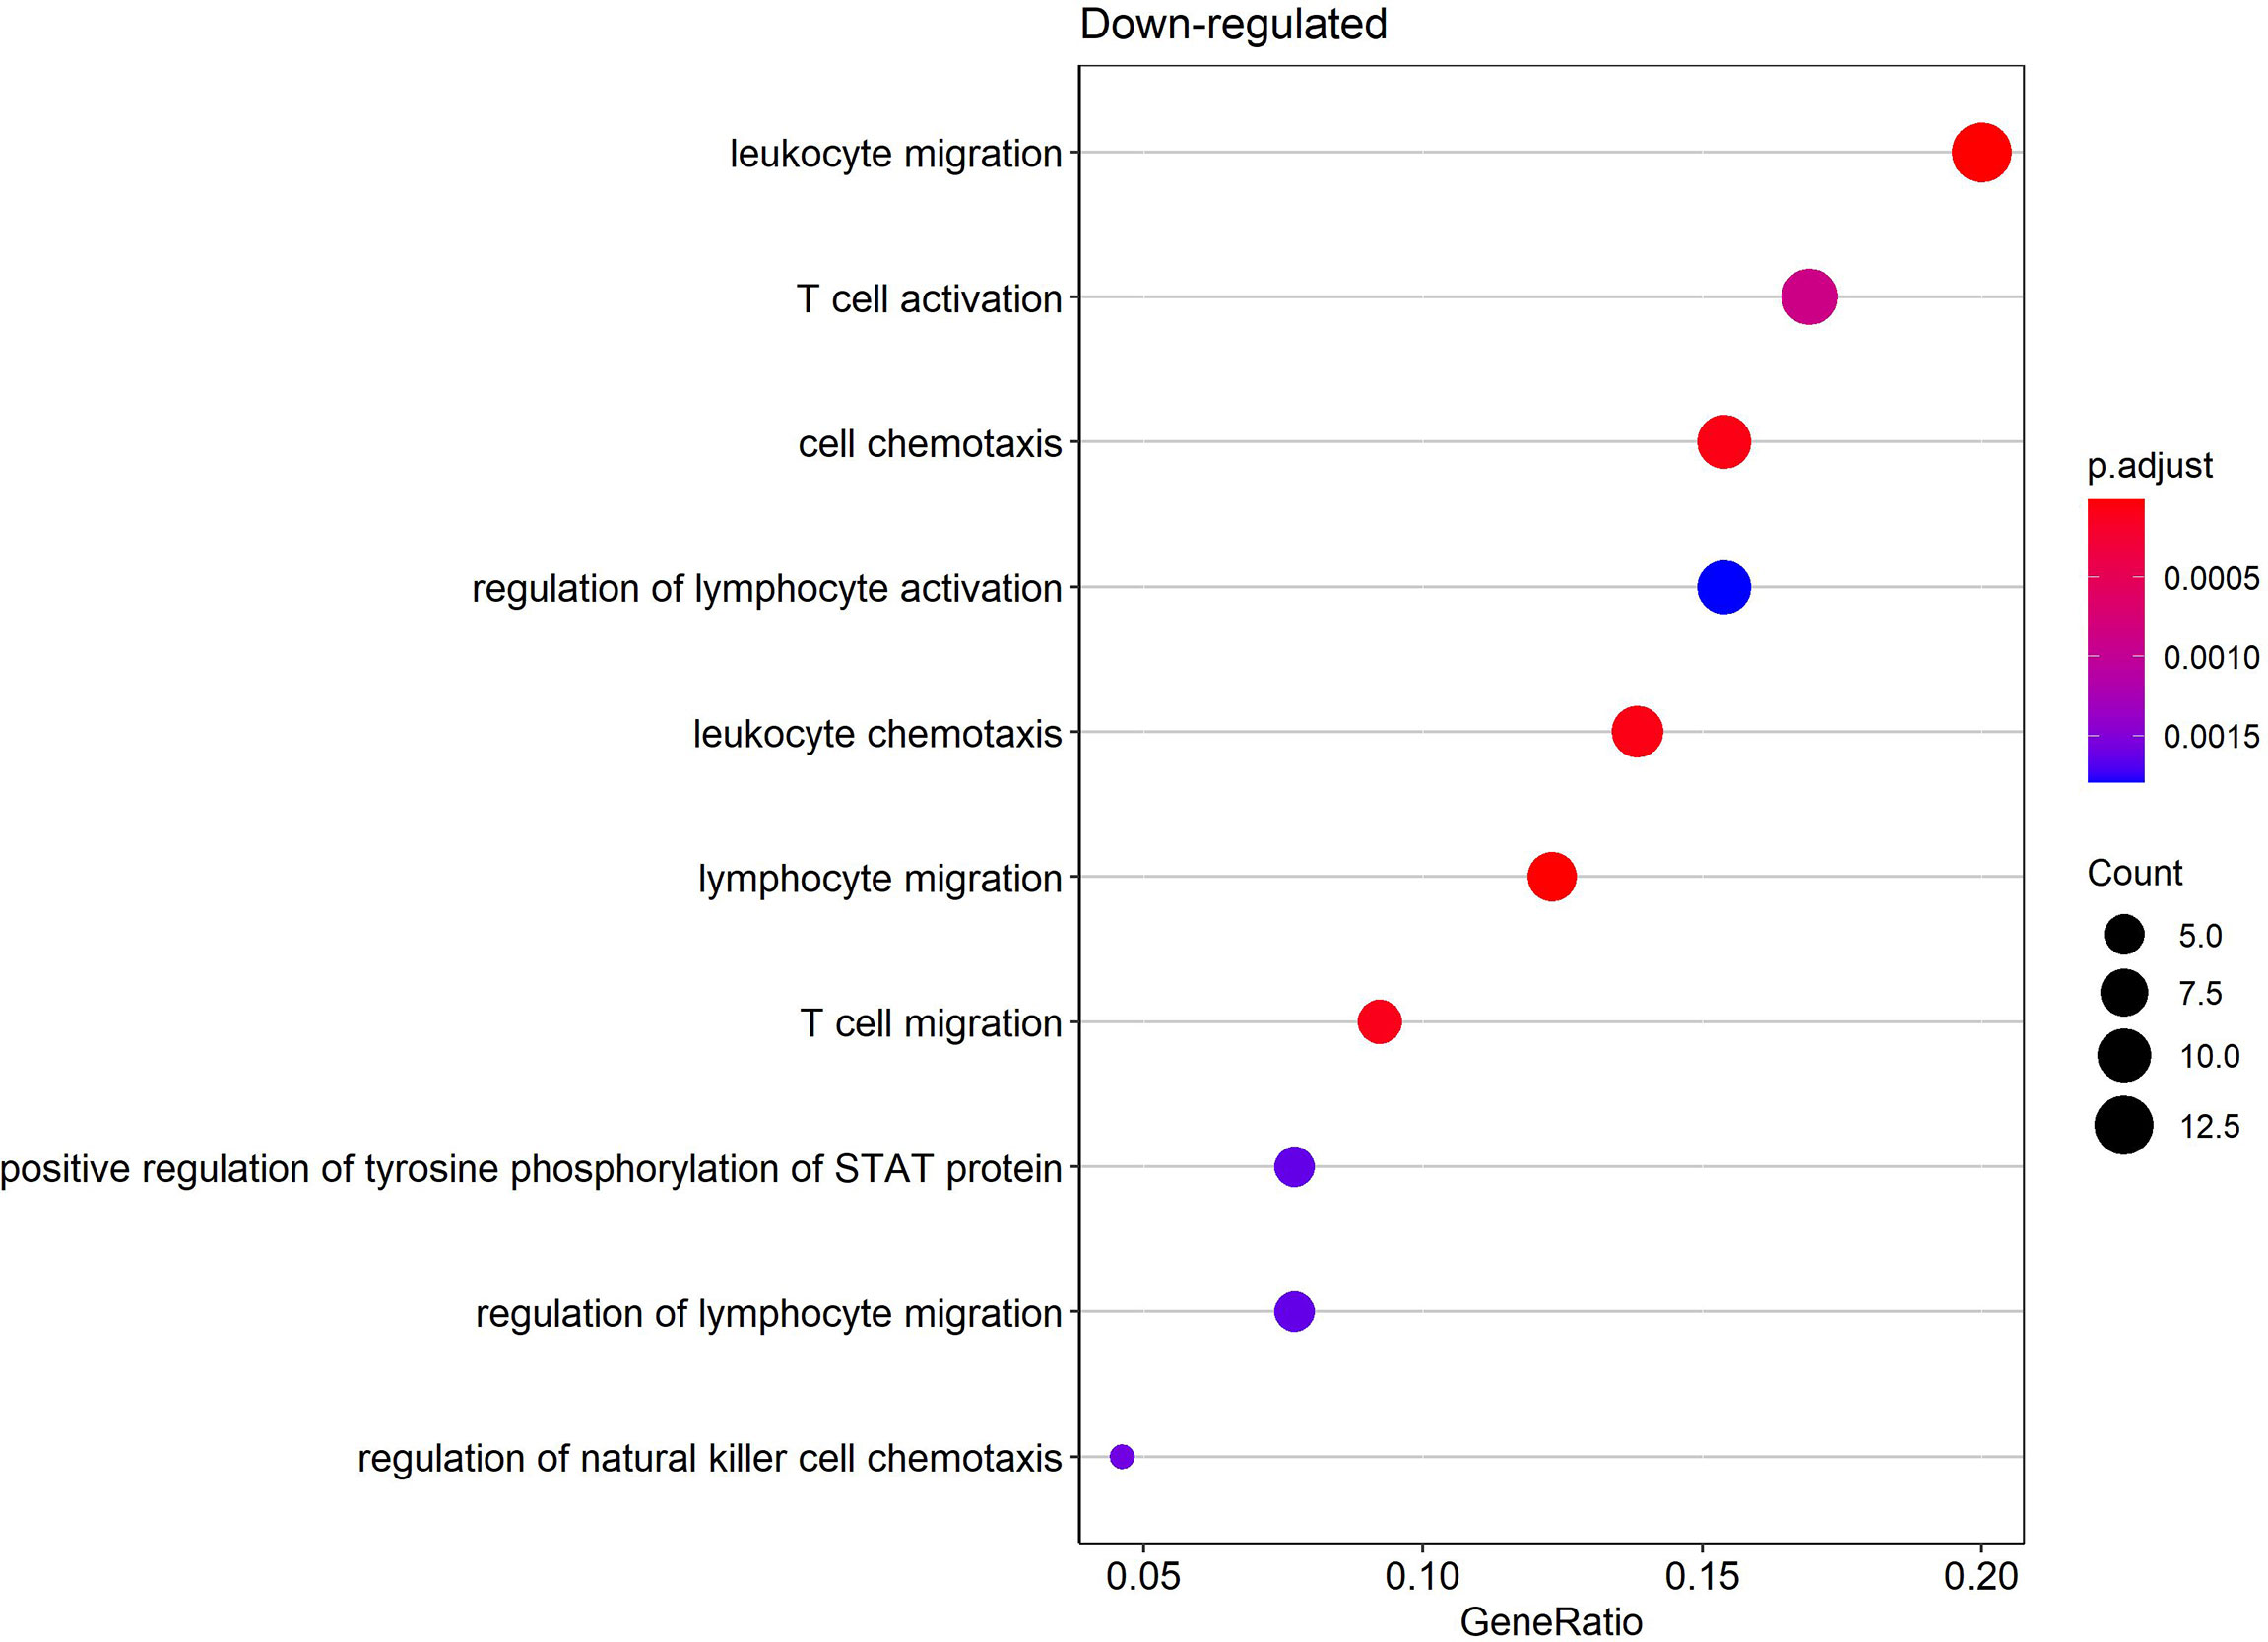
Figure 5 Enriched biological processes by gene ontology (GO) enrichment analysis of downregulated pdaDEGs in latently HIV-1 infected primary CD4+ T cells. Depicted are overrepresented biological processes of downregulated pdaDEGs shown by the gene count in circle size and color coded by adjusted p-value.
Discussion
Current single-cell RNAseq studies of latently HIV-1 infected primary CD4+ T cells revealed a high degree of heterogeneity between individual latently HIV-1-infected cells, suggesting that HIV-1 latency can persist in very different host cell environments (12, 15, 16). Host cell heterogeneity may explain, at least in part, the differential responsiveness of latently infected primary CD4+ T cells to reactivation. Identifying genes that drive and maintain HIV-1 latency is important to improve current curative strategies. In this study, we performed a pooled data-analysis of transcriptome datasets of latently- and reactivated HIV-1 infected cells from 5 in vitro primary CD4+ T cell models of HIV-1 latency and 2 ex vivo studies of reactivated HIV-1 infected primary CD4+ T cells from HIV-1 infected individuals. Although the experimental settings are unique for each in vitro primary CD4+ T cell models of HIV-1 latency and ex vivo studies of reactivated HIV-1 infected primary CD4+ T cells from HIV-1 infected individuals, regarding 1. how long cells are maintained in culture prior to infection 2. how CD4+ T cell survival is ensured, 3. how reactivation was achieved and 4. using replication competent or incompetent HIV-1, we observed pdaDEGs across in vitro primary CD4+ T cell models of HIV-1 latency and ex vivo studies of reactivated HIV-1 infected primary CD4+ T cells from HIV-1 infected individuals. In latently- and reactivated HIV-1 infected primary CD4+ T cells we could observe five co-occurring pdaDEGs, one of which MSRB2 was differentially expressed. We observed that natural ligands and coreceptors were predominantly downregulated in latently HIV-1 infected primary CD4+ T cells, whereas genes associated with apoptosis, cell cycle and HLA class II were upregulated in reactivated HIV-1 infected CD4+ T cells.
Latently HIV-1 infected primary CD4+ T cells are rare and to this day no unique markers for their identification is known (46, 47). There are numerous RNAseq/microarrays datasets of HIV-1 infected primary CD4+ T cells, which either apply strict fold change >2 and FDR <0.05 filters or select a single candidate to propose as newly discovered HIV-1 latency marker, yet the respective results have rarely been confirmed by others. In this study we combined RNAseq datasets from published primary CD4+ T cell models of HIV-1 latency and ex vivo studies of reactivated HIV-1 infected primary CD4+ T cells from HIV-1 infected individuals, to get a more comprehensive picture. By considering the expression patterns of different datasets, we can identify genes with small effects that would otherwise be missed. Furthermore, we argue that if genes, even if the effect is small, are similarly differentially expressed in different datasets, the effect of HIV-1 infection on dysregulation is even more likely to be.
Among the 130 pdaDEGs in latently- and 117 pdaDEGs in reactivated HIV-1 infected primary CD4+ T cells we identified 5 pdaDEGs which co-occurred in both groups. One of which, MSRB2, was differentially expressed, namely upregulated in latently HIV-1 infected primary CD4+ T cells and downregulated in reactivated HIV-1 infected primary CD4+ T cells. To date, there is no HIV-1 interaction with MSRB2 reported. MSRB2 has been associated with diabetes mellitus (48), Parkinsons’ disease (48) and Alzheimer (49) and MSRB2 has shown to reside in the mitochondrial matrix (50–52). In Parkinson’s disease it was observed to be necessary for induction of mitophagy, a process in which damaged, toxic mitochondria are removed to protect a cell from apoptosis (53, 54). In the absence of MSRB2 it was observed that mitochondria undergo oxidative stress, leading to reduced mitophagy (48). Other studies also made similar observations: MSRB2 protects cell damage from oxidative stress in various cells such as lymphoblast and leukemia cells (55, 56). Therefore, upregulation of MSRB2 in latently HIV-1 infected primary CD4+ T cells could inhibit apoptosis, while downregulation in reactivated HIV-1 infected genes leads to apoptosis due to the cytotoxic response of LRA or infectious virus particle release. However, this process has not yet been documented in CD4+ T cells and therefore needs further investigation.
Many identified pdaDEGs in latently HIV-1 infected primary CD4+ T cells have been reported as bona fide markers for antiviral defense and apoptosis, such as IFN related genes or genes associated with the p53 pathway. In reactivated HIV-1 infected primary CD4+ T cells we observed upregulation of genes associated with apoptosis, cell cycle and HLA class II, particularly in association with the p53 pathway and the PI3K/Akt pathway. The observed genes can be used in future primary CD4+ T cell models of HIV-1 latency to clarify the functional and physiological significance in primary CD4+ T cells.
Different LRA were used for reactivation in the in vitro primary CD4+ T cell models of HIV-1 latency compared to the ex vivo studies of reactivated HIV-1 infected primary CD4+ T cells from HIV-1 infected individuals, nevertheless we could observe genes to be similarly differentially expressed across studies. However, the impact of differences in clonality of the reservoir exposed to different antiretroviral drugs and LRA treatments could bias transcriptome profiles. We have tried not to become too speculative when comparing latently- and reactivated HIV-1 infected primary CD4+ T cells, and have therefore selected genes and pathways already known to play a role in the life cycle and pathogenesis of HIV-1 to get as close as possible to biological significance. We believe that our pooled data-analysis can help estimate the relative contribution of some key genes and pathways of HIV-1 latency and reactivation.
Concluding remarks and future perspective
To summarize, our pooled data-analysis of different primary CD4+ T cell models of HIV-1 latency gave insights into transcriptome profile signatures in latently- and reactivated HIV-1 infected primary CD4+ T cells. We identified 130 pdaDEGs in latently- and 117 pdaDEGs in reactivated HIV-1 infected cells from 5 in vitro primary CD4+ T cell models of HIV-1 latency and 2 ex vivo studies of reactivated HIV-1 infected primary CD4+ T cells. We observed that in pdaDEGs natural ligands and coreceptors were predominantly downregulated in latently HIV-1 infected primary CD4+ T cells, whereas pdaDEGs associated with apoptosis, cell cycle and HLA class II were upregulated in reactivated HIV-1 infected primary CD4+ T cells. In addition, we observed 5 pdaDEGs that co-occurred in latently- and reactivated HIV-1 infected primary CD4+ T cells, one of which, MSRB2, was found to be differentially expressed between latently- and reactivated HIV-1 infected primary CD4+ T cells. This pooled data-analysis is unique in that it analyzes differentially expressed genes of latently- and reactivated HIV-1 infected cells from different in vitro primary CD4+ T cell models of HIV-1 latency and ex vivo studies of reactivated HIV-1 infected primary CD4+ T cells from HIV-1 infected individuals, providing insight into differentially expressed genes that might contribute to HIV-1 latency.
Material and methods
Study selection for the pooled data-analysis
On the 1st of March 2019 we searched for in vitro primary CD4+ T cell models of HIV-1 latency on Scopus database. We searched for ((TITLE (HIV OR HIV-1)) AND (TITLE (latent OR latently OR latency)) AND TITLE-ABS-KEY ((transcriptome OR transcriptomics OR “gene expression”))) AND (ALL (“primary cell”)) AND (ALL (“in vitro model” OR “cell model”)) AND (LIMIT-TO (DOCTYPE, “ar”)). Each study was independently reviewed and included based on the criterion that each study contained transcriptome data and its methodology derived from an in vitro primary CD4+ T cell model of HIV-1 latency. In addition, we included two ex vivo studies of reactivated HIV-1 infected primary CD4+ T cells from HIV-1 infected individuals and our own primary CD4+ T cell model of HIV-1 latency.
Primary CD4+ T cells isolation of own model
Detailed description of isolation, transfection and RNAseq data preparation of primary CD4+ T cells of own model is given in Supplementary Material.
RNAseq data collection
Raw read counts of Bradley et al. (8), White et al. (11) and Cohn et al. (12). were downloaded from Gene Expression Omnibus (GEO) Database (57). Differentially expressed genes (DEGs) as fold-change were obtained from Kulpa et al. (13) through personal communication. DEGs for Mohammadi et al. (10) were downloaded from the open access interactive web resource http://litchi.labtelenti.org.
Differential expression testing
All analyses were performed using R software version 4.0.5 (58). We identified DEGs in data sets where raw read counts were available [(8, 10, 12, 13) and our data] using the Bioconductor package EdgeR (59, 60) in a study-by-study basis. Hereby, ambiguous and low-quality reads were removed and genes with low read counts (more than 10 reads in 70% of replicates per group were required) were filtered out. Read counts were normalized via trimmed mean of M values (TMM) method. Common dispersion was estimated across all genes by maximizing the negative binomial conditional common likelihood, and tagwise dispersion by an empirical Bayes method based on weighted conditional maximum likelihood. Differential expression testing was performed assuming negative-binomially distributed read counts and computing genewise exact tests for differences in the means between groups. Eventually, fold changes were log2-transformed and p-values adjusted for false discovery rate (FDR) by the Benjamini-Hochberg method.
From Kulpa et al. (13) we selected the RNAseq data for the TCM cell subset, choosing the LRA Bryostatin, as we have seen the least impact on cell viability compared to the other LRAs IL-15 and PMA. As raw read counts were not available and fold changes were given per transcript ID, we filtered for the transcript ID per gene name with the highest CPM. FDR values were estimated using the available p-values with the Bioconductor package qvalue (61).
The microarray data from Iglesias et al. (9) was available only as fold change per gene name, lacking p-values, FDR or raw signals. White et al. (11) previously worked with this dataset and kindly provided us with a dataset comprised of 1297 genes, selected by filtering for adjusted p-value smaller than 0.05.
Gene annotation and data analysis
Datasets were combined and genes annotations obtained and unified across primary CD4+ T cell models of HIV-1 latency using the Bioconductor package bioMart (62, 63) to download annotation Ensembl data (64). HGNC symbol duplications were checked on https://www.genenames.org/tools/multi-symbol-checker/. Known HIV interactions per gene were retrieved from DAVID (Database for Annotation, Visualization and Integrated Discovery) (65, 66) using the HGNC gene symbol and Entrez gene IDs. Functional pathways of genes were obtained from Reactome (67). We calculated the mean standardized expression of genes across all primary CD4+ T cell models of HIV-1 latency by averaging over fold changes standardized by study-specific standard error. To account for the differences in the datasets, we refrained from identifying the genes of interest by |fold change| > 2 and FDR < 0.05, but employed a custom filtering method. Hereby a filter score is calculated for every gene based on FDR being smaller than 0.1 and the absolute fold change being greater than the study-specific 50% absolute fold change quantile. Downregulated genes obtain a negative score. Meeting these conditions, a gene can get a score of maximally 2 per study, i.e., maximum score of 8 for latently and 10 for reactivated HIV-1 infected primary CD4+ T cells. For each gene the scores are summed up across studies and normalized to 1. Genes of interest were then identified by having a score ≥ 0.5.
GO enrichment analysis
GO enrichment analysis of genes of interest were performed using the Bioconductor package clusterProfiler (68) using the org.Hs.eg.db Bioconductor annotation package (69) with default settings, apart from setting the minimal size of genes to 3 and choosing a more stringent q-value cutoff of 0.05. Data management and wrangling, as well as visualizations were performed using the R package tidyverse (70). With the parameters set, we could not detect any upregulated biological processes in latently HIV-1 infected CD4+ T cells from 4 in vitro primary CD4+ T cell models of HIV-1 latency.
Data availability statement
Publicly available datasets were analyzed in this study. This data can be found here (GEO accession number): Bradley et al: SSAMN08685499, SAMN08685500, SAMN08685501, SAMN08685502. White et al: GSE81810; Iglesias-Ussel et al: GSM996242, GSM996243, GSM996244, GSM996245; Mohammadi et al.: http://litchi.labtelenti.org; Kulpa et al. were received upon request.; Cohn et al.: GSM2801437. Inderbitzin et. al. data is available on the European Nucleotide Archive (ENA) of the EMBL’s European Bioinformatics Institute (EMBL-EBI) - Project accession PRJEB53230.
Author contributions
AI designed the study, performed the literature search, cultured the cells, isolated the RNA for the RNAseq analysis. LO cleaned and performed analysis of the RNAseq datasets. TL downloaded, cleaned and performed analyses of the data sets. PR supported the experiments and analysis of the data. KM supported the analysis of the data, and edited the manuscript. All authors approved the manuscript.
Funding
This study was funded by the Swiss National Science Foundation, grant No. 310030_141067 and 310030_204404 to KM and from the Forschungskredit Candoc, grant No. FK-19-032 to AI. The funders had no role in study design, data collection and analysis, decision to publish, or preparation of the manuscript.
Acknowledgments
We want to thank Yik Lim Kok and Roger Kouyos for the fruitful discussion, Catharine Aquino and Andreia Cabral de Gouvea from the Functional Genomics Center Zurich for the RNAseq service.
Conflict of interest
The authors declare that the research was conducted in the absence of any commercial or financial relationships that could be construed as a potential conflict of interest.
Publisher’s note
All claims expressed in this article are solely those of the authors and do not necessarily represent those of their affiliated organizations, or those of the publisher, the editors and the reviewers. Any product that may be evaluated in this article, or claim that may be made by its manufacturer, is not guaranteed or endorsed by the publisher.
Supplementary material
The Supplementary Material for this article can be found online at: https://www.frontiersin.org/articles/10.3389/fimmu.2022.915805/full#supplementary-material
References
1. Vanhamel J, Bruggemans A, Debyser Z. Establishment of latent HIV-1 reservoirs: What do we really know? J Virus Eradication (2019) 5(1):3–9. doi: 10.1016/S2055-6640(20)30275-2
2. Finzi D, Hermankova M, Pierson T, Carruth LM, Buck C, Chaisson RE, et al. Identification of a reservoir for HIV-1 in patients on highly active antiretroviral therapy. Science (1997) 278(5341):1295–300. doi: 10.1126/science.278.5341.1295
3. Wong JK, Hezareh M, Gunthard HF, Havlir DV, Ignacio CC, Spina CA, et al. Recovery of replication-competent HIV despite prolonged suppression of plasma viremia. Science (1997) 278(5341):1291–5. doi: 10.1126/science.278.5341.1291
4. Chun TW, Finzi D, Margolick J, Chadwick K, Schwartz D, Siliciano RF. In vivo fate of HIV-1-Infected T cells: Quantitative analysis of the transition to stable latency. Nat Med (1995) 1(12):1284–90. doi: 10.1038/nm1295-1284
5. Stellbrink HJ, van Lunzen J, Hufert FT, Froschle G, Wolf-Vorbeck G, Zollner B, et al. Asymptomatic HIV infection is characterized by rapid turnover of HIV rna in plasma and lymph nodes but not of latently infected lymph-node CD4+ T cells. AIDS (1997) 11(9):1103–10. doi: 10.1097/00002030-199709000-00004
6. Verdikt R, Hernalsteens O, Van Lint C. Epigenetic mechanisms of HIV-1 persistence. Vaccines (2021) 9(5):514. doi: 10.3390/vaccines9050514
7. Bruel T, Schwartz O. Markers of the HIV-1 reservoir: Facts and controversies. Curr Opin HIV AIDS (2018) 13(5):383–8. doi: 10.1097/coh.0000000000000482
8. Bradley T, Ferrari G, Haynes BF, Margolis DM, Browne EP. Single-cell analysis of quiescent HIV infection reveals host transcriptional profiles that regulate proviral latency. Cell Rep (2018) 25(1):107–17.e3. doi: 10.1016/j.celrep.2018.09.020
9. Iglesias-Ussel M, Vandergeeten C, Marchionni L, Chomont N, Romerio F. High levels of CD2 expression identify HIV-1 latently infected resting memory CD4+ T cells in virally suppressed subjects. J Virol (2013) 87(16):9148–58. doi: 10.1128/jvi.01297-13
10. Mohammadi P, di Iulio J, Munoz M, Martinez R, Bartha I, Cavassini M, et al. Dynamics of HIV latency and reactivation in a primary CD4+ T cell model. PLoS Pathog (2014) 10(5):e1004156. doi: 10.1371/journal.ppat.1004156
11. White CH, Moesker B, Beliakova-Bethell N, Martins LJ, Spina CA, Margolis DM, et al. Transcriptomic analysis implicates the p53 signaling pathway in the establishment of HIV-1 latency in central memory CD4 T cells in an in vitro model. PLoS Pathog (2016) 12(11):e1006026. doi: 10.1371/journal.ppat.1006026
12. Cohn LB, da Silva IT, Valieris R, Huang AS, Lorenzi JCC, Cohen YZ, et al. Clonal CD4(+) T cells in the HIV-1 latent reservoir display a distinct gene profile upon reactivation. Nat Med (2018) 24(5):604–9. doi: 10.1038/s41591-018-0017-7
13. Kulpa DA, Talla A, Brehm JH, Ribeiro SP, Yuan S, Bebin-Blackwell AG, et al. Differentiation into an effector memory phenotype potentiates HIV-1 latency reversal in Cd4(+) T cells. J Virol (2019) 93(24):e00969–19. doi: 10.1128/jvi.00969-19
14. Inderbitzin A, Loosli T, Opitz L, Rusert P, Metzner KJ. Transcriptomic analysis showed upregulation of genes associated with p53- and Pi3k/Akt pathway in primary CD4+ T cells after CRISPR/Cas9-mediated insertion of replication-competent HIV-1 into three target sites (Unpublished data), project accession PRJEB53230. EMBL’s Eur Bioinf Institute (EMBL-EBI) (2022).
15. Matsuda Y, Kobayashi-Ishihara M, Fujikawa D, Ishida T, Watanabe T, Yamagishi M. Epigenetic heterogeneity in HIV-1 latency establishment. Sci Rep (2015) 5:7701. doi: 10.1038/srep07701
16. Golumbeanu M, Cristinelli S, Rato S, Munoz M, Cavassini M, Beerenwinkel N, et al. Single-cell rna-seq reveals transcriptional heterogeneity in latent and reactivated HIV-infected cells. Cell Rep (2018) 23(4):942–50. doi: 10.1016/j.celrep.2018.03.102
17. Kim BO, Liu Y, Zhou BY, He JJ. Induction of C chemokine XCL1 (lymphotactin/single C motif-1 alpha/activation-induced, T cell-derived and chemokine-related cytokine) expression by HIV-1 Tat protein. J Immunol (2004) 172(3):1888–95. doi: 10.4049/jimmunol.172.3.1888
18. Secchi M, Grampa V, Vangelista L. Rational CCL5 mutagenesis integration in a lactobacilli platform generates extremely potent HIV-1 blockers. Sci Rep (2018) 8(1):1890. doi: 10.1038/s41598-018-20300-9
19. Vangelista L, Secchi M, Lusso P. Rational design of novel HIV-1 entry inhibitors by Rantes engineering. Vaccine (2008) 26(24):3008–15. doi: 10.1016/j.vaccine.2007.12.023
20. Hartley O, Offord RE. Engineering chemokines to develop optimized HIV inhibitors. Curr Protein Pept Sci (2005) 6(3):207–19. doi: 10.2174/1389203054065400
21. Cocchi F, DeVico AL, Garzino-Demo A, Arya SK, Gallo RC, Lusso P. Identification of RANTES, MIP-1 alpha, and MIP-1 beta as the major HIV-suppressive factors produced by CD8+ T cells. Science (1995) 270(5243):1811–5. doi: 10.1126/science.270.5243.1811
22. Limou S, Coulonges C, Herbeck JT, van Manen D, An P, Le Clerc S, et al. Multiple-cohort genetic association study reveals CXCR6 as a new chemokine receptor involved in long-term nonprogression to aids. J Infect Dis (2010) 202(6):908–15. doi: 10.1086/655782
23. Shan L, Deng K, Gao H, Xing S, Capoferri AA, Durand CM, et al. Transcriptional reprogramming during effector-to-Memory transition renders CD4(+) T cells permissive for latent HIV-1 infection. Immunity (2017) 47(4):766–75.e3. doi: 10.1016/j.immuni.2017.09.014
24. Reuse S, Calao M, Kabeya K, Guiguen A, Gatot JS, Quivy V, et al. Synergistic activation of HIV-1 expression by deacetylase inhibitors and prostratin: Implications for treatment of latent infection. PLoS One (2009) 4(6):e6093. doi: 10.1371/journal.pone.0006093
25. Darcis G, Kula A, Bouchat S, Fujinaga K, Corazza F, Ait-Ammar A, et al. An in-depth comparison of latency-reversing agent combinations in various in vitro and ex vivo HIV-1 latency models identified Bryostatin-1+JQ1 and Ingenol-B+JQ1 to potently reactivate viral gene expression. PLoS Pathog (2015) 11(7):e1005063. doi: 10.1371/journal.ppat.1005063
26. Bouchat S, Delacourt N, Kula A, Darcis G, Van Driessche B, Corazza F, et al. Sequential treatment with 5-Aza-2’-Deoxycytidine and deacetylase inhibitors reactivates HIV-1. EMBO Mol Med (2016) 8(2):117–38. doi: 10.15252/emmm.201505557
27. Bouchat S, Gatot JS, Kabeya K, Cardona C, Colin L, Herbein G, et al. Histone methyltransferase inhibitors induce HIV-1 recovery in resting CD4(+) T cells from HIV-1-Infected haart-treated patients. Aids (2012) 26(12):1473–82. doi: 10.1097/QAD.0b013e32835535f5
28. Jiang G, Mendes EA, Kaiser P, Wong DP, Tang Y, Cai I, et al. Synergistic reactivation of latent HIV expression by ingenol-3-Angelate, Pep005, targeted nf-kb signaling in combination with JQ1 induced p-tefb activation. PLoS Pathog (2015) 11(7):e1005066. doi: 10.1371/journal.ppat.1005066
29. Laird GM, Bullen CK, Rosenbloom DI, Martin AR, Hill AL, Durand CM, et al. Ex vivo analysis identifies effective HIV-1 latency-reversing drug combinations. J Clin Invest (2015) 125(5):1901–12. doi: 10.1172/jci80142
30. Pache L, Dutra MS, Spivak AM, Marlett JM, Murry JP, Hwang Y, et al. BIRC2/cIAP1 is a negative regulator of HIV-1 transcription and can be targeted by smac mimetics to promote reversal of viral latency. Cell Host Microbe (2015) 18(3):345–53. doi: 10.1016/j.chom.2015.08.009
31. Tripathy MK, McManamy ME, Burch BD, Archin NM, Margolis DM. H3k27 demethylation at the proviral promoter sensitizes latent HIV to the effects of vorinostat in ex vivo cultures of resting CD4+ T cells. J Virol (2015) 89(16):8392–405. doi: 10.1128/jvi.00572-15
32. Abdel-Mohsen M, Chavez L, Tandon R, Chew GM, Deng X, Danesh A, et al. Human Galectin-9 is a potent mediator of HIV transcription and reactivation. PloS Pathog (2016) 12(6):e1005677. doi: 10.1371/journal.ppat.1005677
33. Chen HC, Martinez JP, Zorita E, Meyerhans A, Filion GJ. Position effects influence HIV latency reversal. Nat Struct Mol Biol (2017) 24(1):47–54. doi: 10.1038/nsmb.3328
34. Rochat MA, ScHLAepfer E, Speck RF. Promising role of toll-like receptor 8 agonist in concert with prostratin for activation of silent HIV. J Virol (2017) 91(4):e0208416–16. doi: 10.1128/jvi.02084-16
35. Das B, Dobrowolski C, Luttge B, Valadkhan S, Chomont N, Johnston R, et al. Estrogen receptor-1 is a key regulator of HIV-1 latency that imparts gender-specific restrictions on the latent reservoir. Proc Natl Acad Sci U.S.A. (2018) 115(33):E7795–e804. doi: 10.1073/pnas.1803468115
36. Liao X, Song L, Zhang L, Wang H, Tong Q, Xu J, et al. LAMP3 regulates hepatic lipid metabolism through activating PI3K/Akt pathway. Mol Cell Endocrinol (2018) 470:160–7. doi: 10.1016/j.mce.2017.10.010
37. Achord AP, Lewis RE, Brackin MN, Cruse JM. HLA-DQB1 markers associated with human immunodeficiency virus type I disease progression. Pathobiology (1997) 65(4):210–5. doi: 10.1159/000164125
38. Liu M, Guo S, Hibbert JM, Jain V, Singh N, Wilson NO, et al. CXCL10/IP-10 in infectious diseases pathogenesis and potential therapeutic implications. Cytokine Growth factor Rev (2011) 22(3):121–30. doi: 10.1016/j.cytogfr.2011.06.001
39. Yin X, Wang Z, Wu T, Ma M, Zhang Z, Chu Z, et al. The combination of CXCL9, CXCL10 and CXCL11 levels during primary HIV infection predicts HIV disease progression. J Transl Med (2019) 17(1):417. doi: 10.1186/s12967-019-02172-3
40. Bannai S. Exchange of cystine and glutamate across plasma membrane of human fibroblasts. J Biol Chem (1986) 261(5):2256–63. doi: 10.1016/S0021-9258(17)35926-4
41. Sato H, Tamba M, Ishii T, Bannai S. Cloning and expression of a plasma membrane Cystine/Glutamate exchange transporter composed of two distinct proteins*. J Biol Chem (1999) 274(17):11455–8. doi: 10.1074/jbc.274.17.11455
42. Sasaki H, Sato H, Kuriyama-Matsumura K, Sato K, Maebara K, Wang H, et al. Electrophile response element-mediated induction of the Cystine/Glutamate exchange transporter gene expression*. J Biol Chem (2002) 277(47):44765–71. doi: 10.1074/jbc.M208704200
43. Habib E, Linher-Melville K, Lin H-X, Singh G. Expression of xCT and activity of system xc− are regulated by NRF2 in human breast cancer cells in response to oxidative stress. Redox Biol (2015) 5:33–42. doi: 10.1016/j.redox.2015.03.003
44. Rabinowitz J, Sharifi HJ, Martin H, Marchese A, Robek M, Shi B, et al. xCT/SLC7A11 antiporter function inhibits HIV-1 infection. Virology (2021) 556:149–60. doi: 10.1016/j.virol.2021.01.008
45. Sauter D, Kirchhoff F. Natural hosts of SIV, chapter 4 - properties of human and simian immunodeficiency viruses. Ansari AA, Silvestri G, editors. Amsterdam: Elsevier (2014) p. 69–84 p.
46. Crooks AM, Bateson R, Cope AB, Dahl NP, Griggs MK, Kuruc JD, et al. Precise quantitation of the latent HIV-1 reservoir: Implications for eradication strategies. J Infect Dis (2015) 212(9):1361–5. doi: 10.1093/infdis/jiv218
47. Siliciano JD, Kajdas J, Finzi D, Quinn TC, Chadwick K, Margolick JB, et al. Long-term follow-up studies confirm the stability of the latent reservoir for HIV-1 in resting CD4+ T cells. Nat Med (2003) 9(6):727–8. doi: 10.1038/nm880
48. Lee SH, Lee S, Du J, Jain K, Ding M, Kadado AJ, et al. Mitochondrial MSRB2 serves as a switch and transducer for mitophagy. EMBO Mol Med (2019) 11(8):e10409–e. doi: 10.15252/emmm.201910409
49. Xiang XJ, Song L, Deng XJ, Tang Y, Min Z, Luo B, et al. Mitochondrial methionine sulfoxide reductase B2 links oxidative stress to Alzheimer's disease-like pathology. Exp Neurol (2019) 318:145–56. doi: 10.1016/j.expneurol.2019.05.006
50. Pascual I, Larrayoz IM, Campos MM, Rodriguez IR. Methionine sulfoxide reductase B2 is highly expressed in the retina and protects retinal pigmented epithelium cells from oxidative damage. Exp Eye Res (2010) 90(3):420–8. doi: 10.1016/j.exer.2009.12.003
51. Ugarte N, Petropoulos I, Friguet B. Oxidized mitochondrial protein degradation and repair in aging and oxidative stress. Antioxid Redox Signal (2010) 13(4):539–49. doi: 10.1089/ars.2009.2998
52. Fischer F, Hamann A, Osiewacz HD. Mitochondrial quality control: An integrated network of pathways. Trends Biochem Sci (2012) 37(7):284–92. doi: 10.1016/j.tibs.2012.02.004
53. Palikaras K, Lionaki E, Tavernarakis N. Coordination of mitophagy and mitochondrial biogenesis during ageing in c. Elegans. Nat (2015) 521(7553):525–8. doi: 10.1038/nature14300
54. García-Prat L, Martínez-Vicente M, Perdiguero E, Ortet L, Rodríguez-Ubreva J, Rebollo E, et al. Autophagy maintains stemness by preventing senescence. Nature (2016) 529(7584):37–42. doi: 10.1038/nature16187
55. Cabreiro F, Picot CR, Perichon M, Castel J, Friguet B, Petropoulos I. Overexpression of mitochondrial methionine sulfoxide reductase B2 protects leukemia cells from oxidative stress-induced cell death and protein damage. J Biol Chem (2008) 283(24):16673–81. doi: 10.1074/jbc.M708580200
56. Cabreiro F, Picot CR, Perichon M, Friguet B, Petropoulos I. Overexpression of methionine sulfoxide reductases A and B2 protects MOLT-4 cells against zinc-induced oxidative stress. Antioxid Redox Signal (2009) 11(2):215–25. doi: 10.1089/ars.2008.2102
57. Clough E, Barrett T. The gene expression omnibus database. Methods Mol Biol (Clifton NJ) (2016) 1418:93–110. doi: 10.1007/978-1-4939-3578-9_5
58. Core Team R R. A language and environment for statistical computing. In: R foundation for statistical computing. Vienna, Austria (2021). Available at: https://www.R-project.org/.
59. Robinson MD, McCarthy DJ, Smyth GK. Edger: A bioconductor package for differential expression analysis of digital gene expression data. Bioinformatics (2010) 26(1):139–40. doi: 10.1093/bioinformatics/btp616
60. McCarthy DJ, Chen Y, Smyth GK. Differential expression analysis of multifactor RNA-seq experiments with respect to biological variation. Nucleic Acids Res (2012) 40(10):4288–97. doi: 10.1093/nar/gks042
61. Storey JD, Bass JB, Dabney D, Robinson D. Qvalue: Q-value estimation for false discovery rate control. (2020). Available at: https://www.ncbi.nlm.nih.gov/pmc/articles/PMC7132874/
62. Durinck S, Spellman PT, Birney E, Huber W. Mapping identifiers for the integration of genomic datasets with the R/Bioconductor package biomart. Nat Protoc (2009) 4(8):1184–91. doi: 10.1038/nprot.2009.97
63. Durinck S, Moreau Y, Kasprzyk A, Davis S, De Moor B, Brazma A, et al. Biomart and bioconductor: A powerful link between biological databases and microarray data analysis. Bioinformatics (2005) 21(16):3439–40. doi: 10.1093/bioinformatics/bti525
64. Howe KL, Achuthan P, Allen J, Allen J, Alvarez-Jarreta J, Amode MR, et al. Ensembl 2021. Nucleic Acids Res (2021) 49(D1):D884–D91. doi: 10.1093/nar/gkaa942
65. Huang da W, Sherman BT, Lempicki RA. Systematic and integrative analysis of Large gene lists using David bioinformatics resources. Nat Protoc (2009) 4(1):44–57. doi: 10.1038/nprot.2008.211
66. Huang DW, Sherman BT, Lempicki RA. Bioinformatics enrichment tools: Paths toward the comprehensive functional analysis of Large gene lists. Nucleic Acids Res (2009) 37(1):1–13. doi: 10.1093/nar/gkn923
67. Sidiropoulos K, Viteri G, Sevilla C, Jupe S, Webber M, Orlic-Milacic M, et al. Reactome enhanced pathway visualization. Bioinformatics (2017) 33(21):3461–7. doi: 10.1093/bioinformatics/btx441
68. Yu G, Wang LG, Han Y, He QY. Clusterprofiler: An r package for comparing biological themes among gene clusters. Omics (2012) 16(5):284–7. doi: 10.1089/omi.2011.0118
Keywords: latently HIV-1 infected primary CD4+ T cells, reactivated HIV-1 infected primary CD4+ T cells, HIV-1 latency reversal agents, transcriptome profile, primary CD4+ T cell models of HIV-1 latency, pooled data-analysis, pooled data-analysis differentially expressed genes (pdaDEGs)
Citation: Inderbitzin A, Loosli T, Opitz L, Rusert P and Metzner KJ (2022) Transcriptome profiles of latently- and reactivated HIV-1 infected primary CD4+ T cells: A pooled data-analysis. Front. Immunol. 13:915805. doi: 10.3389/fimmu.2022.915805
Received: 08 April 2022; Accepted: 13 July 2022;
Published: 26 August 2022.
Edited by:
Constantinos Petrovas, Centre Hospitalier Universitaire Vaudois (CHUV), SwitzerlandReviewed by:
Yvonne Mueller, Erasmus Medical Center, NetherlandsCecilia Graziosi, Centre Hospitalier Universitaire Vaudois (CHUV), Switzerland
Copyright © 2022 Inderbitzin, Loosli, Opitz, Rusert and Metzner. This is an open-access article distributed under the terms of the Creative Commons Attribution License (CC BY). The use, distribution or reproduction in other forums is permitted, provided the original author(s) and the copyright owner(s) are credited and that the original publication in this journal is cited, in accordance with accepted academic practice. No use, distribution or reproduction is permitted which does not comply with these terms.
*Correspondence: Karin J. Metzner, Karin.Metzner@usz.ch
†These authors have contributed equally to this work